
TORNTPHARM (Torrent Pharmaceuticals Ltd.) — 06-Mar-2026 Technical Stance: Neutral Confluence, Mixed Rank Leadership
Torrent Pharmaceuticals Ltd. (TORNTPHARM) shows a non-dominant momentum profile on 06-Mar-2026: mid-horizon KGNAI ranks lean constructive while shorter-horizon behavior remains more balanced. Cross-sectionally, the weekly rank at #107 and monthly rank at #83 (out of 1223) place the name in the upper portion of the tracked universe, but the daily rank at #359 signals less immediate edge. Technically, the structure remains supportive on moving-average relationships (close vs MA50 and MA50 vs MA200 both bullish), yet momentum/participation indicators are less uniform—evidenced by a MACD histogram of -9.2987 alongside a Bullish RSI bias. Volatility is not currently expansive, with Bollinger bandwidth at 0.0680, which can reduce follow-through unless participation strengthens. Key decision zones are defined by support ~3902.7000 and resistance ~4400.4333, framing confirmation and invalidation conditions for the next phase.
Key Takeaways
- Rank stance: Short-term Neutral; Mid-term Bullish; Long-term Neutral (weekly #107, monthly #83, daily #359 out of 1223).
- Technical confluence: Neutral (18-signal confluence 0.111; overall technical score 0.129; DRL rank #508).
- Key levels: Support 3902.7000 and resistance 4400.4333 define the near-term trading map.
- News sentiment bias: Mildly positive bias in scoring (avg sentiment 0.076; normalized score 0.50) with largely neutral distribution (Neutral 69%).
- Confirmation / invalidation: Acceptance above 4400.4333 with volume supports continuation; sustained closes below 3902.7000 increase deterioration risk.
What KGNAI Measures
KGNAI evaluates assets using large cross-sectional datasets built from millions of structured data points. Inputs incorporate fundamental metrics, technical structures, and systematically processed news sentiment. Statistical models, machine learning, and AI frameworks are used to assess relative positioning, signal alignment, and probabilistic behavior across broad universes.
How to Read This Report
- Ranks are comparative across the tracked universe, not absolute price targets.
- Confluence reflects alignment among independent signal groups.
- Support/resistance levels are probabilistic decision zones, not guarantees.
- Sentiment provides contextual bias within the broader analytical framework.
KGNAI Signal + Technical Snapshot + News Sentiment Digest
As of: 06-Mar-2026
Ticker: TORNTPHARM
1) KGNAI AI Analysis
Region: INDIA
Total universe size: 1223 ranked instruments
- Daily rank: #359 out of 1223 — Neutral
- Weekly rank: #107 out of 1223 — Bullish
- Monthly rank: #83 out of 1223 — Bullish
- 3-Monthly rank: #94 out of 1223 — Bullish
- 6-Monthly rank: #258 out of 1223 — Neutral
- Yearly rank: #156 out of 1223 — Bullish
Cross-horizon ranks point to mid-term leadership with short-term hesitation. The monthly rank at #83 and 3-month rank at #94 sit in the upper decile of a 1223-instrument universe, consistent with a constructive intermediate regime. The weekly position at #107 reinforces that tone.
The daily rank at #359 (upper third, but not leading) introduces a tactical caveat: recent price action may be less cleanly supported by the same breadth of favorable behaviors that dominate on the monthly window. In practice, this combination often appears when a trend remains intact, but near-term participation, volatility, or momentum quality is uneven.
Longer windows are mixed rather than uniformly strong. The yearly rank at #156 is still broadly constructive versus the universe, while the 6-month rank at #258 sits closer to the middle, consistent with an asset that can alternate between trend persistence and consolidation phases.
Netting these horizons, the report’s term view—Short-term Neutral, Mid-term Bullish, Long-term Neutral—fits a regime where investors typically prioritize confirmation (breakout/hold of key levels) over assuming linear continuation based solely on intermediate ranks.
KGNAI ranks each instrument across large universes using multiple proprietary AI tests and statistical models (millions of data points). Lower ranks generally indicate stronger probability of favorable performance behavior, while higher ranks indicate weaker probability and more bearish positioning.
Term view: Short-term: Neutral. Mid-term: Bullish. Long-term: Neutral.
Want the full universe and complete rank tables? Unlock full access on KGNAI: https://www.kgnai.com/pricing
2) Price & trend overview
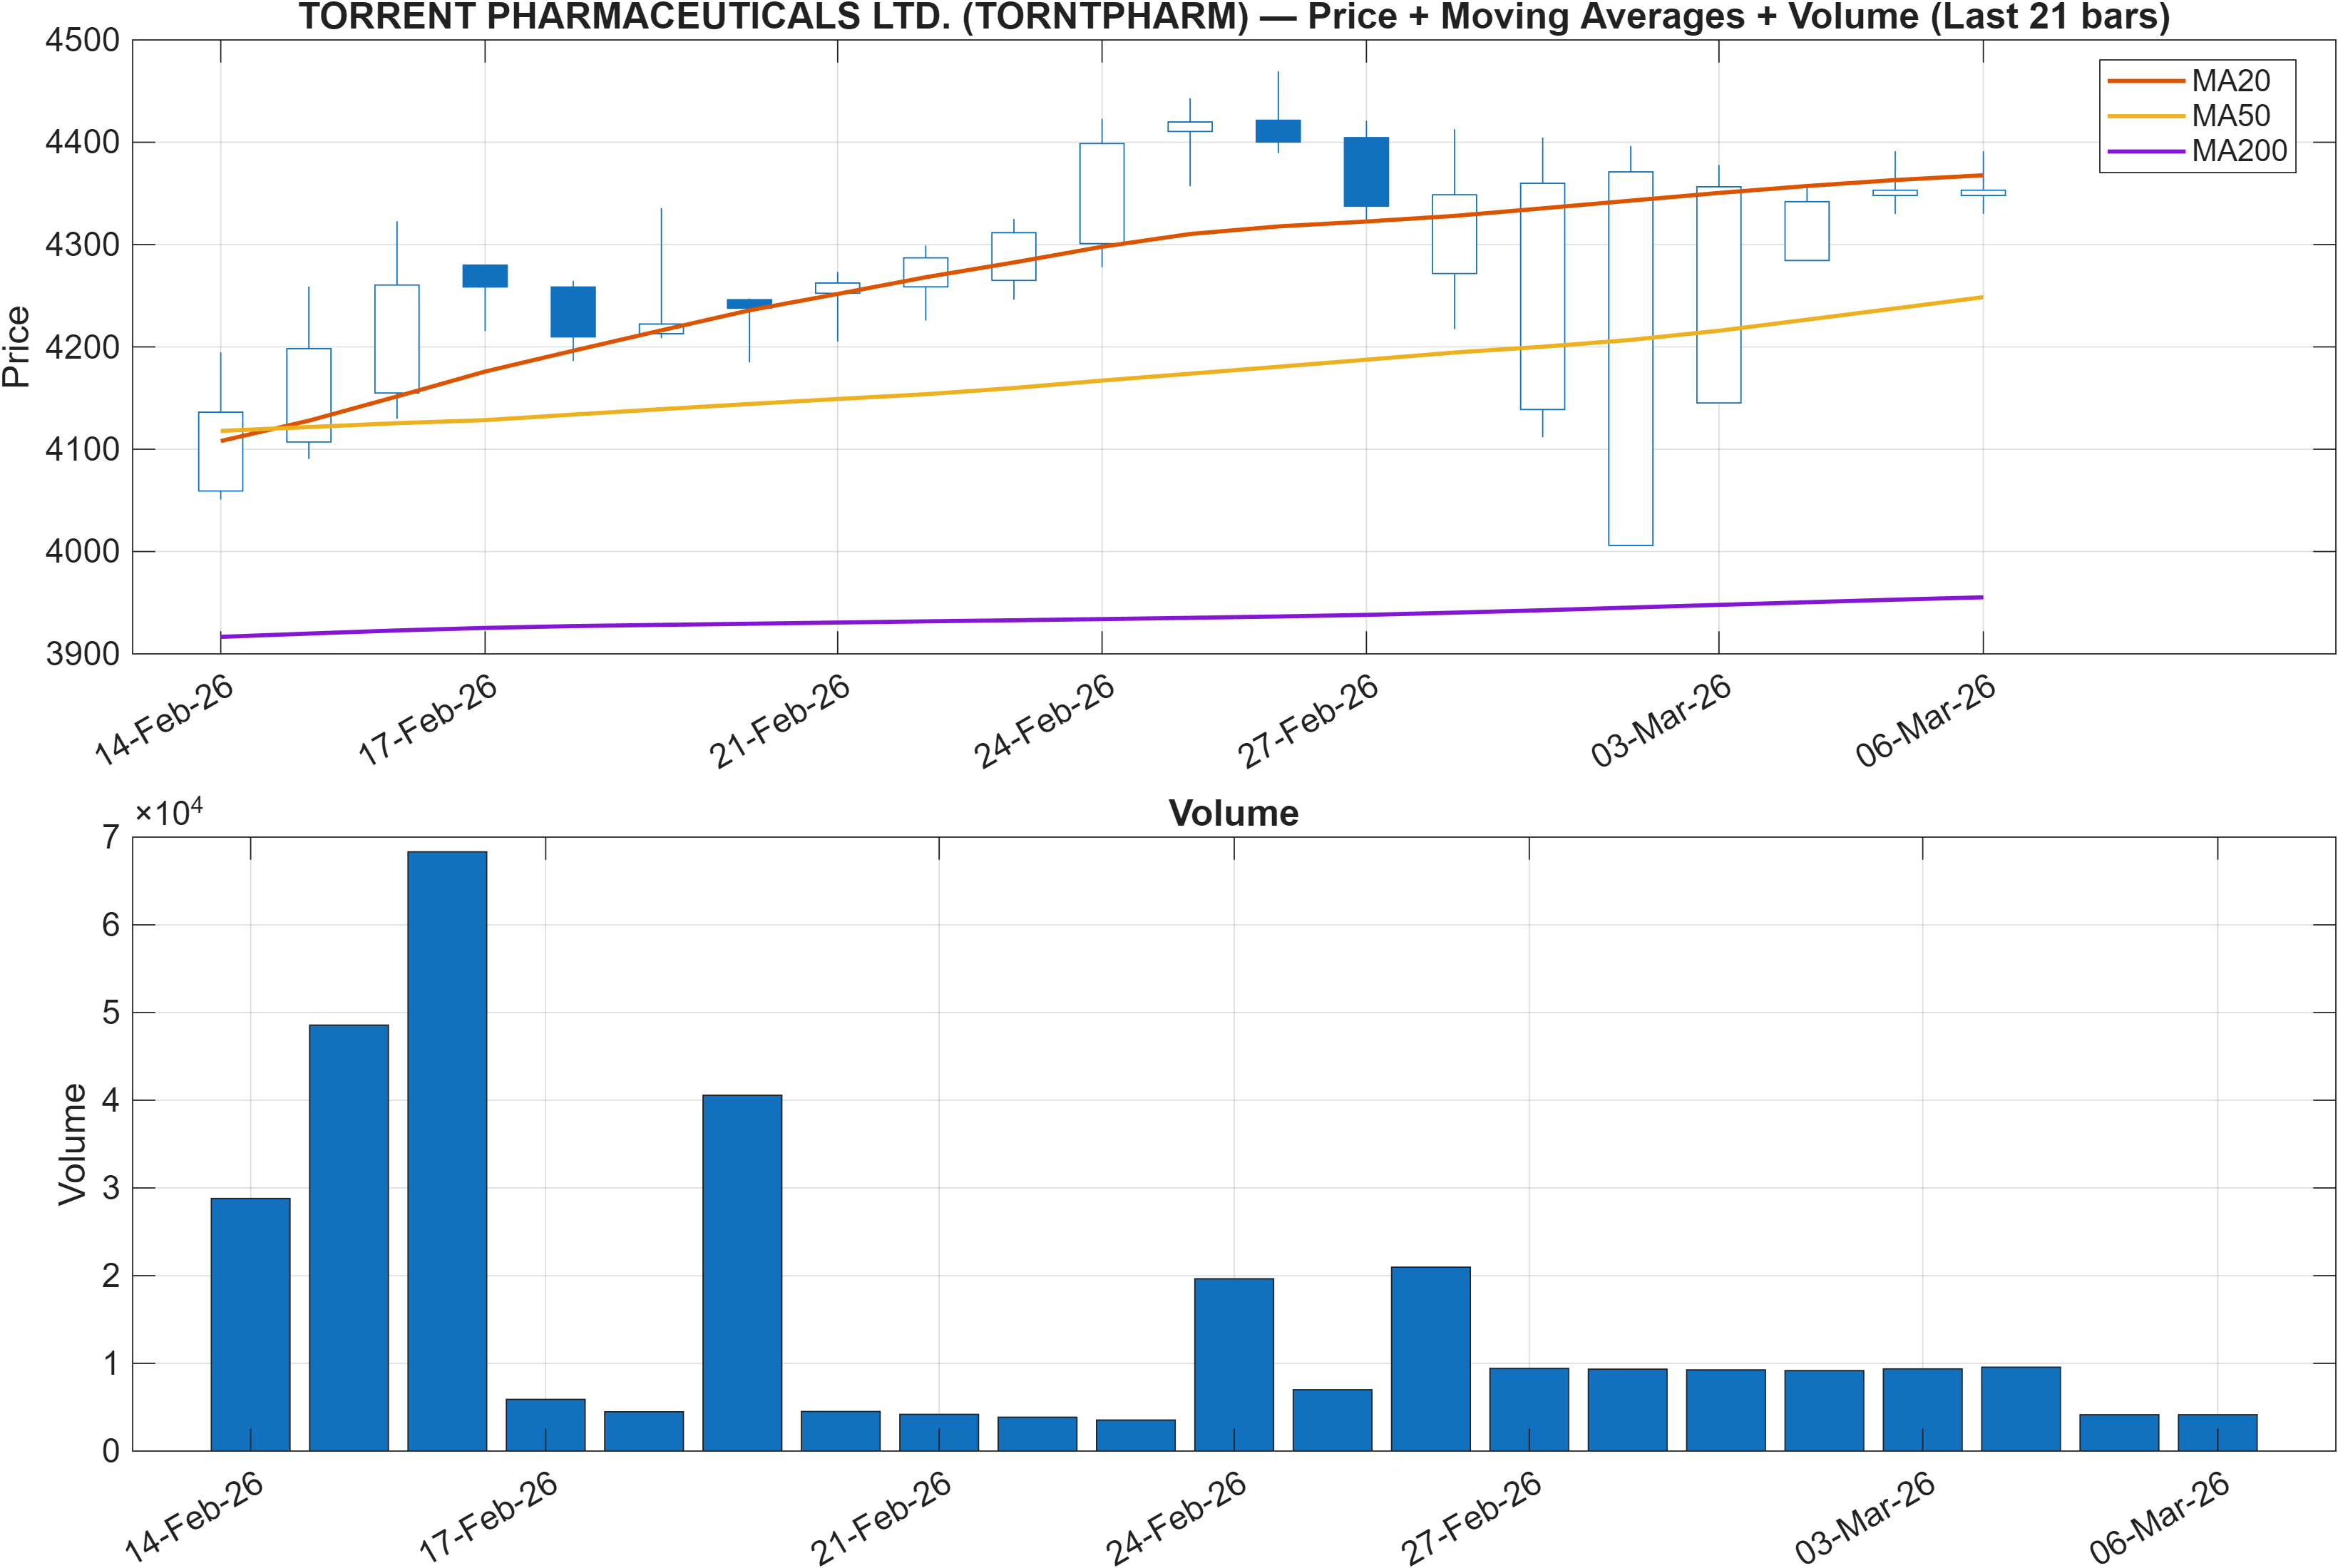
Trend structure remains constructive on classic moving-average tests, with both close vs MA50 and MA50 vs MA200 flagged bullish. This alignment typically characterizes an established uptrend regime where pullbacks are more likely to be evaluated as mean-reversion opportunities rather than immediate trend breaks—provided key levels hold.
The nuance is that the broader KGNAI short-horizon rank does not fully confirm a dominant trend day-to-day. With the daily rank at #359 versus stronger monthly placement at #83, price may be trending but less efficiently, with intermittent reversals, uneven volume confirmation, or narrower leadership versus peers.
From a market-structure perspective, this profile often resolves through one of two paths: (i) trend resumption via renewed participation that lifts short-term ranks toward the weekly/monthly cluster, or (ii) range development where price remains above longer averages but momentum oscillators fade. The nearby resistance level at 4400.4333 becomes the practical checkpoint for whether trend persistence is being reinforced, while the support zone at 3902.7000 functions as the primary downside decision area.
The most informative confirmation in this section is not the existence of a bullish MA stack alone, but whether subsequent signals (momentum, volume-flow, and volatility expansion) converge to validate continuation rather than a slow consolidation above averages.
Interpretation: Close vs MA50 = Bullish, MA50 vs MA200 = Bullish.
3) Momentum & volatility dashboard
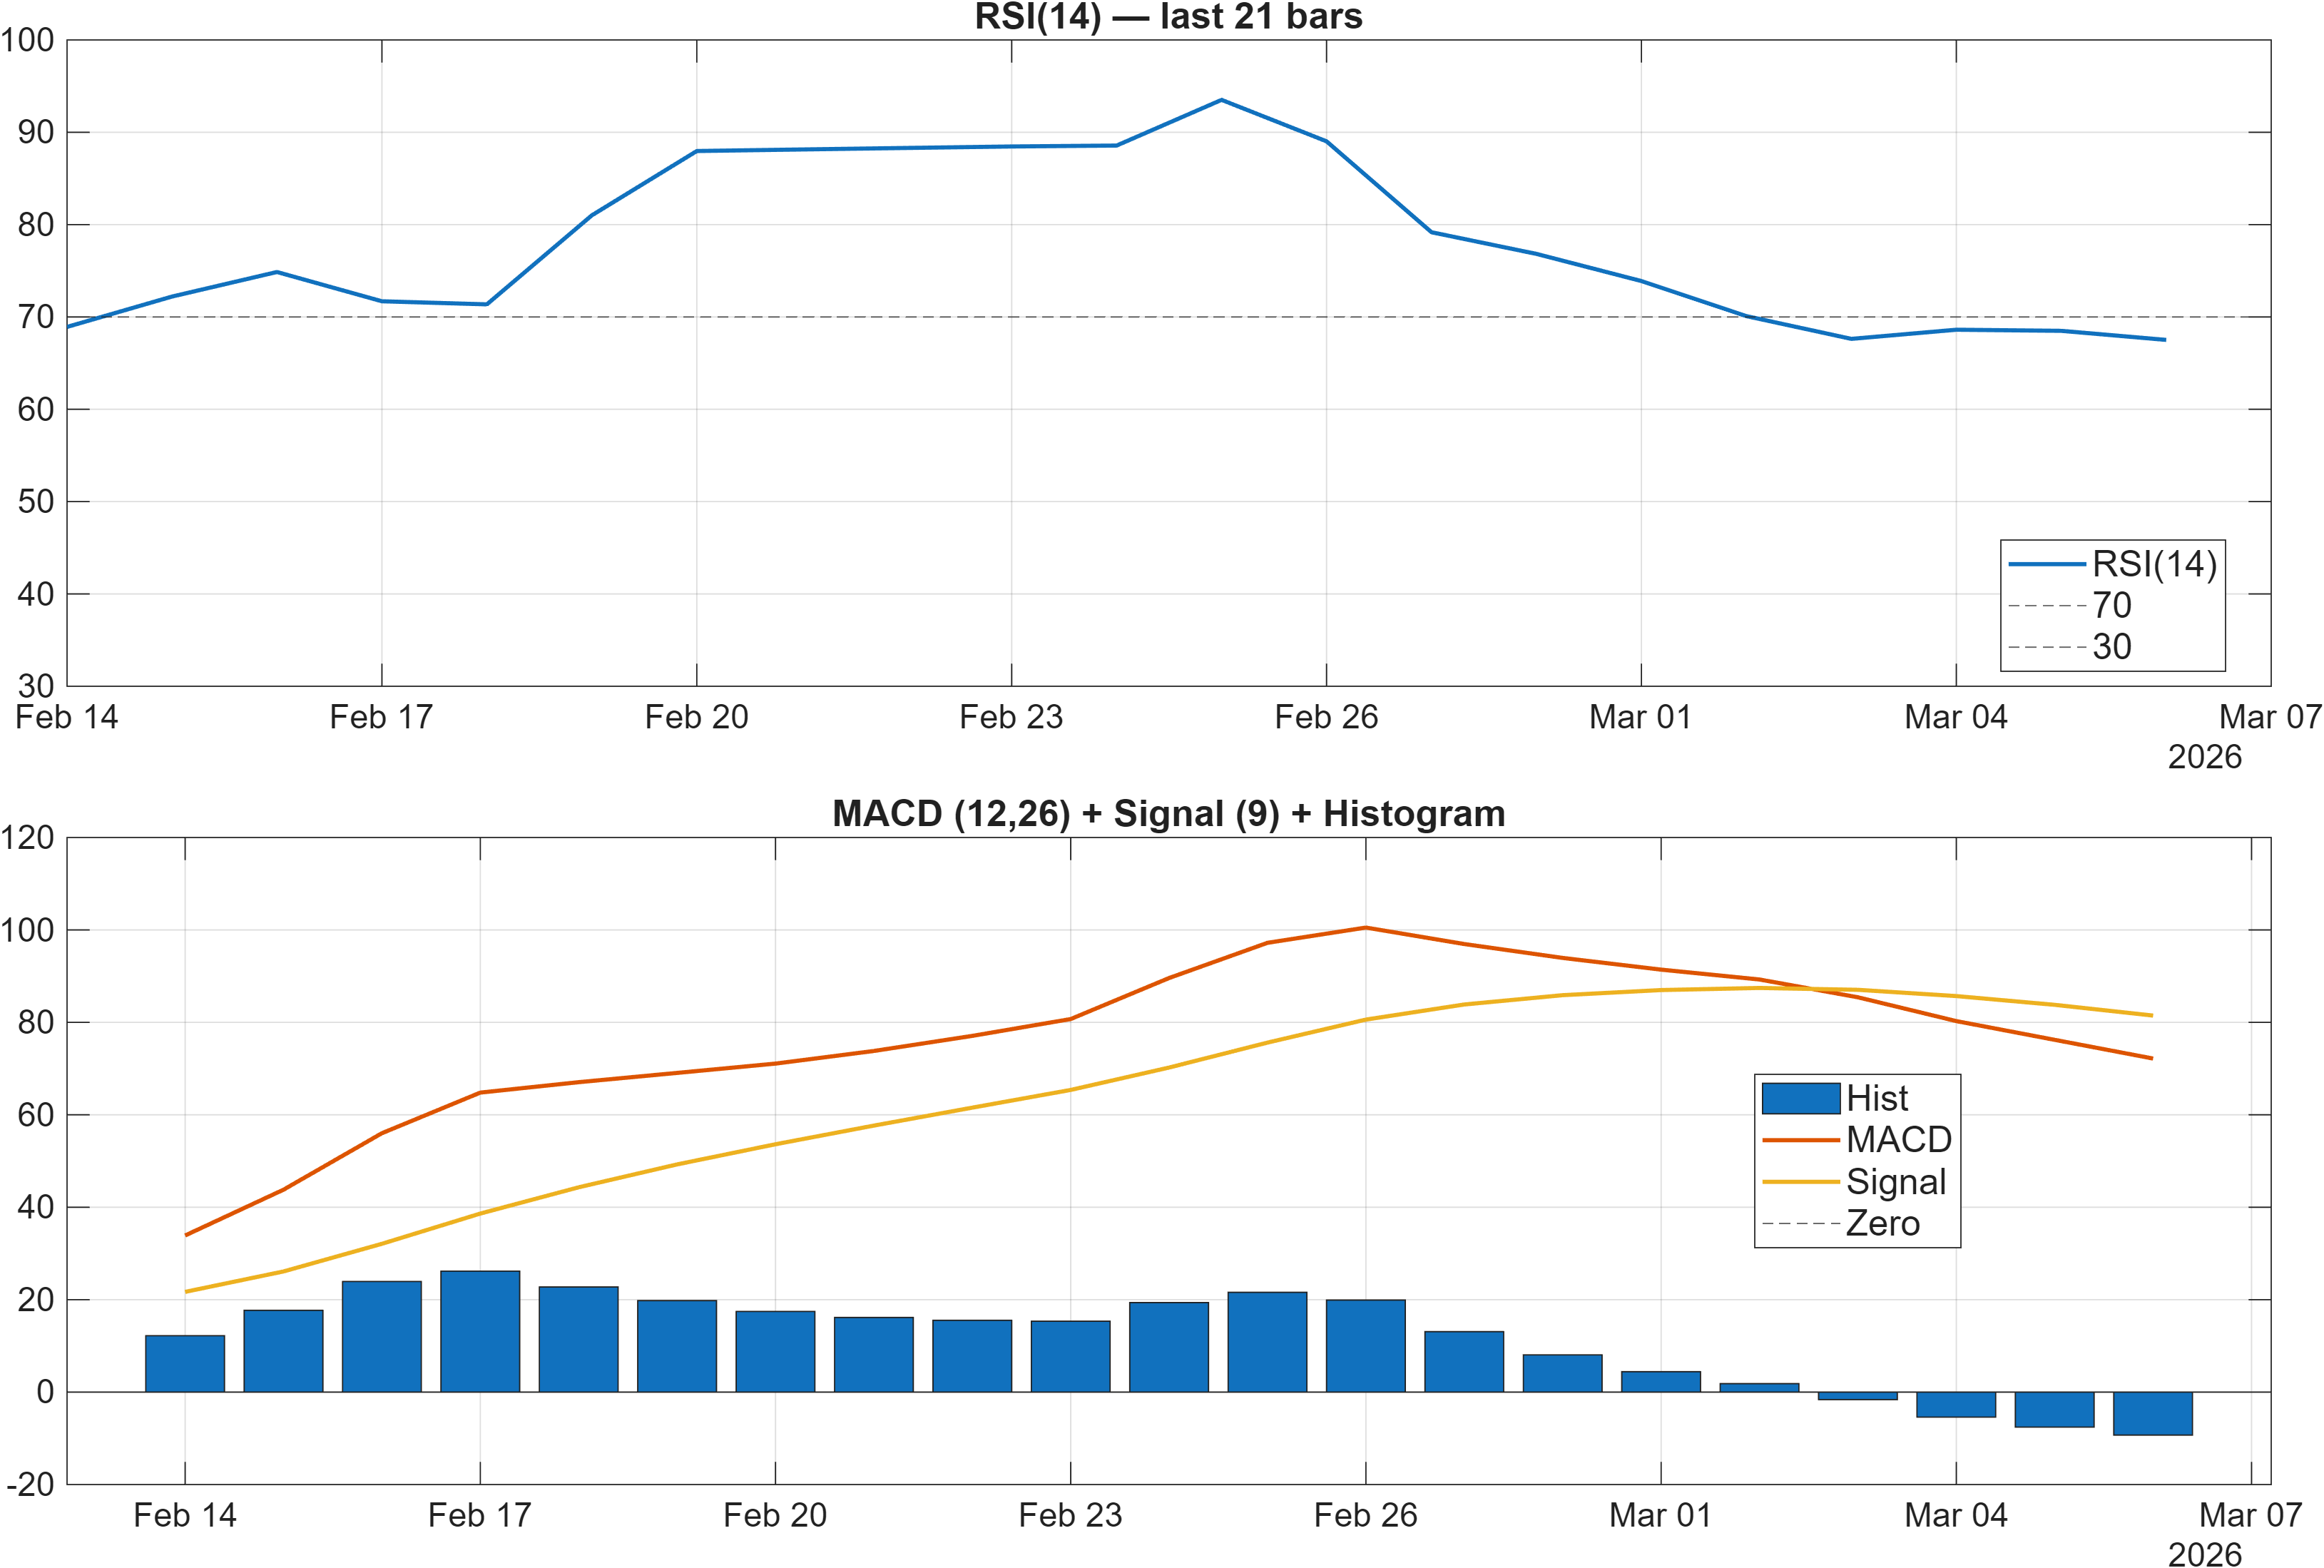
Interpretation: RSI bias = Bullish, MACD hist = -9.2987.
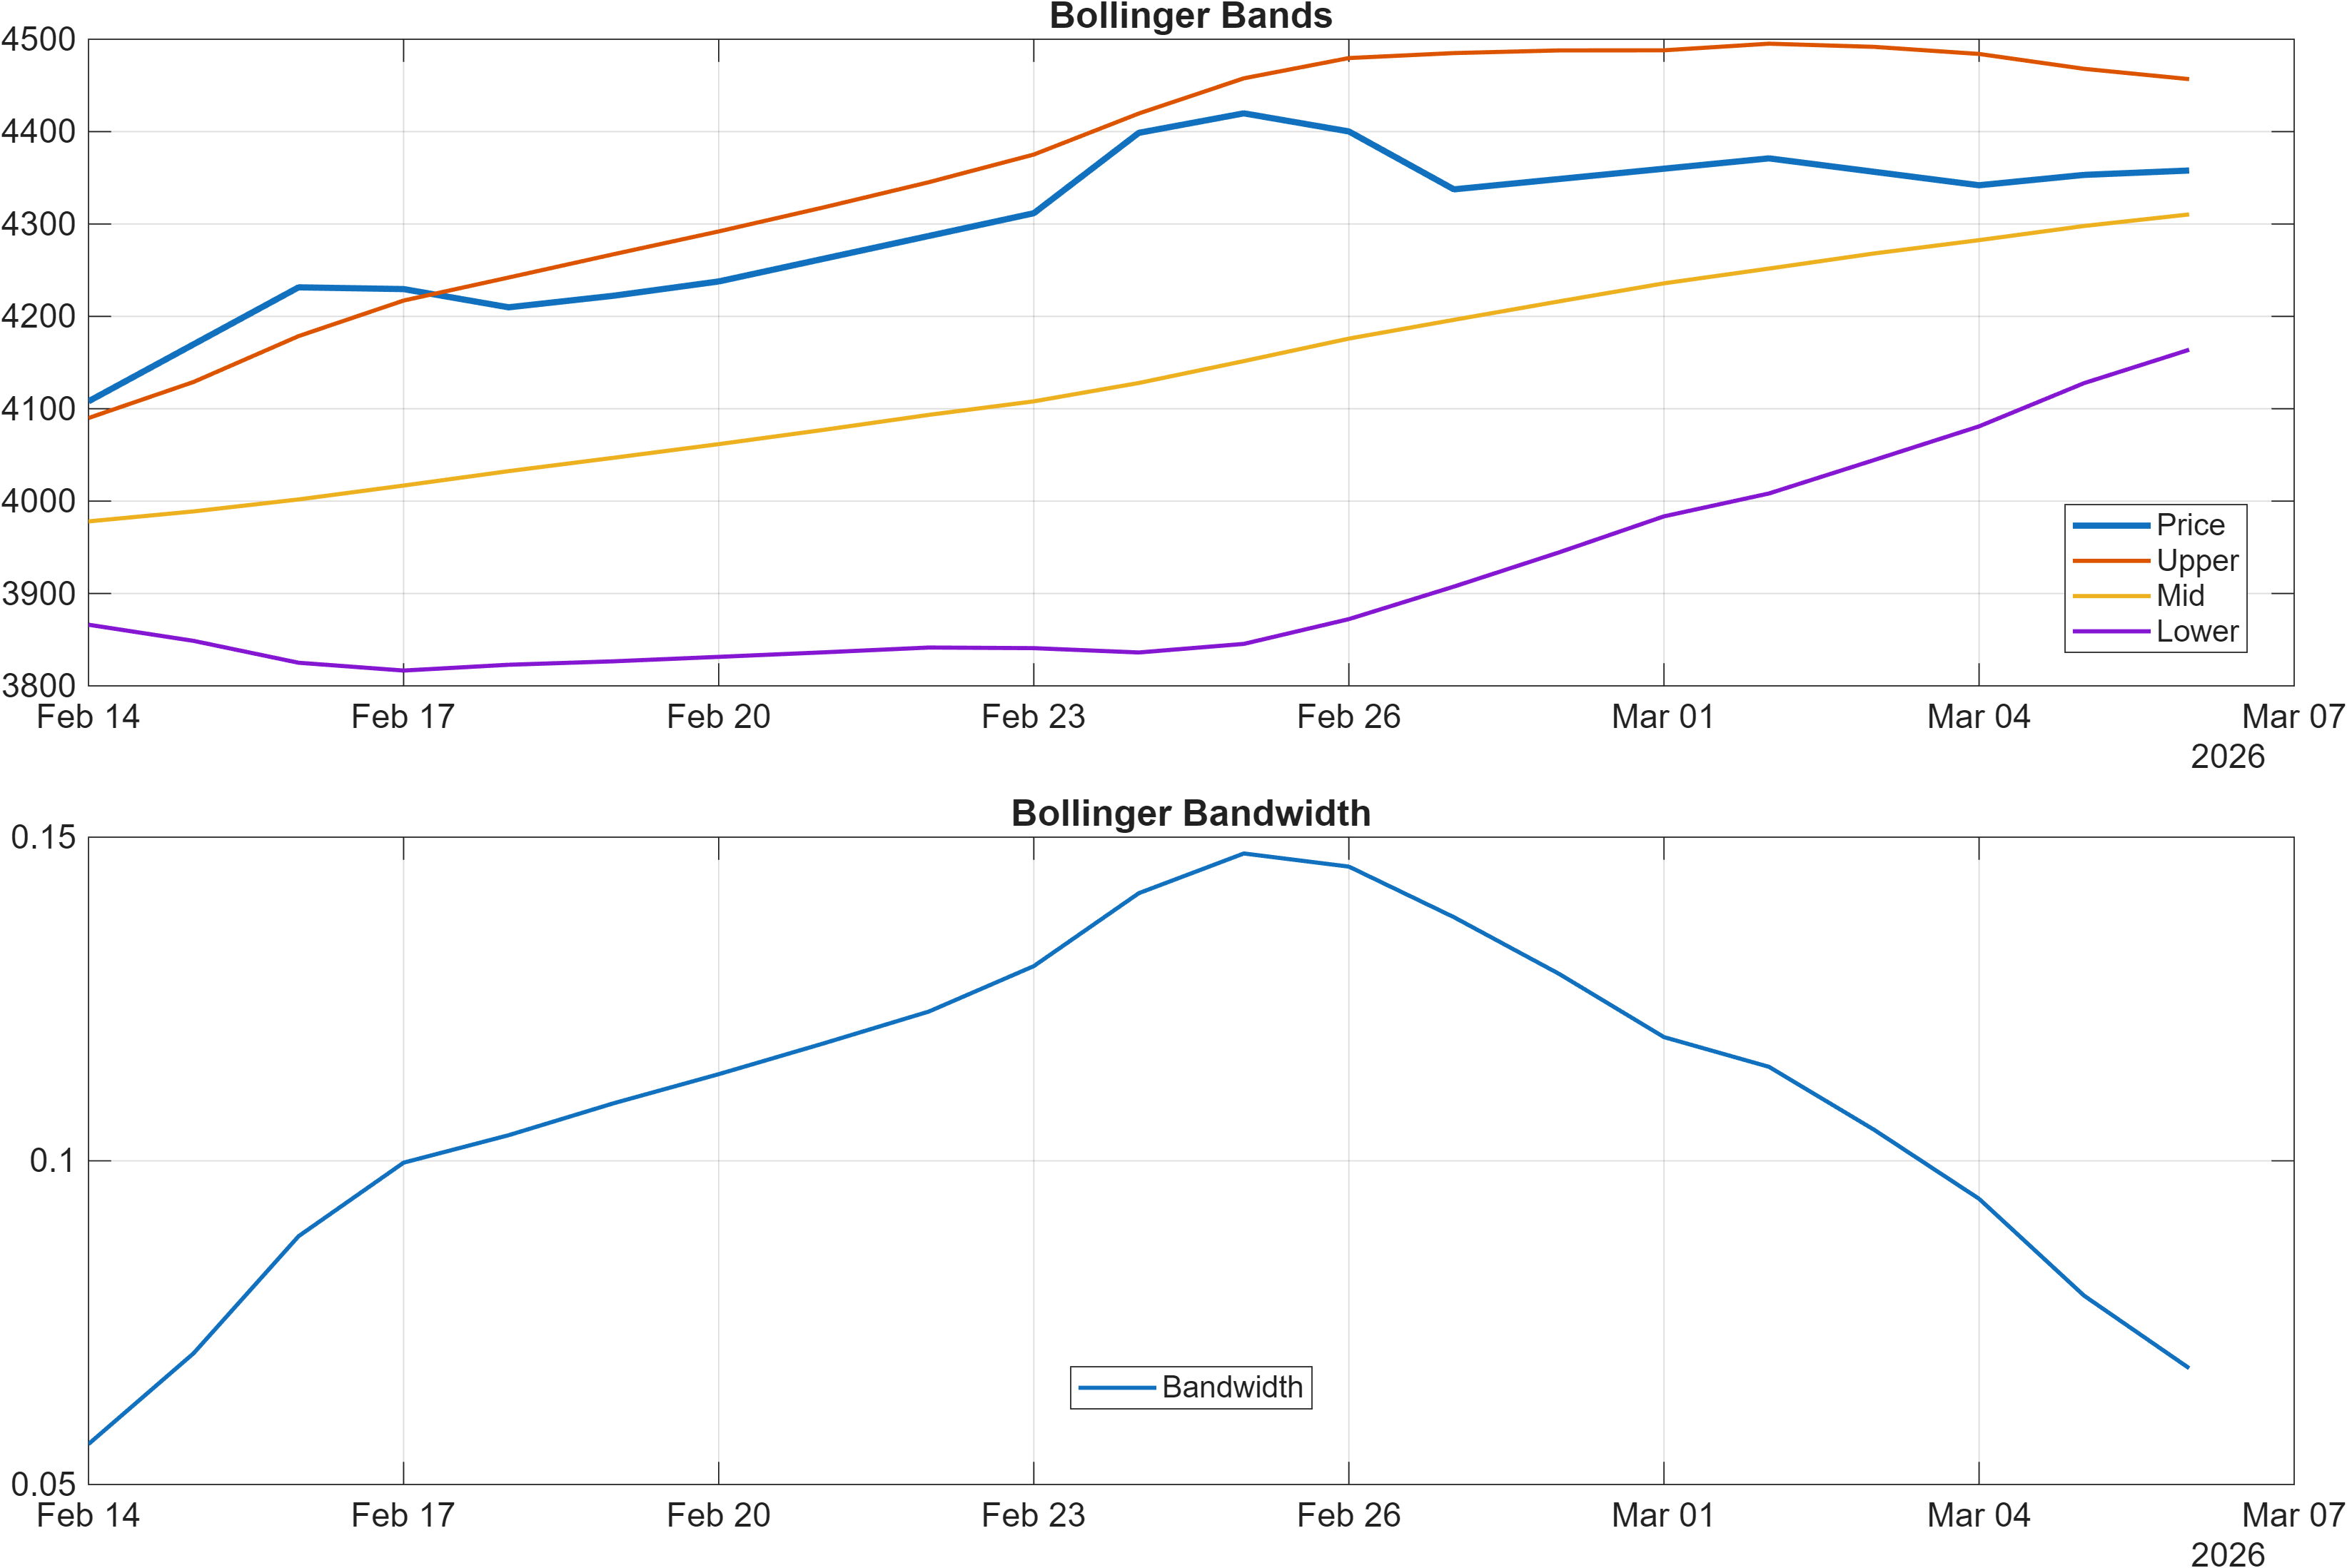
Interpretation: Bandwidth (volatility regime) latest = 0.0680.
Momentum signals are directionally constructive but not synchronized. RSI carries a bullish bias, and the signal table confirms RSI(14) at 67.51 as bullish—often consistent with sustained demand and trend-following behavior. However, the MACD histogram at -9.2987 introduces a clear counterweight: upside momentum may be present, but the rate-of-change in trend strength is not uniformly positive.
This kind of RSI–MACD divergence is frequently associated with a transition state: either a pause that refreshes the trend (MACD re-catches up) or a condition where RSI remains elevated while thrust fades. The technical dashboard further supports “mixed momentum quality” through the presence of both bullish and bearish components (Bull 8 / Bear 6 / Neutral 4) in the blended technical readout.
Volatility is comparatively contained, with Bollinger bandwidth at 0.0680 (and BB Width shown as 0.06797 in the signal table, neutral). When volatility compresses, breakouts can still occur, but follow-through often depends on whether participation indicators turn supportive. In the same table, some volume-flow metrics conflict (e.g., accumulation measures bullish while certain slopes/volume ROC are bearish), reinforcing the idea that momentum is present, but confirmation is uneven.
The practical implication is that price can remain supported within the prevailing trend structure, yet the next directional impulse is more likely to require either a volatility expansion from the current bandwidth baseline or clearer MACD stabilization.
4) Support / Resistance zones
Support ~ 3902.7000 | Resistance ~ 4400.4333
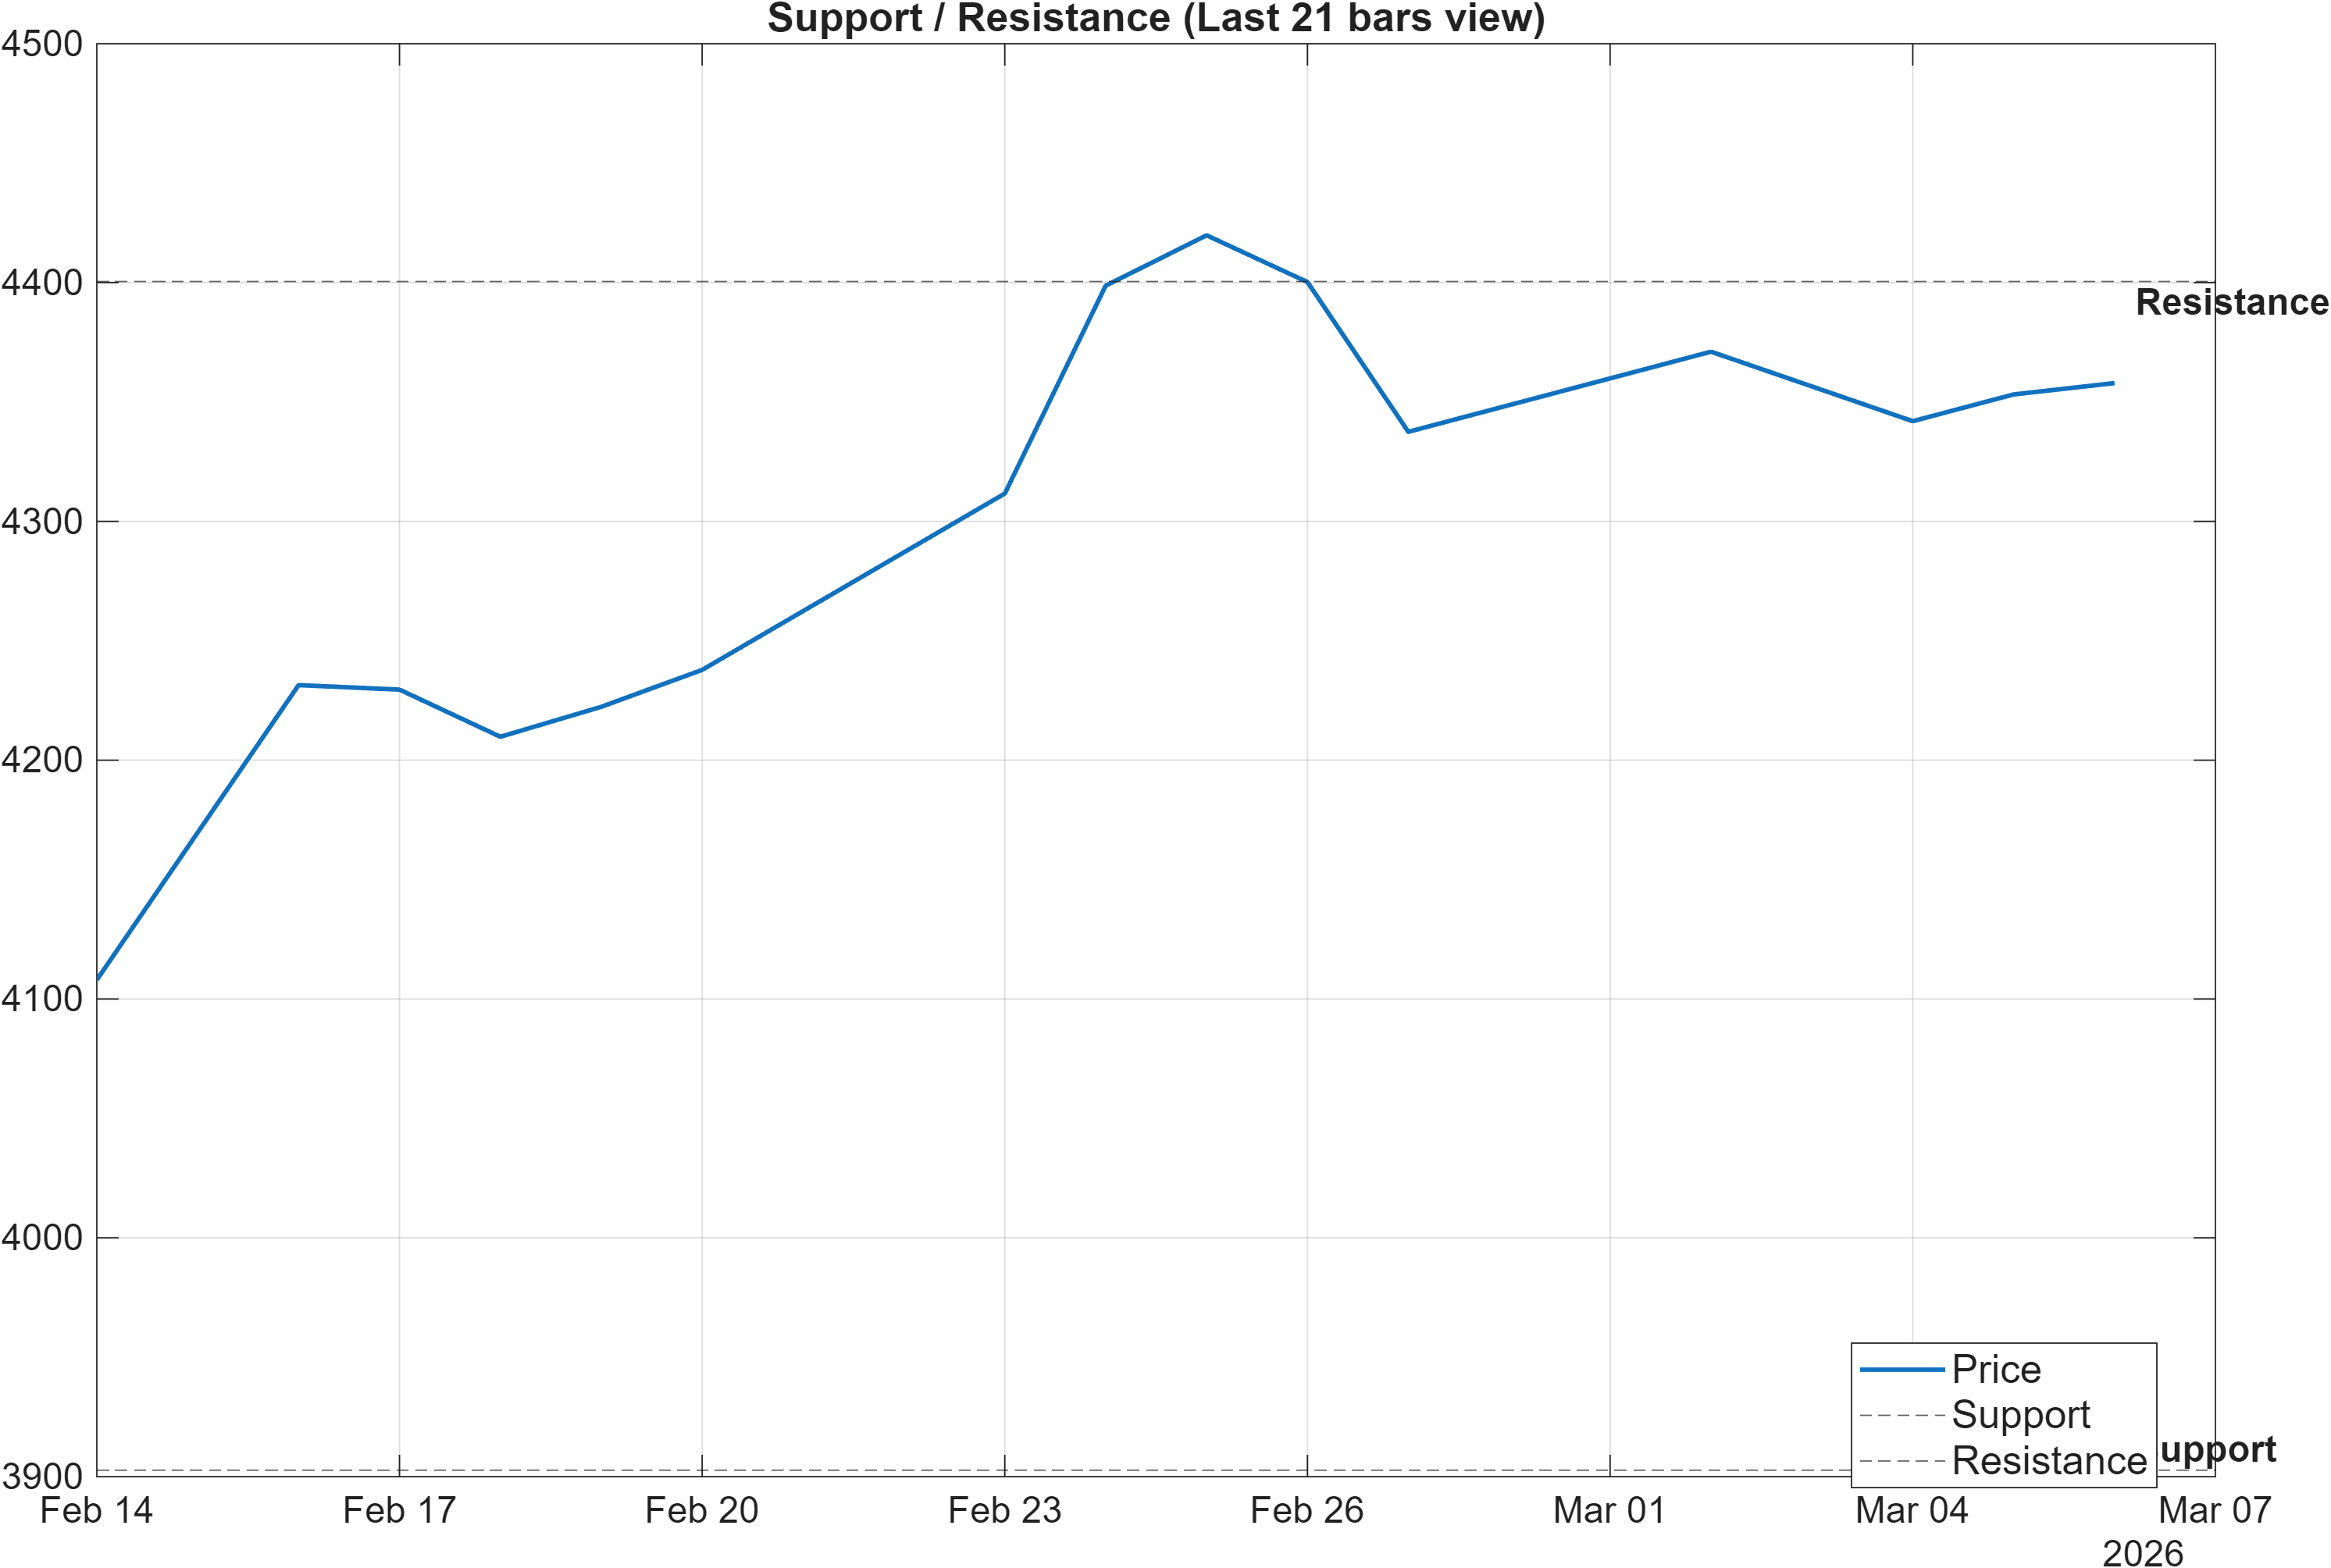
The current map is cleanly framed by 3902.7000 as support and 4400.4333 as resistance—levels that function less as precise turning points and more as probabilistic decision zones where order flow and positioning often concentrate. With the broader trend indicators constructive (bullish MA relationships) but momentum readings mixed (MACD histogram -9.2987 against bullish RSI), these zones become the primary arbiters of whether the market is in continuation mode or shifting into a mean-reverting range.
The resistance zone near 4400.4333 is the natural stress test for the mid-term bullish rank cluster (weekly #107, monthly #83, 3-month #94). A decisive break is most credible when it is paired with improving participation signals, especially given the mixed picture in volume-flow slopes and the neutral volatility regime (bandwidth 0.0680). Without that, price can probe resistance but fail to hold gains.
On the downside, sustained weakness that pushes price acceptance below 3902.7000 would conflict with the constructive trend framework and could pull intermediate ranks toward the more neutral daily posture (#359) and 6-month rank (#258). That would represent a regime shift from “trend with mixed momentum” to “trend damage,” where rallies can become more fragile and volatility can expand in the adverse direction.
Given the present signal mix, the most robust approach is to treat the space between these levels as a validation corridor rather than assuming directional dominance in advance.
Scenario view: Break above resistance with volume → continuation. Close below support → signal deterioration risk.
5) Quant Technical Dashboard (18 Signals)
KGNAI AI Technical Analysis Score (Deep Reinforcement Learning): Rank #508 out of 1223 (Rank 1 represents the strongest technical positioning and a higher probability of favorable price behavior. As ranks increase toward the maximum, the probability of favorable outcomes weakens and bearish positioning becomes more dominant.) | Label: Neutral | Score: 0.169
18-Signal Technical Confluence Score: 0.111 (Neutral)
Overall Technical Score (18-signal confluence + DRL rank blend): 0.129 (Neutral)
Note: The blended score reflects signal strength weighted against broader AI technical ranking, which may temporarily diverge.
Blended technical score breakdown: 0.129 (Neutral | Bull 8 / Bear 6 / Neutral 4)
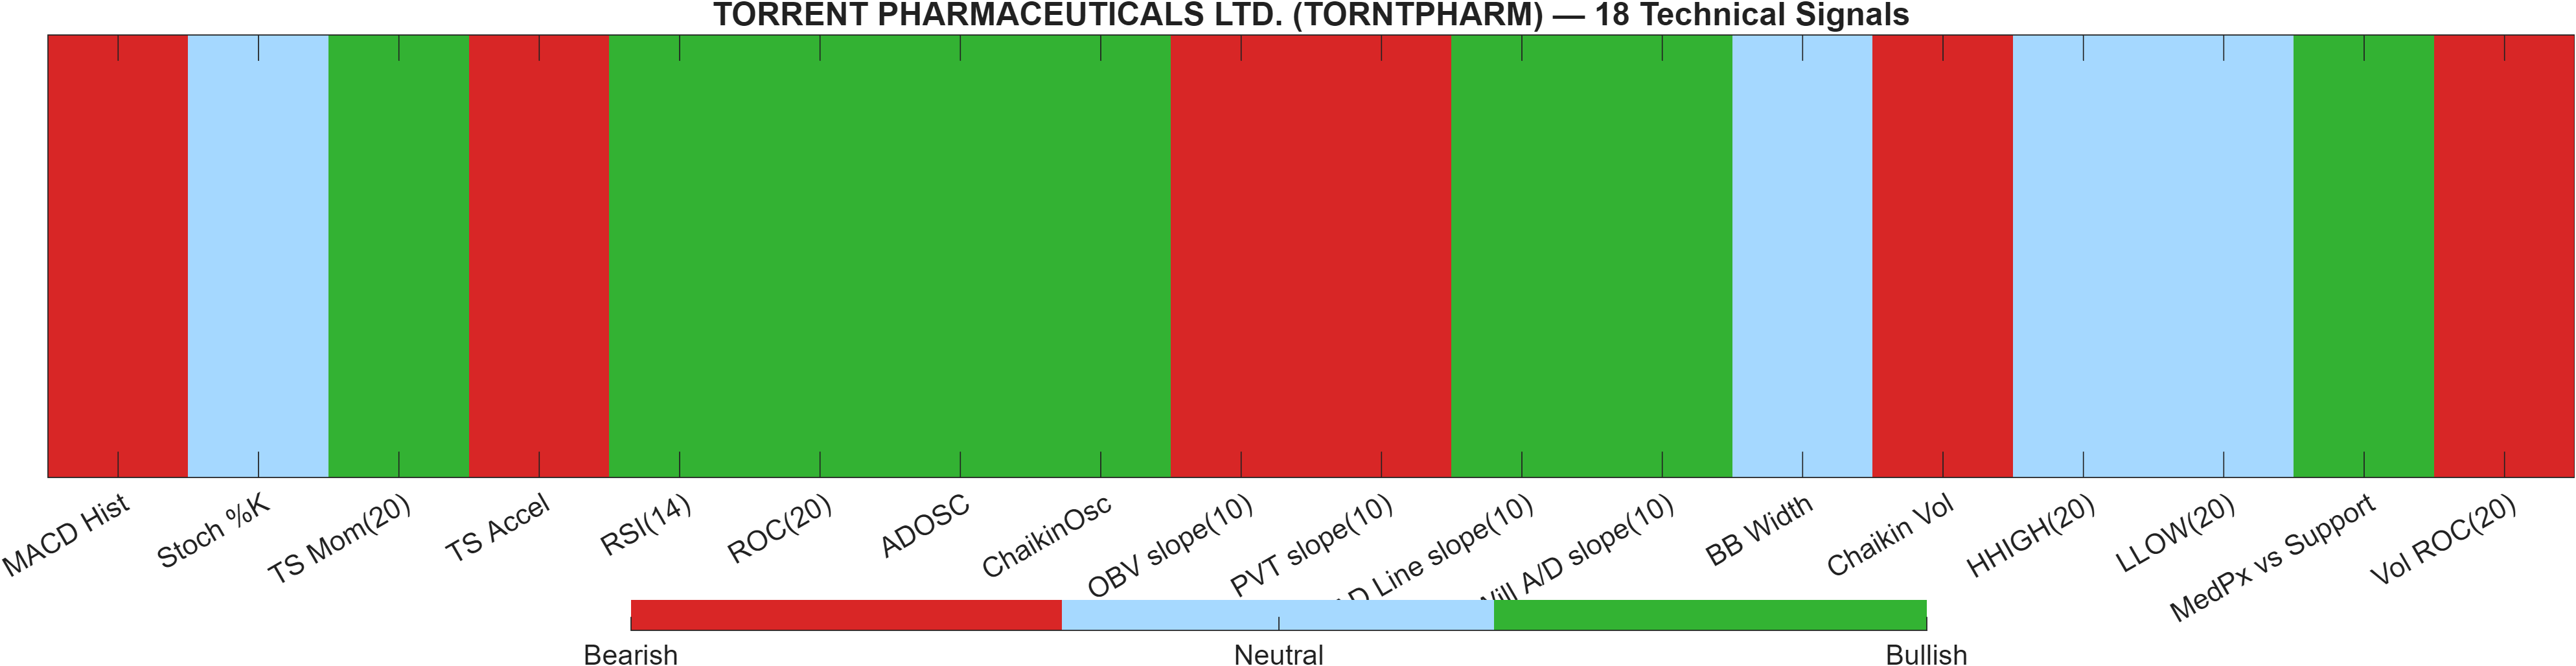
The quant dashboard is best read as a neutral aggregate with internal cross-currents. The 18-signal confluence score at 0.111 and the overall blended technical score at 0.129 both print neutral, implying that no single signal family is dominating enough to produce a strong regime call. This aligns with the headline stance of “no dominant momentum.”
The DRL technical rank at #508 (score 0.169) reinforces a middle-of-universe technical posture. In cross-sectional terms, that typically corresponds to average-to-moderate technical edge: tradable structure exists, but consistency and payoff distribution can be more sensitive to timing around key levels.
Internally, the blended breakdown (Bull 8 / Bear 6 / Neutral 4) shows a mild bullish tilt that is not strong enough to override the bearish cluster. The most analytically relevant tension is between momentum/strength (e.g., RSI(14) 67.51 bullish; TS Mom(20) 154.8 bullish) and deceleration/participation risk (e.g., MACD Hist -9.299 bearish; TS Accel -44.33 bearish; Vol ROC(20) -91.46 bearish). When these groups disagree, the market often requires a catalyst such as volatility expansion (BB width shifting away from ~0.068) or a clearer volume confirmation to move from neutral to directional.
Practically, this configuration favors evidence-based escalation: treat upside signals as higher quality when bearish participation/acceleration readings improve, and treat weakness as more consequential if it coincides with breaks of the defined support zone.
Signal table (Bull/Bear/Neutral)
| Indicator | Value | Signal |
|---|---|---|
| MACD Hist | -9.299 | Bearish |
| Stoch %K | 74.92 | Neutral |
| TS Mom(20) | 154.8 | Bullish |
| TS Accel | -44.33 | Bearish |
| RSI(14) | 67.51 | Bullish |
| ROC(20) | 4.513 | Bullish |
| ADOSC | 54.21 | Bullish |
| ChaikinOsc | 7687 | Bullish |
| OBV slope(10) | -1.042e+04 | Bearish |
| PVT slope(10) | -174.6 | Bearish |
| AD Line slope(10) | 9673 | Bullish |
| Will A/D slope(10) | 639.1 | Bullish |
| BB Width | 0.06797 | Neutral |
| Chaikin Vol | 38.95 | Bearish |
| HHIGH(20) | 4469 | Neutral |
| LLOW(20) | 4006 | Neutral |
| MedPx vs Support | 457.9 | Bullish |
| Vol ROC(20) | -91.46 | Bearish |
Interpretation: Indicator-level signals form the base confluence, which is then adjusted using a separate AI-driven technical ranking model. The final technical score summarizes this combined view.
6) News sentiment + extractive gist
Note: Instrument-specific news matches were not found, so the digest includes broader market/sector headlines. Links are provided for verification.
Sentiment score (avg): 0.076 | Positive: 31% | Neutral: 69% | Negative: 0%
KGNAI AI News Sentiment Score (normalized -1 to +1): 0.50 (as of 2025-06-30) | Label: Bullish | Overall news score: 0.50
Positive Developments
Recent coverage across major financial outlets indicates a modestly constructive backdrop for broader risk assets and pockets of sector strength, reflected in the sentiment mix that contains 31% positive items and no explicitly negative items in the provided distribution. The average sentiment reading of 0.076 is not an aggressive “risk-on” signal, but it is consistent with a mild positive tilt that can support intermediate technical setups when price is already above trend references. In this report, that context matters because TORNTPHARM’s mid-term ranks (weekly #107, monthly #83) are already supportive; incremental positive tone tends to act as a stabilizer rather than a primary driver. With the normalized news score at 0.50 labeled bullish (as of 2025-06-30), the sentiment layer is directionally aligned with the intermediate rank bias, even if the near-term technical profile remains mixed.
Neutral / Mixed Developments
The dominant feature of the news mix is neutral coverage (69%), which typically corresponds to macro/market updates and general sector commentary rather than company-specific catalysts. For a technically-driven setup, heavy neutrality often means price is more likely to respond to internal market mechanics—levels, volatility regime, and participation—than to a discrete narrative impulse. This fits the current configuration: Bollinger bandwidth at 0.0680 implies contained volatility, and the overall technical score remains neutral at 0.129. When the news feed is mostly informational, confirmation tends to come from how price behaves at 4400.4333 resistance or 3902.7000 support, rather than from incremental sentiment swings.
Negative / Risk Signals
While the provided sentiment distribution shows 0% negative items, “risk” still appears through the absence of instrument-specific catalysts and through macro sensitivity embedded in broader market headlines. In such environments, technical vulnerabilities can matter more: a bearish MACD histogram of -9.2987 alongside neutral confluence (0.111) can leave price more exposed to abrupt shifts in volatility or liquidity. The daily rank at #359 also suggests that short-term edge is not dominant, which can amplify whipsaw behavior if markets reprice risk quickly. Consequently, downside risk is less about negative news volume and more about whether the market fails to sustain the trend structure—particularly if price acceptance slips below 3902.7000.
- Whether price acceptance improves above 4400.4333 alongside stronger participation/volume-flow confirmation.
- Whether volatility expands from the current bandwidth baseline (0.0680) in a direction that aligns with trend.
- Whether bearish momentum components (e.g., MACD histogram -9.2987) stabilize while RSI remains constructive.
Sources referenced: Reuters, Bloomberg, Yahoo Finance, MarketWatch, Investing.com
Snapshot: AI Rank (Short–Mid–Long): Mixed (Neutral–Bullish–Neutral) · Technical Confluence: Neutral · Key Levels: Support ~3902.70 | Resistance ~4400.43 · News Sentiment: Neutral
7) Sources
- Ahead of Market: 10 things that will decide stock market action on Friday — https://economictimes.indiatimes.com/markets/stocks/news/ahead-of-market-10-things-that-will-decide-stock-market-action-on-friday/articleshow/129099546.cms
- US Stocks: Fed's Tom Barkin says sticky inflation, better jobs data could shift the risk outlook — https://economictimes.indiatimes.com/markets/us-stocks/news/us-stocks-feds-tom-barkin-says-sticky-inflation-better-jobs-data-could-shift-the-risk-outlook/articleshow/129098244.cms
- US Stocks: Broadcom shares rise as $100 billion AI forecast signals gains in Nvidia-dominated market — https://economictimes.indiatimes.com/markets/us-stocks/news/us-stocks-broadcom-shares-rise-as-100-billion-ai-forecast-signals-gains-in-nvidia-dominated-market/articleshow/129098018.cms
- US stocks today: Dow crashes 600 points as Middle East war risks oil price surge — https://economictimes.indiatimes.com/markets/us-stocks/news/us-stocks-today-us-stocks-open-lower-as-investors-weigh-middle-east-war-risks/articleshow/129097341.cms
- Data Patterns among 6 stocks that hit 52-week highs & rallied up to 33% in a month — https://economictimes.indiatimes.com/markets/stocks/news/data-patterns-among-6-stocks-that-hit-52-week-highs-amp-rallied-up-to-33-in-a-month/slideshow/129091950.cms
- Stock market quote of the day by Carlos Slim Helú | "Courage taught me no matter how bad a crisis gets... any sound investment will eventually pay off." — https://economictimes.indiatimes.com/markets/us-stocks/news/stock-market-quote-of-the-day-by-carlos-slim-hel-courage-taught-me-no-matter-how-bad-a-crisis-gets-any-sound-investment-will-eventually-pay-off-/articleshow/129080199.cms
- Embassy REIT raises Rs 1,400 cr via issue of debentures — https://economictimes.indiatimes.com/markets/digital-real-estate/realty-news/embassy-reit-raises-rs-1400-cr-via-issue-of-debentures/articleshow/129089595.cms
- US Stocks: US bonds tumble as oil price surge kindles inflation fears — https://economictimes.indiatimes.com/markets/us-stocks/news/us-stocks-us-bonds-tumble-as-oil-price-surge-kindles-inflation-fears/articleshow/129087052.cms
You may also like: How KGNAI AI ranks instruments across global markets
Disclaimer: KGNAI provides AI-generated analytics and educational market commentary only. This is not financial advice. Markets involve risk. Always do your own research.