
VARROC (Varroc Engineering Ltd) — 25-Feb-2026 Technical & Rank Read: Bearish Alignment With Tight Volatility
Varroc Engineering Ltd (VARROC) enters 25-Feb-2026 with weak cross-horizon positioning in KGNAI’s ranked universe of 1213 instruments, where the short- and mid-term ranks cluster in the lower-quality tail. Price structure remains below key moving averages (close vs MA50 bearish; MA50 vs MA200 bearish), while momentum measures skew negative with RSI(14) at 27.74 and a MACD histogram at -1.5368. At the same time, volatility is relatively compressed (Bollinger bandwidth 0.0674), which can coincide with transition phases—yet direction typically requires confirmation through key levels. From a risk-management standpoint, the technical map is defined by support near 540.7250 and resistance near 625.2167. News sentiment is modestly positive on average (0.076) but remains contextual rather than instrument-specific in the provided dataset.
Key Takeaways
- Rank stance (Short / Mid / Long): Bearish / Bearish / Bearish
- Technical confluence label: Bearish (18-signal confluence -0.333; blended overall -0.348)
- Key decision zones: Support 540.7250 | Resistance 625.2167
- News sentiment bias: Neutral (avg score 0.076; 31% positive / 69% neutral / 0% negative)
- Confirmation / invalidation: A sustained move above 625.2167 with volume supports continuation; a close below 540.7250 increases deterioration risk.
What KGNAI Measures
KGNAI evaluates assets using large cross-sectional datasets built from millions of structured data points. Inputs incorporate fundamental metrics, technical structures, and systematically processed news sentiment. Statistical models, machine learning, and AI frameworks are used to assess relative positioning, signal alignment, and probabilistic behavior across broad universes.
How to Read This Report
- Ranks are comparative across the tracked universe, not absolute price targets.
- Confluence reflects alignment among independent signal groups.
- Support/resistance levels are probabilistic decision zones, not guarantees.
- Sentiment provides contextual bias within the broader analytical framework.
1) KGNAI AI Analysis
Region: INDIA
Total universe size: 1213 ranked instruments
- Daily rank: #1102 out of 1213 — Bearish
- Weekly rank: #1154 out of 1213 — Bearish
- Monthly rank: #1033 out of 1213 — Bearish
- 3-Monthly rank: #1001 out of 1213 — Bearish
- 6-Monthly rank: #984 out of 1213 — Bearish
- Yearly rank: #952 out of 1213 — Neutral
The rank profile places VARROC in the lower-quality tail of the tracked universe across most horizons, with the daily (#1102) and weekly (#1154) readings sitting deep in the bottom decile. When short-term and weekly ranks deteriorate together, the model typically interprets it as a persistent regime rather than an isolated fluctuation—especially when the monthly rank remains similarly weak (#1033).
The medium-window ranks show only limited relief: the 3-month (#1001) and 6-month (#984) ranks remain broadly bearish, implying that recent pressure is not confined to a brief drawdown. The yearly rank at #952 is labeled neutral, which is a relative improvement versus shorter horizons, but it still sits in the weaker half of the universe and does not, by itself, overturn the multi-horizon bearish stack.
This is a classic alignment vs. divergence check: VARROC exhibits alignment (bearish) across daily-to-6-month windows, while the yearly label is neutral. In practice, this combination often elevates the importance of confirmation zones elsewhere in the report—particularly the support/resistance bands and whether momentum can stabilize. Within KGNAI’s framework, the stated term view remains Bearish across short-, mid-, and long-term horizons.
Term view: Short-term: Bearish. Mid-term: Bearish. Long-term: Bearish.
Want the full universe and complete rank tables? Unlock full access on KGNAI: https://www.kgnai.com/pricing
2) Price & trend overview
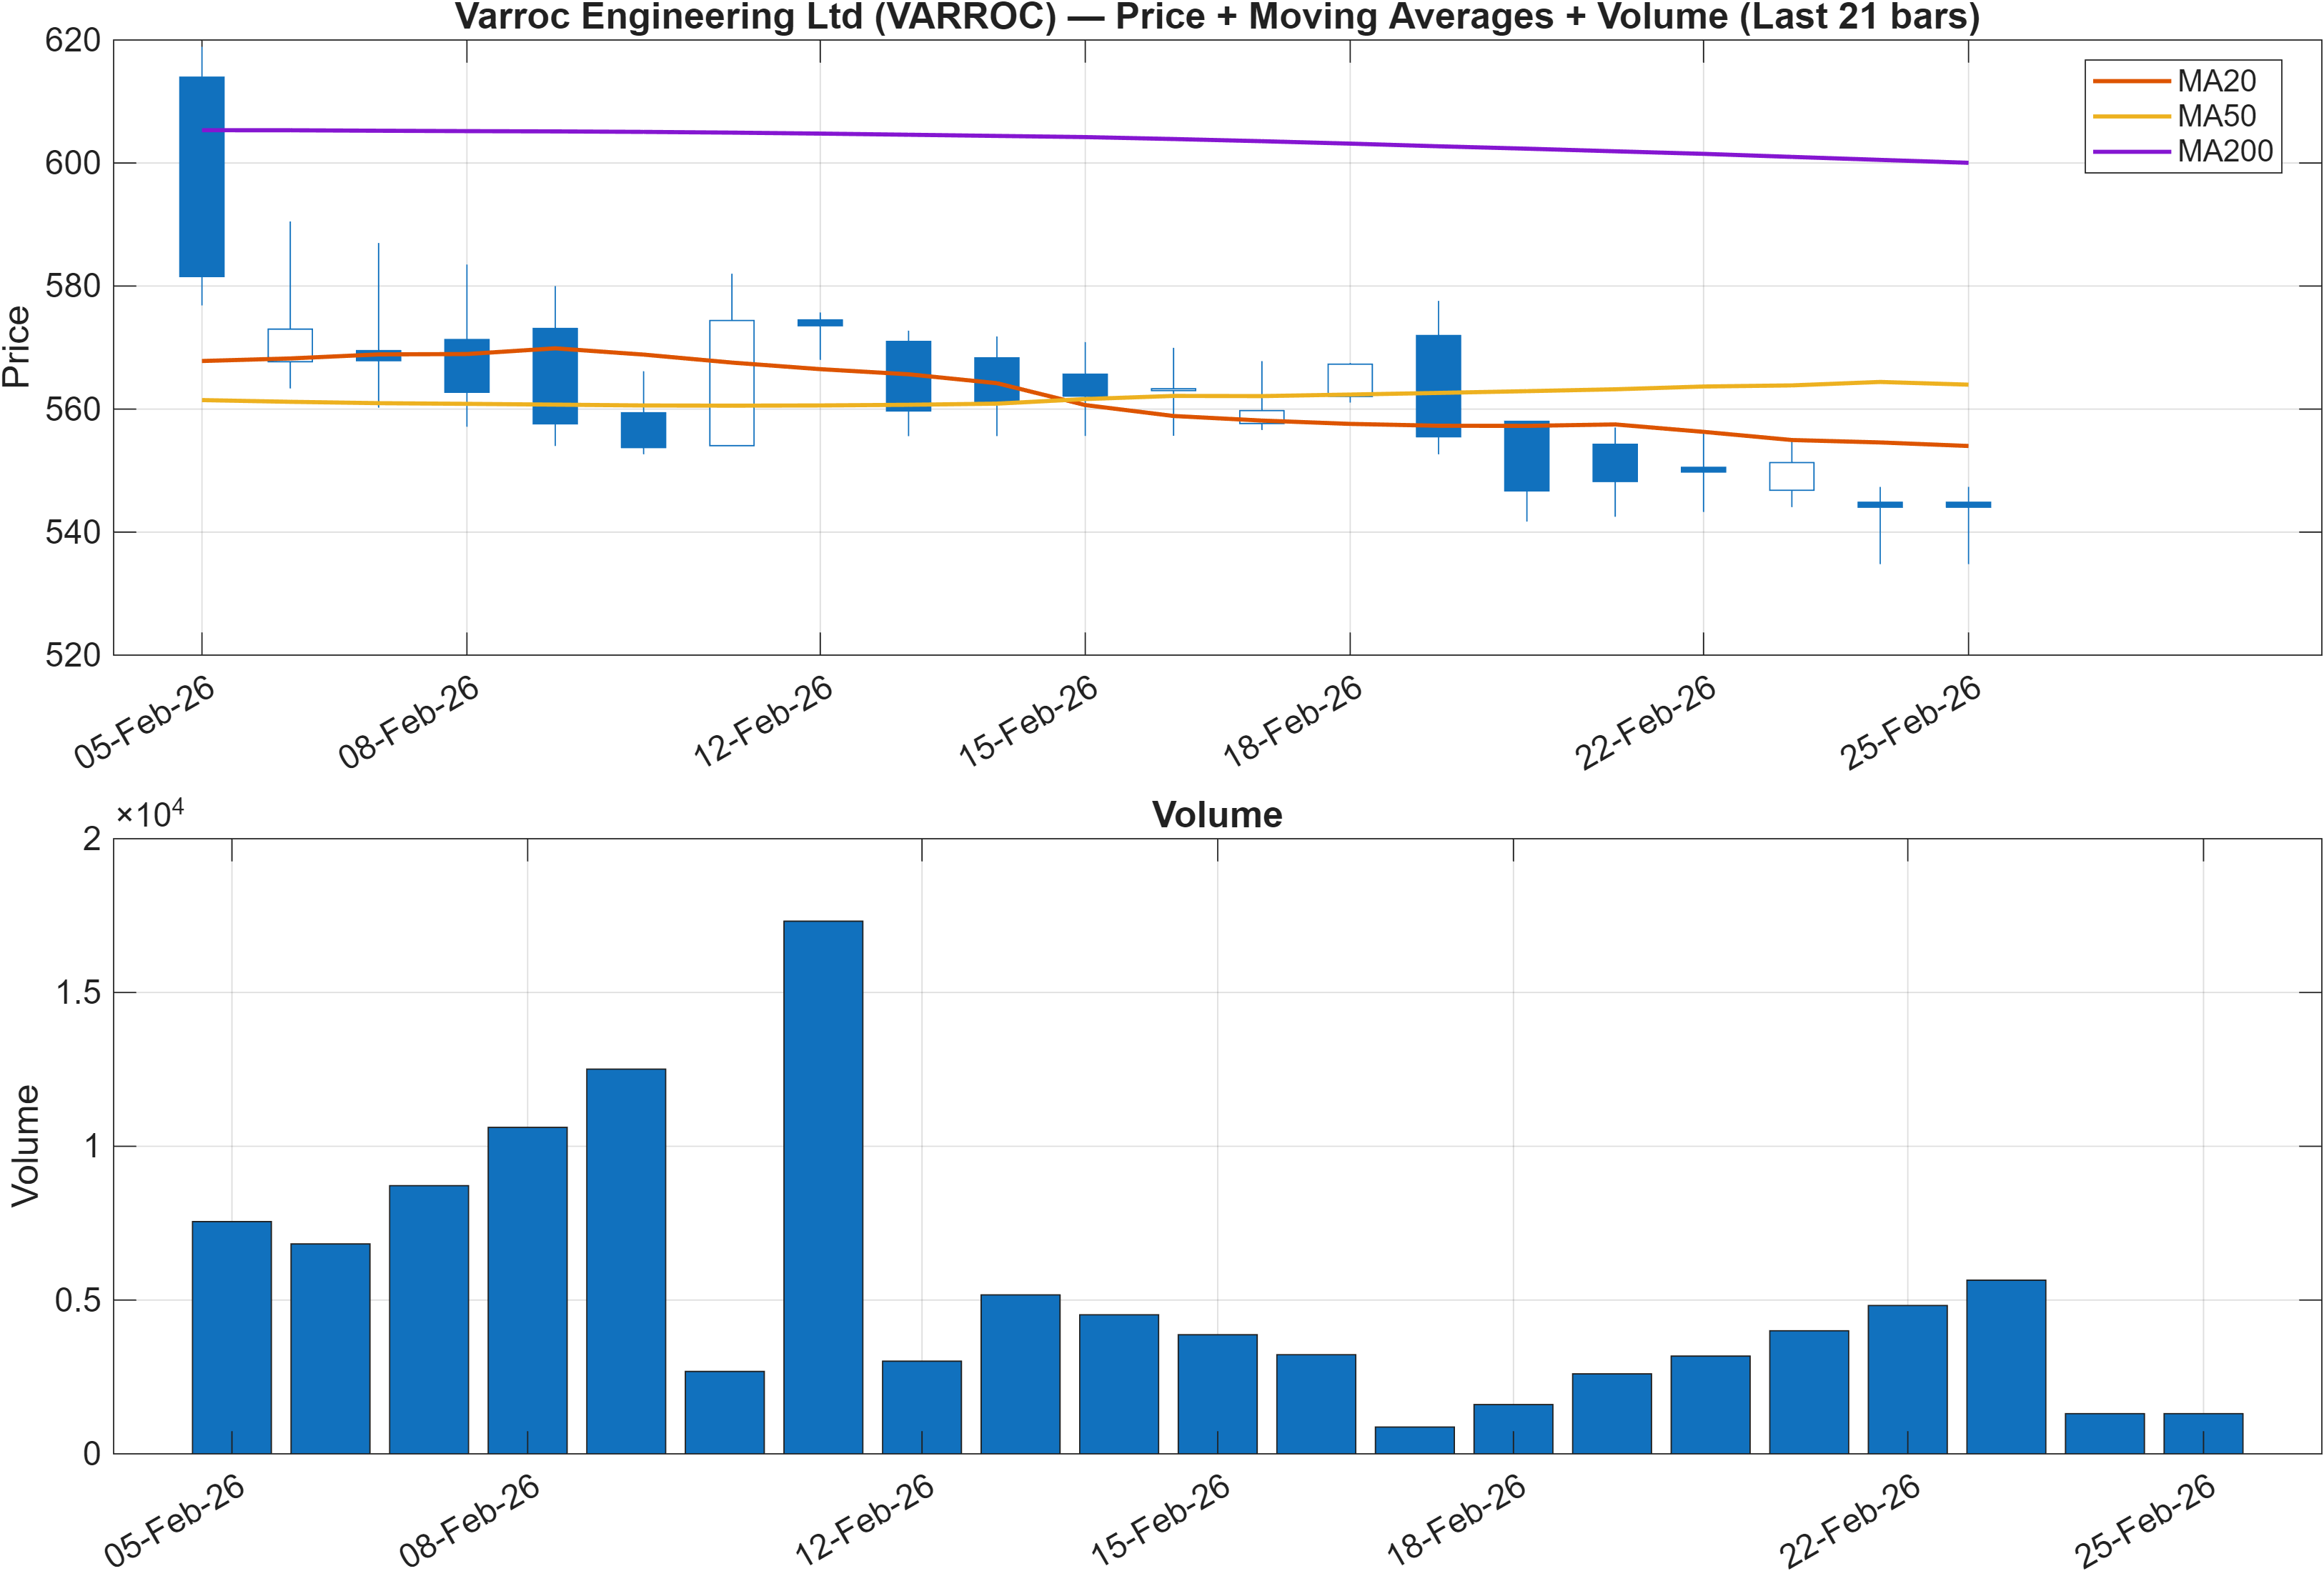
Interpretation: Close vs MA50 = Bearish, MA50 vs MA200 = Bearish.
Trend state: bearish structure with a confirmation-first roadmap
The moving-average configuration is unambiguous: price below the MA50 and MA50 below MA200 keeps the trend classification bearish. This matters because in many systematic trend frameworks, the MA50/MA200 relationship acts as a regime filter—meaning counter-trend rebounds can occur, but the base case remains that rallies face overhead supply until structure improves.
With ranks also weak (daily #1102; weekly #1154), the trend read is not an isolated technical observation; it is consistent with how the cross-sectional model is placing VARROC relative to peers. The key question becomes trend persistence vs. exhaustion: whether downside momentum is still being reinforced, or whether selling pressure is losing force and the chart is transitioning into a basing process.
That transition risk is best evaluated using the report’s explicit decision zones: support at 540.7250 and resistance at 625.2167. In a bearish trend regime, rebounds that fail below resistance tend to be interpreted as retracements rather than reversals, while decisive loss of support can convert a consolidation into renewed breakdown risk.
For VARROC specifically, trend-following confirmation typically requires more than a single green session; it requires sustained price improvement relative to the MA50 and stabilization in momentum indicators (covered next), while the rank stack begins to normalize away from the bottom decile.
3) Momentum & volatility dashboard
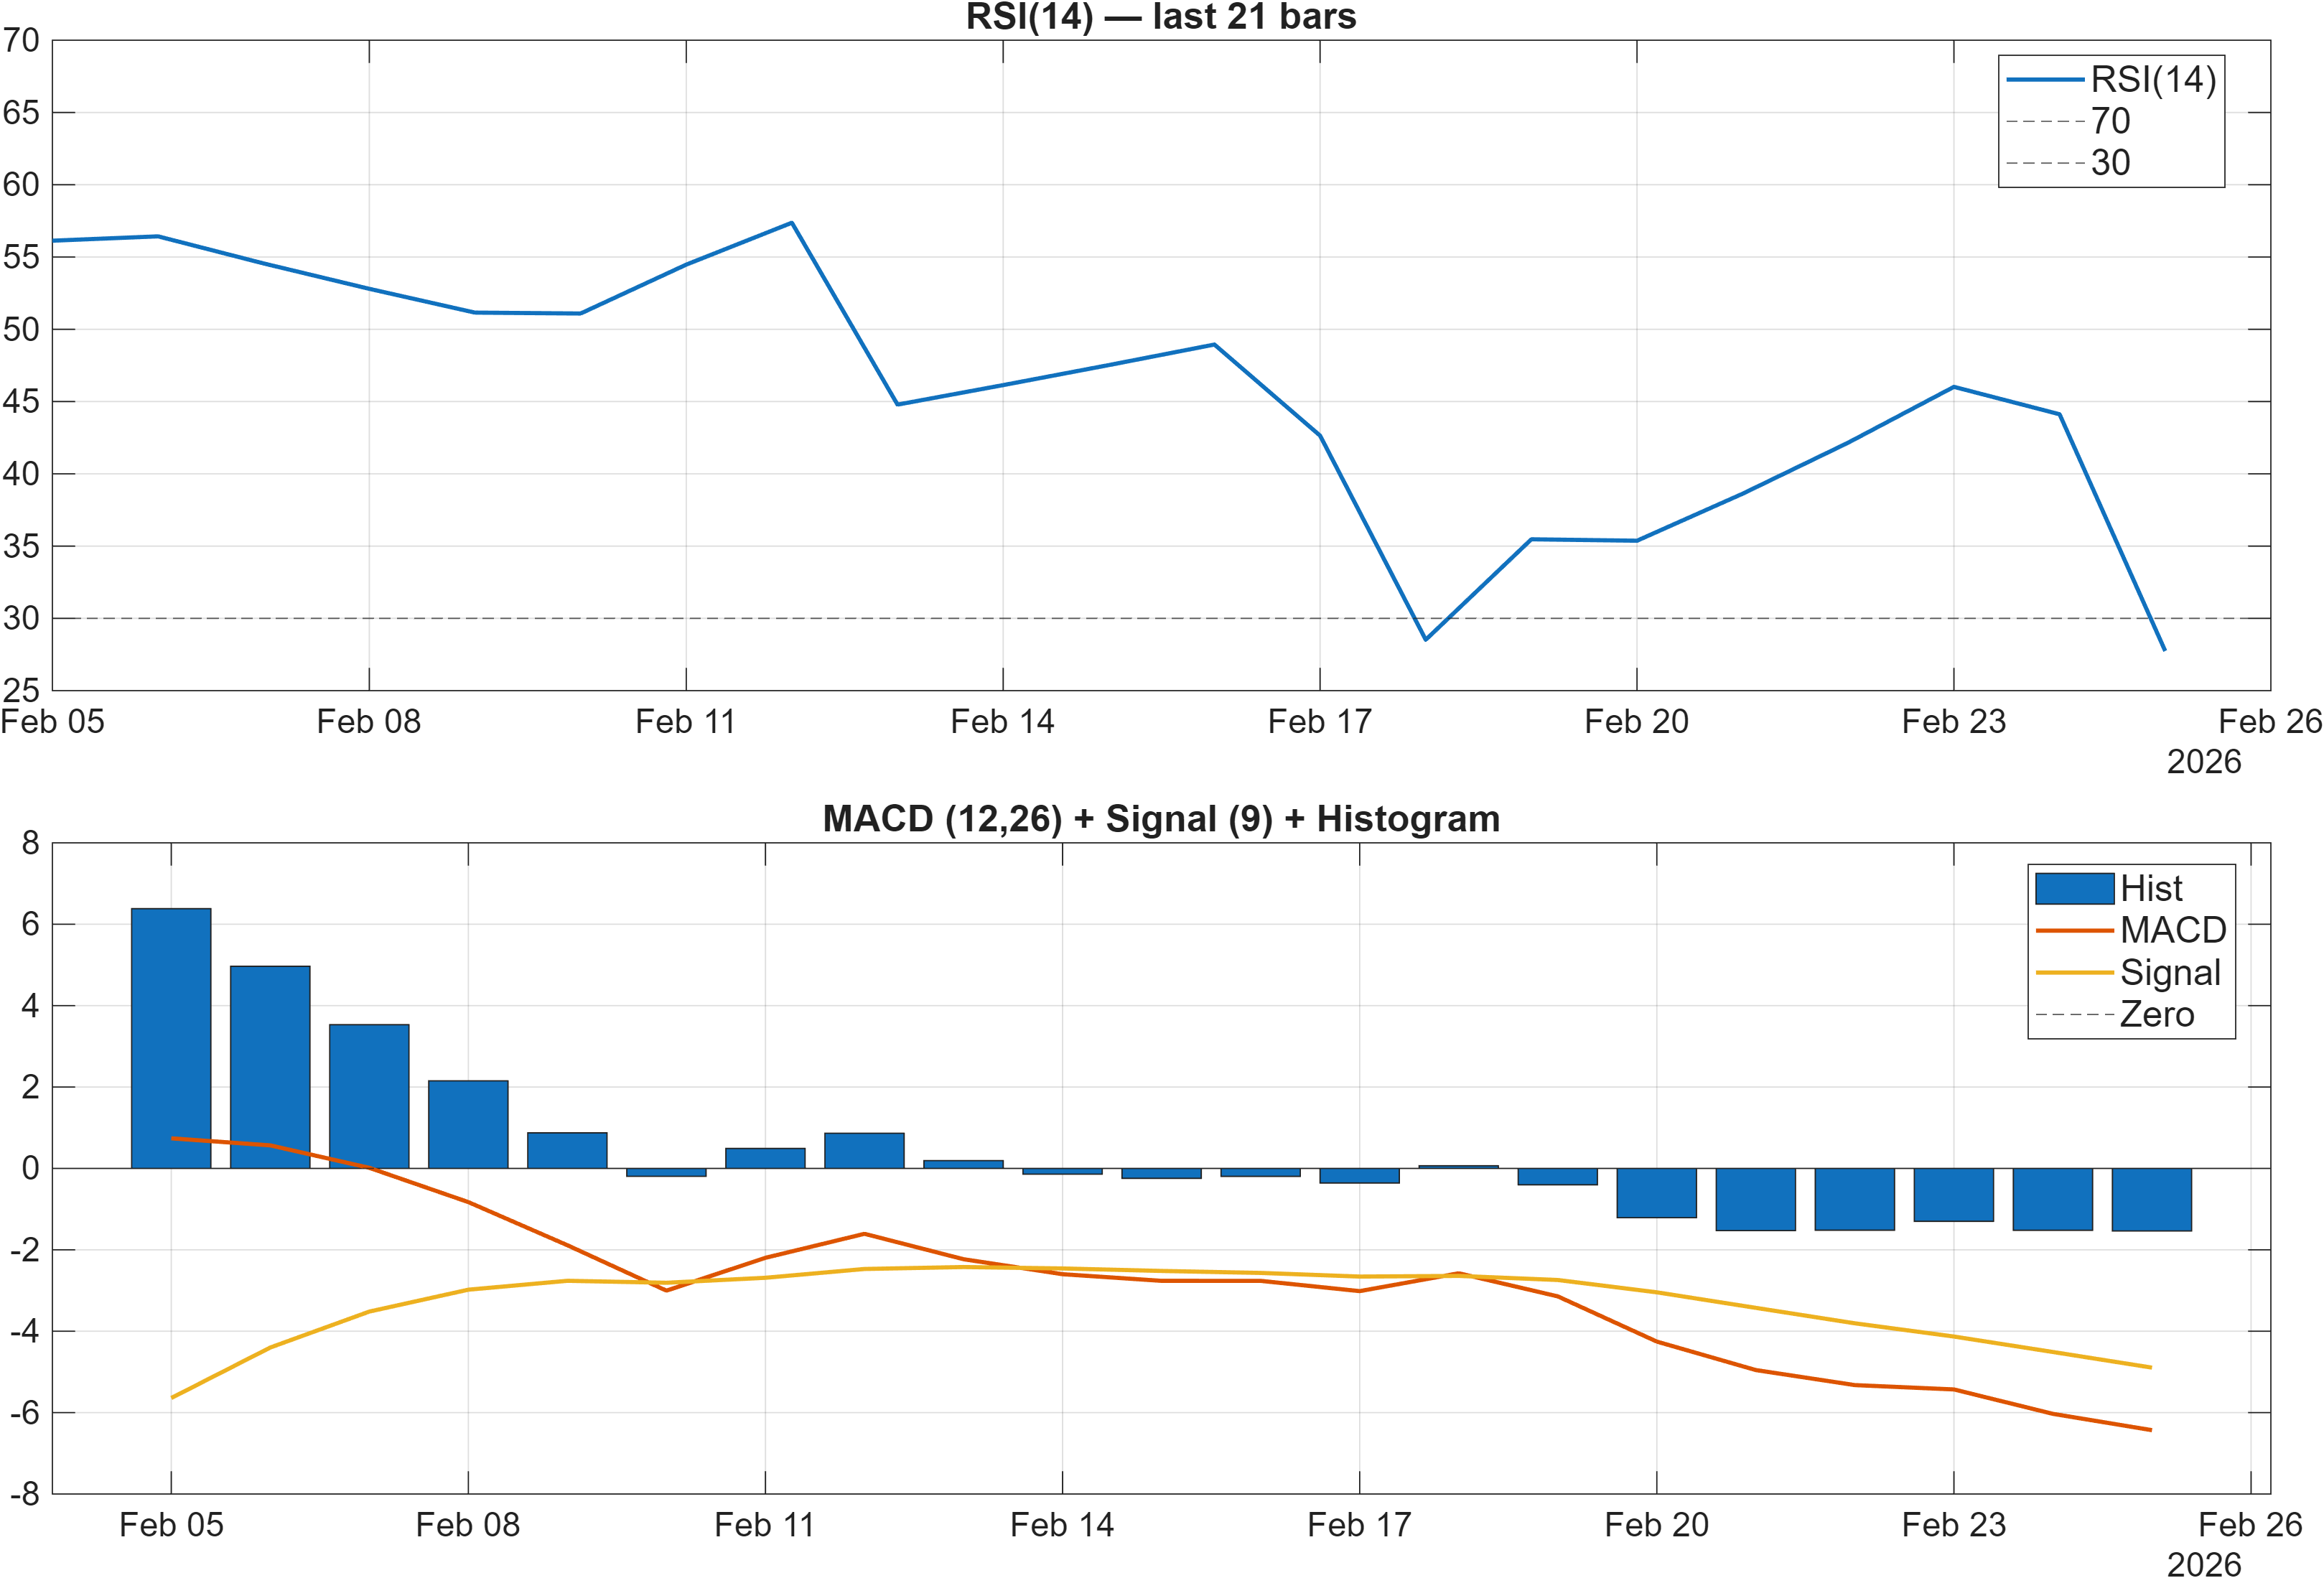
Interpretation: RSI bias = Bearish, MACD hist = -1.5368.
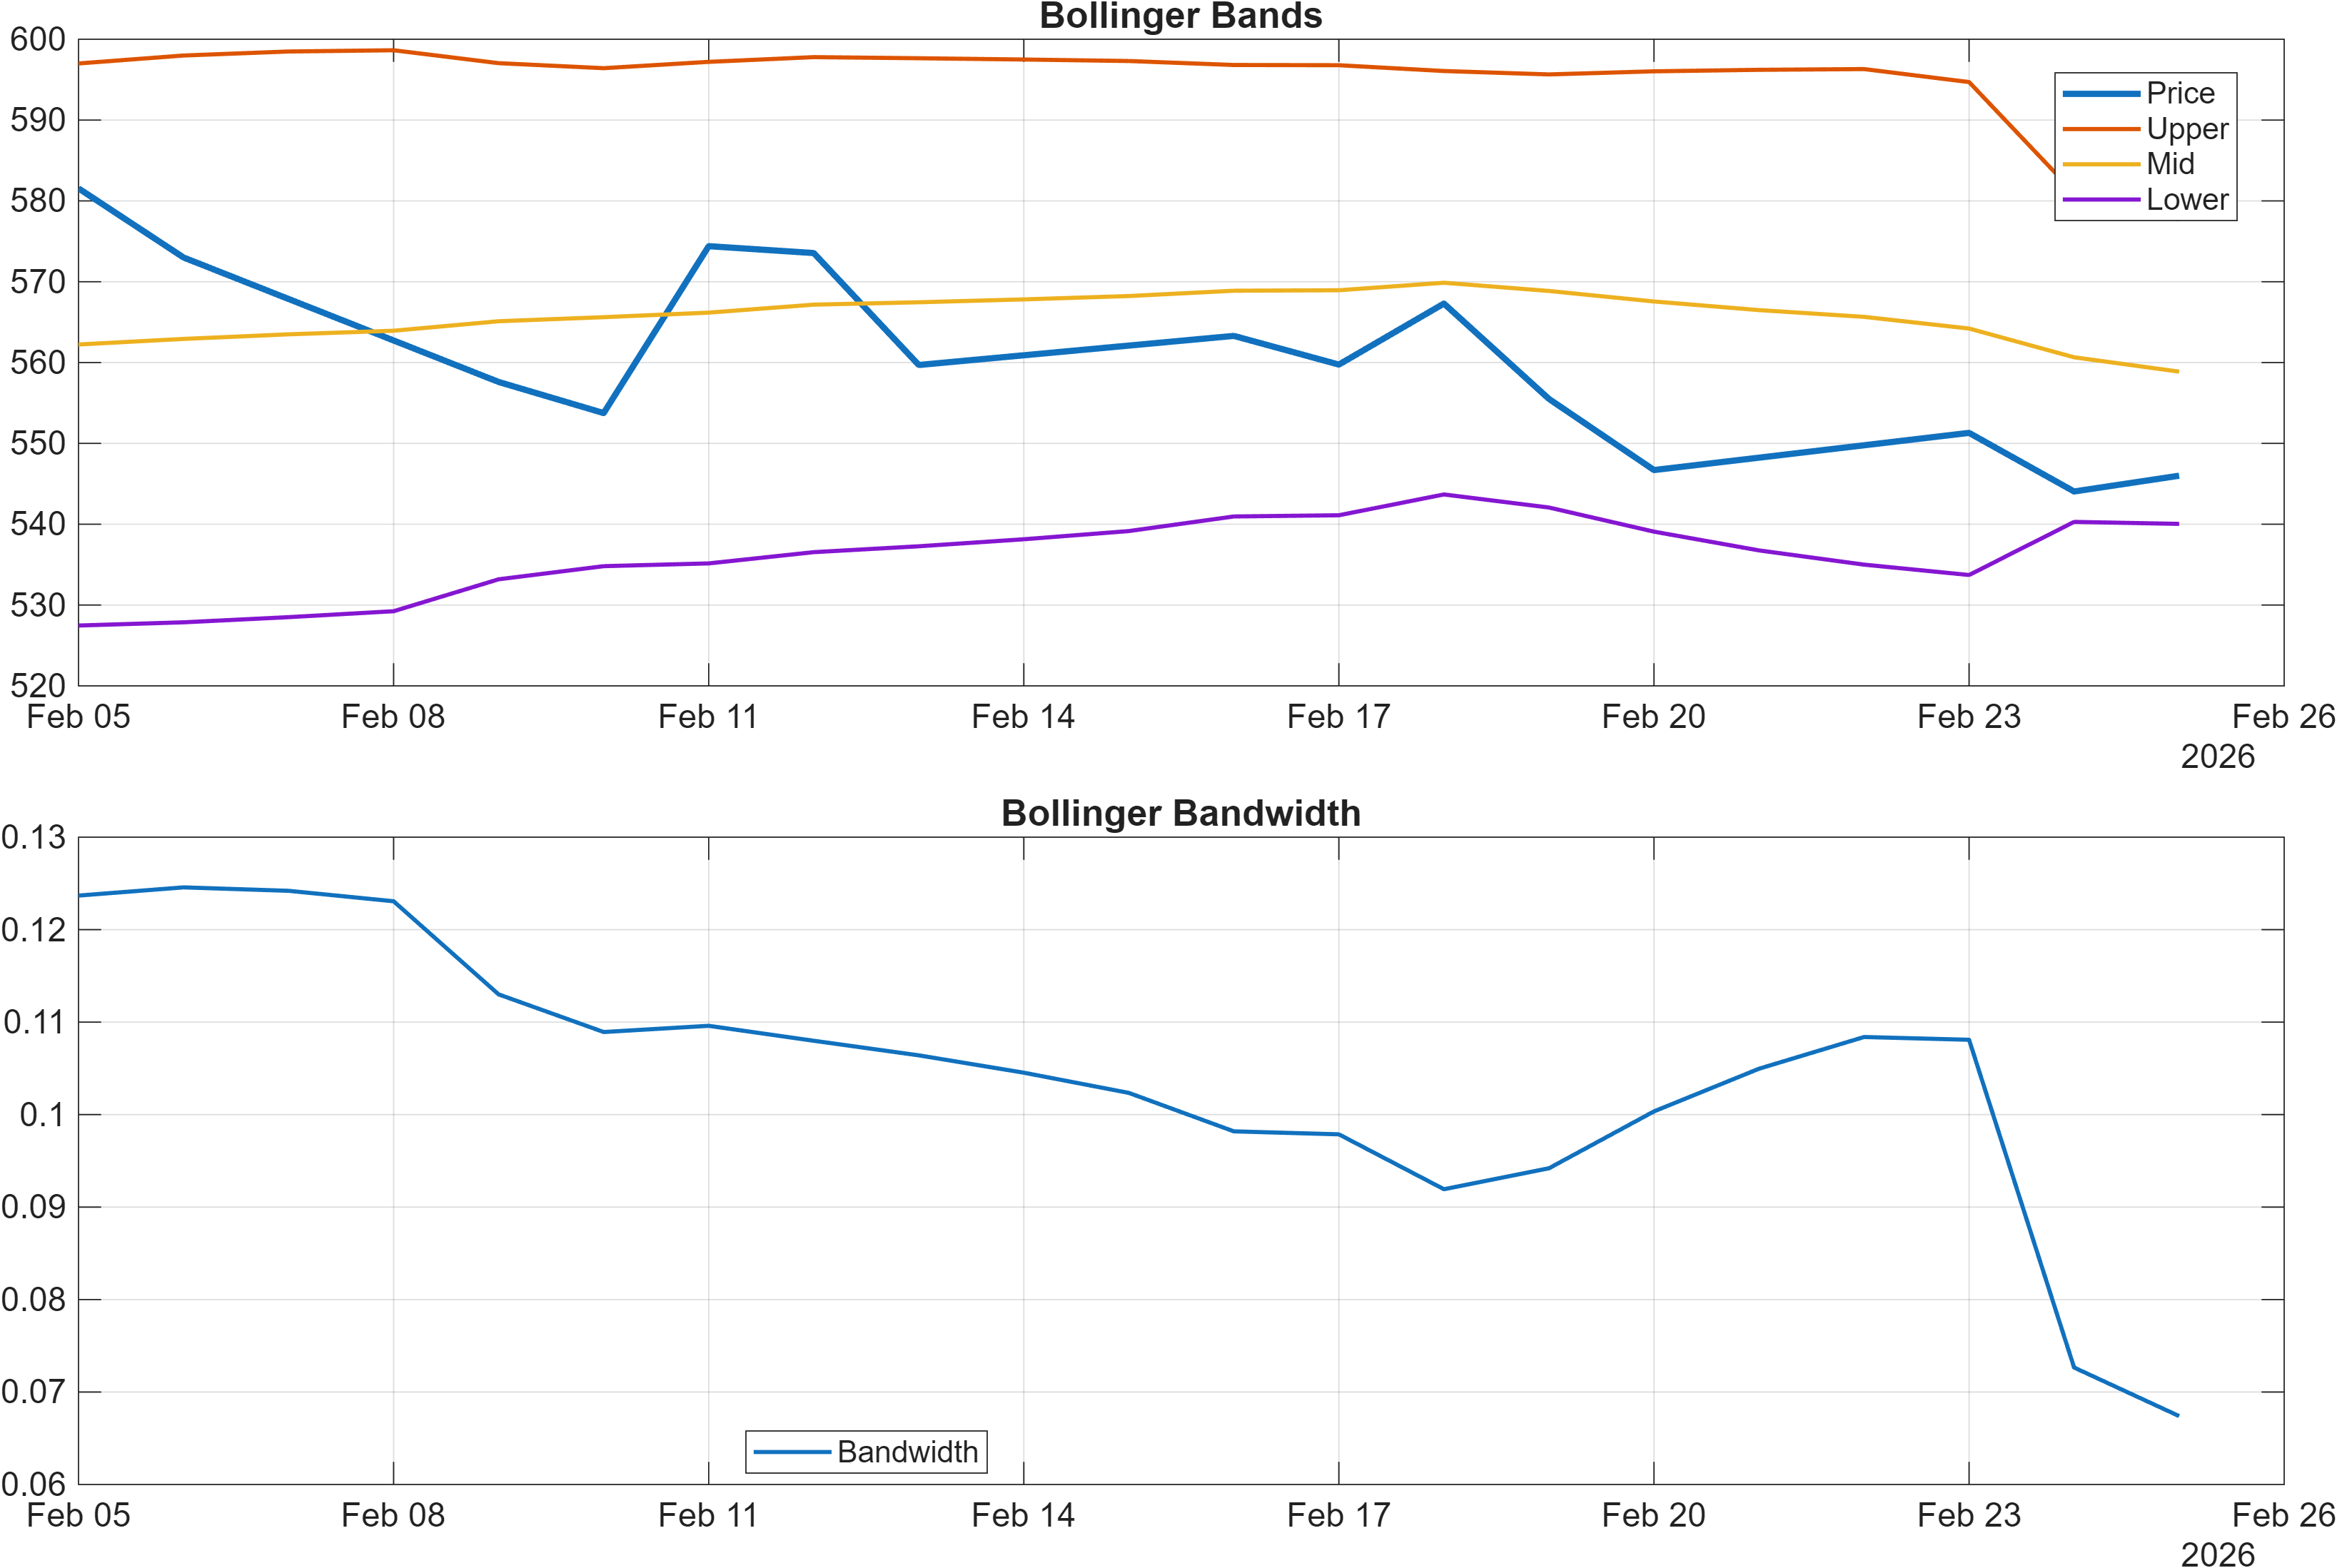
Interpretation: Bandwidth (volatility regime) latest = 0.0674.
Momentum pressure persists, while volatility compresses
Momentum is skewed bearish across core oscillators. The RSI(14) at 27.74 sits in a depressed zone and is explicitly labeled bearish, consistent with the broader downtrend filter. Meanwhile the MACD histogram at -1.5368 signals negative momentum persistence rather than a clean inflection, particularly when paired with trend weakness (MA50 below MA200).
The volatility picture is different: Bollinger bandwidth at 0.0674 indicates a compressed volatility regime. Compression can appear late in a trend (as selling pressure becomes less impulsive) or during a pause before another directional move. This introduces a signal compression vs. expansion tension: momentum remains weak, but realized volatility has tightened, raising the importance of level-based confirmation.
Several dashboard signals support the “pressure with selective stabilization” read. In the 18-signal table, ROC(20) is -4.712 and TS Mom(20) is -28.95, both bearish, reinforcing that the dominant impulse remains down. At the same time, a few accumulation-style measures are constructive (for example, ADOSC 46.81 is bullish), which can occur when bargain buying appears even while price structure has not yet recovered.
Overall, the combination of depressed RSI, negative MACD histogram, and tight Bollinger bandwidth keeps VARROC in a fragile state: stabilization is plausible, but the data provided does not yet describe a confirmed momentum reversal.
4) Support / Resistance zones
Support ~ 540.7250 | Resistance ~ 625.2167
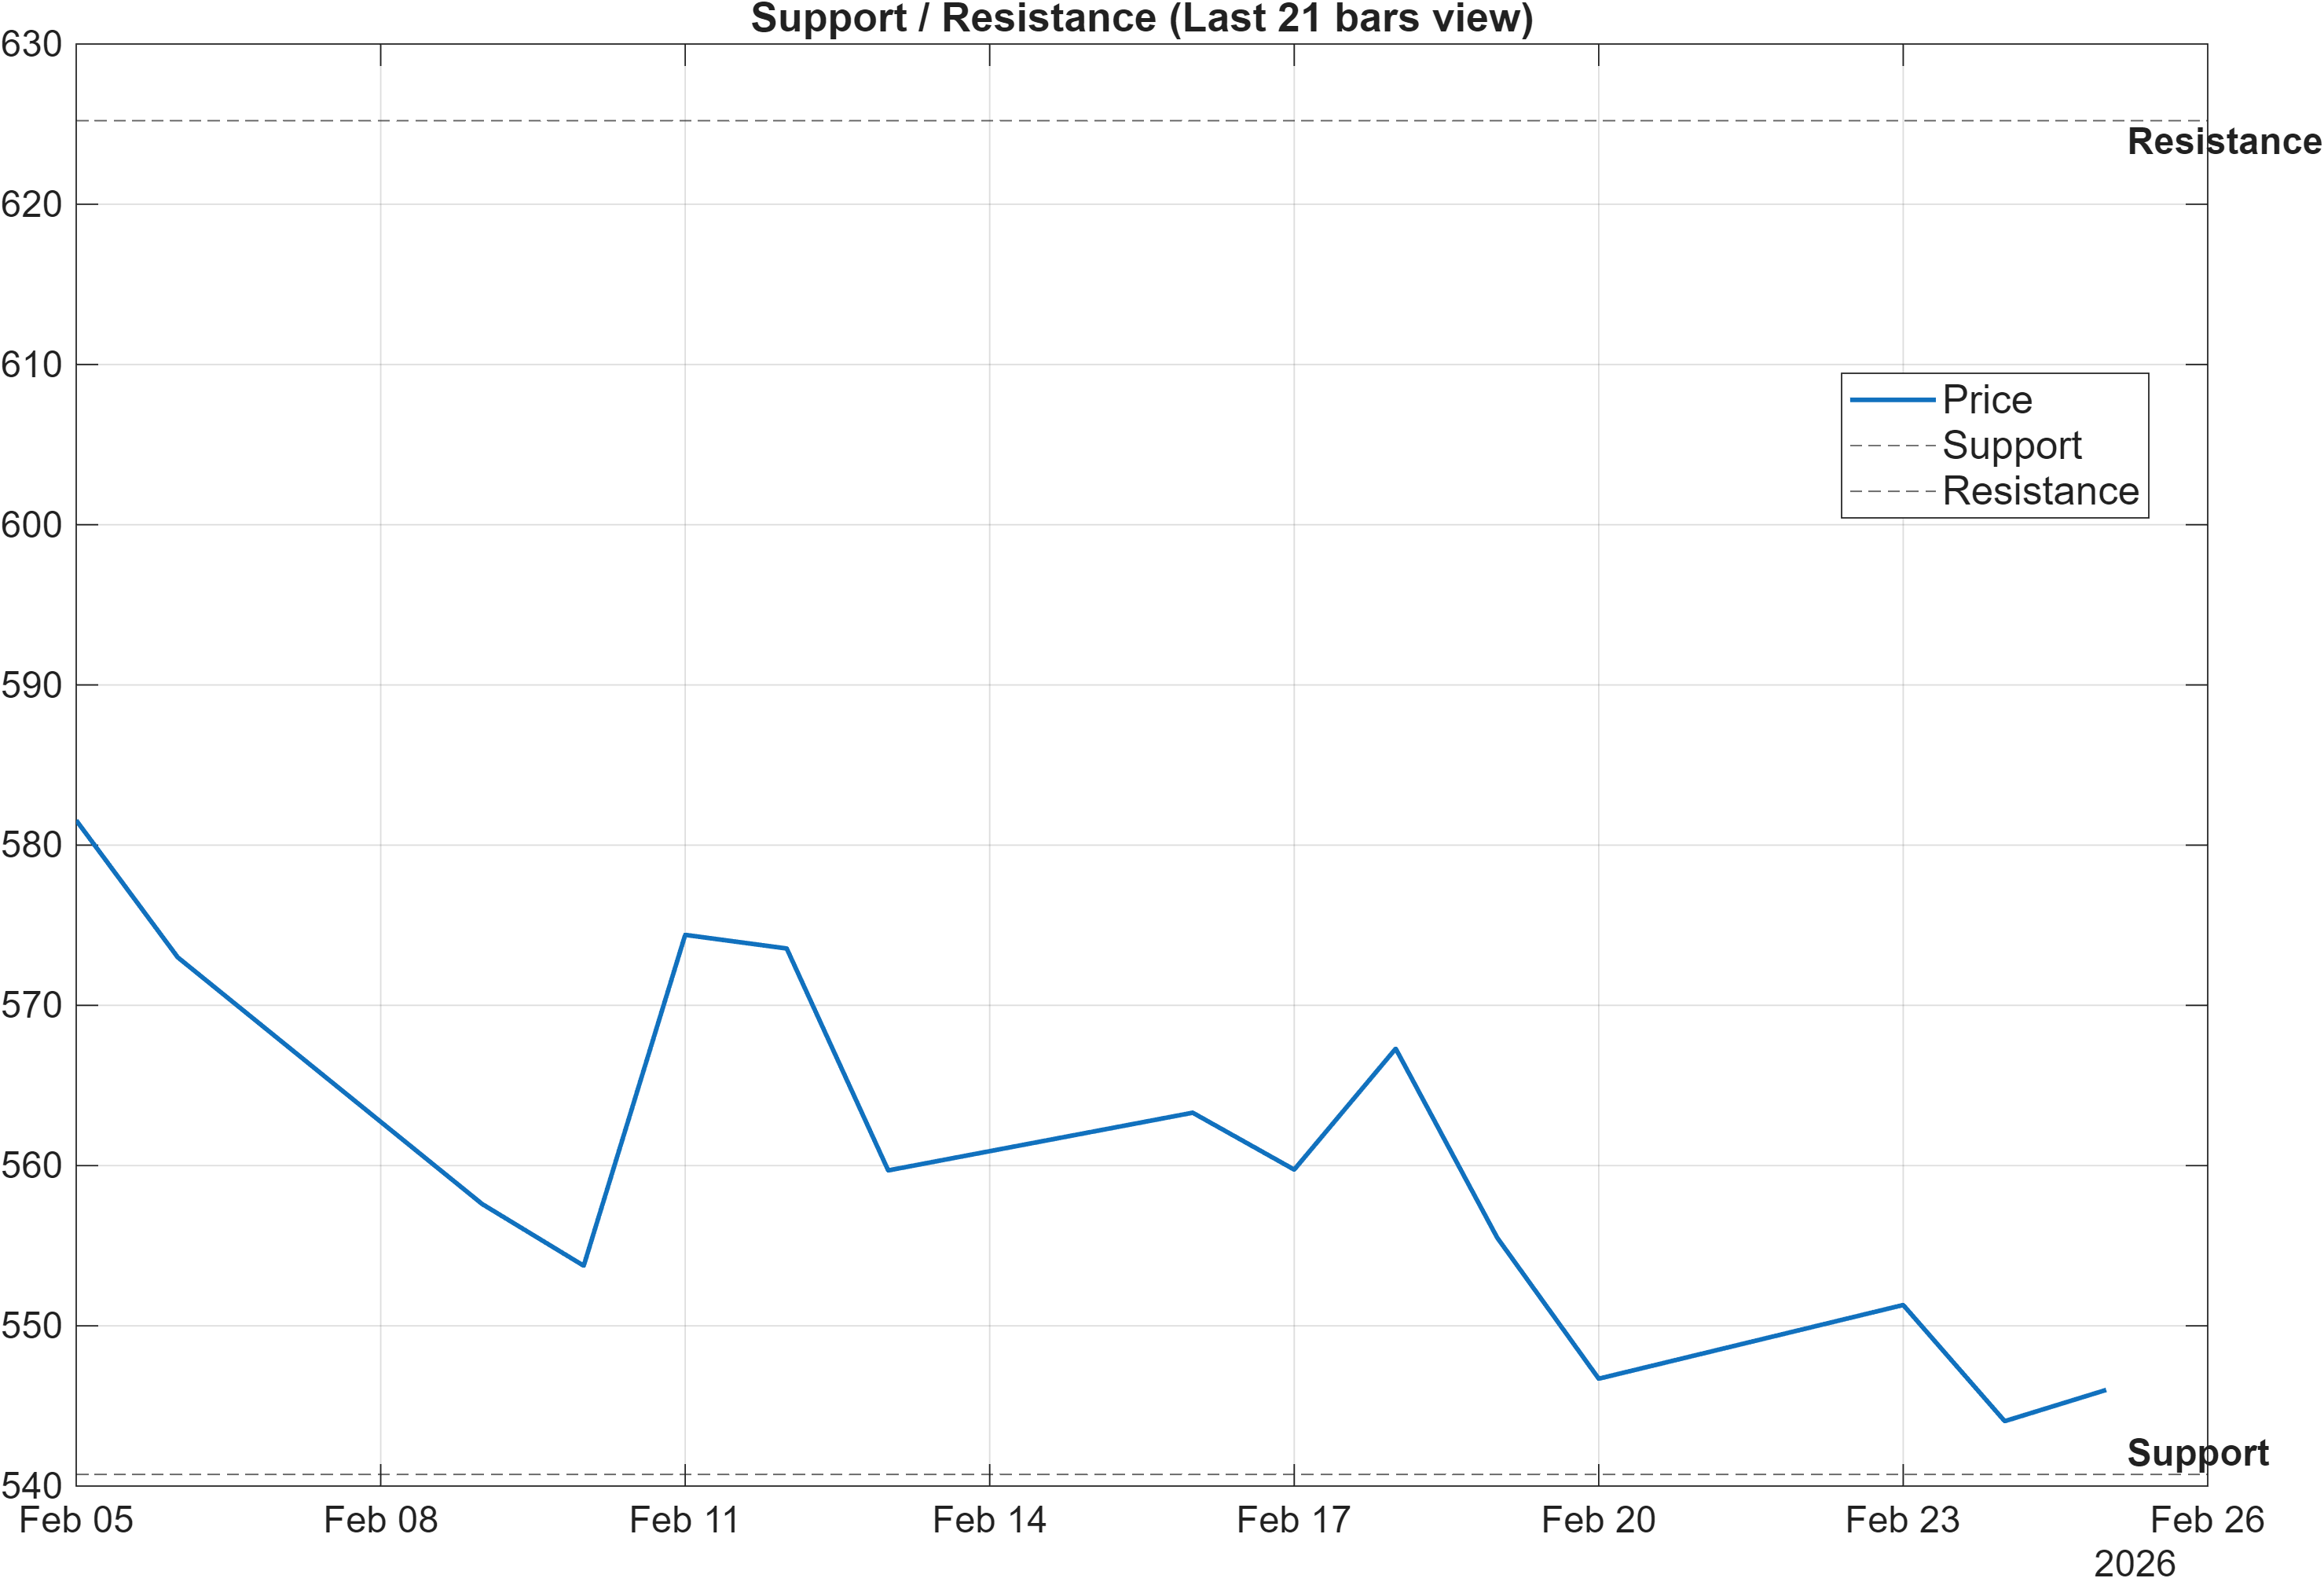
Scenario view: Break above resistance with volume → continuation. Close below support → signal deterioration risk.
Decision zones: defining invalidation in a bearish regime
With trend and momentum signals already bearish, the support/resistance map functions less as a forecast tool and more as a regime validation framework. The support zone around 540.7250 is the primary near-term “line in the sand”: failure to hold it would align with the already-weak daily and weekly ranks (#1102, #1154) and could reinforce the downside bias embedded in the blended technical score (-0.348).
Resistance near 625.2167 is the first meaningful area where a reversal thesis would need to prove itself. In a downtrend where the MA50 is below the MA200, initial rallies often stall at resistance before a durable trend change develops. A break above resistance with volume is therefore framed as confirmation, not as a baseline expectation.
The volatility regime adds nuance: with Bollinger bandwidth at 0.0674, price can spend time oscillating inside a narrowing range. In that environment, “false starts” are common—moves toward resistance that fail to sustain, or brief dips below support that quickly revert. That is why the scenario language emphasizes a close below support as deterioration risk, rather than intraday excursions.
For disciplined positioning, the cleanest structure is to treat these zones as probabilistic decision points: price acceptance above 625.2167 would challenge the bearish confluence, while acceptance below 540.7250 would tighten the case that the bearish stack remains intact.
5) Quant Technical Dashboard (18 Signals)
KGNAI AI Technical Analysis Score (Deep Reinforcement Learning): Rank #839 out of 1213 (Rank 1 represents the strongest technical positioning and a higher probability of favorable price behavior. As ranks increase toward the maximum, the probability of favorable outcomes weakens and bearish positioning becomes more dominant.) | Label: Neutral | Score: -0.383
18-Signal Technical Confluence Score: -0.333 (Bearish)
Overall Technical Score (18-signal confluence + DRL rank blend): -0.348 (Bearish)
Note: The blended score reflects signal strength weighted against broader AI technical ranking, which may temporarily diverge.
Blended technical score breakdown: -0.348 (Bearish | Bull 4 / Bear 10 / Neutral 4)
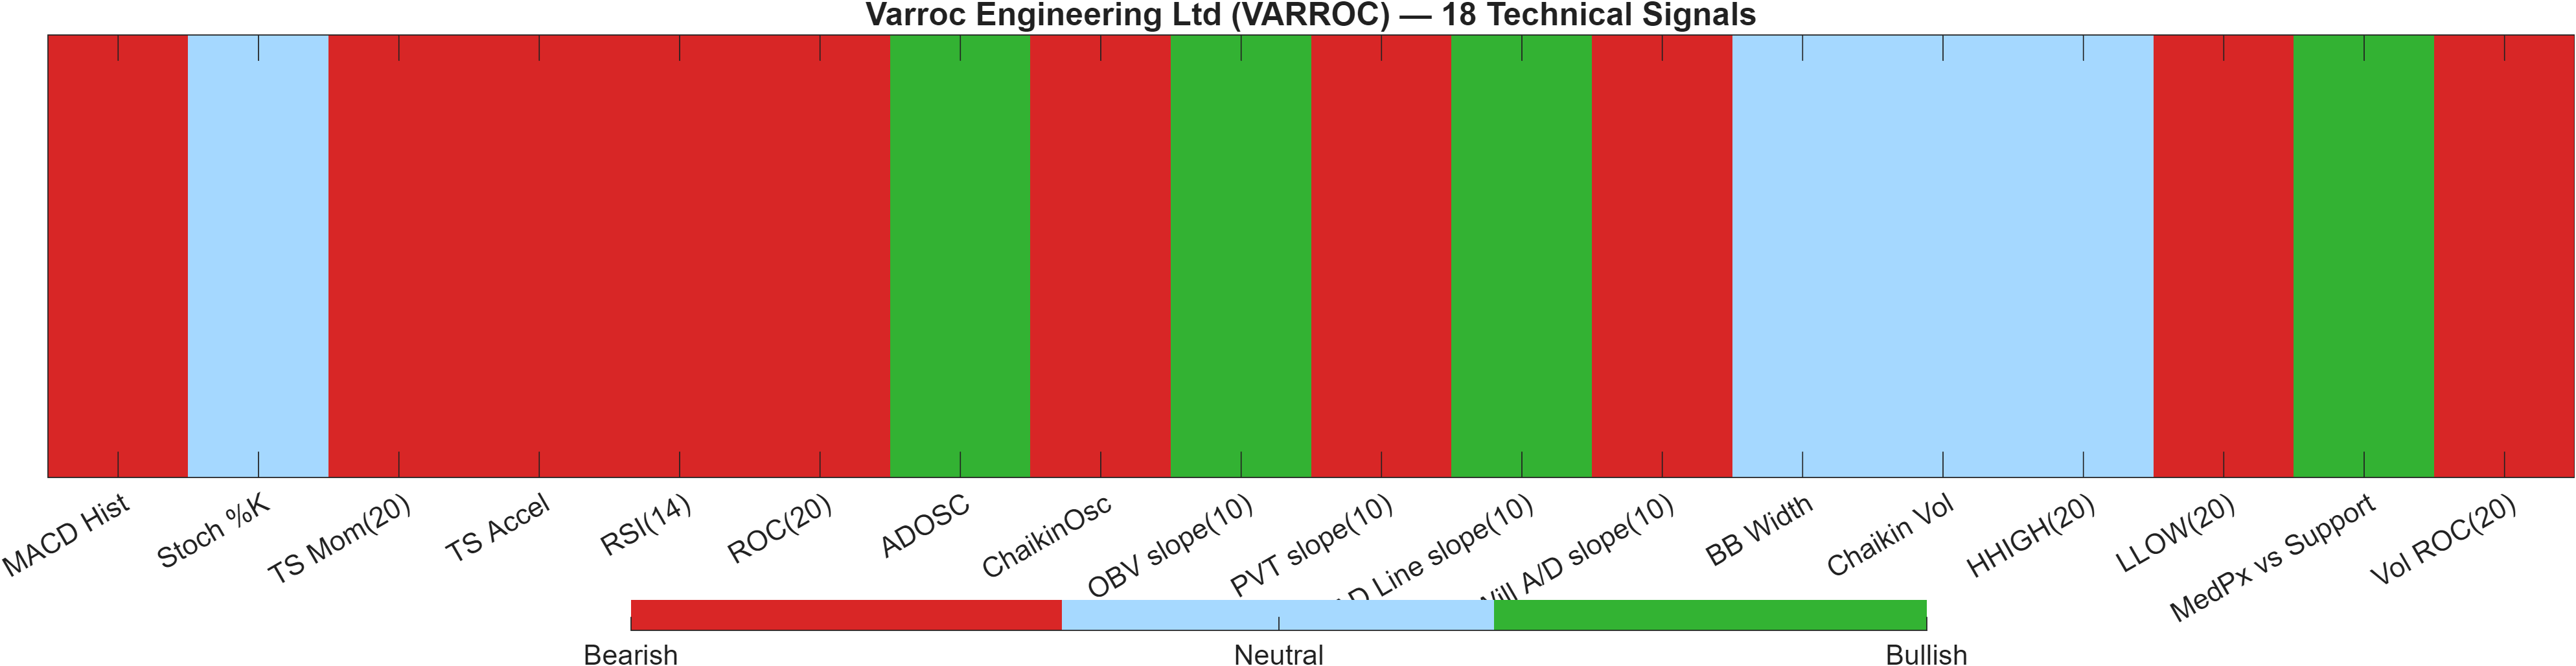
Signal table (Bull/Bear/Neutral)
| Indicator | Value | Signal |
|---|---|---|
| MACD Hist | -1.537 | Bearish |
| Stoch %K | 21.61 | Neutral |
| TS Mom(20) | -28.95 | Bearish |
| TS Accel | -45.43 | Bearish |
| RSI(14) | 27.74 | Bearish |
| ROC(20) | -4.712 | Bearish |
| ADOSC | 46.81 | Bullish |
| ChaikinOsc | -151.9 | Bearish |
| OBV slope(10) | 1.134e+04 | Bullish |
| PVT slope(10) | -58.18 | Bearish |
| AD Line slope(10) | 451.3 | Bullish |
| Will A/D slope(10) | -14 | Bearish |
| BB Width | 0.0674 | Neutral |
| Chaikin Vol | -23.81 | Neutral |
| HHIGH(20) | 590.5 | Neutral |
| LLOW(20) | 534.8 | Bearish |
| MedPx vs Support | 0.35 | Bullish |
| Vol ROC(20) | -80.85 | Bearish |
Interpretation: Indicator-level signals form the base confluence, which is then adjusted using a separate AI-driven technical ranking model. The final technical score summarizes this combined view.
Confluence: bearish breadth with small pockets of accumulation
The technical stack is dominated by bearish readings: the 18-signal confluence is -0.333 and the blended overall score is -0.348, with 10 bearish signals versus 4 bullish and 4 neutral. This breadth matters because it reduces the likelihood that the bearish read is being driven by a single indicator artifact.
Momentum and rate-of-change measures are central contributors. RSI(14) at 27.74, TS Accel at -45.43, and Vol ROC(20) at -80.85 collectively describe a market that has been moving down with weakening participation characteristics. In parallel, the MACD histogram (-1.537) remains bearish, reinforcing that the downside impulse has not fully mean-reverted.
The notable nuance is that a few volume/accumulation metrics are constructive—ADOSC 46.81, OBV slope(10) 1.134e+04, and AD Line slope(10) 451.3 are bullish—suggesting episodic accumulation or selective dip demand. However, this bullish pocket is not yet dominant enough to flip the aggregate label, especially with trend structure still bearish and Bollinger width (0.0674) indicating compression rather than a confirmed upside expansion.
The DRL technical rank at #839 is labeled neutral while carrying a negative score (-0.383), which is consistent with a market that may be stabilizing in microstructure terms but remains weak on broader confluence.
6) News sentiment + extractive gist
Note: Instrument-specific news matches were not found, so the digest includes broader market/sector headlines. Links are provided for verification.
Sentiment score (avg): 0.076 | Positive: 31% | Neutral: 69% | Negative: 0%
KGNAI AI News Sentiment Score (normalized -1 to +1): Not available (as of —) | Label: Not available | Overall news score: 0.08
Positive Developments
Recent coverage across major financial outlets indicates a mildly constructive backdrop for risk assets in select pockets, including technology- and AI-adjacent themes, alongside isolated company-level earnings strength in parts of the US market. In the provided dataset, this comes through as a positive share (31%) of items and a low-but-positive average sentiment score (0.076), with no negative items recorded. For VARROC, the key limitation is that the feed is not instrument-specific, so the positive tone should be treated as contextual rather than directly explanatory of price action. Still, a constructive risk tone can matter at the margin when the chart is in a compressed volatility state (bandwidth 0.0674), because small shifts in broader risk appetite can influence whether price tests 625.2167 or reverts toward 540.7250.
Neutral / Mixed Developments
The neutral skew (69%) suggests an information-heavy cycle with limited directional conviction. Coverage highlights ongoing market volatility and range-trading conditions in broader benchmarks, which can translate into choppy flows for individual names—particularly those already in weaker technical regimes. For VARROC, that “mixed” context aligns with the report’s internal picture: the DRL technical rank (#839) is neutral while the confluence score remains bearish (-0.333), a combination that often accompanies stabilization attempts without a confirmed trend reversal. With sentiment signals themselves labeled Not available at the normalized score level, interpretation should stay anchored to price structure and the defined decision zones rather than relying on narrative confirmation.
Negative / Risk Signals
Even with 0% negative in the provided sentiment split, risk signals still exist in the form of macro and policy uncertainty referenced across aggregated market coverage. These themes tend to raise the probability of sudden volatility expansion—relevant when Bollinger bandwidth is already tight at 0.0674. For VARROC, the principal risk is not a sentiment “shock” visible in the dataset, but rather technical fragility: depressed momentum (RSI 27.74; MACD histogram -1.5368) combined with a bearish trend filter. In that setup, adverse market-wide moves can more easily translate into a support test near 540.7250, where the report explicitly flags deterioration risk on a close below that level.
What to monitor next
- Whether price acceptance develops above 625.2167 (resistance) alongside improving momentum (RSI stabilization above 27.74).
- Any volatility expansion from the compressed regime (bandwidth 0.0674) and whether it occurs with bullish or bearish follow-through.
- Closes relative to 540.7250 (support), given the bearish rank stack (daily #1102, weekly #1154).
Sources referenced: Reuters, Bloomberg, Yahoo Finance, MarketWatch, Investing.com
Snapshot: AI Rank (Short–Mid–Long): Bearish (Bearish–Bearish–Bearish) · Technical Confluence: Bearish · Key Levels: Support ~540.73 | Resistance ~625.22 · News Sentiment: Neutral
7) Sources
Not available in the provided data.
You may also like: How KGNAI AI ranks instruments across global markets
Disclaimer: KGNAI provides AI-generated analytics and educational market commentary only. This is not financial advice. Markets involve risk. Always do your own research.