
AMD (Advanced Micro Devices Inc) — 06-Mar-2026 Technical & Rank View Stays Neutral with Mixed Mid-Term Bias
Advanced Micro Devices Inc (AMD) sits in a largely range-to-transition posture as of 06-Mar-2026, with cross-horizon ranks clustering around neutral while the monthly profile leans weaker. Within a 2066-instrument universe, AMD’s Daily rank (#1324) and Weekly rank (#1362) both read Neutral, while the Monthly rank (#1699) is Bearish—suggesting that short-term stabilization has not fully repaired the mid-term relative standing. On the technical side, moving-average structure remains bearish (close below MA50; MA50 below MA200), yet momentum diagnostics are more balanced: RSI(14) at 49.39 is neutral and MACD histogram at 0.6608 is constructive. Volatility is relatively contained with Bollinger Bandwidth at 0.0975, keeping key decision levels in focus: support ~194.4900 and resistance ~256.7400. News sentiment scores read bullish in aggregate despite a mostly neutral article mix.
- Short / Mid / Long stance: Neutral / Bearish / Neutral (from KGNAI rank horizons)
- Technical confluence label: Neutral (18-signal confluence 0.111; blended technical score 0.275)
- Key levels: Support ~ 194.4900 | Resistance ~ 256.7400
- News sentiment bias: Bullish-leaning score (normalized 0.79) with predominantly neutral distribution (71%)
- Confirmation / invalidation: Strength is better confirmed on a break above 256.7400 with volume; deterioration risk increases on a close below 194.4900
What KGNAI Measures
KGNAI evaluates assets using large cross-sectional datasets built from millions of structured data points. Inputs incorporate fundamental metrics, technical structures, and systematically processed news sentiment. Statistical models, machine learning, and AI frameworks are used to assess relative positioning, signal alignment, and probabilistic behavior across broad universes.
How to Read This Report
- Ranks are comparative across the tracked universe, not absolute price targets.
- Confluence reflects alignment among independent signal groups.
- Support/resistance levels are probabilistic decision zones, not guarantees.
- Sentiment provides contextual bias within the broader analytical framework.
KGNAI Signal + Technical Snapshot + News Sentiment Digest
As of: 06-Mar-2026
Ticker: AMD
1) KGNAI AI Analysis
Region: USA
Total universe size: 2066 ranked instruments
- Daily rank: #1324 out of 2066 — Neutral
- Weekly rank: #1362 out of 2066 — Neutral
- Monthly rank: #1699 out of 2066 — Bearish
- 3-Monthly rank: #1589 out of 2066 — Neutral
- 6-Monthly rank: #1279 out of 2066 — Neutral
- Yearly rank: #1435 out of 2066 — Neutral
AMD’s rank profile is characterized by broad neutrality with a mid-term soft spot. The Daily and Weekly ranks (both in the lower-to-mid range of the distribution) indicate that near-term relative behavior is not strongly directional within the 2066-instrument universe. The Monthly rank at #1699 pushes into the weaker portion of the universe, which is consistent with a mid-term drag that has not fully normalized.
The 3-Monthly rank (#1589) remains Neutral, implying that the monthly bearishness is not fully reinforced across adjacent horizons. Meanwhile, the 6-Monthly rank (#1279) and Yearly rank (#1435) are Neutral, suggesting that longer-horizon relative positioning is not conclusively negative—more consistent with regime ambiguity than a clean downtrend dominance.
The practical implication of this cross-horizon spread is a higher requirement for confirmation: when short-term ranks stabilize while the monthly rank stays bearish, the market is often differentiating between a tactical rebound and a structurally improving profile. In this context, price/technical confirmation (trend structure, momentum persistence, and behavior around key levels) carries more weight than any single horizon reading.
KGNAI ranks each instrument across large universes using multiple proprietary AI tests and statistical models (millions of data points). Lower ranks generally indicate stronger probability of favorable performance behavior, while higher ranks indicate weaker probability and more bearish positioning.
Term view: Short-term: Neutral. Mid-term: Bearish. Long-term: Neutral.
Want the full universe and complete rank tables? Unlock full access on KGNAI: https://www.kgnai.com/pricing
2) Price & trend overview
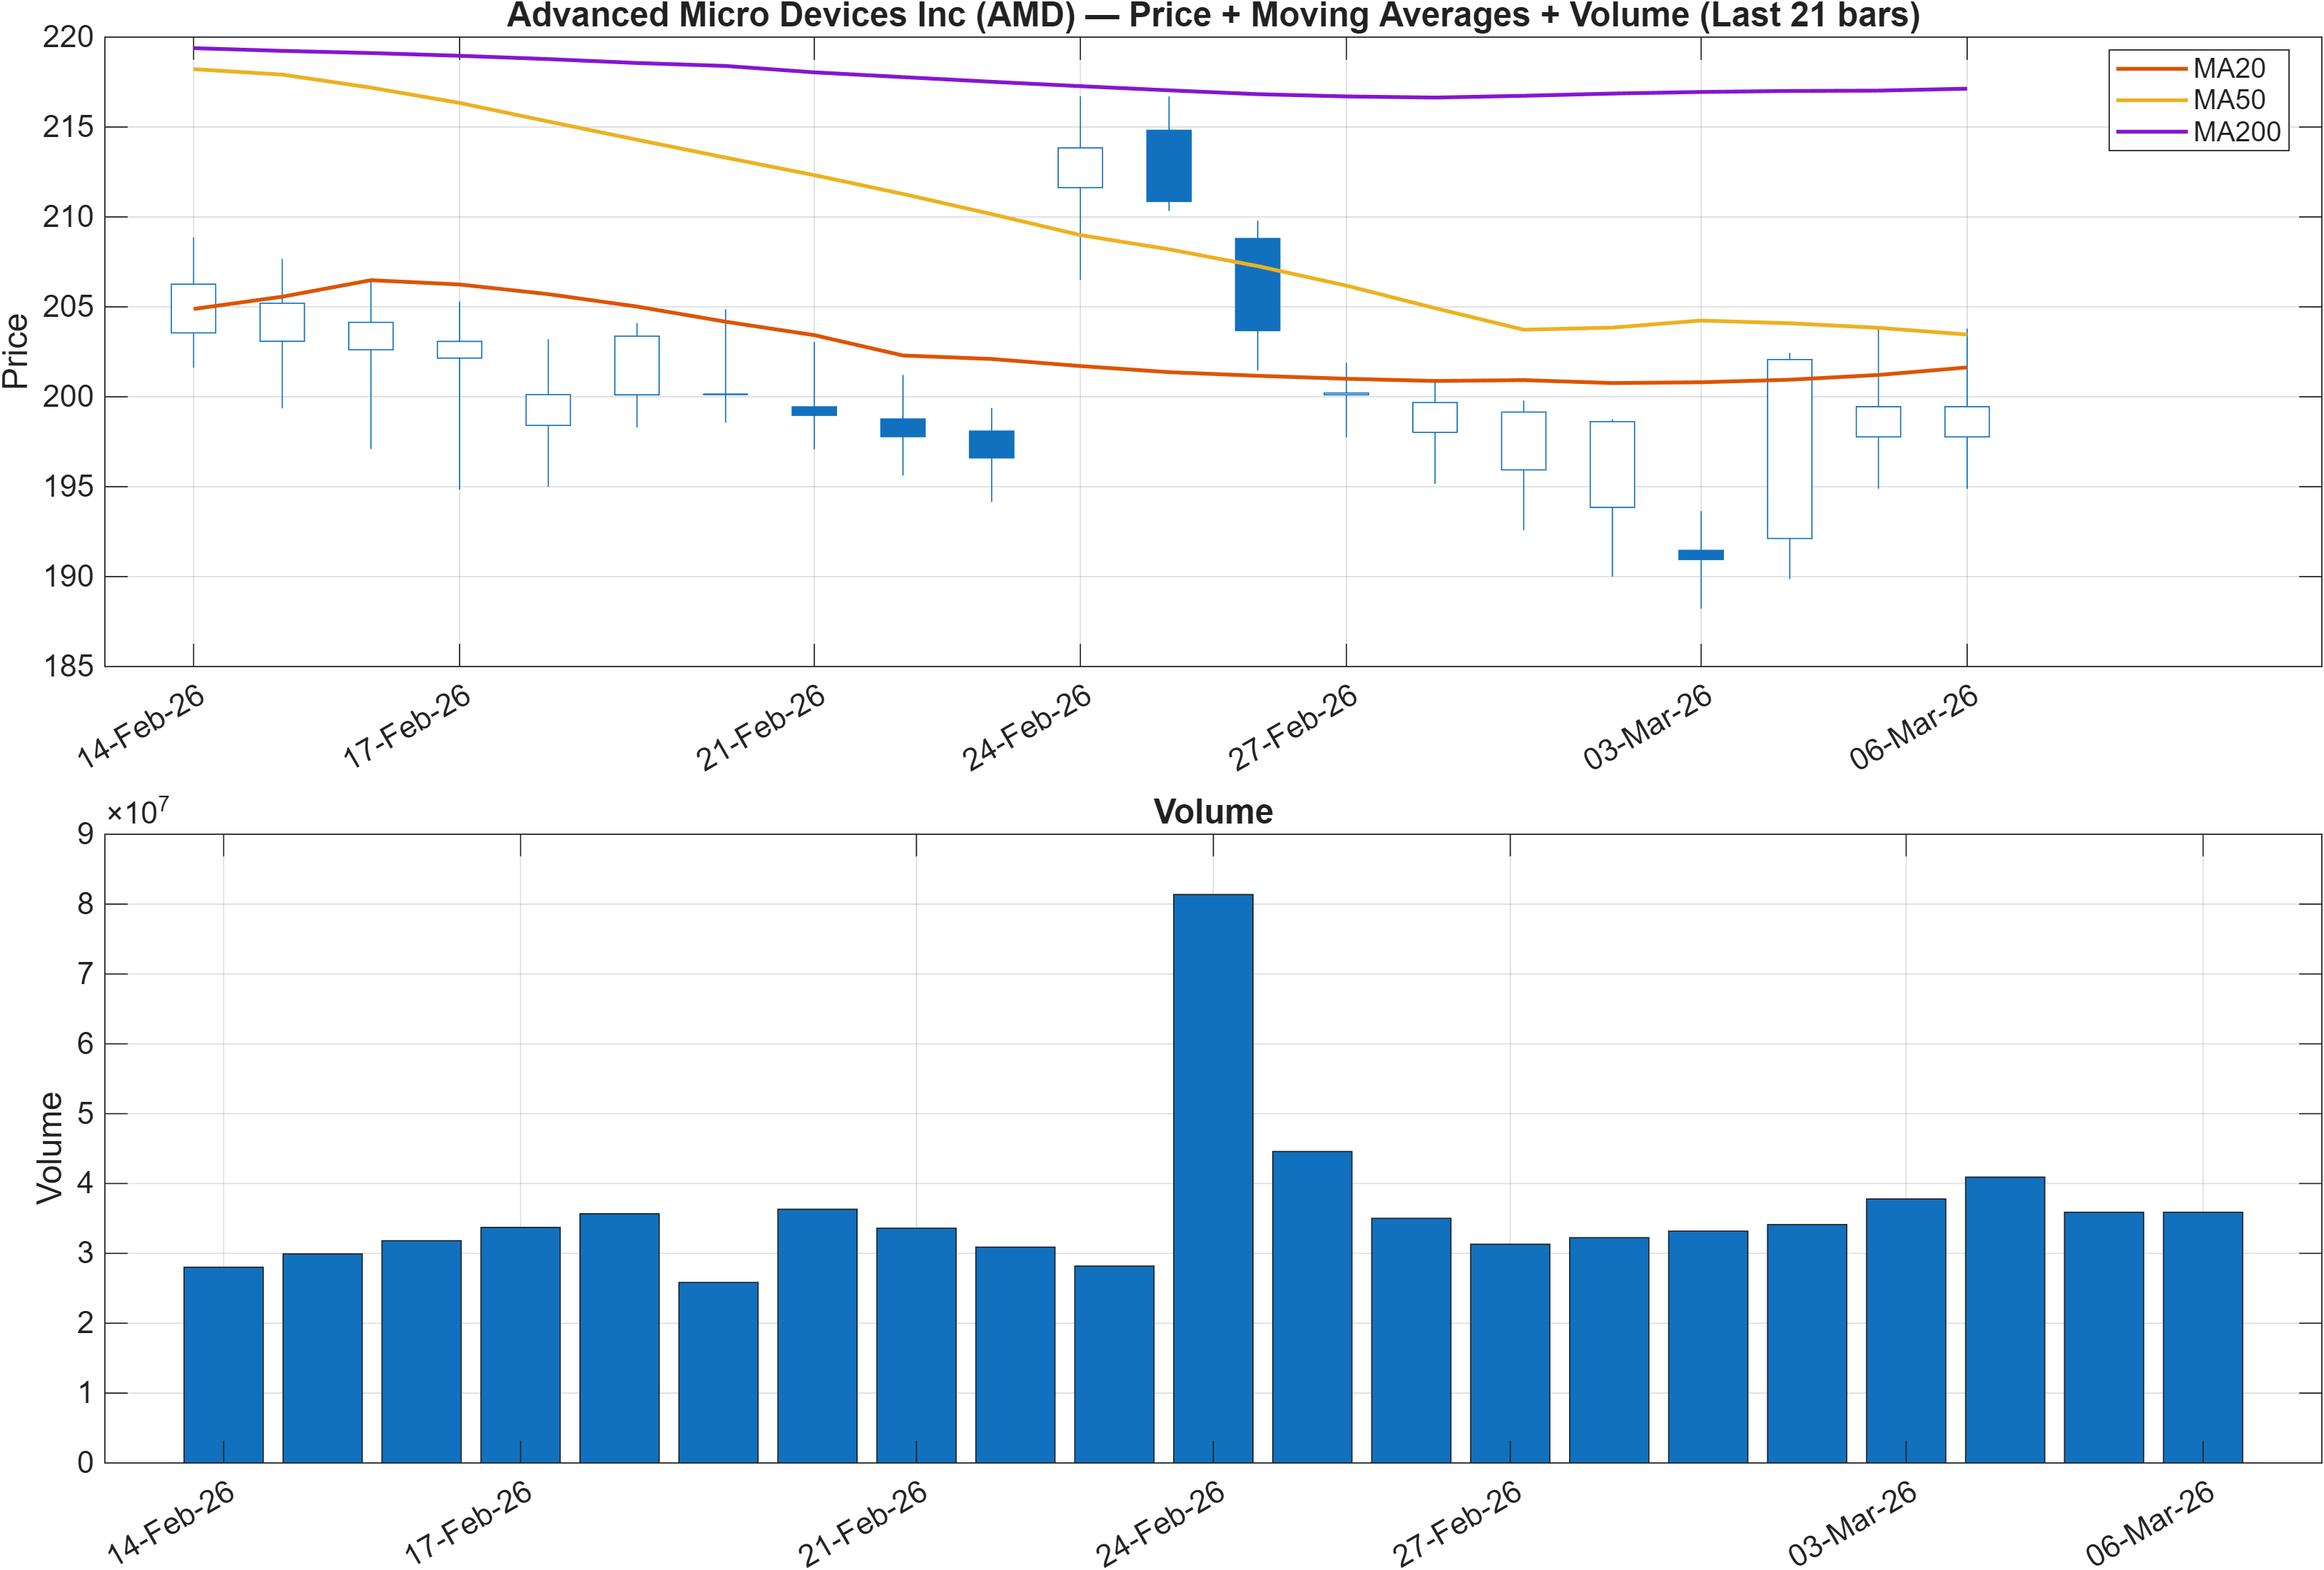
The trend layer remains the most skeptical component of the stack. With close vs MA50 = Bearish and MA50 vs MA200 = Bearish, the moving-average structure indicates that the intermediate trend is still positioned below its longer-term baseline—often associated with a market that requires repeated evidence of demand before being reclassified as a sustained uptrend.
This bearish MA alignment contrasts with the more balanced momentum picture elsewhere (notably a neutral RSI bias and a positive MACD histogram 0.6608). That divergence matters: when momentum improves but trend structure lags, the common failure mode is a rebound that fades before a higher-level trend reversal is established. Conversely, if momentum remains constructive long enough, MA50 can begin to flatten and eventually re-cross, reducing the “overhead” trend constraint.
The key is whether price action can build acceptance away from the lower boundary of the active range while remaining responsive to volume confirmation (see the support/resistance framework later). In a bearish MA regime, rallies that cannot hold gains tend to retrace quickly; sustained improvement usually shows up as progressively higher reaction lows and fewer downside expansions. For AMD, this makes the upcoming interactions with 194.4900 (support) and 256.7400 (resistance) especially informative for trend classification.
3) Momentum & volatility dashboard
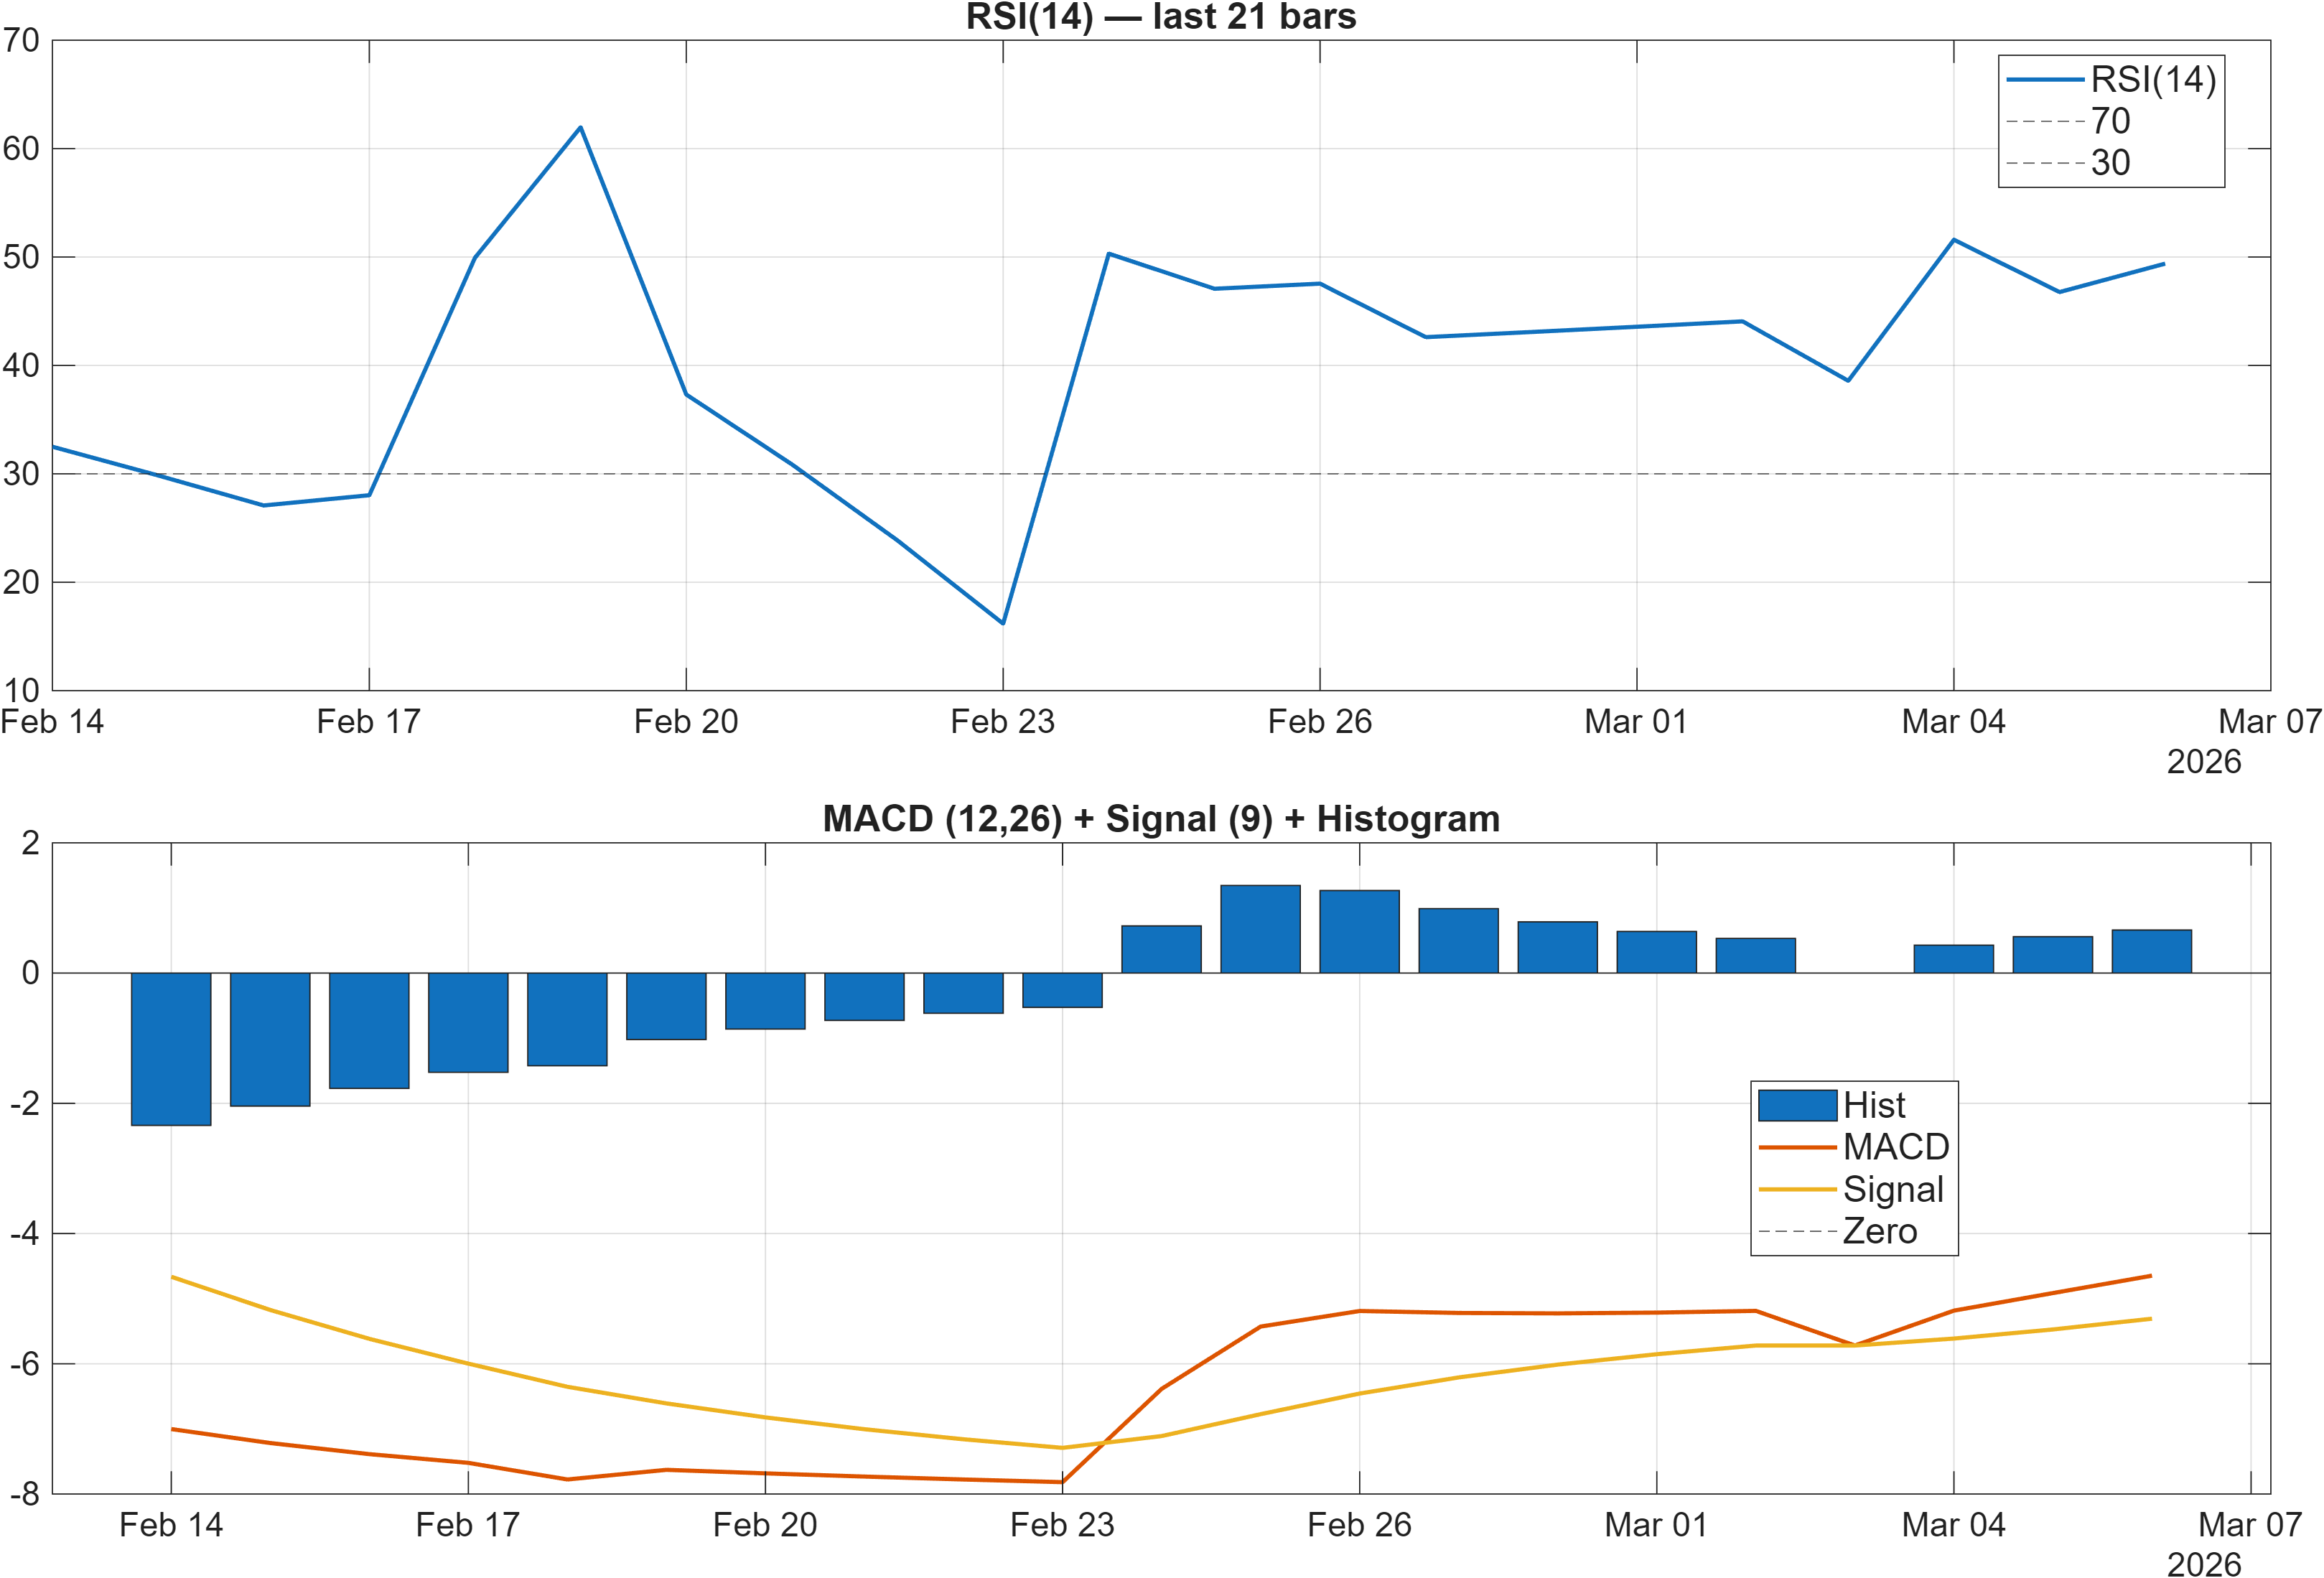
Momentum signals are not fully aligned, but they lean toward stabilization rather than acceleration. RSI(14) at 49.39 sits close to the midpoint, consistent with a neutral bias and limited directional urgency. At the same time, the MACD histogram at 0.6608 is labeled bullish, which can indicate that downside momentum has eased and that the market is attempting to rebuild positive impulse.
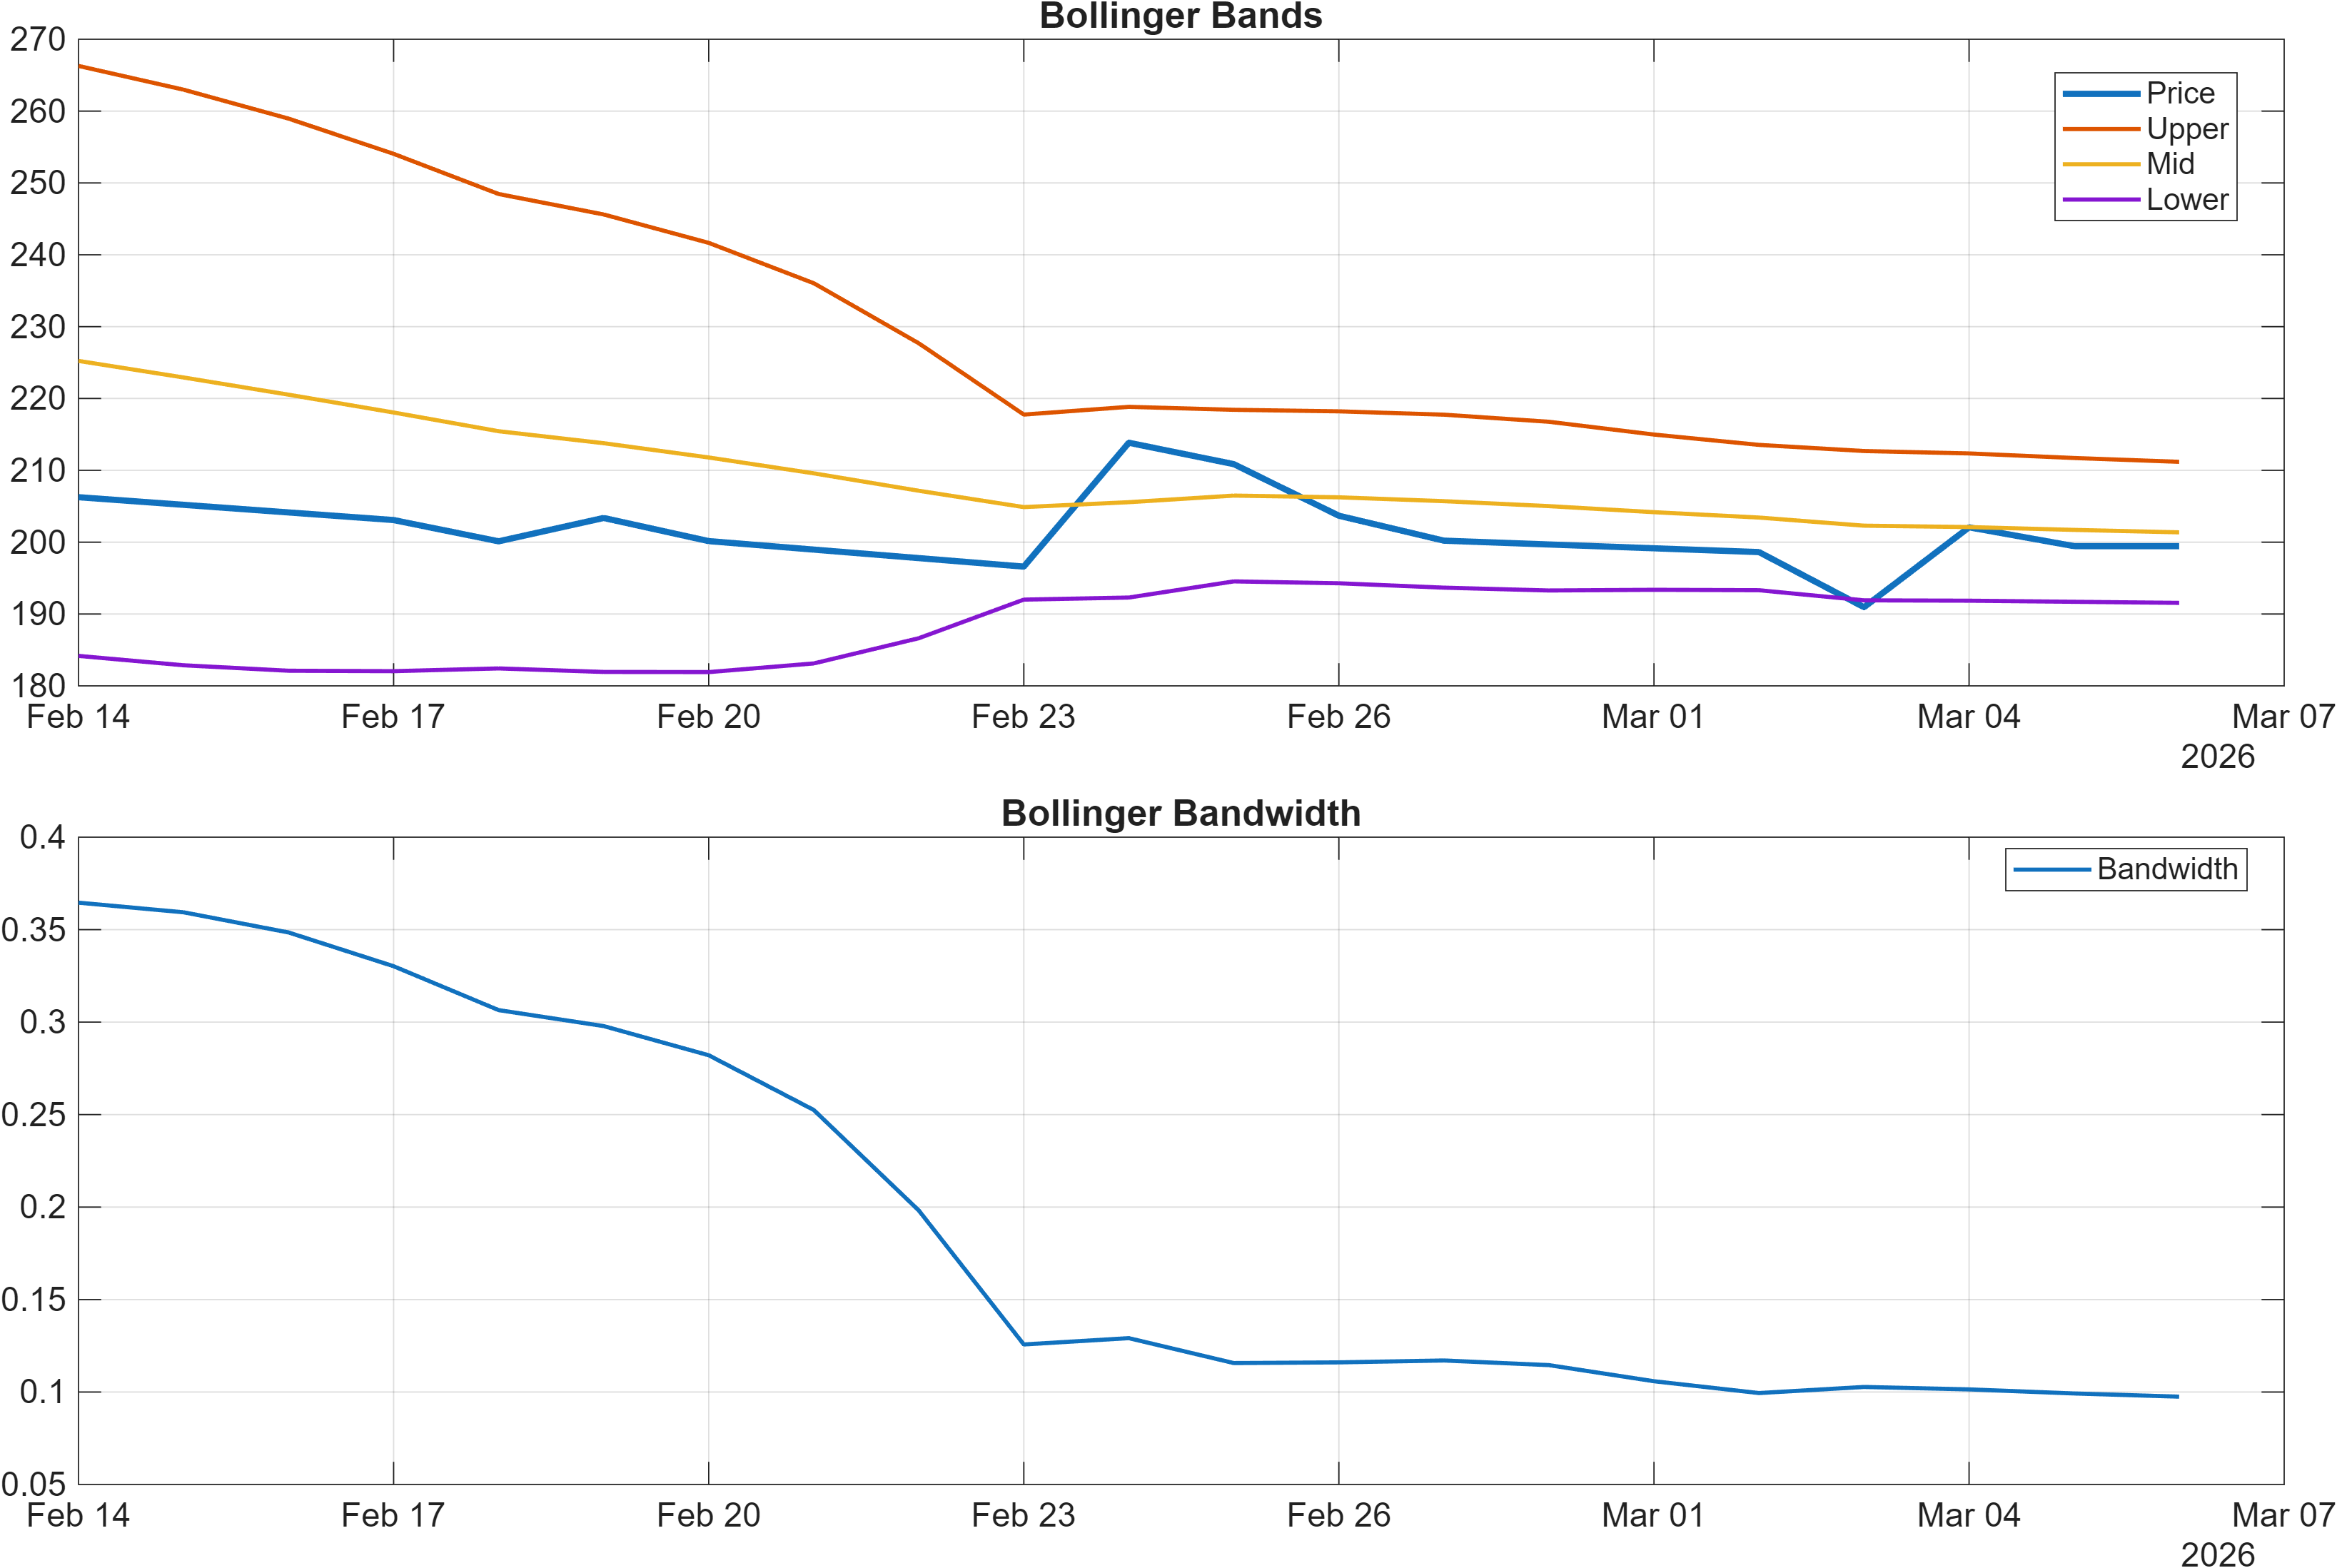
Volatility is also a key part of interpretation here. Bollinger Bandwidth at 0.0975 points to a relatively contained volatility regime. In practice, compressed volatility often precedes expansion, but direction is typically resolved by subsequent price acceptance above resistance or rejection back toward support. This fits AMD’s broader “equilibrium” label: the market is not currently pricing a high-volatility directional move in the immediate tape.
Cross-checking with additional momentum/flow metrics from the broader dashboard supports the idea of mixed impulse: TS Mom(20) at -5.75 and ROC(20) at -2.802 are bearish, while TS Accel at 41.08 is bullish. That combination often reflects a market where the “rate of change” has been weak, but the second derivative is improving—early-stage stabilization that still needs trend confirmation.
4) Support / Resistance zones
Support ~ 194.4900 | Resistance ~ 256.7400
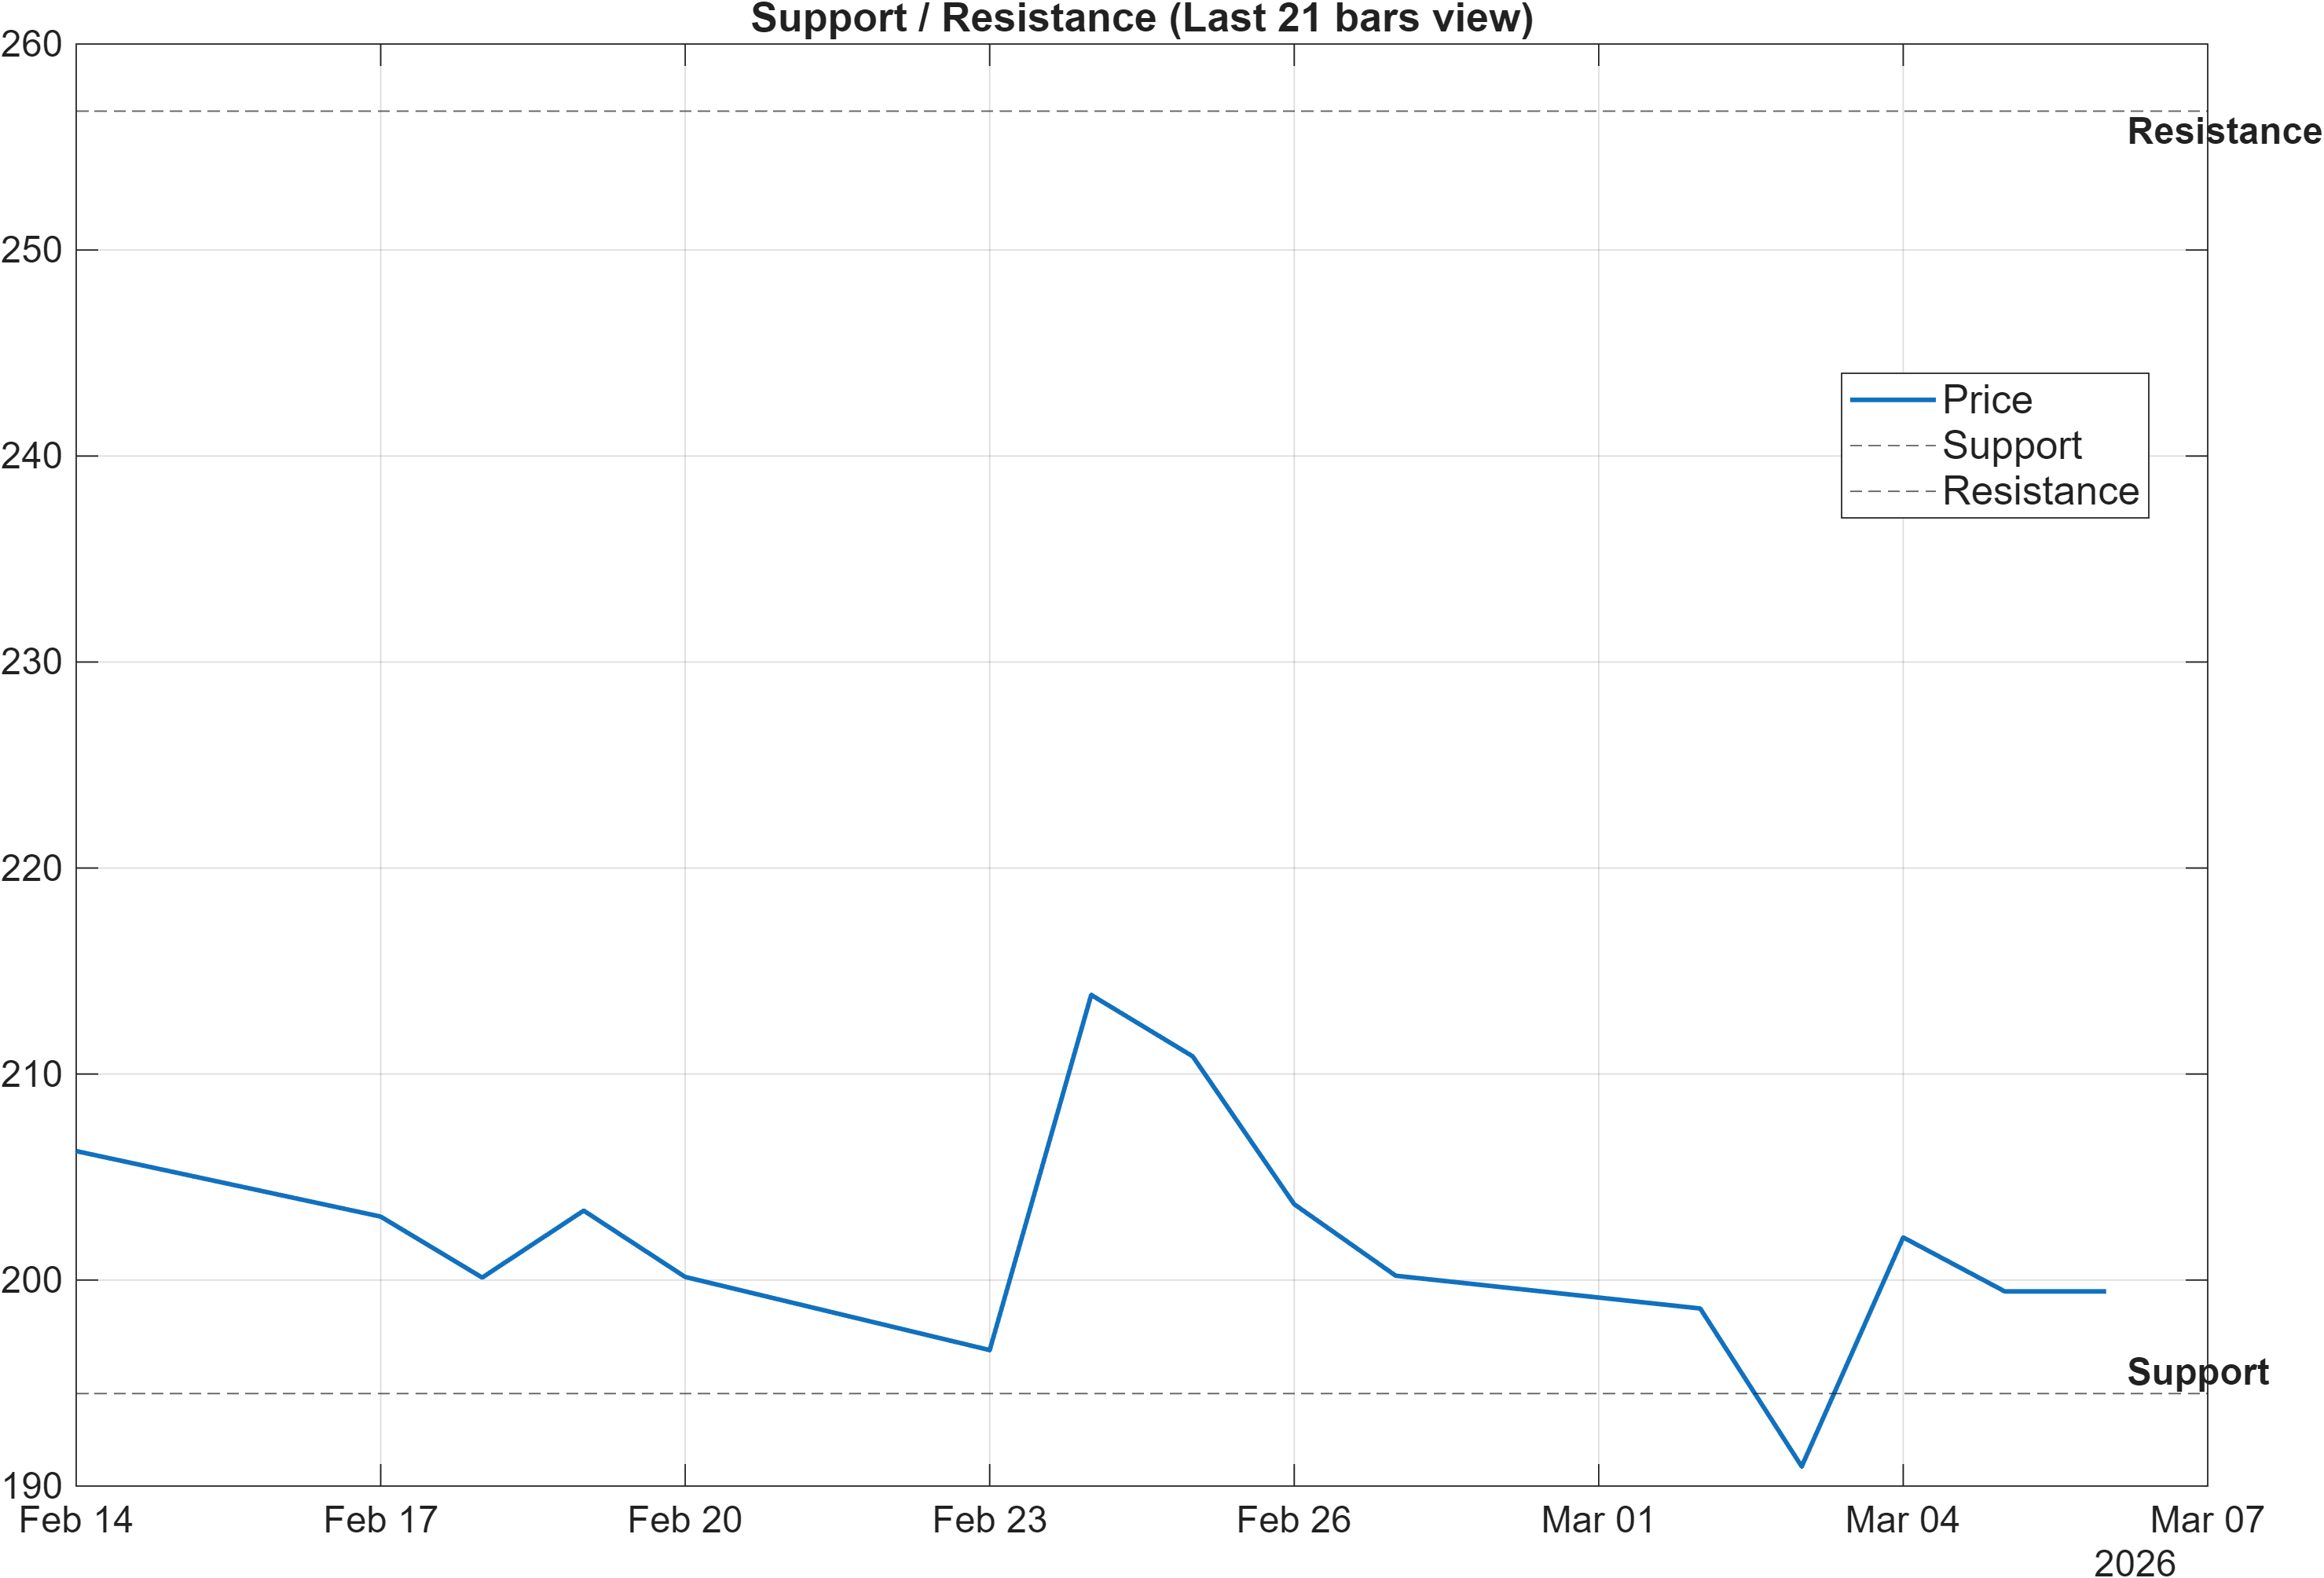
AMD’s structural map is defined by a wide band between 194.4900 (support) and 256.7400 (resistance), reinforcing the current equilibrium framing. With moving averages still bearish, these levels function less like simple “buy/sell points” and more like regime tests: sustained acceptance above resistance is typically required to convert a neutral-to-mixed setup into a more constructive trend posture.
The scenario language provided is consistent with this framework: break above resistance with volume → continuation, while a close below support → signal deterioration risk. Within compressed volatility (Bandwidth 0.0975), the market can spend extended time inside the range; the more actionable information often comes from how price behaves after a boundary is approached—whether it rejects quickly (suggesting supply/demand imbalance) or consolidates near the level (suggesting absorption and potential follow-through).
Additional context from the 20-day high/low markers supports the idea that recent trading has been bracketed: HHIGH(20) 216.7 and LLOW(20) 188.2. With support at 194.4900 sitting above the 20-day low, the nearby floor is not at the absolute recent extreme, which can matter when evaluating whether a support test is a routine range event or an acceleration into breakdown territory. In short, the range is intact until the market proves otherwise at these boundaries.
5) Quant Technical Dashboard (18 Signals)
KGNAI AI Technical Analysis Score (Deep Reinforcement Learning): Rank #355 out of 2066 (Rank 1 represents the strongest technical positioning and a higher probability of favorable price behavior. As ranks increase toward the maximum, the probability of favorable outcomes weakens and bearish positioning becomes more dominant.) | Label: Bullish | Score: 0.656
18-Signal Technical Confluence Score: 0.111 (Neutral)
Overall Technical Score (18-signal confluence + DRL rank blend): 0.275 (Neutral)
Note: The blended score reflects signal strength weighted against broader AI technical ranking, which may temporarily diverge.
Blended technical score breakdown: 0.275 (Neutral | Bull 8 / Bear 6 / Neutral 4)
The most notable feature of the technical dashboard is the model-level divergence between the DRL technical rank and the 18-signal confluence. The DRL model places AMD at Rank #355 out of 2066 with a Bullish label and a 0.656 score—an upper-quartile style standing that implies comparatively stronger technical behavior than the broader rank set suggests. By contrast, the 18-signal confluence score is 0.111 (Neutral), and the blended overall technical score remains 0.275 (Neutral).
The internal mix (Bull 8 / Bear 6 / Neutral 4) is consistent with a market where positive signals exist but are not yet dominant. This is visible in the signal set: MACD Hist 0.6608 is bullish and RSI(14) 49.39 is neutral, while TS Mom(20) -5.75 and ROC(20) -2.802 are bearish. Flow/accumulation metrics also split—ADOSC 59.43 is bullish, yet OBV slope(10) -2.432e+08 is bearish—suggesting that participation/volume signatures are not uniformly supportive.
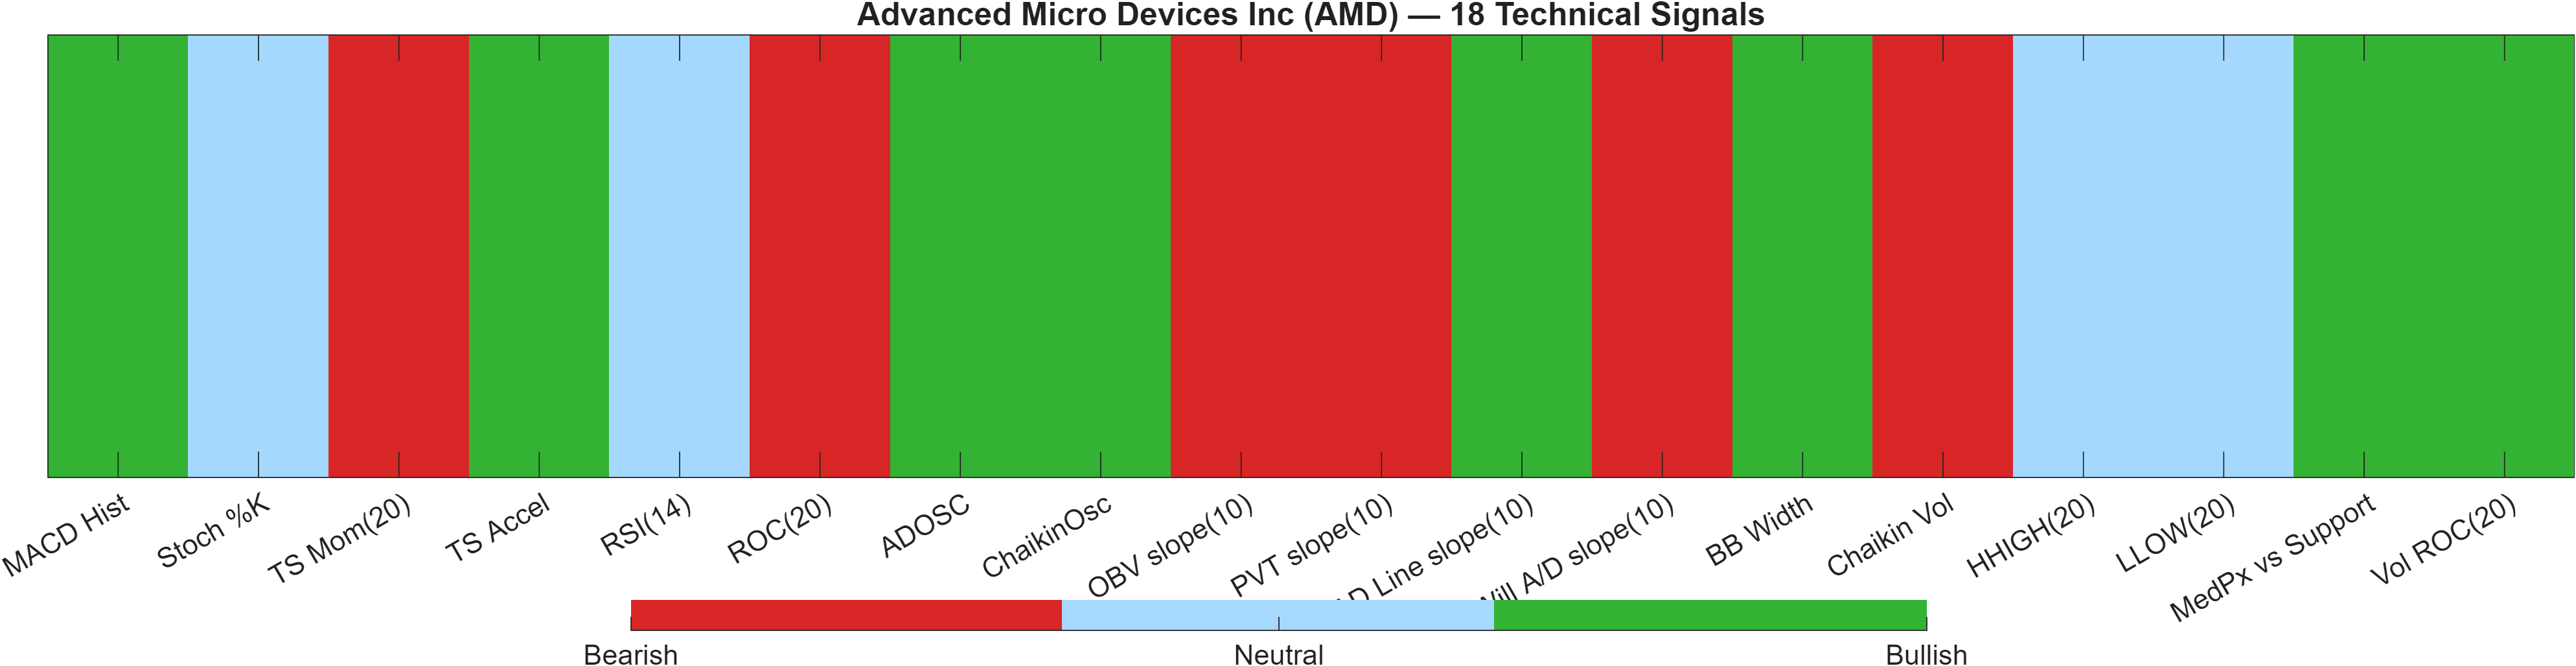
Signal table (Bull/Bear/Neutral)
| Indicator | Value | Signal |
|---|---|---|
| MACD Hist | 0.6608 | Bullish |
| Stoch %K | 39.43 | Neutral |
| TS Mom(20) | -5.75 | Bearish |
| TS Accel | 41.08 | Bullish |
| RSI(14) | 49.39 | Neutral |
| ROC(20) | -2.802 | Bearish |
| ADOSC | 59.43 | Bullish |
| ChaikinOsc | 3.777e+07 | Bullish |
| OBV slope(10) | -2.432e+08 | Bearish |
| PVT slope(10) | -2.154e+06 | Bearish |
| AD Line slope(10) | 7.263e+07 | Bullish |
| Will A/D slope(10) | -18.62 | Bearish |
| BB Width | 0.0975 | Bullish |
| Chaikin Vol | 10.32 | Bearish |
| HHIGH(20) | 216.7 | Neutral |
| LLOW(20) | 188.2 | Neutral |
| MedPx vs Support | 4.845 | Bullish |
| Vol ROC(20) | 19.97 | Bullish |
Interpretation: Indicator-level signals form the base confluence, which is then adjusted using a separate AI-driven technical ranking model. The final technical score summarizes this combined view.
6) News sentiment + extractive gist
Sentiment score (avg): 0.044 | Positive: 25% | Neutral: 71% | Negative: 4%
KGNAI AI News Sentiment Score (normalized -1 to +1): 0.79 (as of 2026-03-06) | Label: Bullish | Overall news score: 0.81
Positive Developments
Recent coverage across major financial outlets indicates a constructive tone around AMD’s positioning in AI infrastructure and data-center demand, with emphasis on ecosystem participation and vendor adoption. The sentiment distribution still shows only 25% positive items, but the normalized score at 0.79 implies that positive articles carry higher-weighted language versus the overall set. This can act as a supportive narrative backdrop when technicals are trying to stabilize: improving momentum (e.g., MACD histogram 0.6608) tends to be more durable when the information flow is not persistently adverse. In addition, mentions of manufacturing and supply-chain alignment around advanced GPU platforms are framed as incremental progress rather than single-event catalysts, which is generally consistent with steadier expectation-setting rather than one-off spikes.
Neutral / Mixed Developments
The news mix is dominated by 71% neutral items, consistent with a market that is processing updates without a clear consensus shock. Several themes read as operational or policy-adjacent rather than purely company-specific drivers, which can dilute directional impact on the tape even when the narrative is active. With the average sentiment score only 0.044, the aggregate tone is modest despite the bullish label, implying that the “bullishness” comes more from the shape of language in a subset of stories than from broad-based enthusiasm. In this context, price is likely to remain anchored to technical decision points—especially support ~194.4900 and resistance ~256.7400—until news flow becomes more uniformly skewed.
Negative / Risk Signals
Risk-sensitive coverage highlights the potential for policy and regulatory uncertainty to influence the AI chip landscape, which can raise headline volatility even when underlying demand narratives remain intact. While only 4% of items are categorized as negative, these themes can exert outsized influence because they can affect multiple names in the same peer group simultaneously. The key analytical question is whether risk headlines translate into persistent selling pressure (aligning with the bearish moving-average structure) or fade quickly as liquidity returns. With volatility currently contained (BB Width 0.0975), any sustained shift in risk perception could be expressed through a volatility expansion coinciding with a boundary test at either 194.4900 or 256.7400.
What to monitor next
- Whether policy-driven headlines coincide with a volatility expansion from 0.0975 and directional follow-through.
- Price acceptance behavior near 256.7400 (break/hold) versus rejection back into the range.
- Downside pressure signals if price closes below 194.4900, aligning news risk with technical deterioration.
Snapshot: AI Rank (Short–Mid–Long): Mixed (Neutral–Bearish–Neutral) · Technical Confluence: Neutral · Key Levels: Support ~194.49 | Resistance ~256.74 · News Sentiment: Neutral
7) Sources
- Update: Market Chatter: Nvidia, AMD Could Face US Draft Rules Requiring Approval for AI Chip Exports — https://finance.yahoo.com/news/market-chatter-nvidia-amd-could-091252241.html?.tsrc=rss
- Flex’s U.S. AMD GPU Production Deepens AI Data Center Role — https://finance.yahoo.com/news/flex-u-amd-gpu-production-080959037.html?.tsrc=rss
- US Considers Requiring Permits for Nvidia, AMD Global AI Chip Sales — https://finance.yahoo.com/news/us-mulls-requiring-permits-global-174126617.html?.tsrc=rss
- Should Meta’s Massive New AMD AI Buildout Require Action From Meta Platforms (META) Investors? — https://finance.yahoo.com/news/meta-massive-amd-ai-buildout-011320867.html?.tsrc=rss
- The Best Stocks to Invest $1,000 in Right Now — https://www.fool.com/investing/2026/03/05/best-stocks-invest-1000-right-now-amd-amzn/?.tsrc=rss
- Nvidia and AMD Could Face Worldwide AI Chip Export Controls Imposed By the Trump Administration — https://www.fool.com/investing/2026/03/05/nvidia-and-amd-could-face-worldwide-ai-chip-export/?.tsrc=rss
- Broadcom rises on $100B AI outlook in Nvidia-led market — https://finance.yahoo.com/video/broadcom-rises-100b-ai-outlook-190755164.html?.tsrc=rss
- Nvidia, AMD fall on Trump admin. reports; Morgan Stanley job cuts — https://finance.yahoo.com/video/nvidia-amd-fall-trump-admin-182459698.html?.tsrc=rss
You may also like: How KGNAI AI ranks instruments across global markets
Disclaimer: KGNAI provides AI-generated analytics and educational market commentary only. This is not financial advice. Markets involve risk. Always do your own research.