
MGNI (Magnite Inc) — Cross-Timeframe Rank Weakness vs Bullish Technicals | 04-Mar-2026
Magnite Inc (MGNI) sits in a notably conflicted setup as of 04-Mar-2026: the technical layer is broadly constructive while the multi-horizon KGNAI rank profile remains pressured outside the weekly window. Across 2066 ranked instruments, MGNI’s weekly rank (#140) screens in the upper tranche, yet its 3-month (#1876), 6-month (#1737), and yearly (#1655) ranks point to longer-duration relative weakness. This divergence matters because trend persistence often depends on whether shorter-term strength can translate into medium-term rank improvement rather than remaining an isolated bounce. On indicators, momentum is positive (RSI(14) 73.85, MACD histogram 0.2949), but the placement near structural zones remains central: support ~11.1150 is the key invalidation area, while resistance ~16.8050 is the decision point for continuation behavior. News sentiment is constructive overall (normalized score 1.00) yet mostly neutral-toned by mix, which can amplify the market’s reliance on price/volume confirmation.
- Short / Mid / Long stance: Short-term Neutral; Mid-term Bearish; Long-term Bearish
- Technical confluence label: Bullish (Overall Technical Score 0.725)
- Key levels: Support 11.1150 | Resistance 16.8050
- News sentiment bias: Bullish (normalized 1.00; avg sentiment 0.140) with a mostly neutral article mix
- Confirmation / invalidation: Continuation risk improves on acceptance above 16.8050 with volume; deterioration risk increases on closes below 11.1150
KGNAI evaluates assets using large cross-sectional datasets built from millions of structured data points. Inputs incorporate fundamental metrics, technical structures, and systematically processed news sentiment. Statistical models, machine learning, and AI frameworks are used to assess relative positioning, signal alignment, and probabilistic behavior across broad universes.
- Ranks are comparative across the tracked universe, not absolute price targets.
- Confluence reflects alignment among independent signal groups.
- Support/resistance levels are probabilistic decision zones, not guarantees.
- Sentiment provides contextual bias within the broader analytical framework.
1) KGNAI AI Analysis
Region: USA
Total universe size: 2066 ranked instruments
- Daily rank: #1546 out of 2066 — Neutral
- Weekly rank: #140 out of 2066 — Bullish
- Monthly rank: #1286 out of 2066 — Neutral
- 3-Monthly rank: #1876 out of 2066 — Bearish
- 6-Monthly rank: #1737 out of 2066 — Bearish
- Yearly rank: #1655 out of 2066 — Bearish
MGNI’s rank stack is best read as a short-lived improvement inside a broader weak regime. The weekly rank (#140) places the name in the upper tranche of the universe, consistent with recent relative strength behavior. However, the signal does not yet generalize across time: the 3-month rank (#1876) and 6-month rank (#1737) sit in the weaker tail, and the yearly rank (#1655) reinforces that longer-horizon positioning has not repaired.
This kind of cross-horizon profile often appears when a market is reacting to a catalyst-driven rebound or a mean-reversion phase, but where structural demand has not yet produced a stable re-rating across slower models. The daily reading (#1546, Neutral) adds a further nuance: near-term relative performance may be less decisive than the weekly suggests, implying that the current move could be more sensitive to confirmation from participation and follow-through.
KGNAI’s stated term view—Short-term: Neutral; Mid-term: Bearish; Long-term: Bearish—frames risk as asymmetric: improvements are most credible if weekly strength begins to pull the monthly rank (#1286) lower over time, rather than stalling. Until that transition occurs, MGNI remains a case where technical momentum can look strong while the broader rank regime argues for disciplined confirmation thresholds and level-based risk control.
2) Price & trend overview
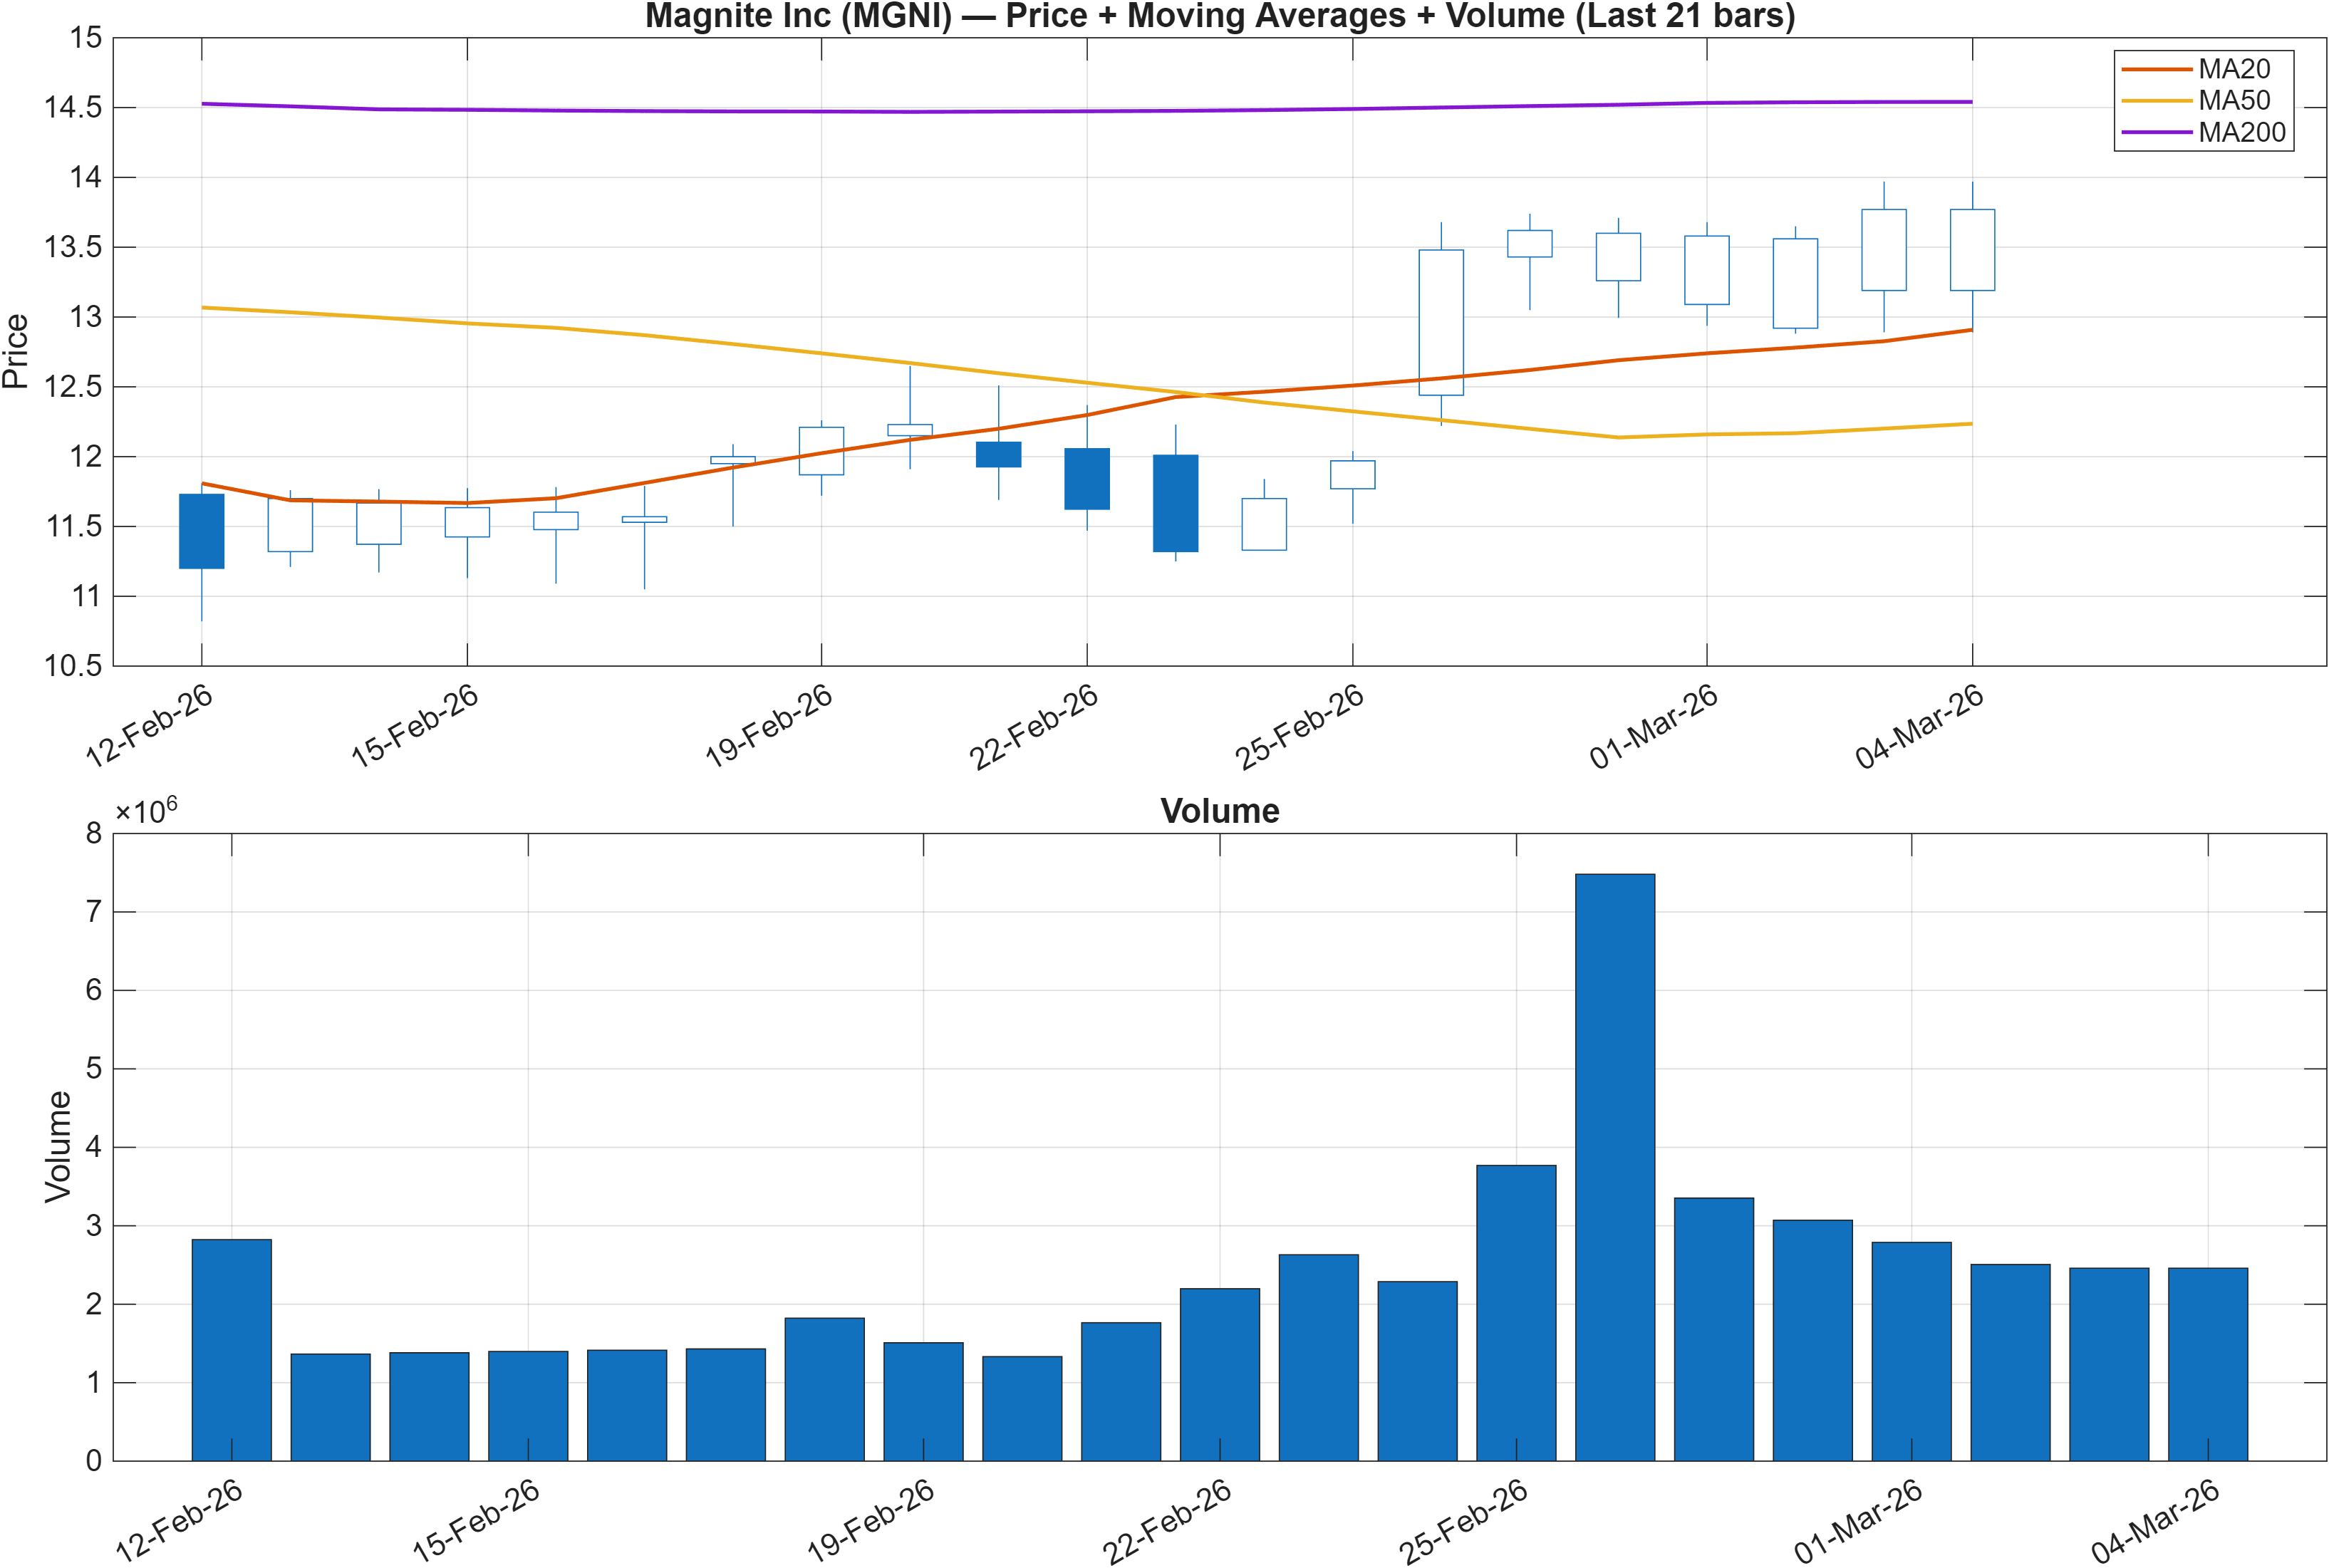
Interpretation: Close vs MA50 = Bullish, MA50 vs MA200 = Bearish.
MGNI’s trend structure is defined by a tactical upswing inside a still-damaged longer trend. The moving-average state explicitly captures that split: price is above the MA50 (Bullish), but the MA50 remains below the MA200 (Bearish). That combination typically describes a market that is recovering in the short run without yet reclaiming a durable long-run trend regime.
This matters because rallies that begin below the longer average often face a sequence of “tests” rather than a single clean breakout—first proving persistence above the medium-term mean (MA50), then demonstrating that the longer-term slope can rotate. In MGNI’s case, the broader rank context (for example, 6-month rank #1737 and yearly rank #1655) suggests that the longer-run rehabilitation is not yet corroborated by cross-sectional behavior.
Volume is the validating layer for this kind of transition, and it is indirectly supported by the participation signals shown later (e.g., Vol ROC(20) at 80.12 and strong accumulation measures). Even so, trend transitions are frequently non-linear: short-term strength can persist while the longer average relationship remains bearish, but reversals also tend to occur quickly if the move fails to build acceptance above nearby supply zones. The more constructive interpretation is that the market is attempting to build a higher base; the more cautious interpretation is that the move is a counter-trend advance until longer-horizon confirmation arrives.
3) Momentum & volatility dashboard
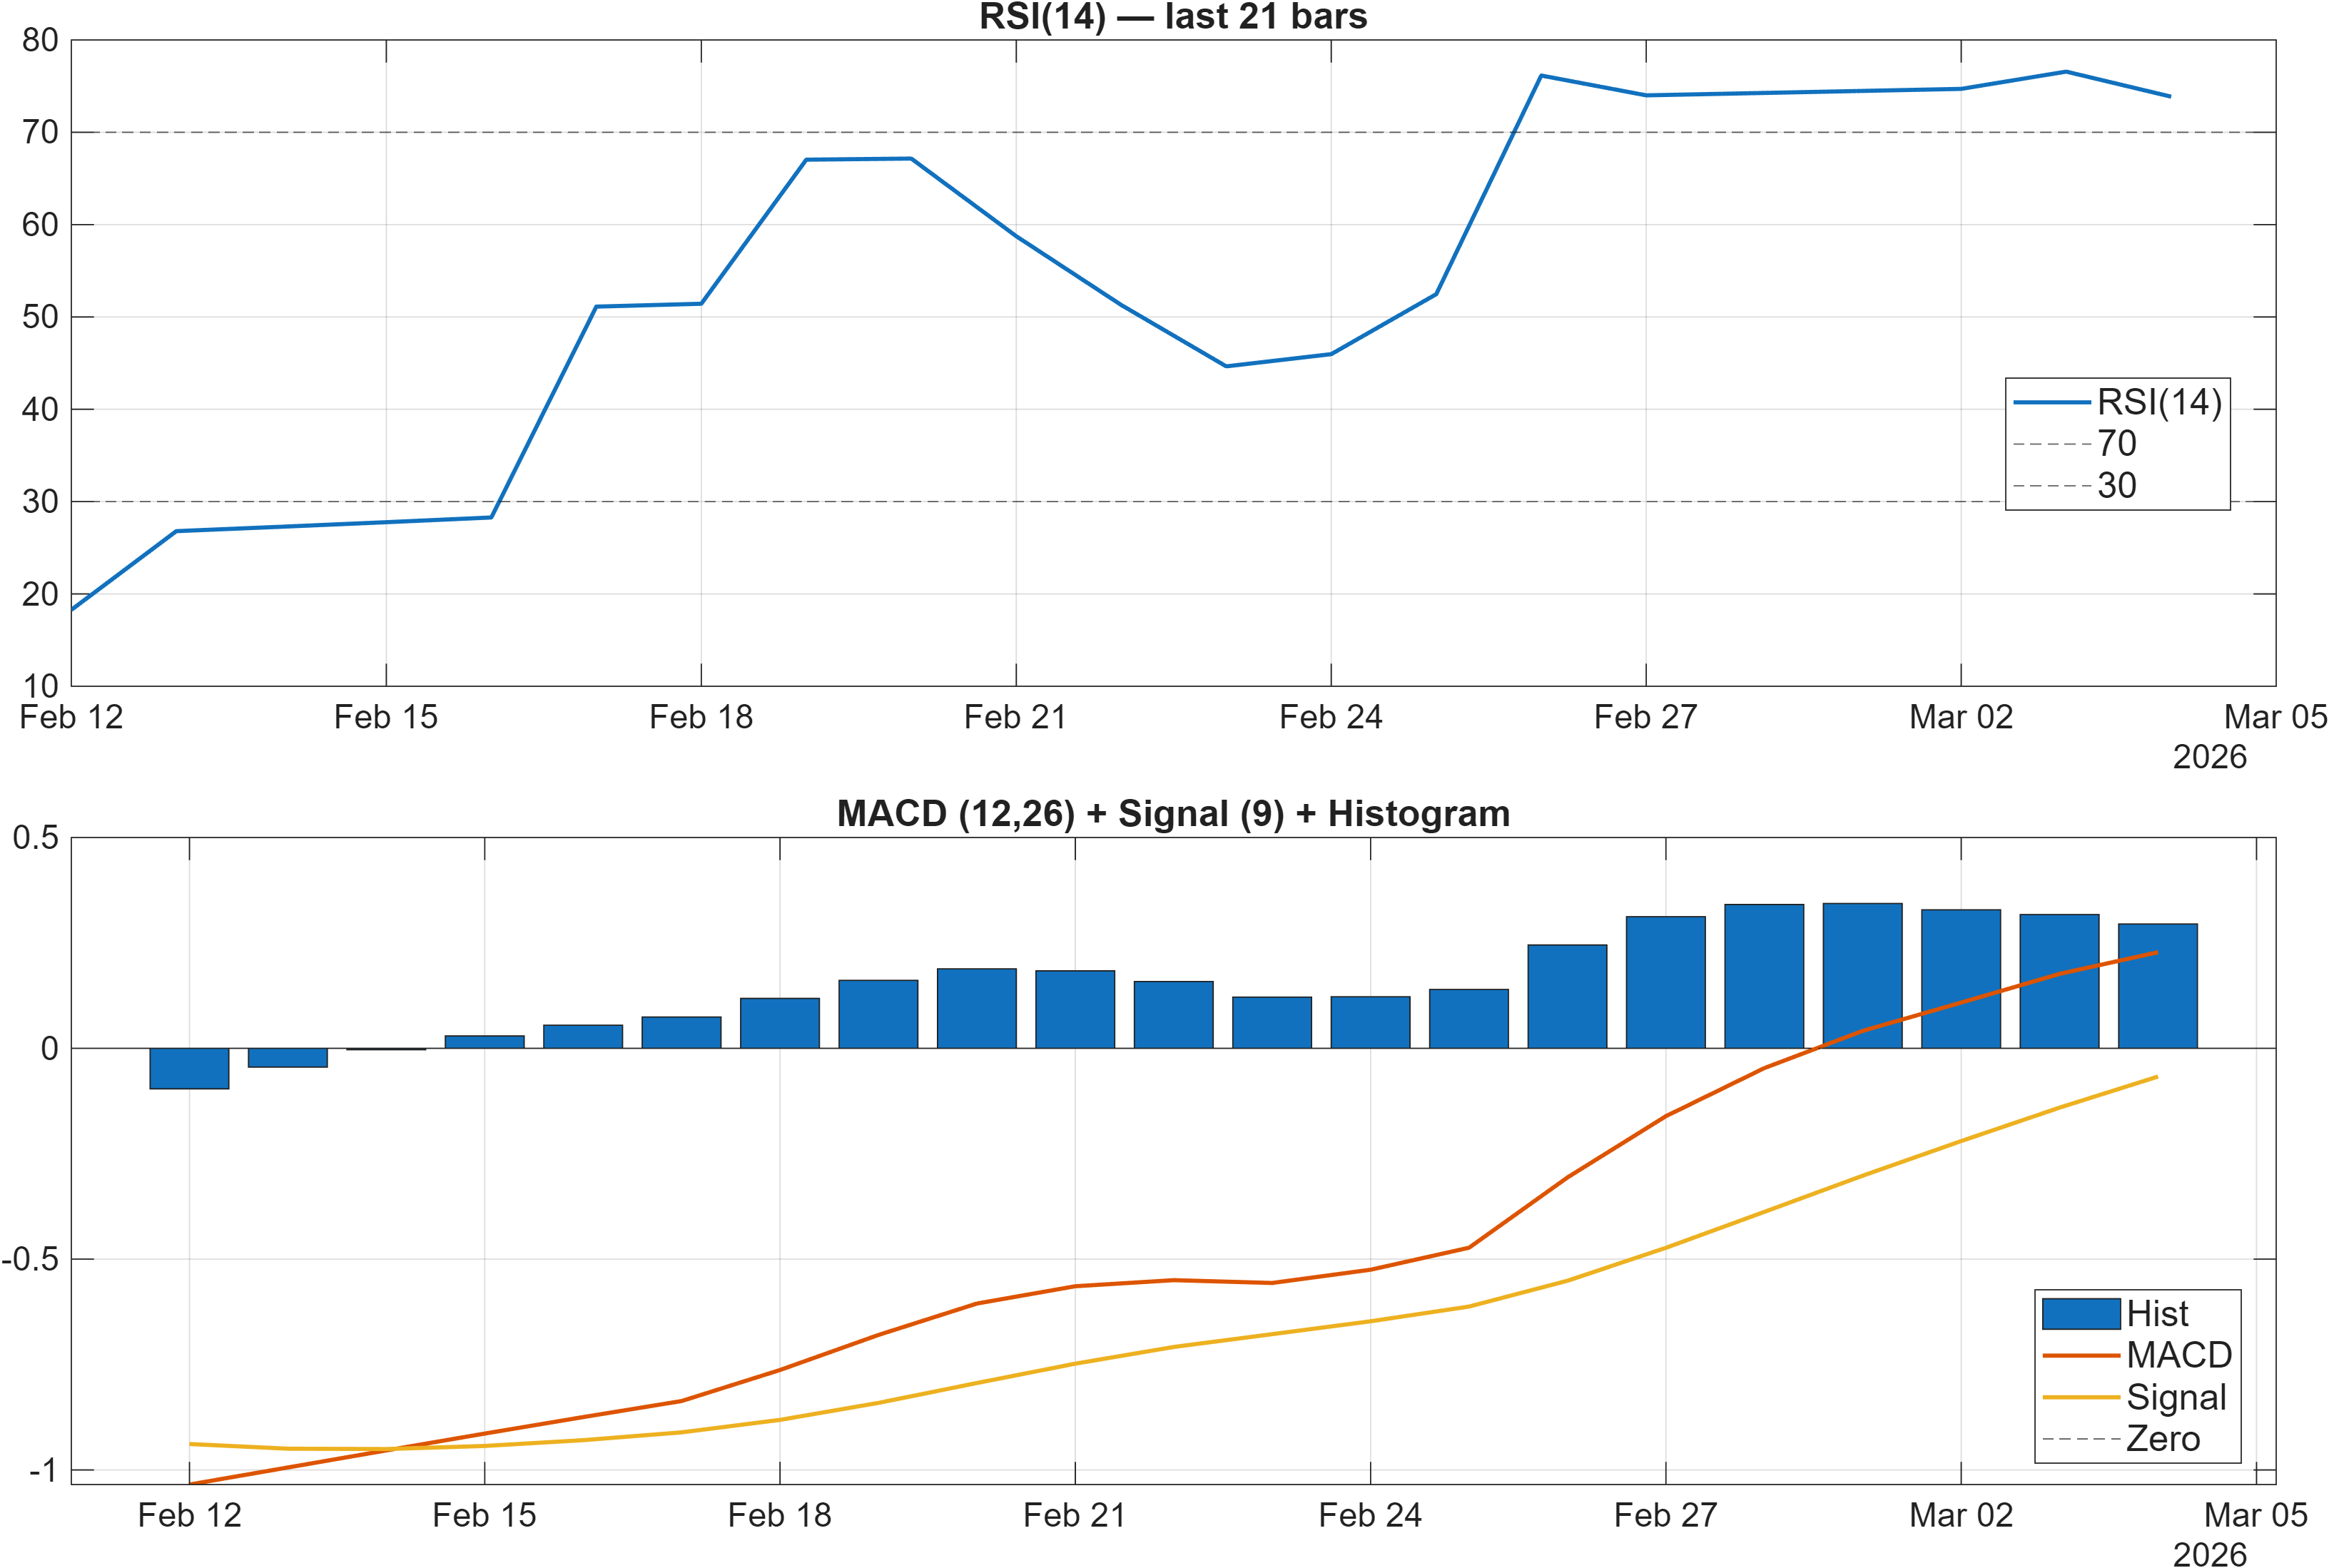
Interpretation: RSI bias = Bullish, MACD hist = 0.2949.
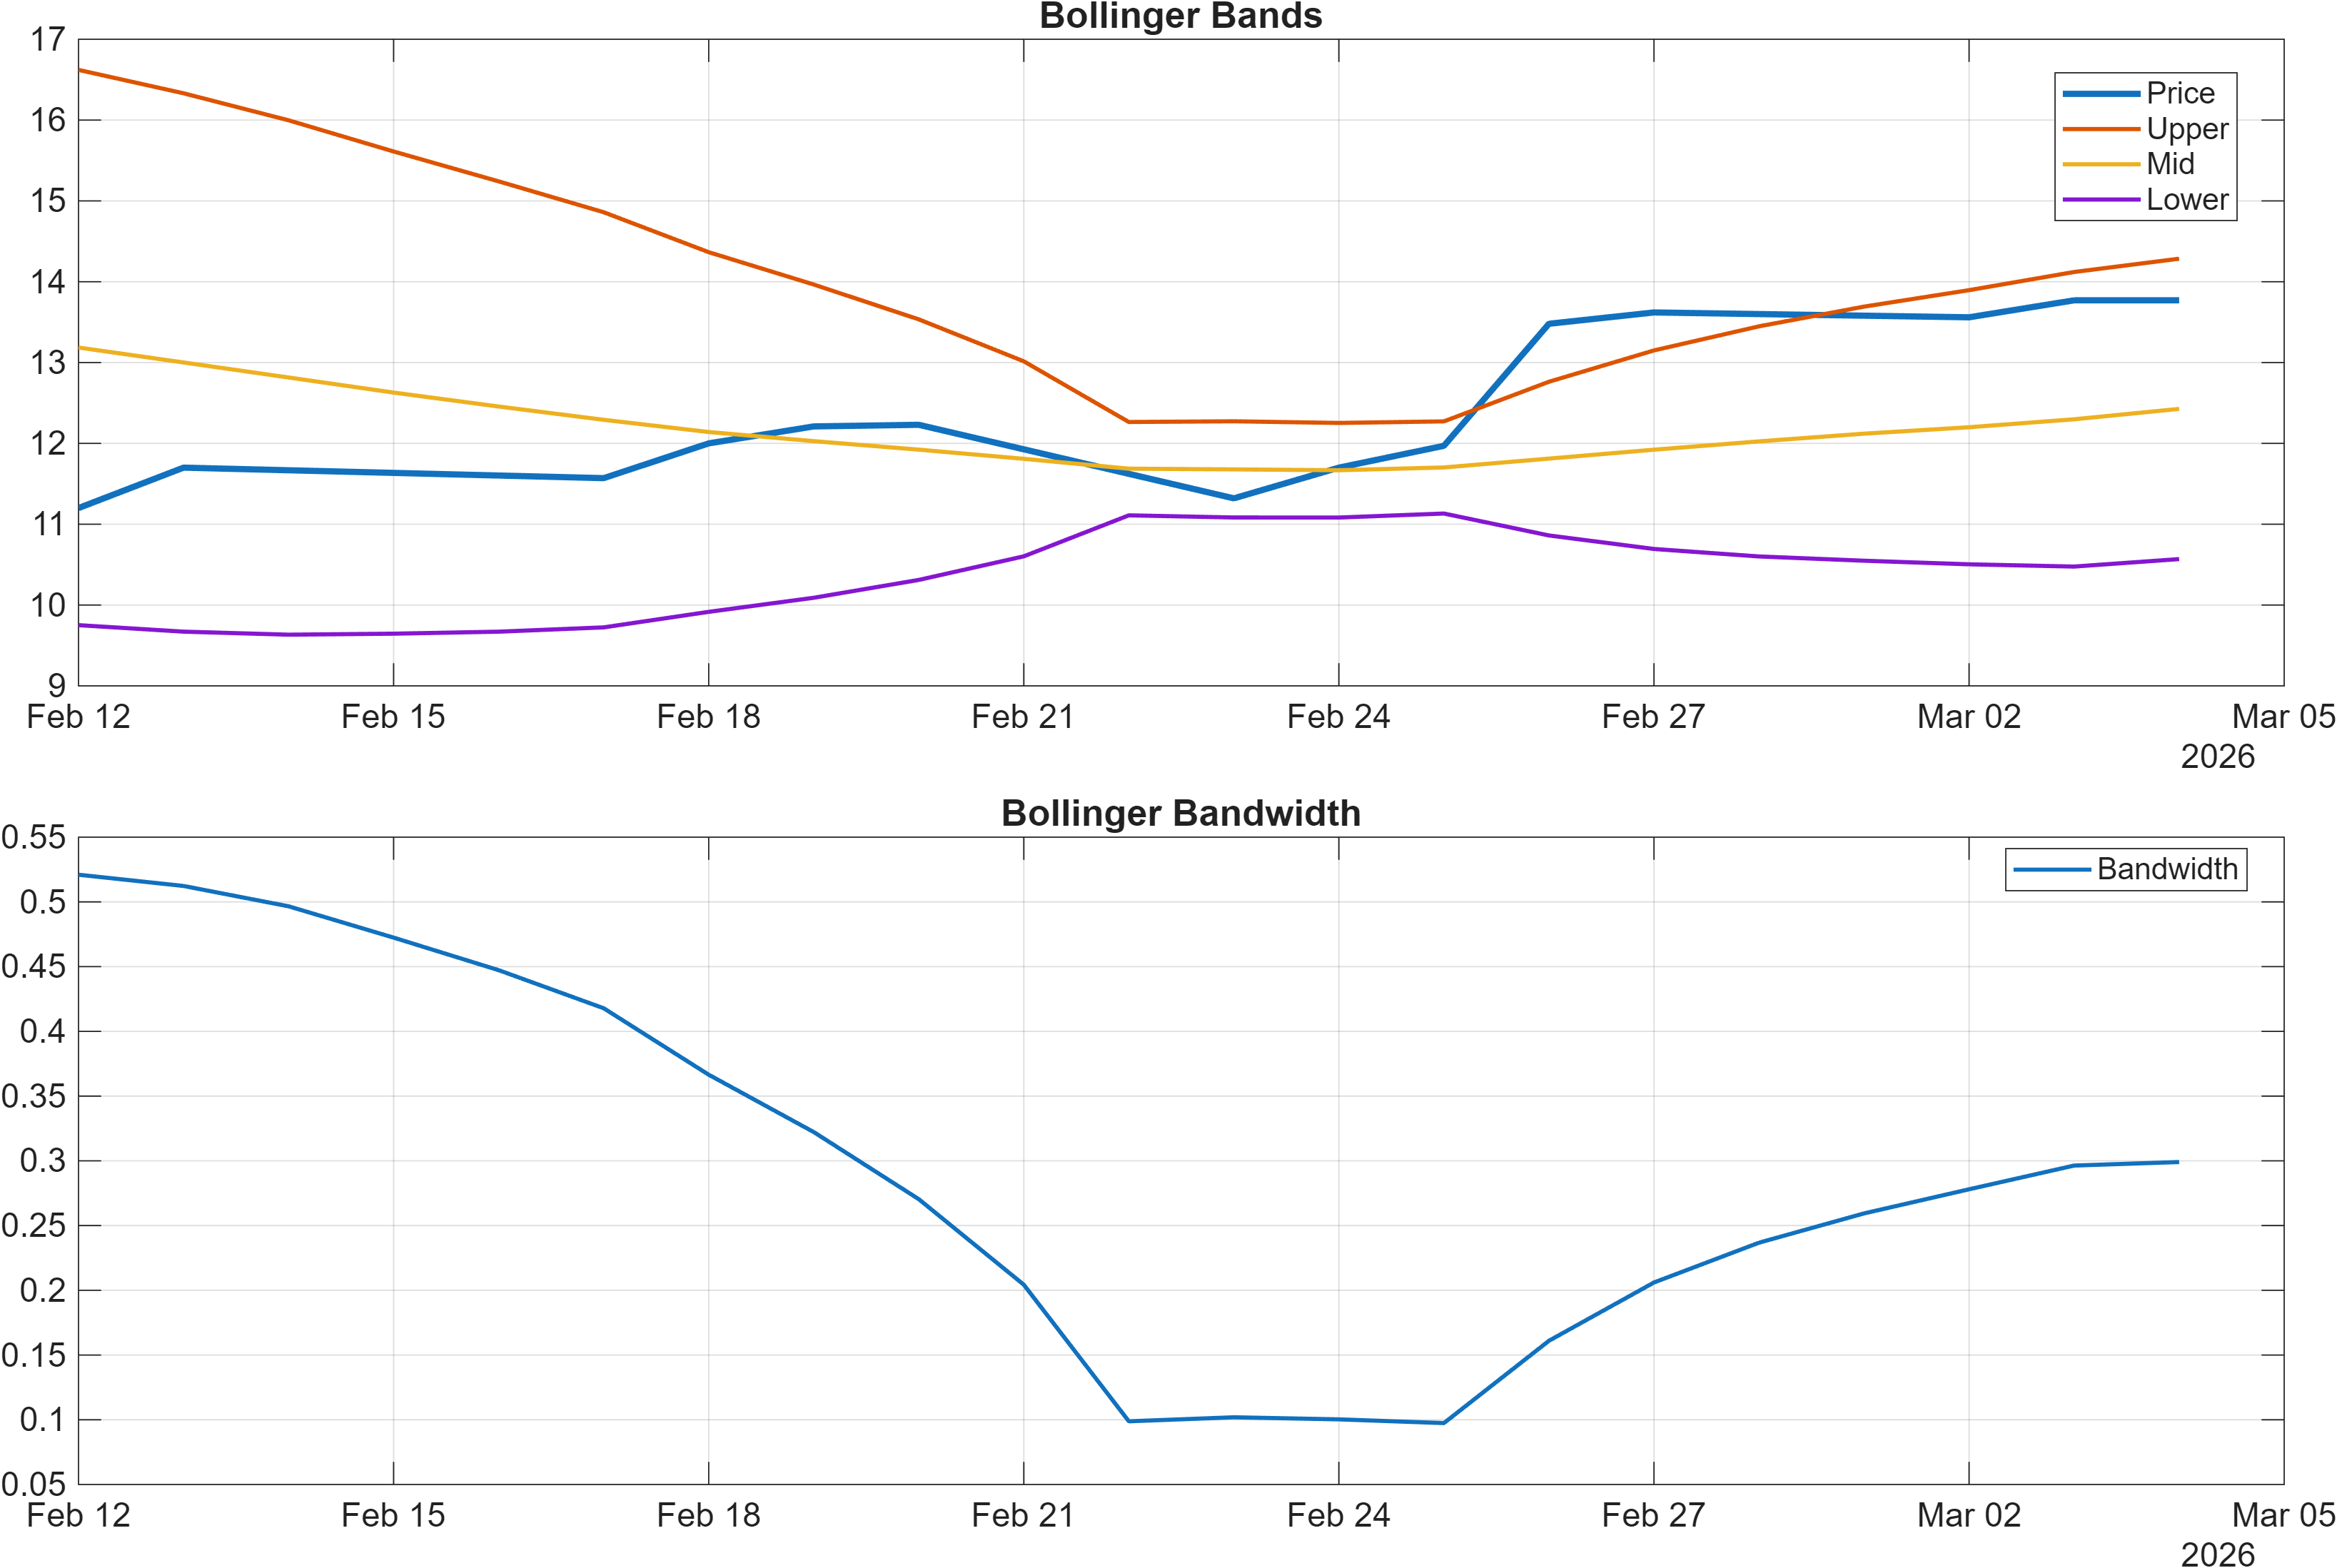
Interpretation: Bandwidth (volatility regime) latest = 0.2991.
MGNI’s momentum dashboard reads as strong but increasingly late-cycle within the current upswing. RSI(14) at 73.85 is labeled bullish, yet it also places the tape in an elevated condition where incremental upside often requires sustained demand rather than simple mean reversion. The MACD histogram at 0.2949 remains positive, signaling that upside momentum is still present, but the more relevant question becomes whether that momentum is accelerating or stabilizing.
The stochastic signal reinforces the “late-cycle” interpretation: Stoch %K at 92.65 is flagged bearish in the signal stack, a typical sign that price is stretched relative to its recent range even if the trend remains intact. When RSI is elevated and stochastic is overextended, continuation can happen, but it tends to be more sensitive to short bursts of volatility and pullbacks.
Volatility conditions are not extreme but are meaningful. Bollinger Band width at 0.2991 (neutral) suggests volatility is neither compressed nor fully expanded; that often coincides with a market that can still trend, but where the pace of the move may rotate between impulse and consolidation. In this regime, traders usually watch whether momentum indicators remain constructive during pullbacks—i.e., whether positive MACD structure holds while RSI cools from elevated levels—because that pattern tends to separate trend digestion from trend failure.
4) Support / Resistance zones
Support ~ 11.1150 | Resistance ~ 16.8050
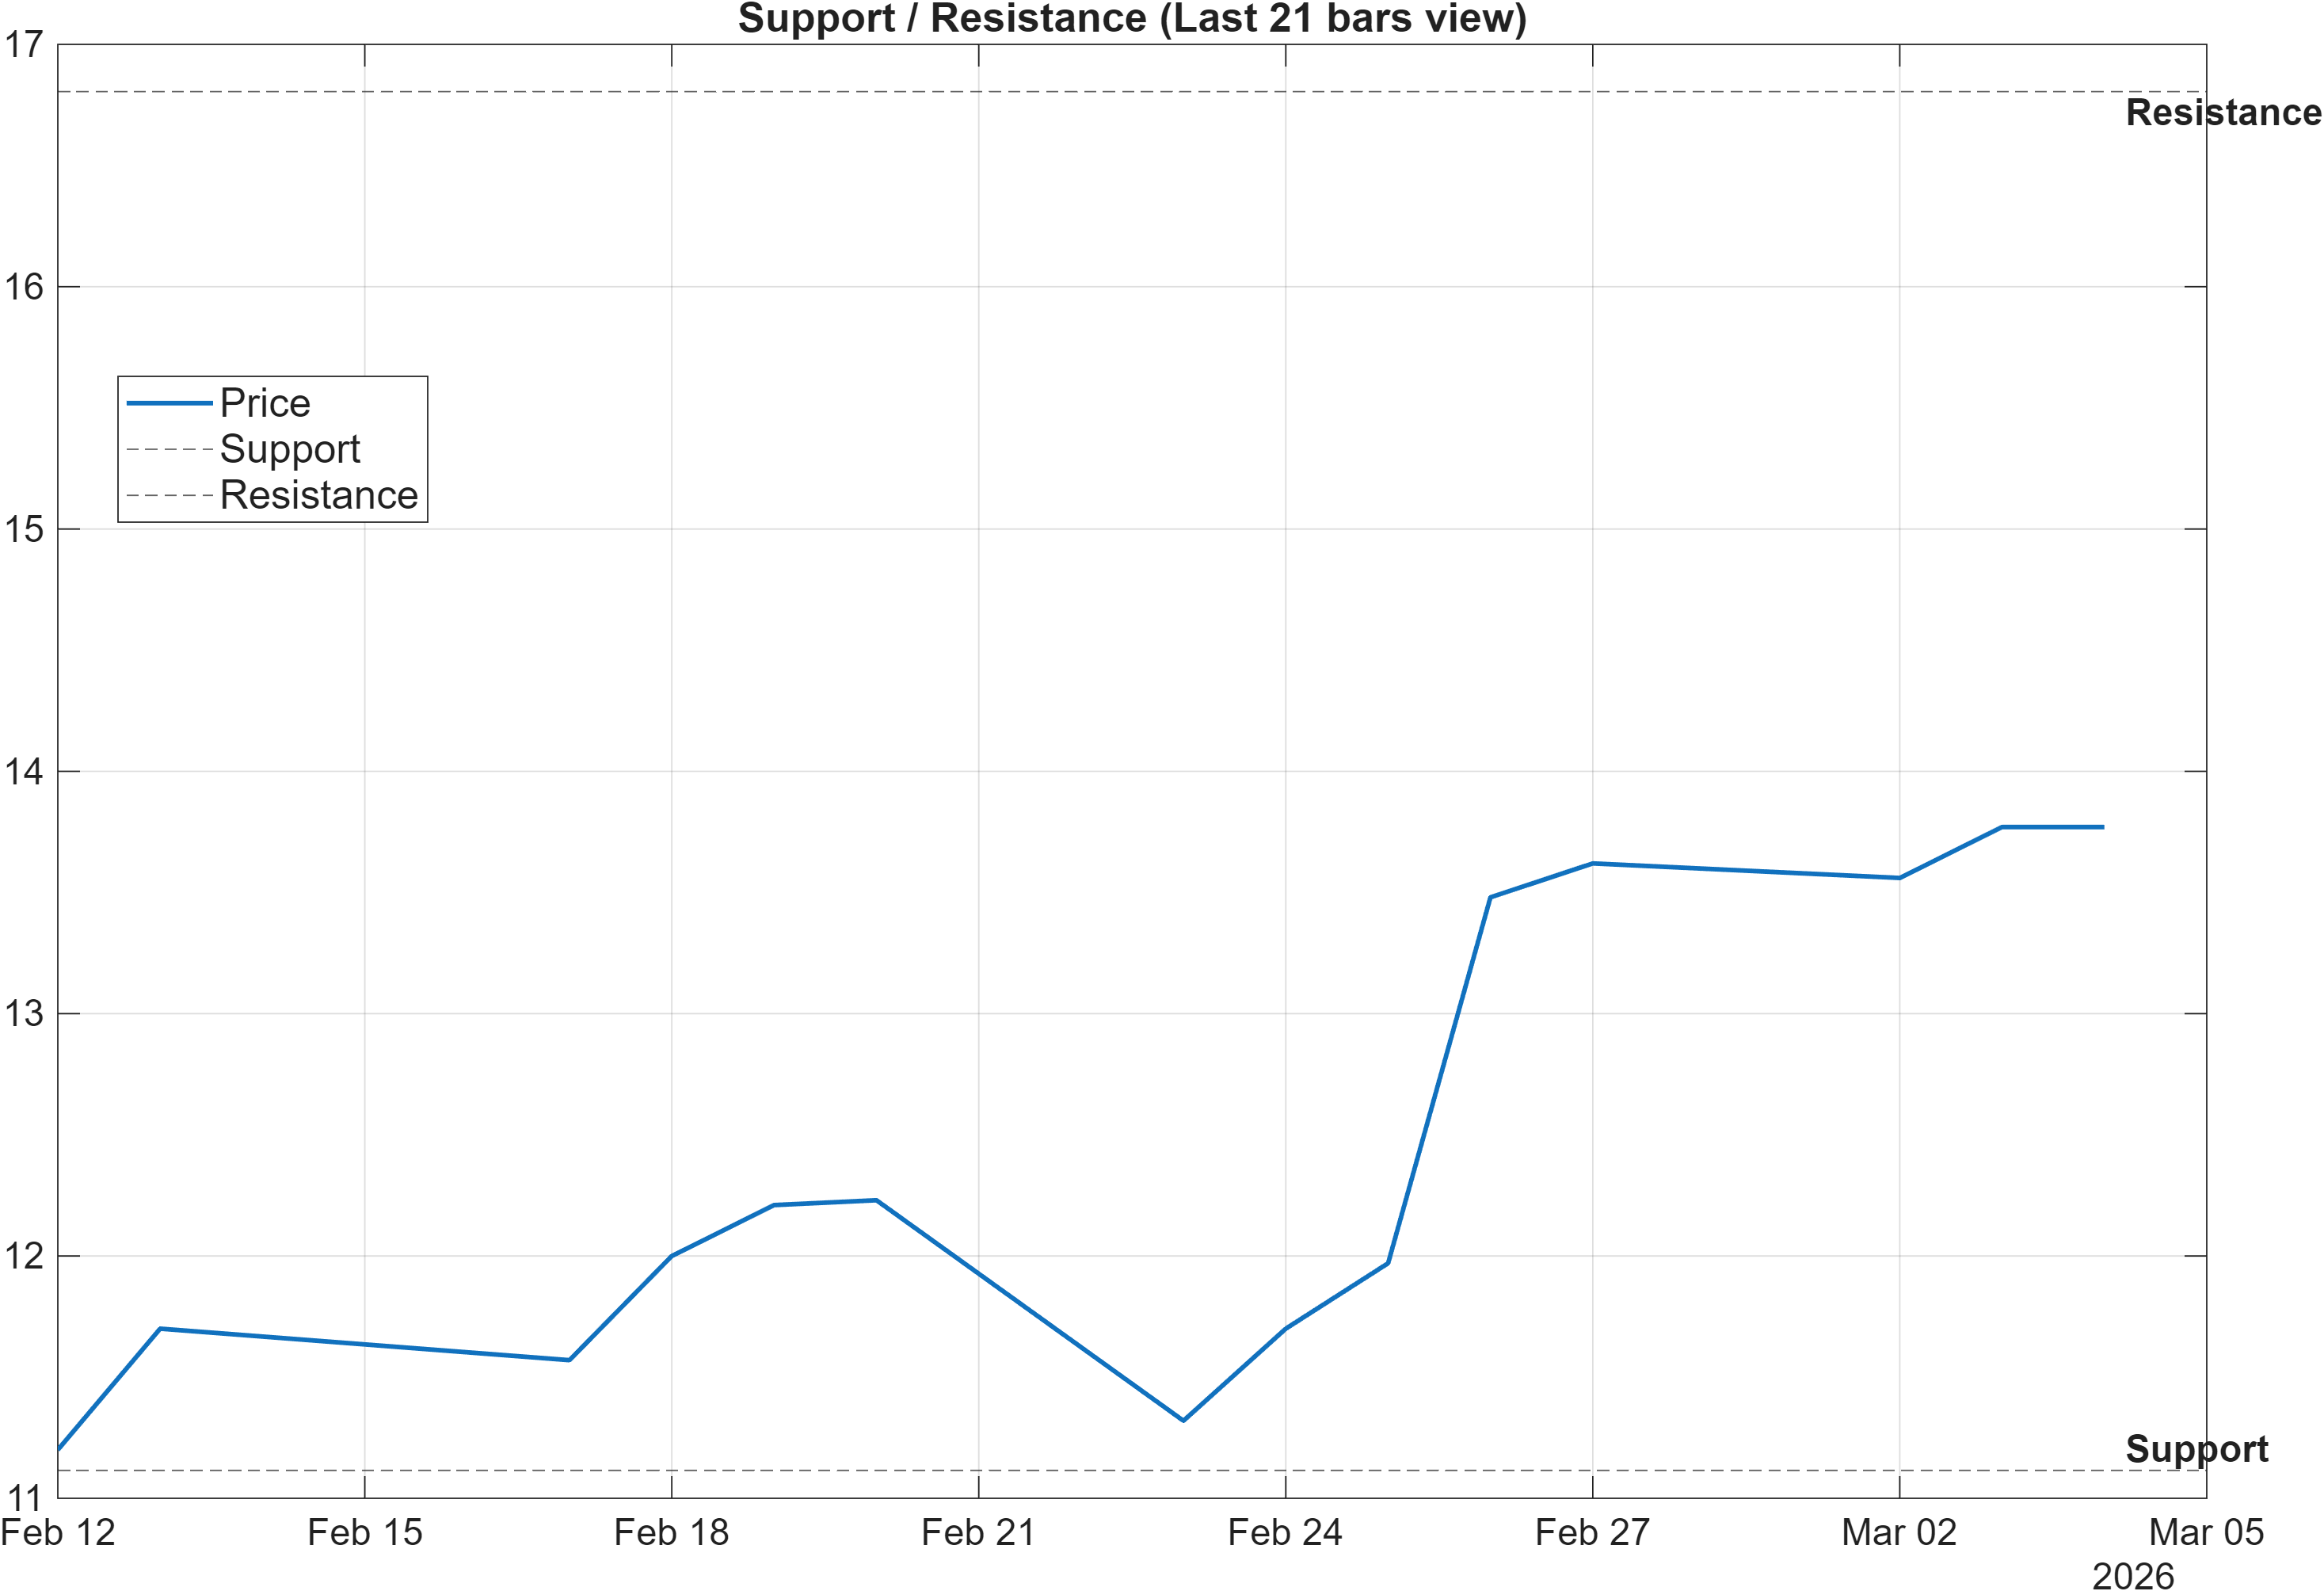
Scenario view: Break above resistance with volume → continuation. Close below support → signal deterioration risk.
MGNI is bracketed by a clean structural map: 11.1150 as the primary support reference and 16.8050 as the key resistance decision zone. These levels matter more than marginal indicator changes because the current environment is characterized by rank divergence—weekly strength versus medium/long weakness—where level acceptance becomes the practical arbiter of whether the move is transitioning into a more durable regime.
From a structure standpoint, the support zone aligns with broader “invalidation” logic: a close below 11.1150 would not only break the local floor but would likely undermine the bullish technical blend that currently dominates the dashboard (Overall Technical Score 0.725). Conversely, a push and sustained acceptance above 16.8050 would help validate that momentum is not merely overbought drift (RSI(14) 73.85) but instead a market capable of overcoming supply.
The distance between these zones also provides a read on potential path dependency. With a relatively wide bracket, MGNI can oscillate and still remain “technically constructive” without proving continuation. That increases the value of volume/participation confirmation during resistance tests. Participation is indirectly supported by the volume-rate signal (Vol ROC(20) 80.12) and accumulation measures shown in the technical table, but the chart-level question remains whether those forces appear during attempts to clear resistance rather than only during rebounds off support.
5) Quant Technical Dashboard (18 Signals)
KGNAI AI Technical Analysis Score (Deep Reinforcement Learning): Rank #144 out of 2066 (Rank 1 represents the strongest technical positioning and a higher probability of favorable price behavior. As ranks increase toward the maximum, the probability of favorable outcomes weakens and bearish positioning becomes more dominant.) | Label: Bullish | Score: 0.861
18-Signal Technical Confluence Score: 0.667 (Bullish)
Overall Technical Score (18-signal confluence + DRL rank blend): 0.725 (Bullish)
Note: The blended score reflects signal strength weighted against broader AI technical ranking, which may temporarily diverge.
Blended technical score breakdown: 0.725 (Bullish | Bull 14 / Bear 2 / Neutral 2)
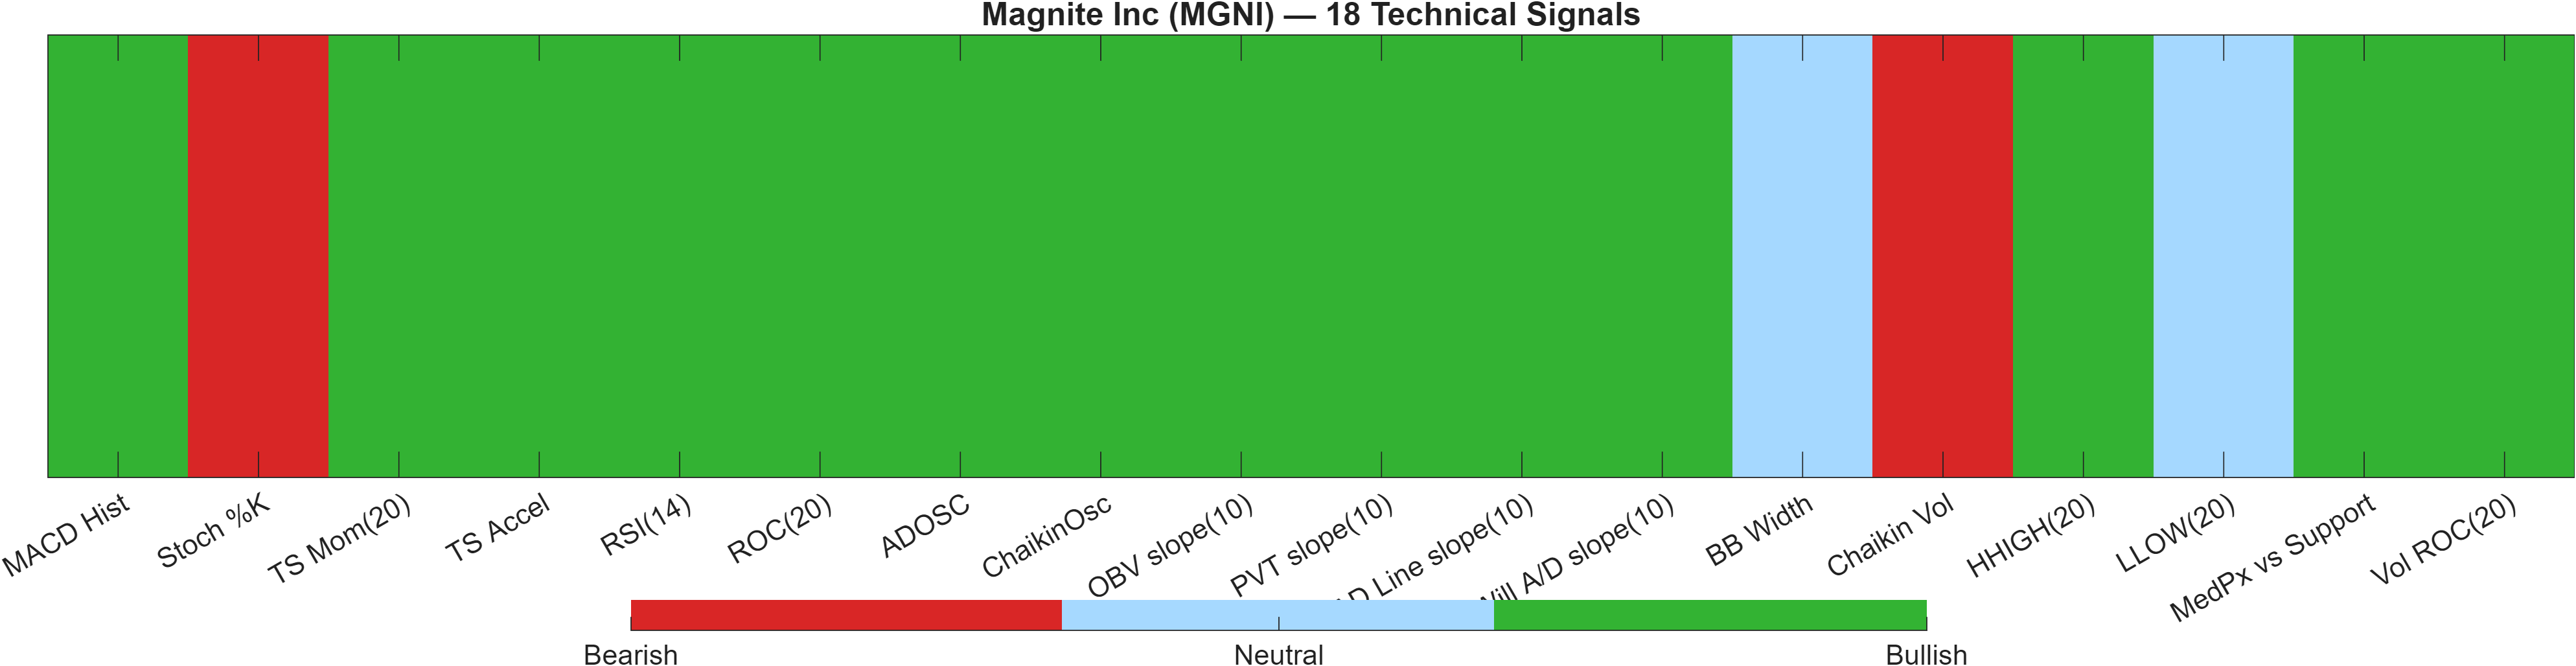
Signal-level alignment vs exhaustion risk
| Indicator | Value | Signal |
|---|---|---|
| MACD Hist | 0.2949 | Bullish |
| Stoch %K | 92.65 | Bearish |
| TS Mom(20) | 2.07 | Bullish |
| TS Accel | 5.753 | Bullish |
| RSI(14) | 73.85 | Bullish |
| ROC(20) | 17.69 | Bullish |
| ADOSC | 76.85 | Bullish |
| ChaikinOsc | 5.74e+06 | Bullish |
| OBV slope(10) | 8.354e+06 | Bullish |
| PVT slope(10) | 1.099e+06 | Bullish |
| AD Line slope(10) | 1.833e+07 | Bullish |
| Will A/D slope(10) | 2.58 | Bullish |
| BB Width | 0.2991 | Neutral |
| Chaikin Vol | 12.51 | Bearish |
| HHIGH(20) | 13.97 | Bullish |
| LLOW(20) | 11.05 | Neutral |
| MedPx vs Support | 2.315 | Bullish |
| Vol ROC(20) | 80.12 | Bullish |
Interpretation: Indicator-level signals form the base confluence, which is then adjusted using a separate AI-driven technical ranking model. The final technical score summarizes this combined view.
The technical layer is unusually cohesive: the blended framework is Bullish with an Overall Technical Score of 0.725, supported by a DRL technical rank of #144 (score 0.861) across 2066 instruments—an upper-tier technical placement. Internally, the confluence count (Bull 14 / Bear 2 / Neutral 2) shows that the bullish label is not being carried by a single indicator cluster.
The higher-quality aspect of the signal stack is that momentum and participation agree. Price-based momentum is positive (MACD histogram 0.2949; ROC(20) 17.69), while accumulation/flow proxies also screen constructive (e.g., ADOSC 76.85 and a strongly positive OBV slope(10)). This is typically the signature of a move that has buyers showing up beyond a single session.
The constraint is not a lack of bullish inputs; it is the presence of exhaustion flags that can change the trade profile. Stoch %K at 92.65 is bearish (stretch risk), and Chaikin Vol at 12.51 is also bearish—often consistent with volatility/flow dynamics that can become less favorable near inflection points. With BB Width 0.2991 neutral, the tape may be capable of trend continuation, but it may require consolidation rather than linear extension to keep the bullish stack intact.
6) News sentiment + extractive gist
Sentiment score (avg): 0.140 | Positive: 39% | Neutral: 61% | Negative: 0%
KGNAI AI News Sentiment Score (normalized -1 to +1): 1.00 (as of 2026-03-03) | Label: Bullish | Overall news score: 0.98
Positive Developments
Recent coverage across major financial outlets indicates a generally constructive narrative around Magnite Inc (MGNI), with emphasis on improving positioning and operational themes that investors commonly associate with re-rating attempts. In the KGNAI framing, this is consistent with the bullish normalized news sentiment of 1.00 and the elevated overall news score of 0.98. The tone skew is not overwhelmingly euphoric—39% positive alongside a larger neutral share—but the absence of negative-tagged items (0%) reduces headline drag. When sentiment is supportive but not extreme, markets tend to lean more heavily on technical validation. That makes it notable that MGNI’s technical stack is already strong (Overall Technical Score 0.725), creating a “sentiment tailwind + technical follow-through” configuration. The main analytical question becomes whether this positive narrative can coincide with price acceptance above the major resistance band at 16.8050, rather than fading into a range.
Neutral / Mixed Developments
The neutral portion of the feed dominates at 61%, which often signals that information flow is being processed as context rather than as a decisive driver. In this setting, neutral items can still matter: they can keep attention on comparative valuation, peer-relative framing, and platform/product narratives without forcing immediate repricing. For MGNI, that neutrality is compatible with the broader rank profile—weekly strength (#140) contrasted with weaker medium/long horizons (e.g., #1737 over 6 months). In other words, the market may be evaluating whether the latest momentum is durable enough to overcome longer-term skepticism. As long as the news stream remains mostly informational, the higher-frequency technicals (RSI(14) 73.85, MACD histogram 0.2949) can remain the dominant “decision variables,” especially near the support/resistance bracket.
Negative / Risk Signals
Despite the sentiment classification showing 0% negative items in the provided mix, risk still exists in the form of signal/positioning mismatch. When medium- and long-horizon ranks remain bearish (for example, 3-month #1876 and yearly #1655), constructive headlines can coincide with a market that is technically strong but still vulnerable to reversal if expectations get ahead of price structure. That vulnerability is also echoed by late-cycle momentum readings, particularly Stoch %K at 92.65 (bearish) alongside a high RSI regime. In practice, the “risk signal” here is less about overtly negative coverage and more about whether the tape can hold key structure: a breakdown below 11.1150 would likely force a reassessment of the bullish technical narrative, even if news tone remains supportive.
- Whether price tests 16.8050 with participation consistent with the bullish volume signals (e.g., Vol ROC(20) 80.12).
- Whether momentum cools constructively (RSI staying supported while overbought risk eases) rather than flipping into a sharp reversal.
- Any shift in the sentiment mix that introduces a measurable negative share versus the current 0% negative.
Sources referenced: Reuters, Bloomberg, Yahoo Finance, MarketWatch, Investing.com
Snapshot: AI Rank (Short–Mid–Long): Mixed (Bearish tilt) (Neutral–Bearish–Bearish) · Technical Confluence: Bullish · Key Levels: Support ~11.12 | Resistance ~16.80 · News Sentiment: Neutral
7) Sources
- Are Investors Undervaluing Magnite (MGNI) Right Now? — https://finance.yahoo.com/news/investors-undervaluing-magnite-mgni-now-144002664.html?.tsrc=rss
- All You Need to Know About Magnite (MGNI) Rating Upgrade to Buy — https://finance.yahoo.com/news/know-magnite-mgni-rating-upgrade-170003354.html?.tsrc=rss
- MGNI vs. BL: Which Stock Is the Better Value Option? — https://finance.yahoo.com/news/mgni-vs-bl-stock-better-164003084.html?.tsrc=rss
- Magnite CTV Shift And AI Push Meet New US$200m Buyback Plan — https://finance.yahoo.com/news/magnite-ctv-shift-ai-push-191103167.html?.tsrc=rss
- Magnite (MGNI) Climbs 12.6% on Strong Earnings, Buyback Plan — https://finance.yahoo.com/news/magnite-mgni-climbs-12-6-103909704.html?.tsrc=rss
- Magnite Q4 Earnings Call Highlights — https://www.marketbeat.com/instant-alerts/magnite-q4-earnings-call-highlights-2026-02-26/?utm_source=yahoofinance&utm_medium=yahoofinance&.tsrc=rss
- Magnite Inc (MGNI) Q4 2025 Earnings Call Highlights: Strong CTV Growth and Strategic Shifts — https://finance.yahoo.com/news/magnite-inc-mgni-q4-2025-050529428.html?.tsrc=rss
- Magnite (MGNI) Q4 2025 Earnings Call Transcript — https://www.fool.com/earnings/call-transcripts/2026/02/25/magnite-mgni-q4-2025-earnings-call-transcript/?.tsrc=rss
You may also like: How KGNAI AI ranks instruments across global markets
Disclaimer: KGNAI provides AI-generated analytics and educational market commentary only. This is not financial advice. Markets involve risk. Always do your own research.