
LW (Lamb Weston Holdings Inc) — Neutral Technical Confluence With Bullish Long-Horizon Ranks (08-Mar-2026)
Lamb Weston Holdings Inc (LW) enters 08-Mar-2026 with a notably mixed cross-horizon profile: shorter-horizon KGNAI ranks remain constructive (Daily #396 and Weekly #369 out of 2066), while the Monthly rank (#1629) sits in the weaker portion of the universe—suggesting near-term stabilization attempts inside a broader intermediate reset. In parallel, the technical layer is best described as neutral with bearish pressure: the 18-signal confluence score is -0.222 (Neutral) and the blended overall technical score is -0.141 (Neutral), with more bearish than bullish signals (Bear 10 vs Bull 6). Momentum and trend cues lean cautious (RSI(14) at 37.7, MACD histogram -0.2556, and a bearish MA stack). Volatility is relatively compressed (Bollinger Bandwidth 0.0809), raising the importance of level-based confirmation around 41.4175 support and 50.6963 resistance. News flow is largely neutral in aggregate, while KGNAI’s normalized news score reads bullish.
- Rank stance (Short / Mid / Long): Bullish / Neutral / Bullish (Daily #396, Monthly #1629, 3-Month #21)
- Technical confluence label: Neutral (18-signal confluence -0.222; blended -0.141)
- Key levels: Support ~ 41.4175 | Resistance ~ 50.6963
- News sentiment bias: Mixed-to-neutral distribution (Positive 15% / Neutral 67% / Negative 19%) with KGNAI normalized news score 0.86 Bullish
- Confirmation / invalidation: A volume-backed push above 50.6963 improves continuation odds; sustained closes below 41.4175 increase deterioration risk.
KGNAI evaluates assets using large cross-sectional datasets built from millions of structured data points. Inputs incorporate fundamental metrics, technical structures, and systematically processed news sentiment. Statistical models, machine learning, and AI frameworks are used to assess relative positioning, signal alignment, and probabilistic behavior across broad universes.
- Ranks are comparative across the tracked universe, not absolute price targets.
- Confluence reflects alignment among independent signal groups.
- Support/resistance levels are probabilistic decision zones, not guarantees.
- Sentiment provides contextual bias within the broader analytical framework.
1) KGNAI AI Analysis
Region: USA
Total universe size: 2066 ranked instruments
- Daily rank: #396 out of 2066 — Bullish
- Weekly rank: #369 out of 2066 — Bullish
- Monthly rank: #1629 out of 2066 — Neutral
- 3-Monthly rank: #21 out of 2066 — Bullish
- 6-Monthly rank: #34 out of 2066 — Bullish
- Yearly rank: #149 out of 2066 — Bullish
LW’s rank distribution is best understood as long-horizon strength with a mid-horizon air pocket. The 3-Month and 6-Month ranks (#21 and #34) sit in the extreme upper tier of the 2066-instrument universe, and the Yearly rank (#149) remains firmly constructive. That combination typically reflects persistence in broader behavioral factors (cross-sectional relative strength, regime fit, and stability measures) even when local technicals are not clean.
The tension appears in the Monthly rank at #1629, which is markedly weaker than both the Weekly (#369) and Daily (#396). In regime terms, that pattern frequently coincides with an intermediate digestion phase: the shorter horizon improves before the monthly factor set re-accelerates, or the bounce fails and longer-horizon ranks eventually degrade. KGNAI’s stated term view—Short-term: Bullish; Mid-term: Neutral; Long-term: Bullish—captures this asymmetry.
Practically, the key analytical question is alignment: does price action and indicator structure rotate back toward the longer-horizon ranks, or does the weaker monthly profile continue to cap follow-through? This is where the later sections (moving averages, RSI/MACD, and the confluence blend) become the confirmation layer rather than the primary thesis.
Want the full universe and complete rank tables? Unlock full access on KGNAI: https://www.kgnai.com/pricing
2) Price & trend overview
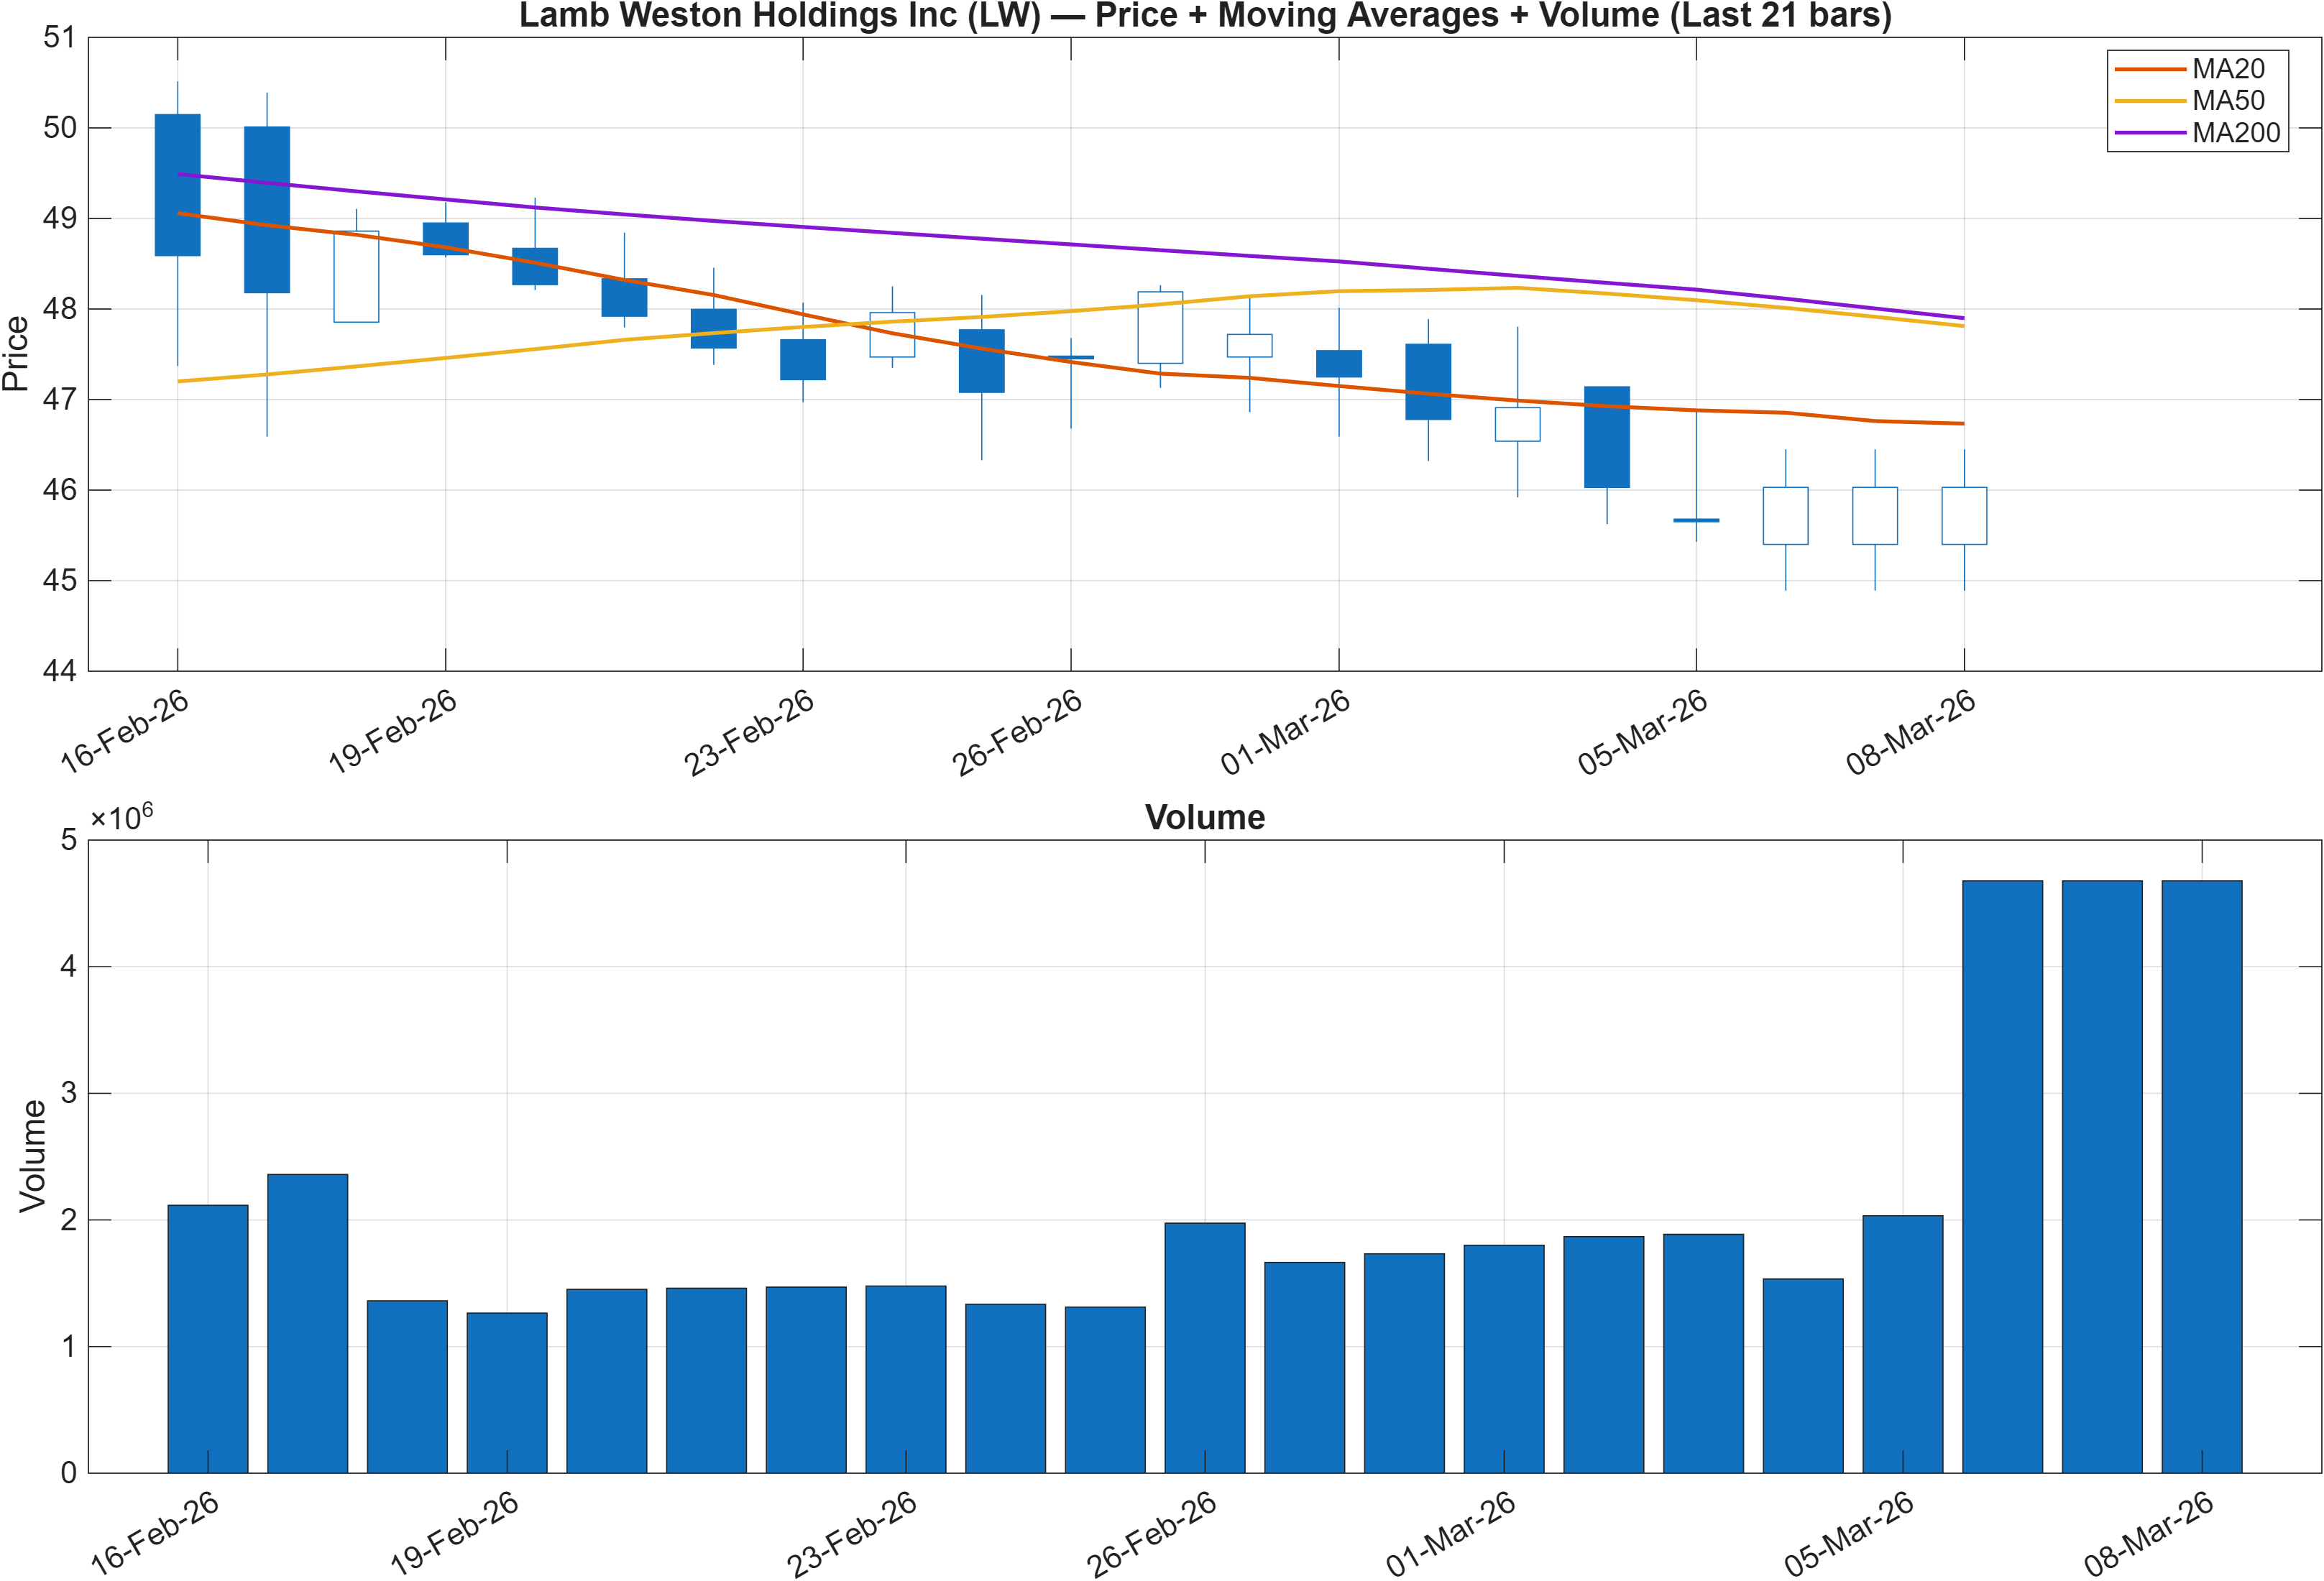
Trend structure vs rank profile
The moving-average read is unambiguously cautious: Close vs MA50 = Bearish and MA50 vs MA200 = Bearish. In classical trend terms, that is consistent with a market still trading beneath intermediate trend control and with longer-duration trend confirmation not yet restored. This matters because it partially explains why the technical blend remains neutral even while the long-horizon KGNAI ranks (3-Month #21 and 6-Month #34) are strong—those ranks can stay resilient through repairs, but price must reclaim trend structure to reduce “false start” risk.
Continuation requires proof; stabilization is not enough
When the MA50 is below the MA200 and price is below the MA50, rallies often behave as tests rather than durable trend transitions unless breadth/volume corroborates. That is consistent with the later confluence summary showing more bearish than bullish signals (Bear 10 vs Bull 6), even though the overall label remains neutral. It also frames why the resistance level at 50.6963 is more than a simple line: it becomes a practical demarcation for whether the chart can re-enter a stronger trend regime.
Volume as a discriminator
With technical conditions leaning neutral-to-bearish, the highest-quality confirmations typically come from a combination of price level and participation. That logic is explicitly reinforced by the scenario framing later in the report (“break above resistance with volume”). If price improves without volume confirmation, the setup can remain rangy and vulnerable, especially with momentum indicators still depressed (e.g., RSI(14) 37.7).
3) Momentum & volatility dashboard
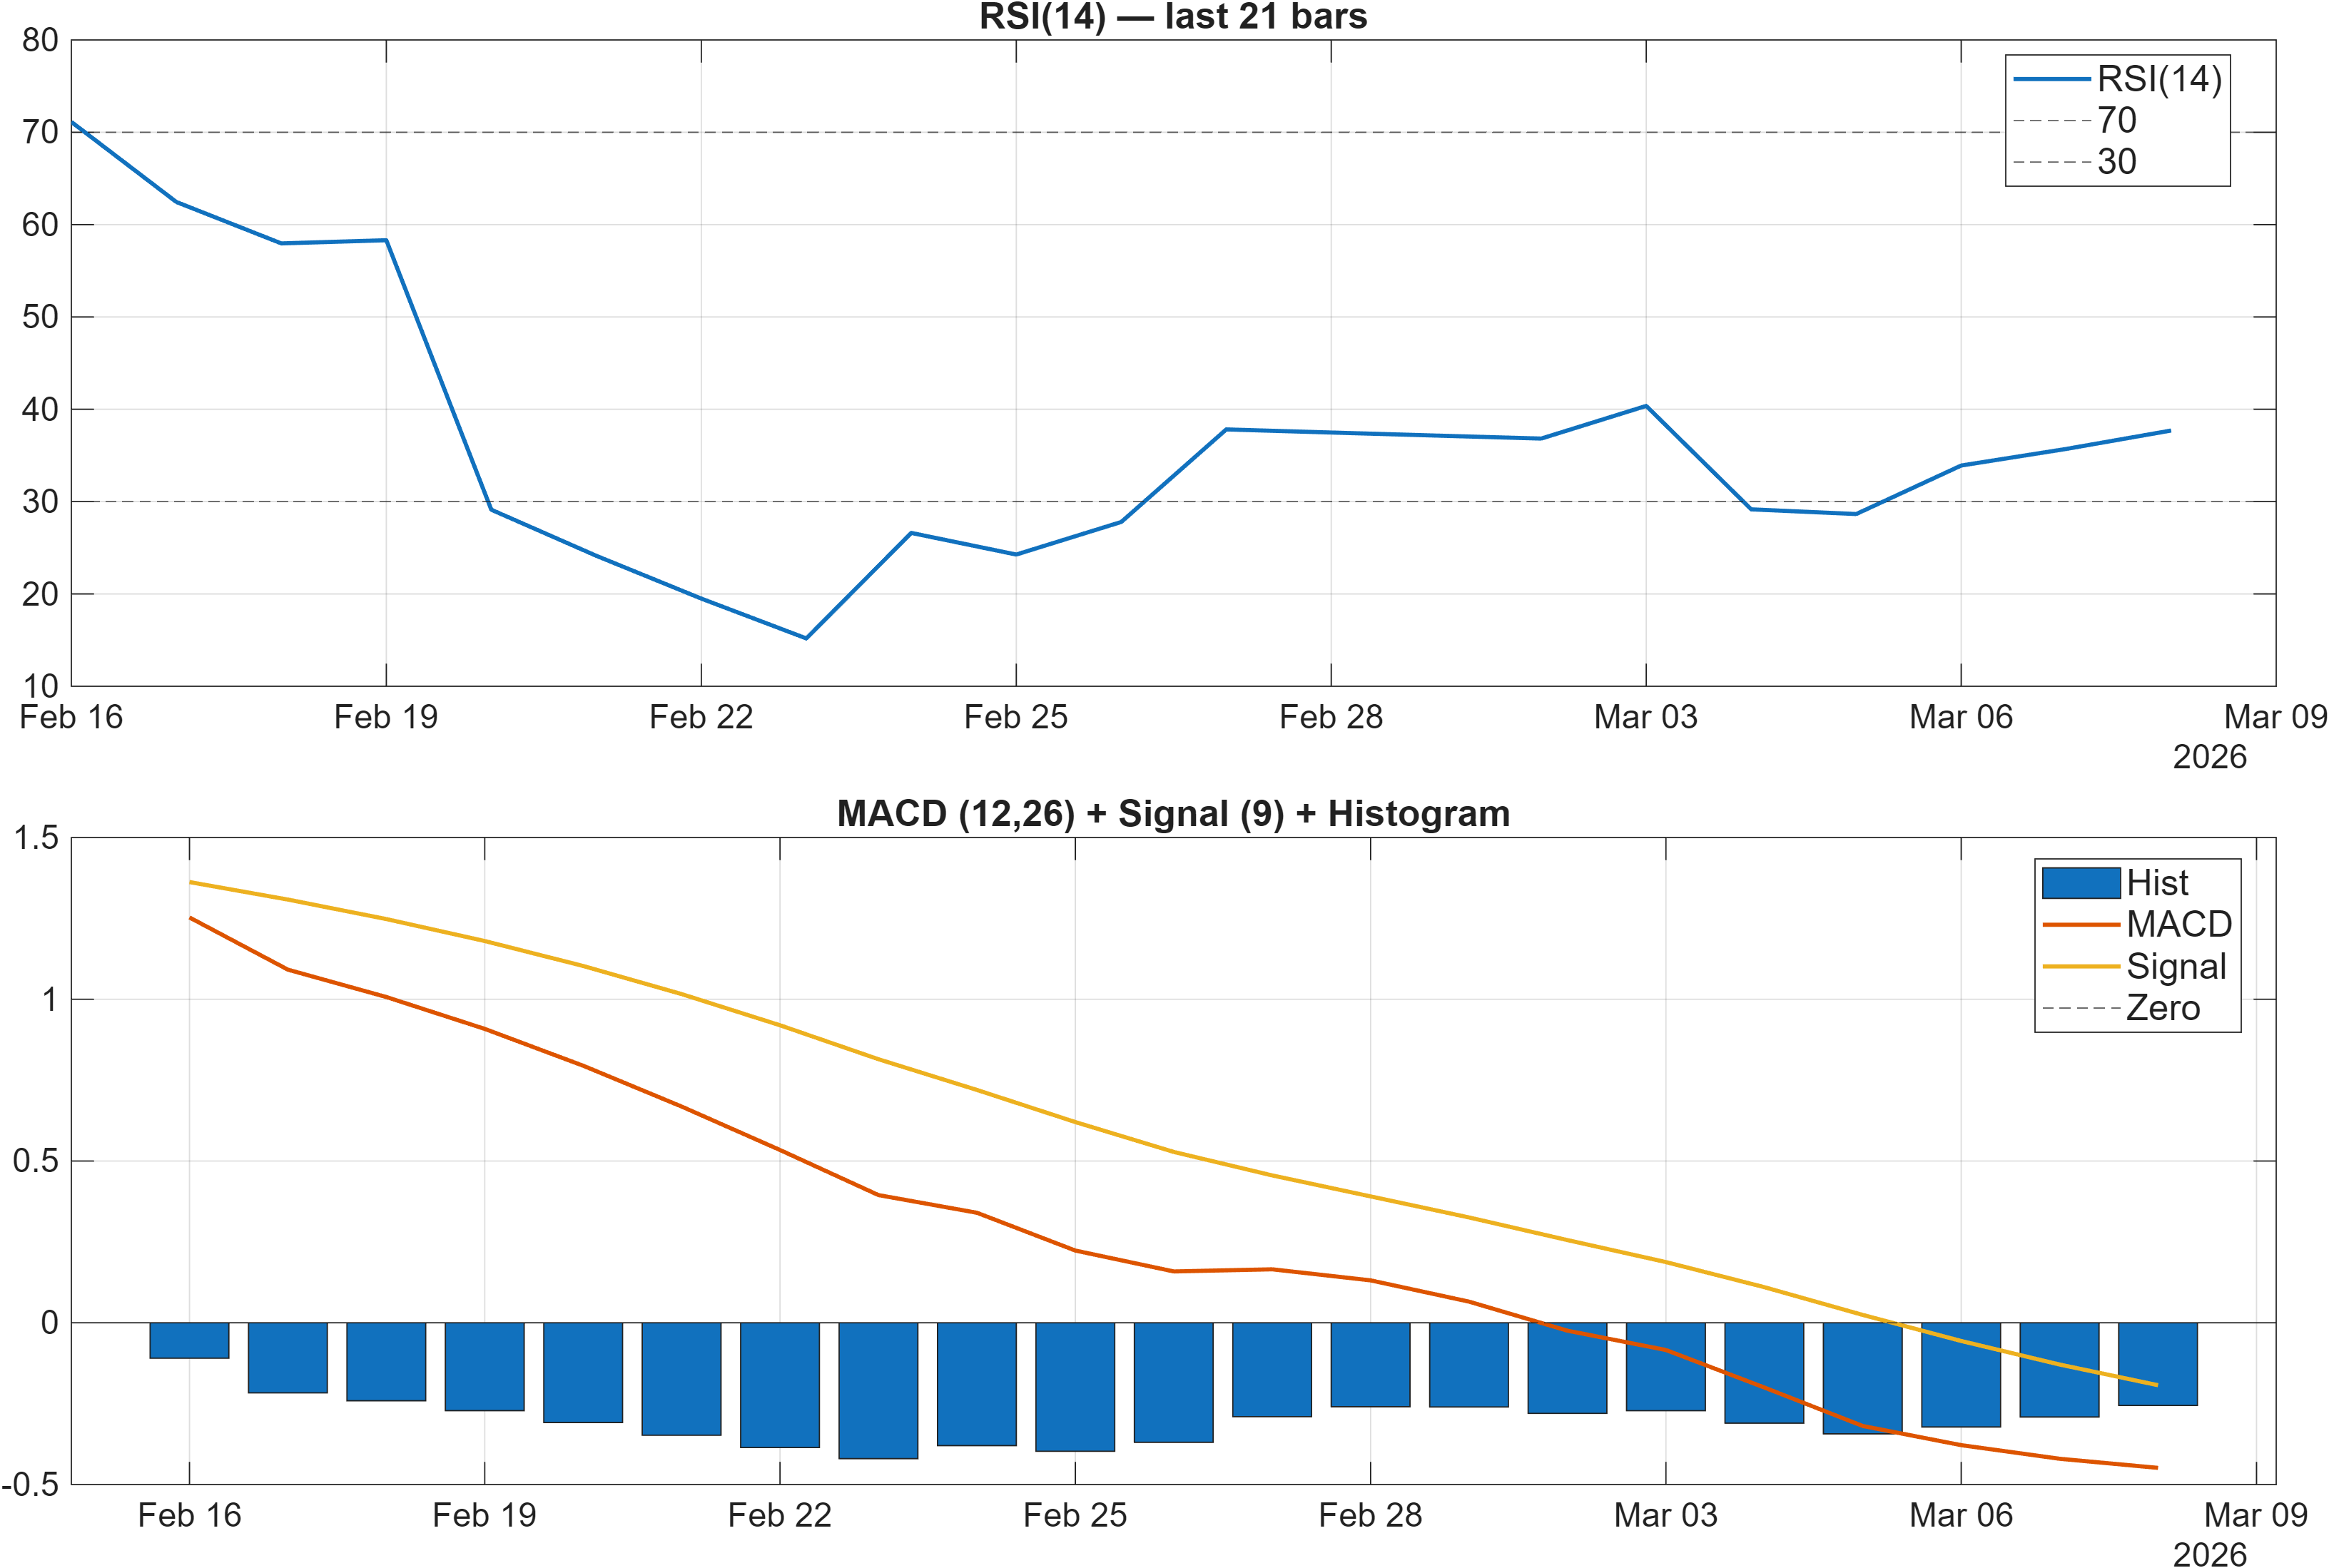
Interpretation: RSI bias = Bearish, MACD hist = -0.2556.
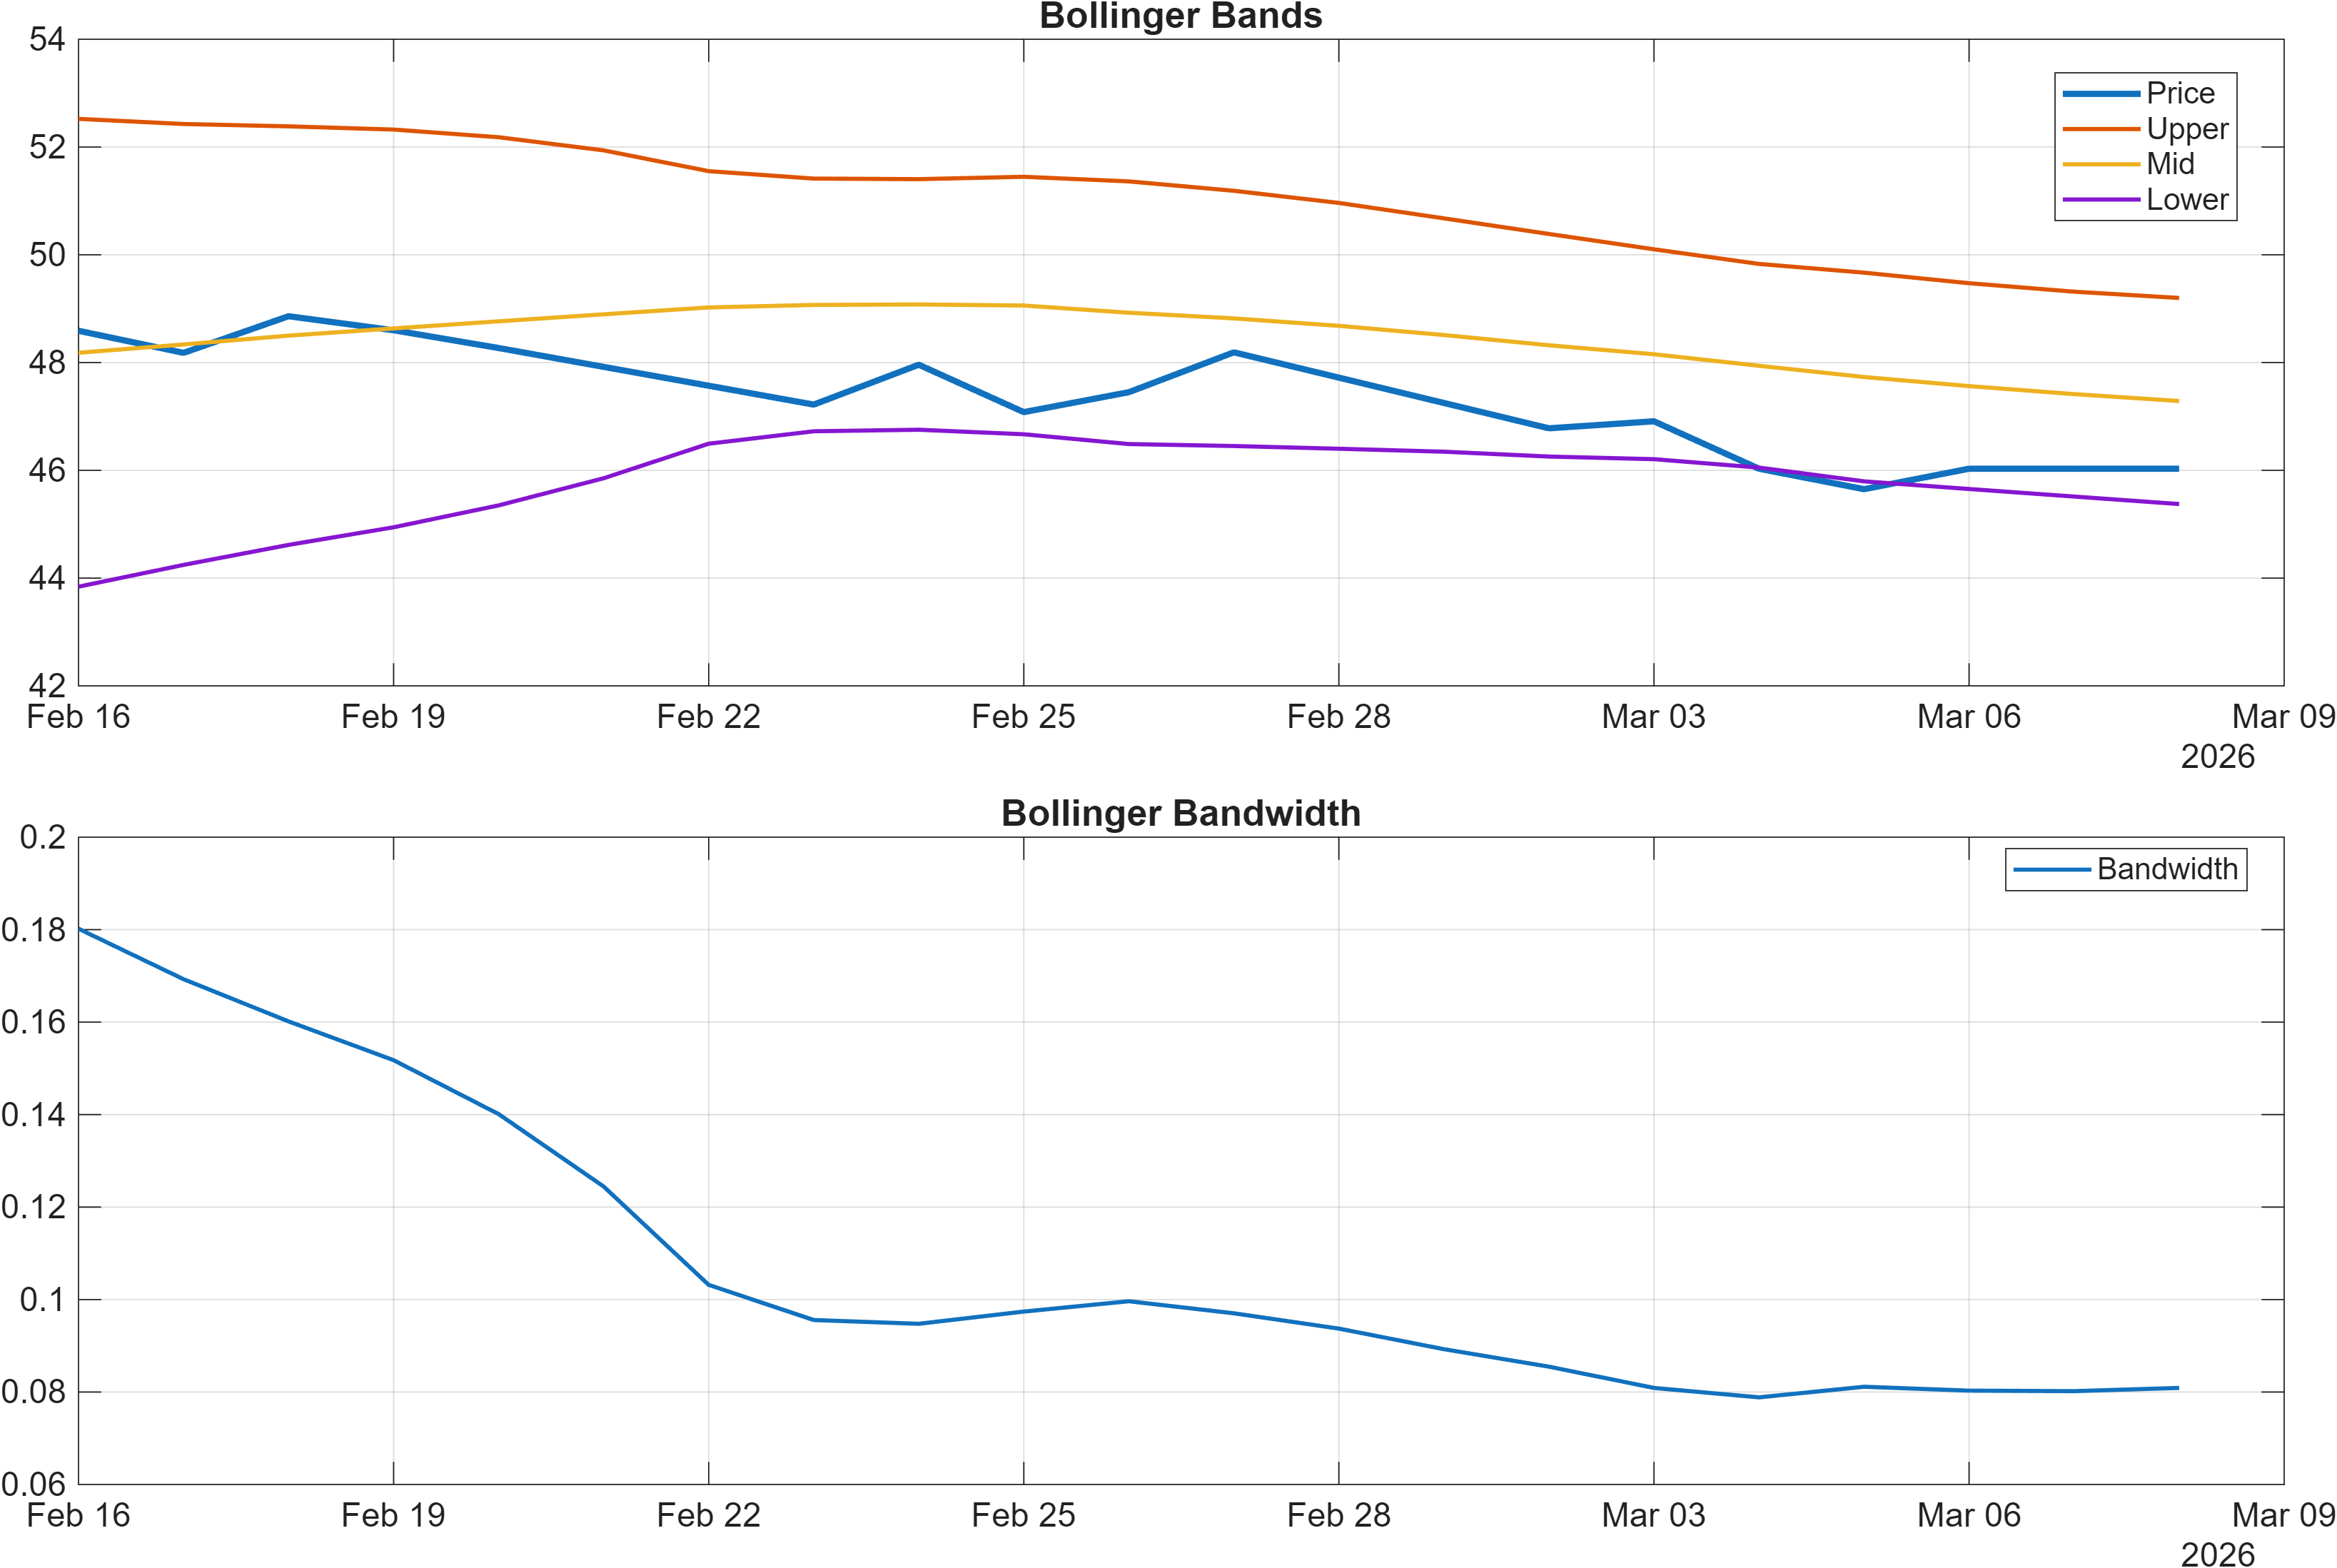
Interpretation: Bandwidth (volatility regime) latest = 0.0809.
Momentum: bearish bias with room for mean reversion
Momentum reads as pressured rather than stabilizing: RSI(14) at 37.7 sits below the typical midline threshold used to separate bullish from bearish momentum regimes, and the MACD histogram at -0.2556 confirms negative momentum carry. In isolation, these are not “timing tools,” but together they indicate that upside attempts may face friction until momentum either bottoms and turns or price breaks key resistance with force.
Volatility regime: compression increases level sensitivity
Bollinger Bandwidth at 0.0809 points to a relatively compressed volatility state. Compression does not provide direction; it increases the importance of breakout validation. In practice, this tends to elevate the informational value of nearby support/resistance (support 41.4175, resistance 50.6963) because a compressed regime can transition quickly into expansion once price resolves a range.
Divergence risk: long-horizon ranks vs short-horizon momentum
A key nuance is the coexistence of very strong long-horizon ranks (3-Month #21; 6-Month #34) with bearish momentum readings. That combination can occur during a repair phase where the asset still “fits” longer-term factor structures, but the market is demanding confirmation. If momentum improves while volatility expands constructively, the longer-horizon ranks gain practical relevance; if momentum remains bearish and price breaks support, the neutral technical blend can skew more decisively negative.
4) Support / Resistance zones
Support ~ 41.4175 | Resistance ~ 50.6963
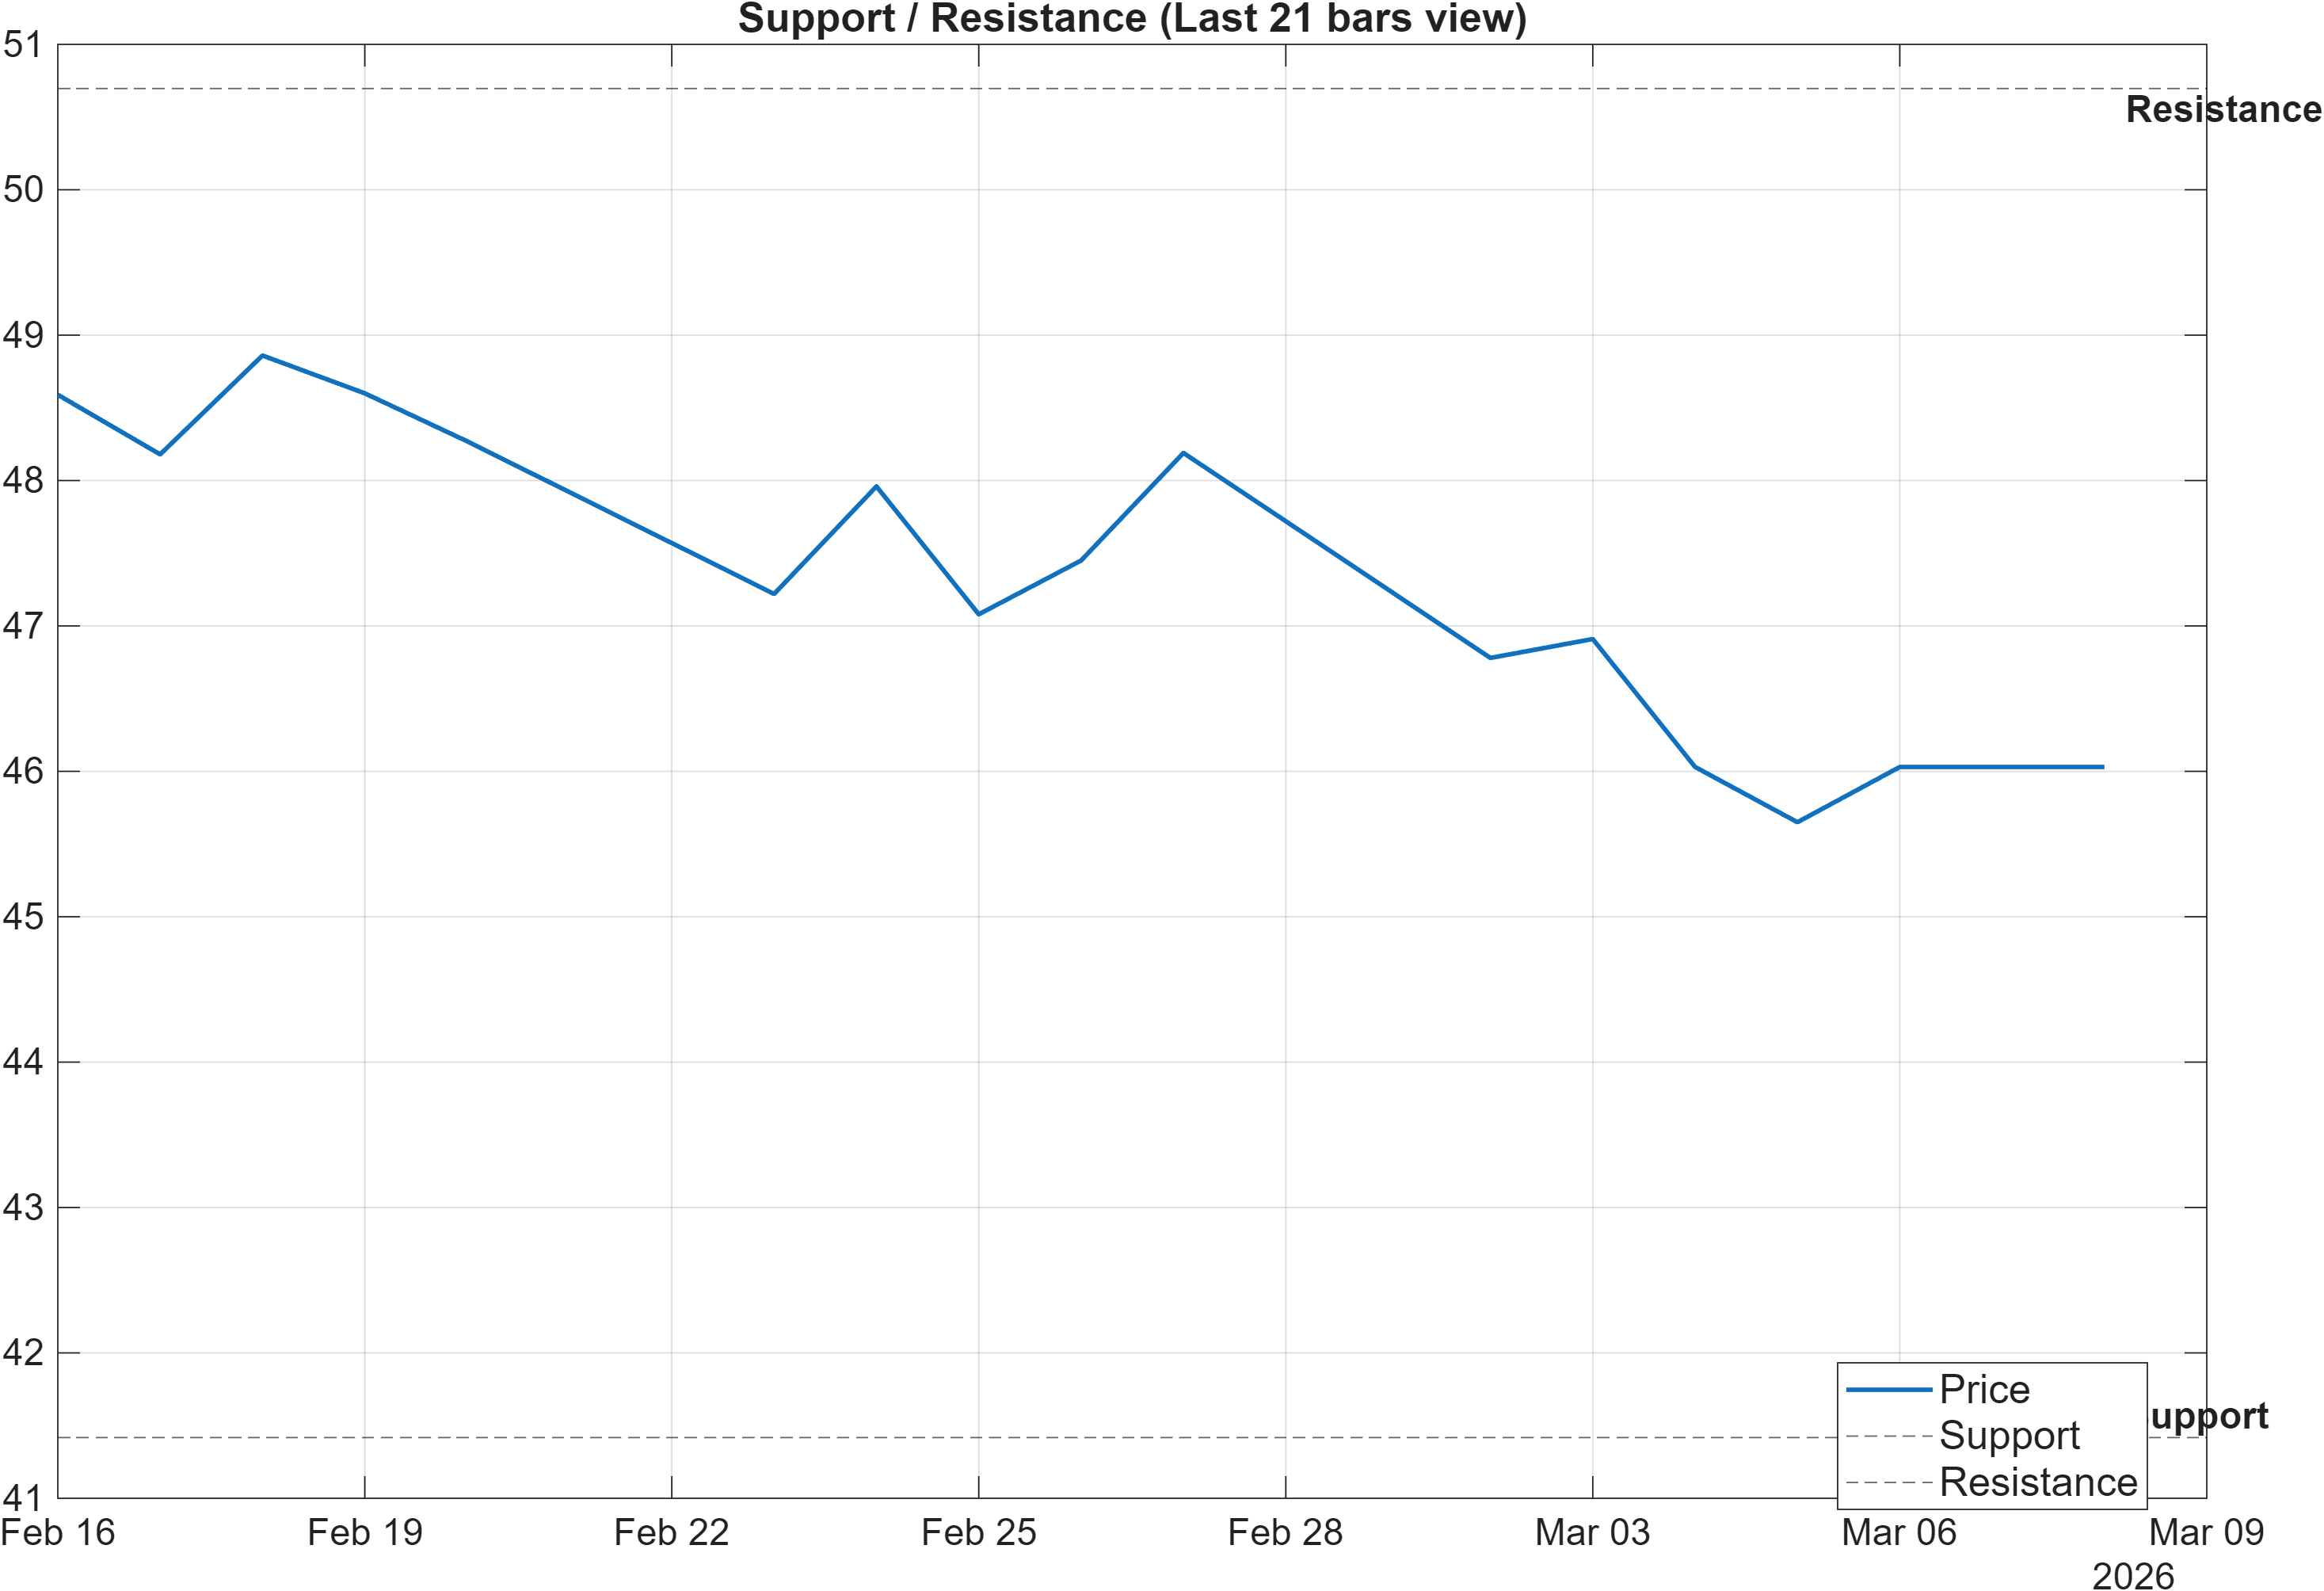
Scenario view: Break above resistance with volume → continuation. Close below support → signal deterioration risk.
Decision zones: defining continuation vs deterioration
The current map is clean and binary: 41.4175 functions as the key downside decision zone, while 50.6963 is the principal upside gate. With trend structure bearish (Close vs MA50 bearish; MA50 vs MA200 bearish) and momentum still weak (RSI(14) 37.7; MACD histogram -0.2556), these levels take on added weight because they separate “technical repair” from “failed stabilization.”
How level interaction fits the confluence profile
The 18-signal confluence score is -0.222 (Neutral) and the blended overall technical score is -0.141 (Neutral). Neutral readings often mean the market is range-prone unless a level break forces signal realignment. A confirmed move above 50.6963 would typically be expected to improve the proportion of bullish signals (for example, by lifting momentum and trend-following components). Conversely, closes below 41.4175 tend to pull more components into bearish alignment, making the neutral label less stable.
Compression amplifies the impact of breakouts
Volatility compression (Bandwidth 0.0809) raises the probability that the next decisive move is more directional than incremental. In that context, “break above resistance with volume” is not a slogan; it is a filtering mechanism designed to avoid mistaking low-volatility oscillation for trend resumption. Level-based validation is especially important when the rank profile is split across horizons (Monthly #1629 vs 3-Month #21).
5) Quant Technical Dashboard (18 Signals)
KGNAI AI Technical Analysis Score (Deep Reinforcement Learning): Rank #982 out of 2066 (Rank 1 represents the strongest technical positioning and a higher probability of favorable price behavior. As ranks increase toward the maximum, the probability of favorable outcomes weakens and bearish positioning becomes more dominant.) | Label: Neutral | Score: 0.049
18-Signal Technical Confluence Score: -0.222 (Neutral)
Overall Technical Score (18-signal confluence + DRL rank blend): -0.141 (Neutral)
Note: The blended score reflects signal strength weighted against broader AI technical ranking, which may temporarily diverge.
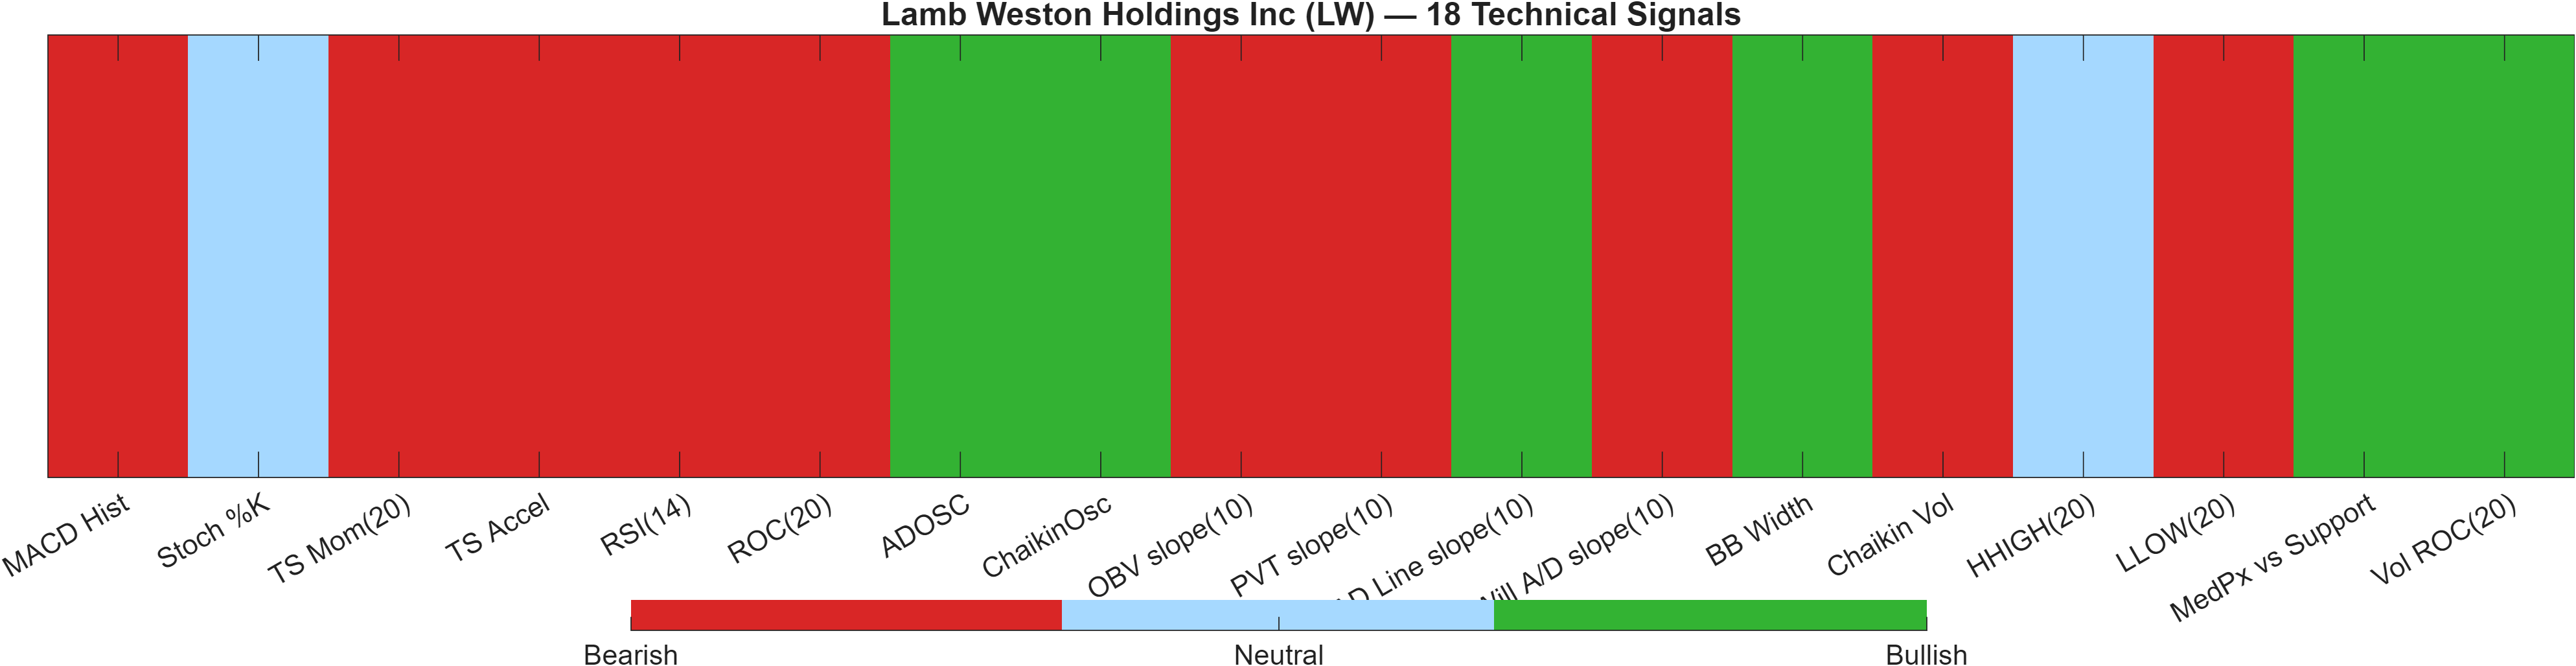
Blended technical score breakdown: -0.141 (Neutral | Bull 6 / Bear 10 / Neutral 2)
Signal balance and what “Neutral” really implies here
LW’s technical regime is not neutral because signals are evenly split; it is neutral because bearish pressure is present but not fully decisive in the blended framework. The breakdown (Bull 6 / Bear 10 / Neutral 2) leans bearish, yet the aggregate still prints -0.141 (Neutral). This kind of configuration often occurs when certain sub-systems (money flow or volatility compression) offset weaker trend and momentum conditions, keeping the composite from tipping into a clean bearish label.
Where the bearish weight is coming from
The most analytically relevant bearish contributors are consistent with the momentum/trend narrative: RSI(14) is 37.7 (bearish bias), MACD histogram is -0.2556, and time-series momentum and acceleration are negative (-2.15 and -4.37). Those readings typically indicate that rallies may struggle to compound unless price can reclaim key trend anchors and momentum starts to rotate upward.
Offsets: participation and volatility signals preventing a full bearish regime
Offsetting factors are visible in select participation and volatility components. For example, ADOSC is positive (70.19) and AD Line slope(10) is positive (5.593e+06), while Bollinger width is marked bullish (with BB Width shown as 0.08089, consistent with the reported bandwidth 0.0809). In combination, these suggest the market may be tightening and selectively accumulating even as price remains under bearish moving-average structure. The DRL technical rank at #982 (Neutral; score 0.049) reinforces the “middle-of-the-pack” posture rather than a high-conviction trend state.
Signal table (Bull/Bear/Neutral)
| Indicator | Value | Signal |
|---|---|---|
| MACD Hist | -0.2556 | Bearish |
| Stoch %K | 33.8 | Neutral |
| TS Mom(20) | -2.15 | Bearish |
| TS Accel | -4.37 | Bearish |
| RSI(14) | 37.7 | Bearish |
| ROC(20) | -4.462 | Bearish |
| ADOSC | 70.19 | Bullish |
| ChaikinOsc | 1.746e+06 | Bullish |
| OBV slope(10) | -7.396e+05 | Bearish |
| PVT slope(10) | -2.864e+04 | Bearish |
| AD Line slope(10) | 5.593e+06 | Bullish |
| Will A/D slope(10) | -1.474 | Bearish |
| BB Width | 0.08089 | Bullish |
| Chaikin Vol | 16.16 | Bearish |
| HHIGH(20) | 50.39 | Neutral |
| LLOW(20) | 44.89 | Bearish |
| MedPx vs Support | 4.253 | Bullish |
| Vol ROC(20) | 98.25 | Bullish |
Interpretation: Indicator-level signals form the base confluence, which is then adjusted using a separate AI-driven technical ranking model. The final technical score summarizes this combined view.
6) News sentiment + extractive gist
Sentiment score (avg): -0.001 | Positive: 15% | Neutral: 67% | Negative: 19%
KGNAI AI News Sentiment Score (normalized -1 to +1): 0.86 (as of 2026-03-06) | Label:
Bullish
| Overall news score: 0.86
Positive Developments
Recent coverage across major financial outlets indicates a constructive thread centered on operational execution and periodic results outperformance, alongside investor debate about what that implies for demand and margin durability. This aligns with KGNAI’s normalized news score of 0.86 (Bullish), suggesting the language in articles and summaries has skewed toward favorable framing even when price action remains technically cautious. The sentiment distribution also shows that explicitly positive items exist (15%), which can matter when volatility is compressed (Bandwidth 0.0809) because incremental narrative changes can catalyze a range break. In the current setup, constructive news tends to function less as a standalone driver and more as a confirmation input—helping validate an upside resolution if price can clear resistance near 50.6963 with participation.
Neutral / Mixed Developments
The dominant feature of the news mix is neutrality: 67% of items are classified as neutral, and the average sentiment score is effectively flat at -0.001. That combination typically reflects informational releases, positioning commentary, and valuation or event-calendar notes that do not materially shift the market’s probability map. In a technical context where the blended score is -0.141 (Neutral), this “mostly neutral” news environment can reinforce a sideways-to-range condition until a catalyst coincides with a technical trigger. Traders and longer-horizon investors often see this as a period where levels and price response carry more information than narrative tone.
Negative / Risk Signals
Risk-oriented coverage appears to cluster around sector sympathy moves and investor positioning changes, which can introduce short-term pressure without necessarily changing the longer-horizon rank posture (3-Month #21; 6-Month #34). The negative share of coverage is 19%, and while that is not dominant, it is sufficient to amplify downside sensitivity when momentum is already weak (RSI(14) 37.7; MACD histogram -0.2556). In this configuration, negative narratives tend to matter most if they coincide with technical invalidation—particularly any sustained break below 41.4175, where neutral confluence can transition into a more decisively bearish technical regime.
What to monitor next
- Whether sentiment remains constructive (news score 0.86) while price tests 50.6963, or if tone fades during resistance rejection.
- Any clustering of negative items alongside weak momentum readings (RSI 37.7, MACD hist -0.2556).
- Event timing relative to volatility compression (Bandwidth 0.0809), which can magnify reactions.
Snapshot: AI Rank (Short–Mid–Long): Mixed (Bullish tilt) (Bullish–Neutral–Bullish) · Technical Confluence: Neutral · Key Levels: Support ~41.42 | Resistance ~50.70 · News Sentiment: Neutral
7) Sources
Source URLs are not reproduced here. Not available in the provided data.
You may also like: How KGNAI AI ranks instruments across global markets
Disclaimer: KGNAI provides AI-generated analytics and educational market commentary only. This is not financial advice. Markets involve risk. Always do your own research.