
ARWR (Arrowhead Pharmaceuticals Inc) — 29-Apr-2026 Technical & Rank Review with Bearish Bias as Trend Strength Fades
Arrowhead Pharmaceuticals Inc (ARWR) currently sits in the lower tier of the KGNAI ranked universe, with consistently weak placements across daily through yearly horizons (2058 instruments tracked). While the moving-average structure is still supportive (close vs MA50 and MA50 vs MA200 both flagged bullish), the broader evidence tilts toward signal deterioration rather than clean trend continuation. Momentum gauges are not confirming a strong advance: RSI is 47.11 (neutral) while the MACD histogram is -0.3000, a configuration that often reflects fading upside impulse. Volatility conditions are moderate with Bollinger Bandwidth at 0.2005, implying price may be compressing into a decision zone rather than trending smoothly. From a market-structure perspective, the key technical battleground remains defined by support ~55.2700 and resistance ~74.4900. News sentiment metrics read constructive on the model, but the price/flow indicators remain mixed, keeping the burden of proof on confirmation through level-based acceptance.
Key Takeaways
- Short / Mid / Long rank stance: Bearish / Bearish / Bearish (ranks concentrated near the bottom of a 2058-instrument universe).
- Technical confluence label: Neutral (18-signal score -0.167) with a bearish blended technical view (-0.355).
- Key levels: Support ~55.2700 | Resistance ~74.4900.
- News sentiment bias: Slightly constructive in scoring (avg sentiment 0.022; normalized score 0.99) despite a neutral distribution (16% positive / 79% neutral / 5% negative).
- Confirmation / invalidation condition: Acceptance above 74.4900 with volume favors continuation; sustained closes below 55.2700 increase deterioration risk.
What KGNAI Measures
KGNAI evaluates assets using large cross-sectional datasets built from millions of structured data points. Inputs incorporate fundamental metrics, technical structures, and systematically processed news sentiment. Statistical models, machine learning, and AI frameworks are used to assess relative positioning, signal alignment, and probabilistic behavior across broad universes.
How to Read This Report
- Ranks are comparative across the tracked universe, not absolute price targets.
- Confluence reflects alignment among independent signal groups.
- Support/resistance levels are probabilistic decision zones, not guarantees.
- Sentiment provides contextual bias within the broader analytical framework.
1) KGNAI AI Analysis
Region: USA
Total universe size: 2058 ranked instruments
- Daily rank: #2017 out of 2058 — Bearish
- Weekly rank: #2036 out of 2058 — Bearish
- Monthly rank: #1924 out of 2058 — Bearish
- 3-Monthly rank: #1884 out of 2058 — Bearish
- 6-Monthly rank: #1730 out of 2058 — Bearish
- Yearly rank: #1737 out of 2058 — Bearish
ARWR’s rank profile is uniformly bearish across all measured horizons, clustering in the lowest decile of the 2058-instrument universe. The daily placement at #2017 and weekly at #2036 suggest the near-term cross-sectional setup remains weak versus peers, rather than reflecting a short-lived anomaly. Importantly, the longer windows do not contradict that message: the 6-month rank at #1730 and yearly at #1737 remain meaningfully elevated (i.e., worse), indicating that the model continues to classify ARWR as lower-quality relative price behavior over extended horizons.
This is a classic persistence signal in rank-based frameworks: when short-, medium-, and long-horizon ranks align in the same direction, the primary question becomes whether any technical or flow-based evidence is emerging that could precede a regime transition. At present, later sections show some supportive elements (e.g., certain momentum and accumulation metrics), but they have not been sufficient to dislodge the broader bearish regime classification.
The term view remains unambiguous: Short-term: Bearish. Mid-term: Bearish. Long-term: Bearish. For risk framing, that alignment typically increases the importance of level discipline (support/resistance and acceptance) rather than discretionary narratives. If a reversal is forming, it usually requires confirmation through improving momentum structure and stronger participation signals—not merely isolated green sessions.
2) Price & trend overview
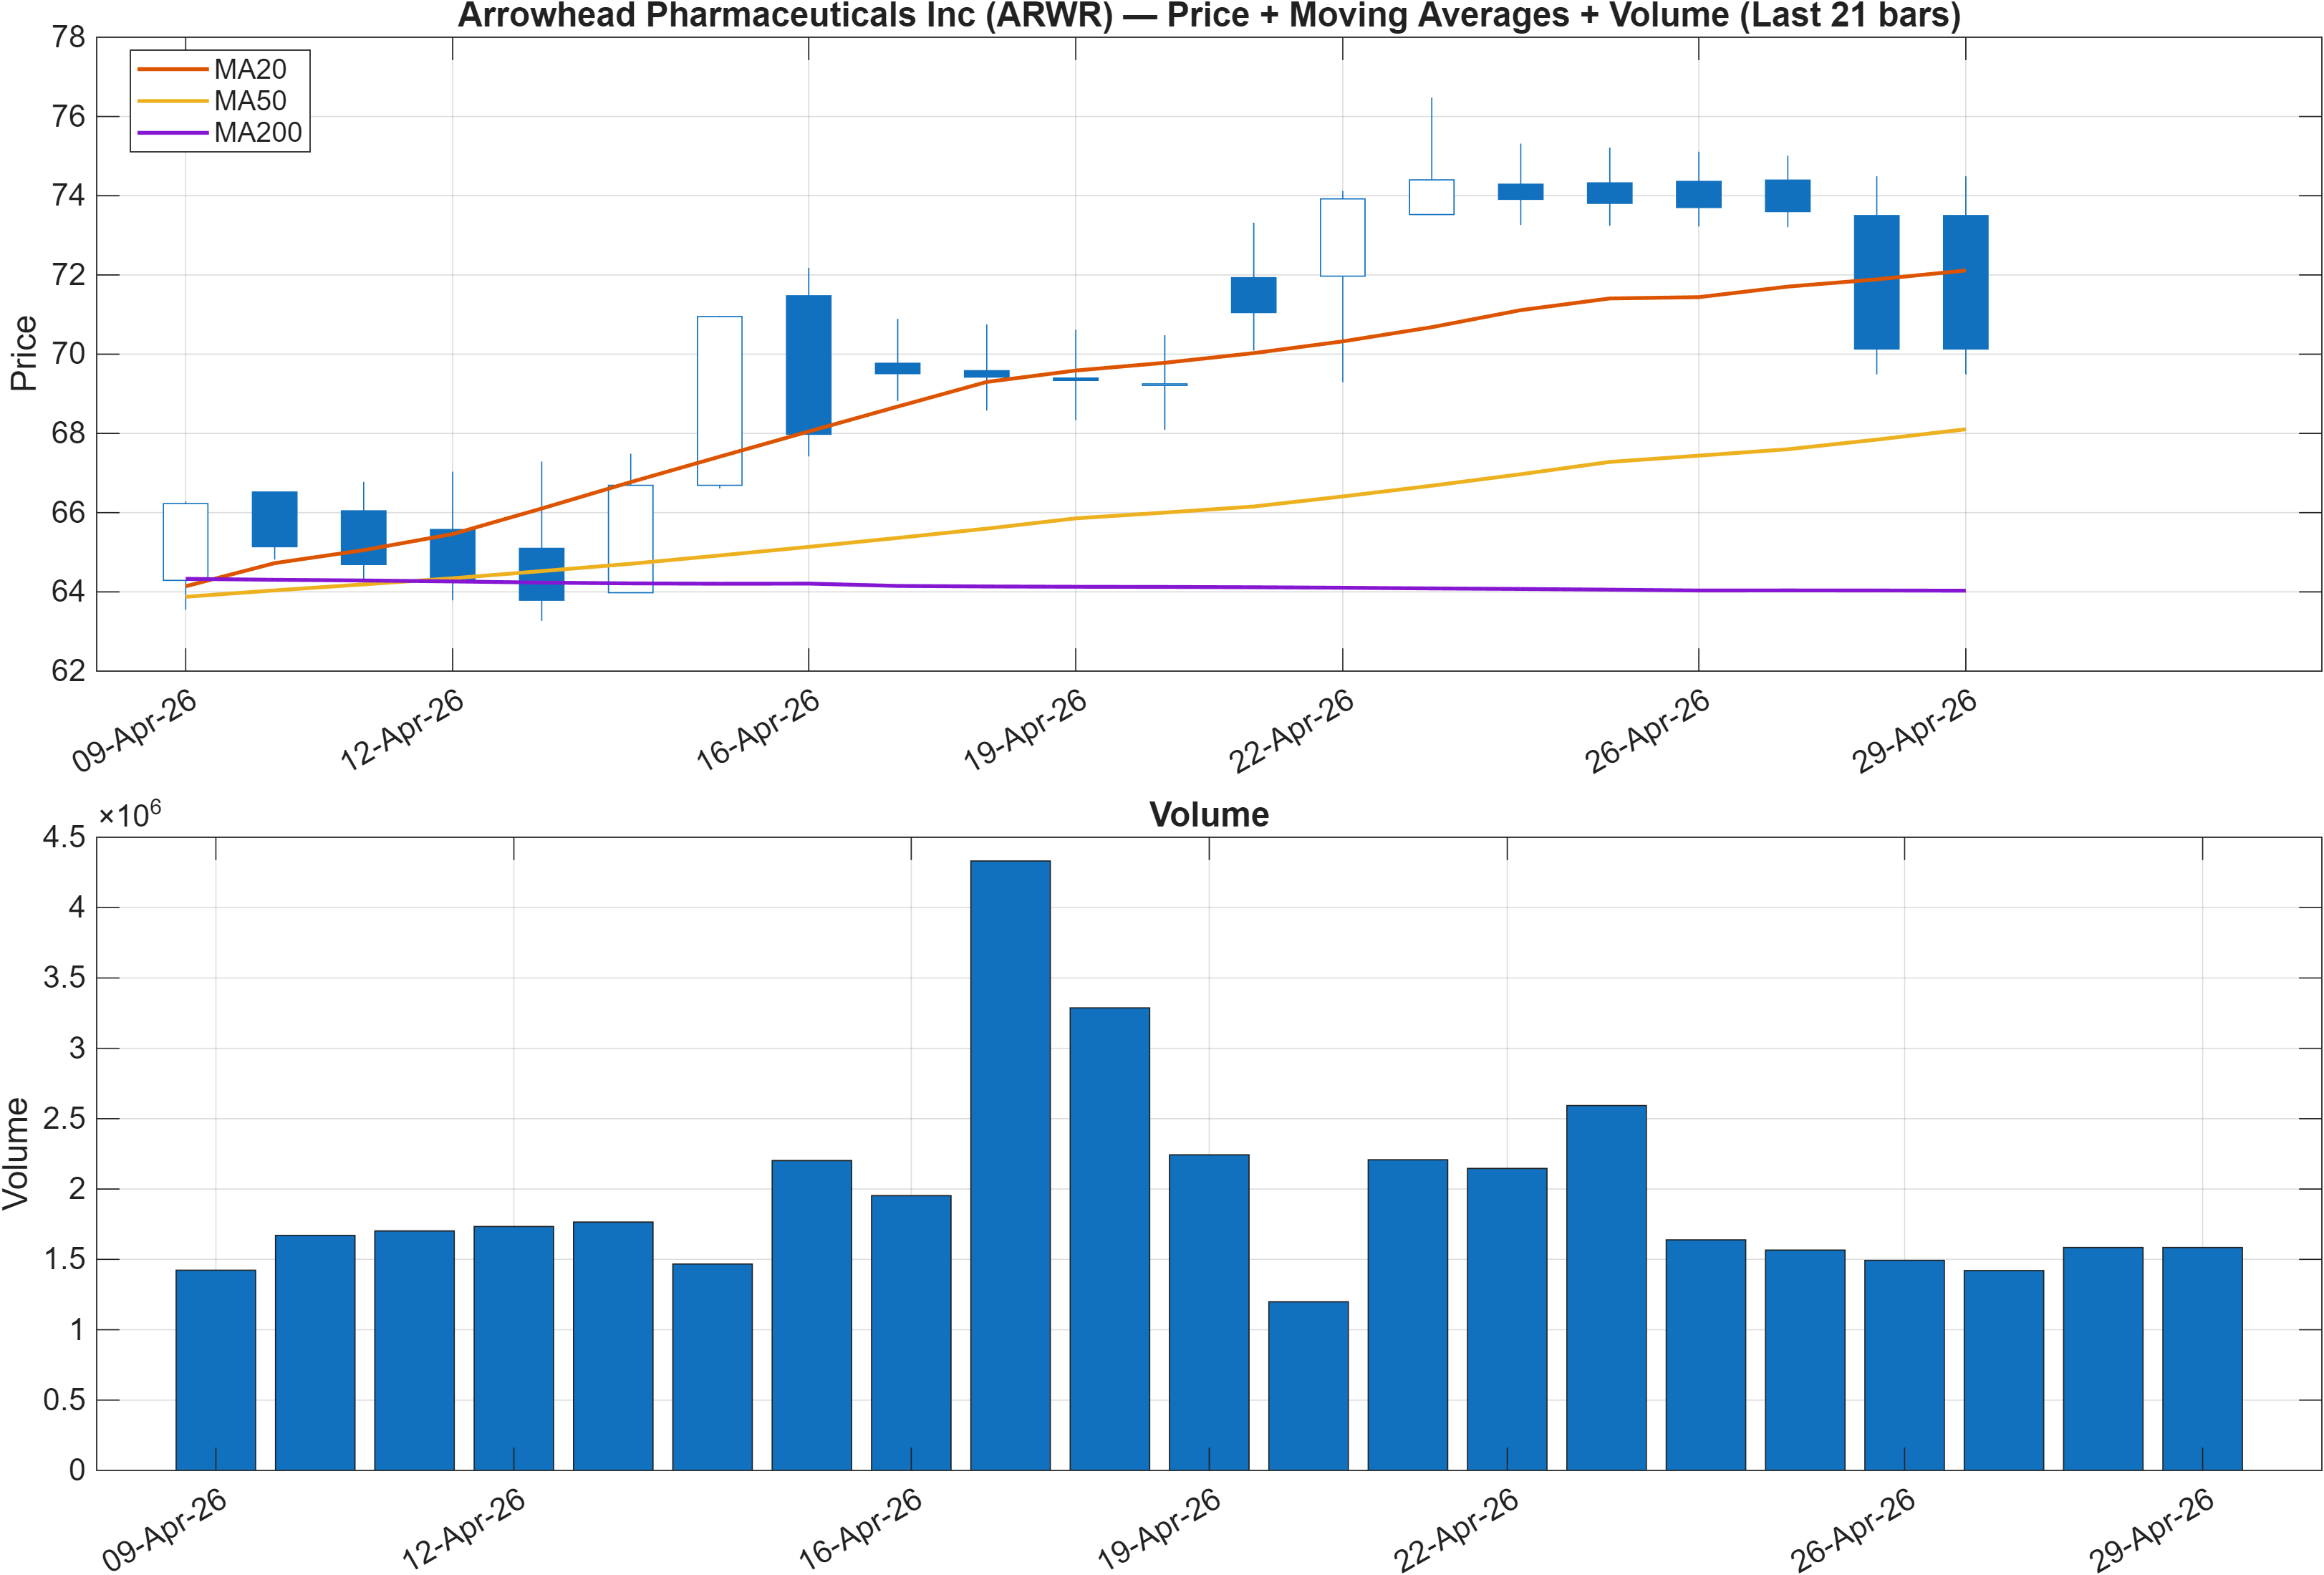
Interpretation: Close vs MA50 = Bullish, MA50 vs MA200 = Bullish.
The moving-average stack communicates a residual bullish trend structure: price is above the MA50, and the MA50 is above the MA200. In isolation, this combination often characterizes an uptrend or a late-stage recovery phase. However, ARWR’s cross-sectional ranks remain deeply bearish, which introduces a trend-versus-relative-strength divergence: the chart structure can look acceptable while the instrument still underperforms on probabilistic behavior across the broader universe.
The practical analytical angle is trend persistence vs exhaustion. A mature trend can keep its bullish MA configuration even while internal momentum cools. That is consistent with what appears later in the momentum dashboard (neutral RSI at 47.11 and a negative MACD histogram at -0.3000). When momentum weakens while longer-term averages remain supportive, the market often transitions into a range/repair regime rather than an immediate breakdown.
Volume behavior is explicitly part of the KGNAI cross-validation process. Even without enumerating raw volume statistics here, the combination of: (1) bearish ranks (e.g., weekly #2036), (2) weakening momentum signatures, and (3) nearby decision levels (support 55.2700 / resistance 74.4900) argues for treating the trend as conditional. In this framing, the MA stack is a supportive backdrop, but the market still needs renewed impulse and participation to prevent the bullish structure from becoming lagging evidence.
3) Momentum & volatility dashboard
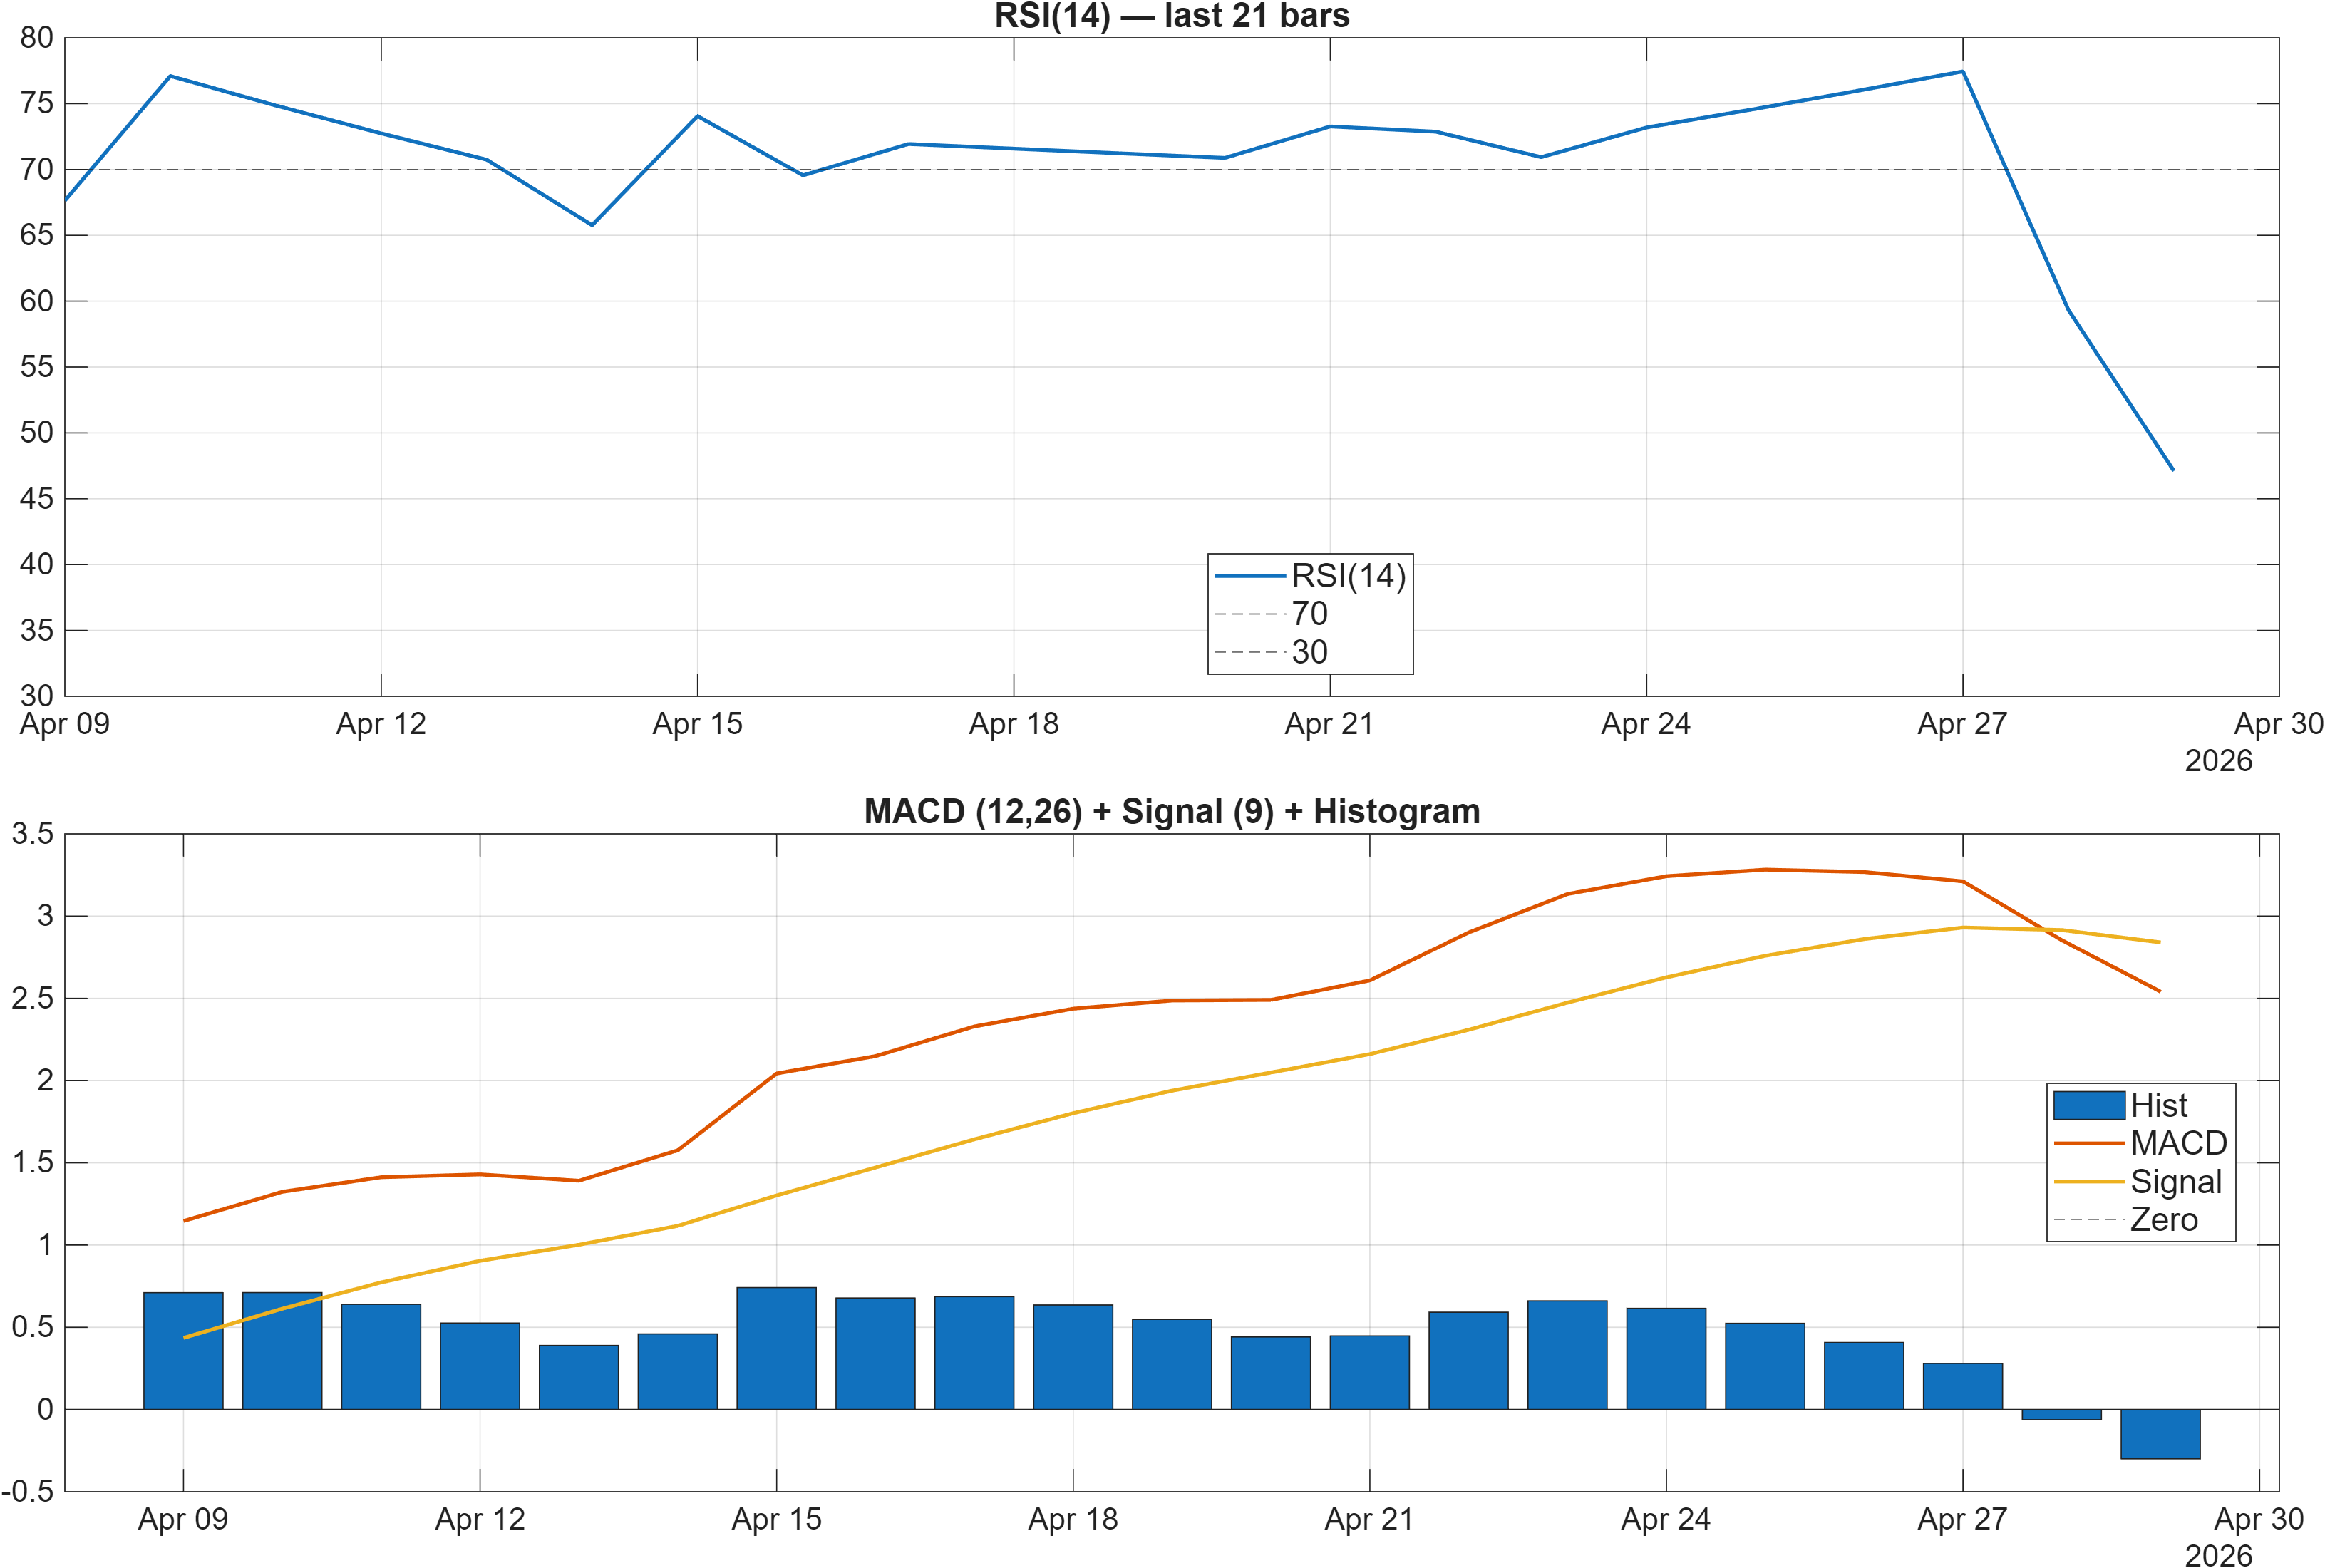
Interpretation: RSI bias = Neutral, MACD hist = -0.3000.
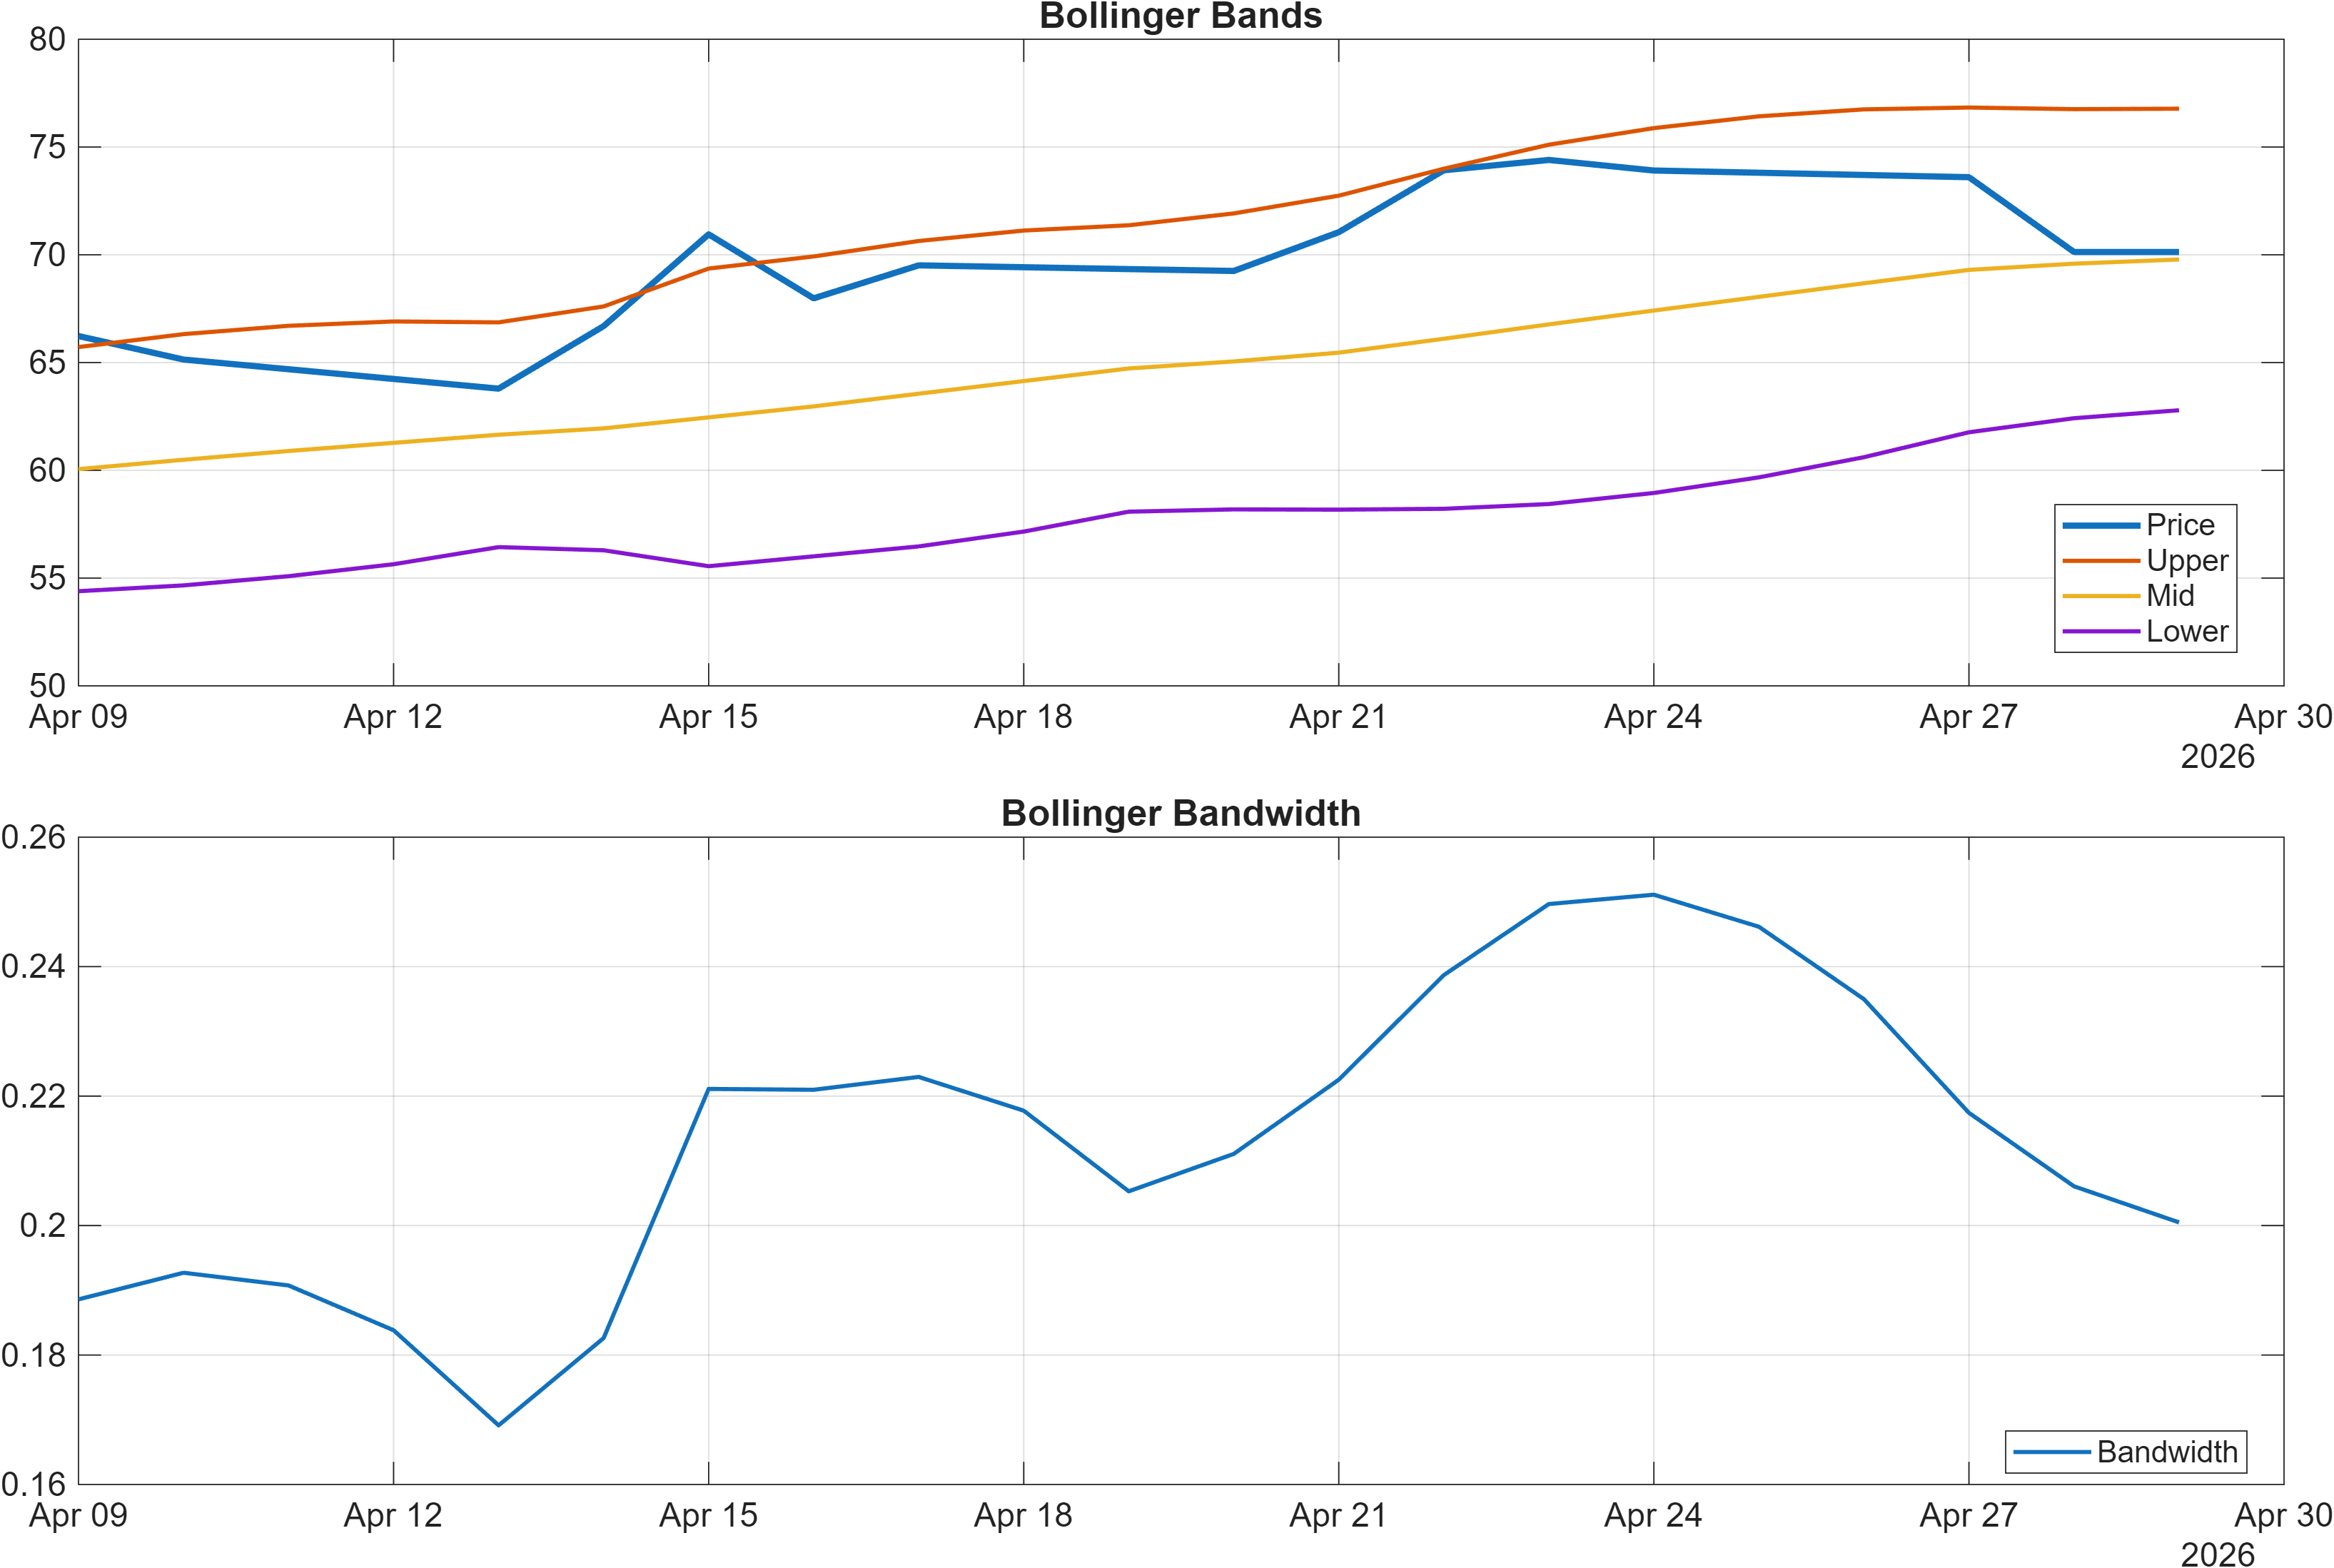
Interpretation: Bandwidth (volatility regime) latest = 0.2005.
The momentum complex is best described as non-confirmation. RSI at 47.11 sits close to the midline, which typically suggests neither sustained accumulation nor capitulation pressure is dominant. At the same time, the MACD histogram at -0.3000 implies downside momentum is still present at the margin—often associated with fading trend energy or a pullback that has not fully resolved.
Volatility, measured through Bollinger Bandwidth at 0.2005, indicates a moderate regime rather than an extreme expansion. In market-structure terms, this tends to coincide with compression phases where directional conviction is reduced, and price becomes more sensitive to acceptance/rejection around key levels. That aligns naturally with the support/resistance map at 55.2700 and 74.4900: in moderate volatility, these zones often behave as higher-frequency decision points.
The internal signal set also hints at a mixed impulse profile: the broader technical dashboard later shows bullish elements like ROC(20) at 7.66 and TS Mom(20) at 4.99, yet acceleration is bearish (TS Accel -3.593). That combination frequently appears when the market has recently bounced but is failing to build incremental speed. In those cases, momentum traders typically watch for MACD histogram improvement toward zero alongside RSI reclaiming stronger territory, while volatility either expands constructively or remains contained without repeated support tests.
4) Support / Resistance zones
Support ~ 55.2700 | Resistance ~ 74.4900
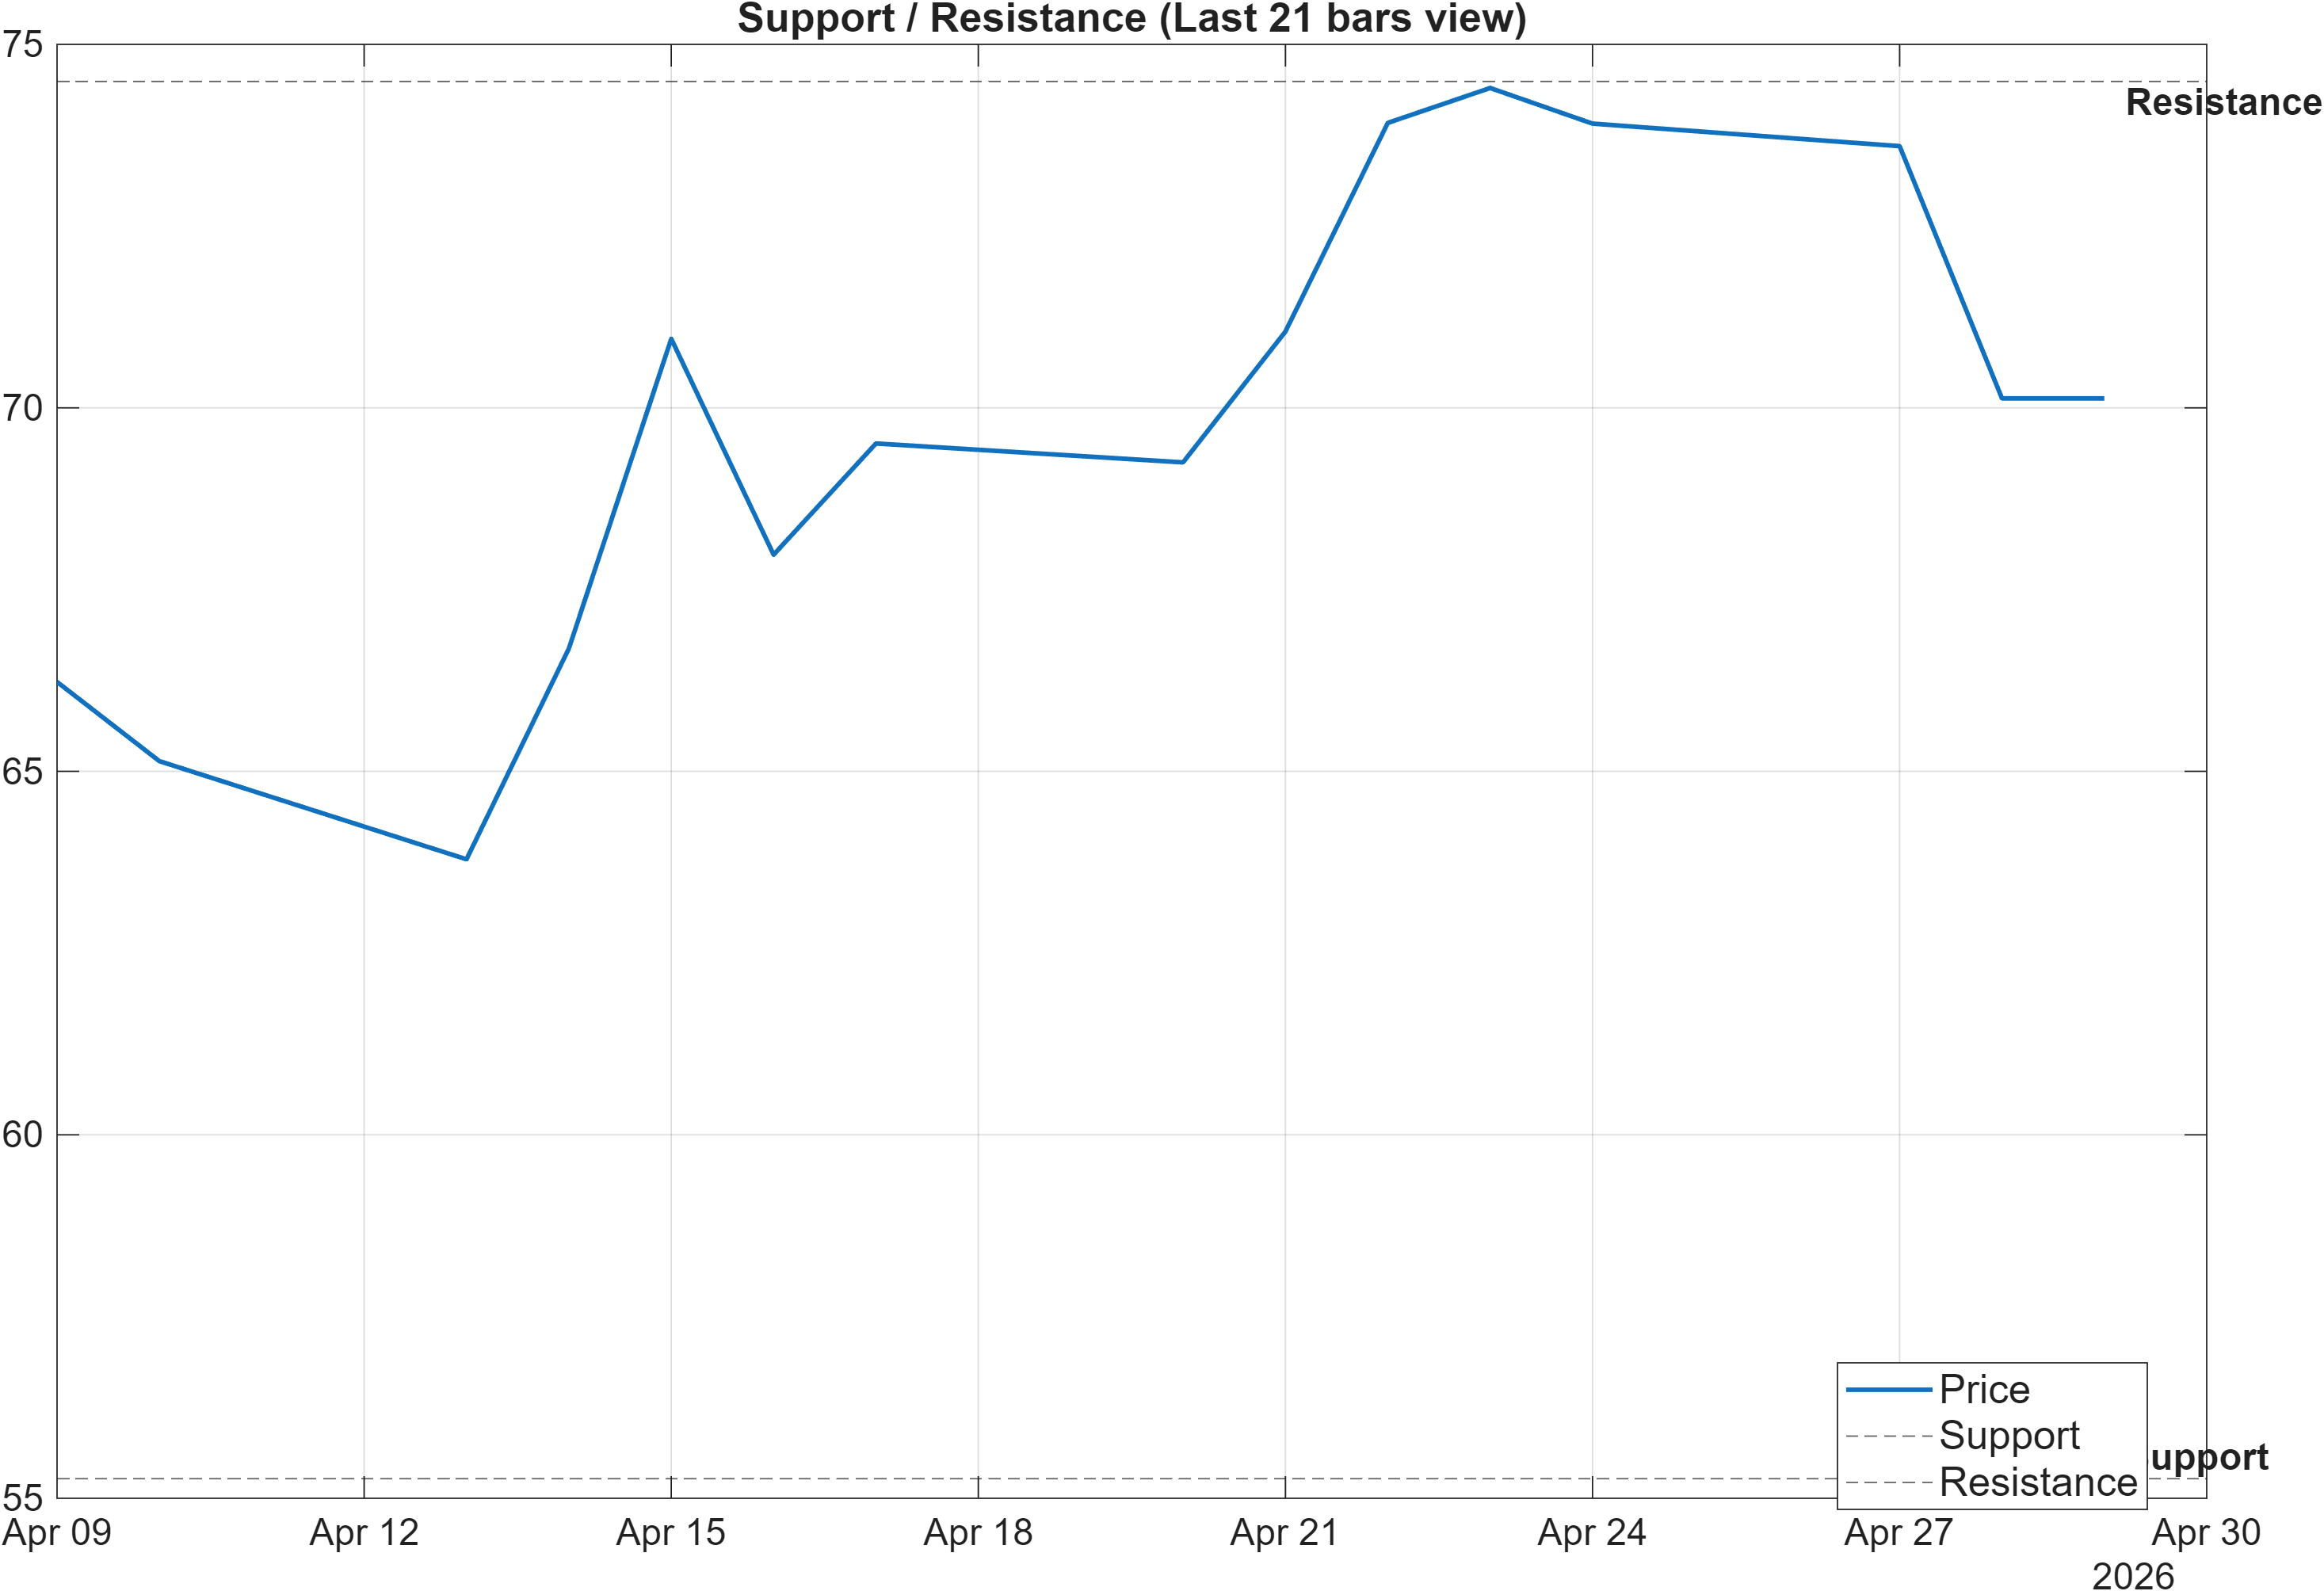
Scenario view: Break above resistance with volume → continuation. Close below support → signal deterioration risk.
The support/resistance framework provides the cleanest decision architecture given the broader signal mix. With support defined at 55.2700, that level functions as a reference point for whether the market is maintaining a higher structural floor or transitioning into a weaker auction. In a setup where RSI is neutral (47.11) and MACD histogram remains negative (-0.3000), repeated interaction with support can become a stress test for trend resilience.
Resistance at 74.4900 represents the nearer-term ceiling that would need to be reclaimed to shift the balance toward trend continuation. The phrasing “break above resistance with volume” matters: it differentiates a transient intraday probe from acceptance that can attract follow-through. When volatility is moderate (bandwidth 0.2005), clean breaks are less frequent, so confirmation often shows up as decisive closes and improved momentum structure rather than single candles.
The key analytical tension is that the MA stack is still bullish (price above MA50; MA50 above MA200), yet ranks are deeply bearish (e.g., monthly #1924, 3-month #1884). That makes the levels more than chart annotations—they become validation gates for whether ARWR is merely consolidating within an older uptrend structure or rotating into a weaker regime. In practice, sustained closes below 55.2700 would align the level-based read with the bearish rank regime, while successful acceptance above 74.4900 would be the cleaner contradiction to the current model stance.
5) Quant Technical Dashboard (18 Signals)
KGNAI AI Technical Analysis Score (Deep Reinforcement Learning): Rank #1846 out of 2057 (Rank 1 represents the strongest technical positioning and a higher probability of favorable price behavior. As ranks increase toward the maximum, the probability of favorable outcomes weakens and bearish positioning becomes more dominant.) | Label: Bearish | Score: -0.795
18-Signal Technical Confluence Score: -0.167 (Neutral)
Overall Technical Score (18-signal confluence + DRL rank blend): -0.355 (Bearish)
Note: The blended score reflects signal strength weighted against broader AI technical ranking, which may temporarily diverge.
Blended technical score breakdown: -0.355 (Bearish | Bull 5 / Bear 8 / Neutral 5)
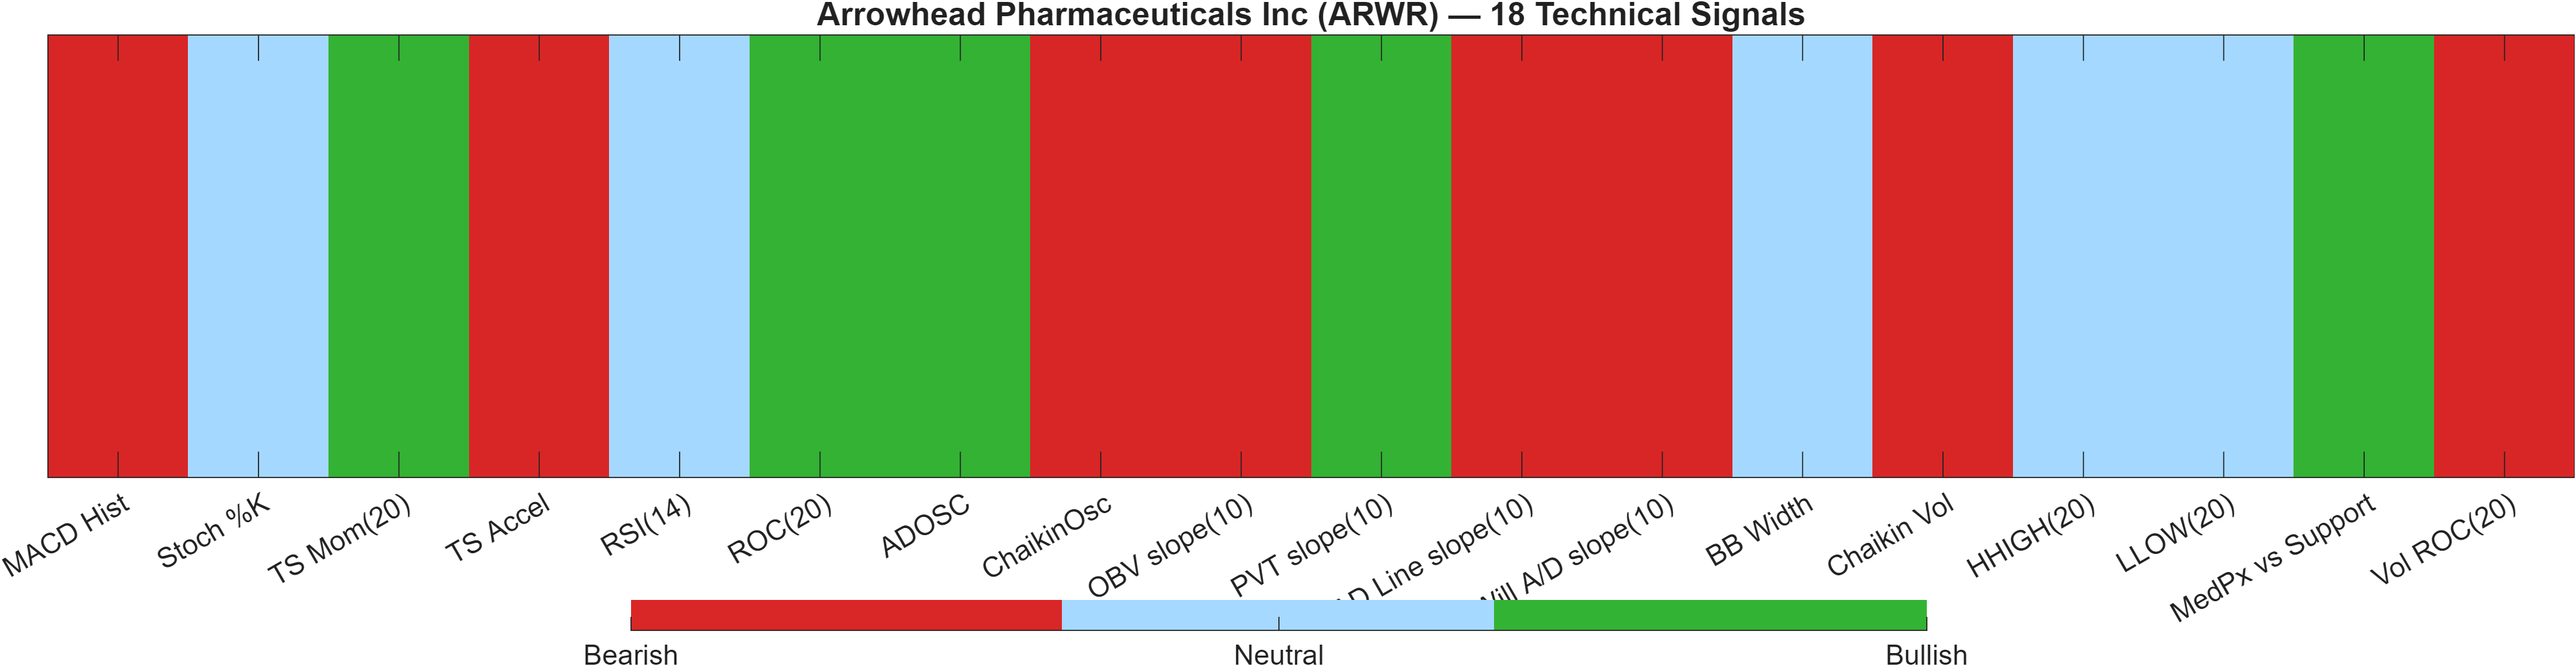
Signal table (Bull/Bear/Neutral)
| Indicator | Value | Signal |
|---|---|---|
| MACD Hist | -0.3 | Bearish |
| Stoch %K | 24.31 | Neutral |
| TS Mom(20) | 4.99 | Bullish |
| TS Accel | -3.593 | Bearish |
| RSI(14) | 47.11 | Neutral |
| ROC(20) | 7.66 | Bullish |
| ADOSC | 16.3 | Bullish |
| ChaikinOsc | -2.143e+06 | Bearish |
| OBV slope(10) | -1.954e+06 | Bearish |
| PVT slope(10) | 6.766e+04 | Bullish |
| AD Line slope(10) | -5.182e+06 | Bearish |
| Will A/D slope(10) | -3.914 | Bearish |
| BB Width | 0.2005 | Neutral |
| Chaikin Vol | 18.34 | Bearish |
| HHIGH(20) | 76.48 | Neutral |
| LLOW(20) | 63.27 | Neutral |
| MedPx vs Support | 16.72 | Bullish |
| Vol ROC(20) | -5.154 | Bearish |
Interpretation: Indicator-level signals form the base confluence, which is then adjusted using a separate AI-driven technical ranking model. The final technical score summarizes this combined view.
The dashboard is best read as a blend of partial recovery signals and persistent participation weakness. The 18-signal confluence score is -0.167 (Neutral), but the overall blended technical score shifts to -0.355 (Bearish) once the Deep Reinforcement Learning technical rank is incorporated (rank #1846 of 2057, score -0.795).
This gap between neutral confluence and bearish blended output is a form of model-level divergence: discrete indicators are not uniformly negative, yet the broader pattern-recognition layer still classifies positioning as weak relative to the universe. The heatmap breakdown (Bull 5 / Bear 8 / Neutral 5) supports that asymmetry—bearish signals dominate without fully overwhelming the set.
Within the signal mix, momentum shows some lift (e.g., ROC(20) 7.66, TS Mom(20) 4.99), but acceleration is negative (TS Accel -3.593) and MACD histogram remains bearish (-0.3), implying the move may lack persistence. Participation/flow proxies are also conflicted: ADOSC 16.3 is bullish while OBV slope(10) -1.954e+06 and AD Line slope(10) -5.182e+06 are bearish. When flow measures disagree, it often increases the importance of price acceptance above resistance (74.4900) before treating the trend as re-accelerating.
6) News sentiment + extractive gist
Sentiment score (avg): 0.022 | Positive: 16% | Neutral: 79% | Negative: 5%
KGNAI AI News Sentiment Score (normalized -1 to +1): 0.99 (as of 2026-04-24) | Label: Bullish | Overall news score: 0.93
Positive Developments
Recent coverage across major financial outlets indicates a generally constructive tone around Arrowhead Pharmaceuticals, with the model’s normalized sentiment reading at 0.99 and an overall news score of 0.93. The positive bias appears less about a single catalyst and more about a steady drumbeat of company- and program-related updates, alongside commentary that frames the stock’s longer-run performance context. That backdrop can matter when technical conditions are mixed: supportive sentiment can help sustain dip-buying interest near defined levels such as 55.2700. Still, the distribution is not uniformly upbeat (only 16% positive), suggesting the bullish scoring is driven by the tone/intensity of constructive items rather than volume of positive articles. In practice, sentiment strength is most actionable when it coincides with improving momentum (e.g., MACD histogram moving up from -0.3000) and clearer acceptance above resistance at 74.4900.
Neutral / Mixed Developments
The dominant feature of the news mix is neutral informational flow, with 79% of items categorized neutral and an average sentiment score of 0.022. This typically corresponds to routine updates, commentary that balances upside and uncertainty, or valuation-oriented discussion that does not materially shift positioning. For ARWR, that neutrality fits the broader technical picture: RSI at 47.11 and Bollinger Bandwidth at 0.2005 both align with a market that may be evaluating rather than trending. When neutral coverage dominates, price often becomes the arbiter—market participants defer to support/resistance behavior and volume confirmation. As a result, the technical “decision zones” remain central even while sentiment signals lean constructive at the model level.
Negative / Risk Signals
Risk-oriented coverage remains a minority (5% negative), but it is still relevant because ARWR’s cross-sectional ranks are deeply bearish (e.g., daily #2017, weekly #2036). In regimes where rank and participation indicators are weak, even a small pocket of negative tone can amplify sensitivity around key levels. The technical dashboard also contains internal risk cues—MACD histogram at -0.3, bearish volume ROC (-5.154), and several bearish accumulation/distribution slopes—suggesting that downside narratives could gain traction if price fails to hold 55.2700. The key is not the quantity of negative items, but whether risk language coincides with a break in market structure (support loss) and a widening of volatility beyond the current bandwidth regime (0.2005).
What to monitor next (contextual, not predictive):
- Whether sentiment remains constructive while momentum improves (watch MACD histogram versus -0.3000).
- Acceptance/rejection behavior around 74.4900 and whether volume supports a breakout attempt.
- Any clustering of risk tone concurrent with sustained closes below 55.2700.
Sources referenced: Reuters, Bloomberg, Yahoo Finance, MarketWatch, Investing.com
7) Sources
Sources referenced: Reuters, Bloomberg, Yahoo Finance, MarketWatch, Investing.com
You may also like: How KGNAI AI ranks instruments across global markets
Disclaimer: KGNAI provides AI-generated analytics and educational market commentary only. This is not financial advice. Markets involve risk. Always do your own research.