
Toyota Motor Corporation ADR (TM) — Neutral ranks, bearish technical confluence, bullish news sentiment (01-May-2026)
Toyota Motor Corporation ADR (TM) presents a split-profile setup as of 01-May-2026: the cross-universe ranking posture is largely Neutral, while the quantified technical stack leans Bearish, and systematically processed news sentiment prints Bullish. In the rank system (2058 instruments), TM sits near the midpoint on the Daily rank (#1018) and improves on the Monthly rank (#353), indicating better longer-horizon relative positioning than the very near-term tape. Price structure is also showing pressure, with the snapshot explicitly reading Close vs MA50 = Bearish and MA50 vs MA200 = Bearish. Momentum confirms the cooling tone via a negative MACD histogram (-1.0995) and an extremely depressed RSI(14) reading (7.496). Key decision zones remain clearly defined: support ~192.1767 versus resistance ~220.5833. The analytical task here is distinguishing oversold mean-reversion potential from trend-following continuation risk.
- Rank stance (Short / Mid / Long): Neutral / Neutral / Neutral (with Monthly rank at #353 stronger than Daily #1018 within 2058).
- Technical confluence: Bearish (18-signal confluence -0.500; overall technical score -0.450).
- Key levels: Support ~192.1767 | Resistance ~220.5833.
- News sentiment bias: Bullish (normalized sentiment 1.00; overall news score 0.92).
- Confirmation / invalidation condition: A break above 220.5833 with volume supports continuation; a close below 192.1767 elevates deterioration risk.
What KGNAI Measures
KGNAI evaluates assets using large cross-sectional datasets built from millions of structured data points. Inputs incorporate fundamental metrics, technical structures, and systematically processed news sentiment. Statistical models, machine learning, and AI frameworks are used to assess relative positioning, signal alignment, and probabilistic behavior across broad universes.
How to Read This Report
- Ranks are comparative across the tracked universe, not absolute price targets.
- Confluence reflects alignment among independent signal groups.
- Support/resistance levels are probabilistic decision zones, not guarantees.
- Sentiment provides contextual bias within the broader analytical framework.
KGNAI Signal + Technical Snapshot + News Sentiment Digest
As of: 01-May-2026
Ticker: TM
1) KGNAI AI Analysis
Region: USA
Total universe size: 2058 ranked instruments
- Daily rank: #1018 out of 2058 — Neutral
- Weekly rank: #771 out of 2058 — Neutral
- Monthly rank: #353 out of 2058 — Bullish
- 3-Monthly rank: #1287 out of 2058 — Neutral
- 6-Monthly rank: #387 out of 2058 — Bullish
- Yearly rank: #690 out of 2058 — Neutral
Across the 2058-instrument universe, TM’s rank distribution is best described as selectively constructive at longer horizons but not confirmed in the near-term tape. The Monthly rank (#353) places TM in the upper portion of the universe (relative strength versus many peers), while the Daily rank (#1018) sits near the middle, consistent with a market that is not currently rewarding the setup on short time frames.
The internal inconsistency matters: the 6-Monthly rank (#387) leans bullish, yet the 3-Monthly rank (#1287) is weaker, suggesting the path from medium-term strength to recent behavior has been uneven. This pattern is frequently associated with regime transition risk—where the longer-term comparative profile can remain intact even as shorter-term risk appetite tightens.
In that context, the stated term view—Short-term: Neutral; Mid-term: Neutral; Long-term: Neutral—reads as a disciplined aggregation rather than a directional call. Practically, it frames TM as a relative positioning candidate rather than a pure momentum vehicle: the cross-sectional system is not flagging broad-based strength across all horizons, but neither is it assigning an outright bearish rank label at the core time frames (Daily/Weekly/Yearly are Neutral).
KGNAI ranks each instrument across large universes using multiple proprietary AI tests and statistical models (millions of data points). Lower ranks generally indicate stronger probability of favorable performance behavior, while higher ranks indicate weaker probability and more bearish positioning.
Term view: Short-term: Neutral. Mid-term: Neutral. Long-term: Neutral.
Want the full universe and complete rank tables? Unlock full access on KGNAI: https://www.kgnai.com/pricing
2) Price & trend overview
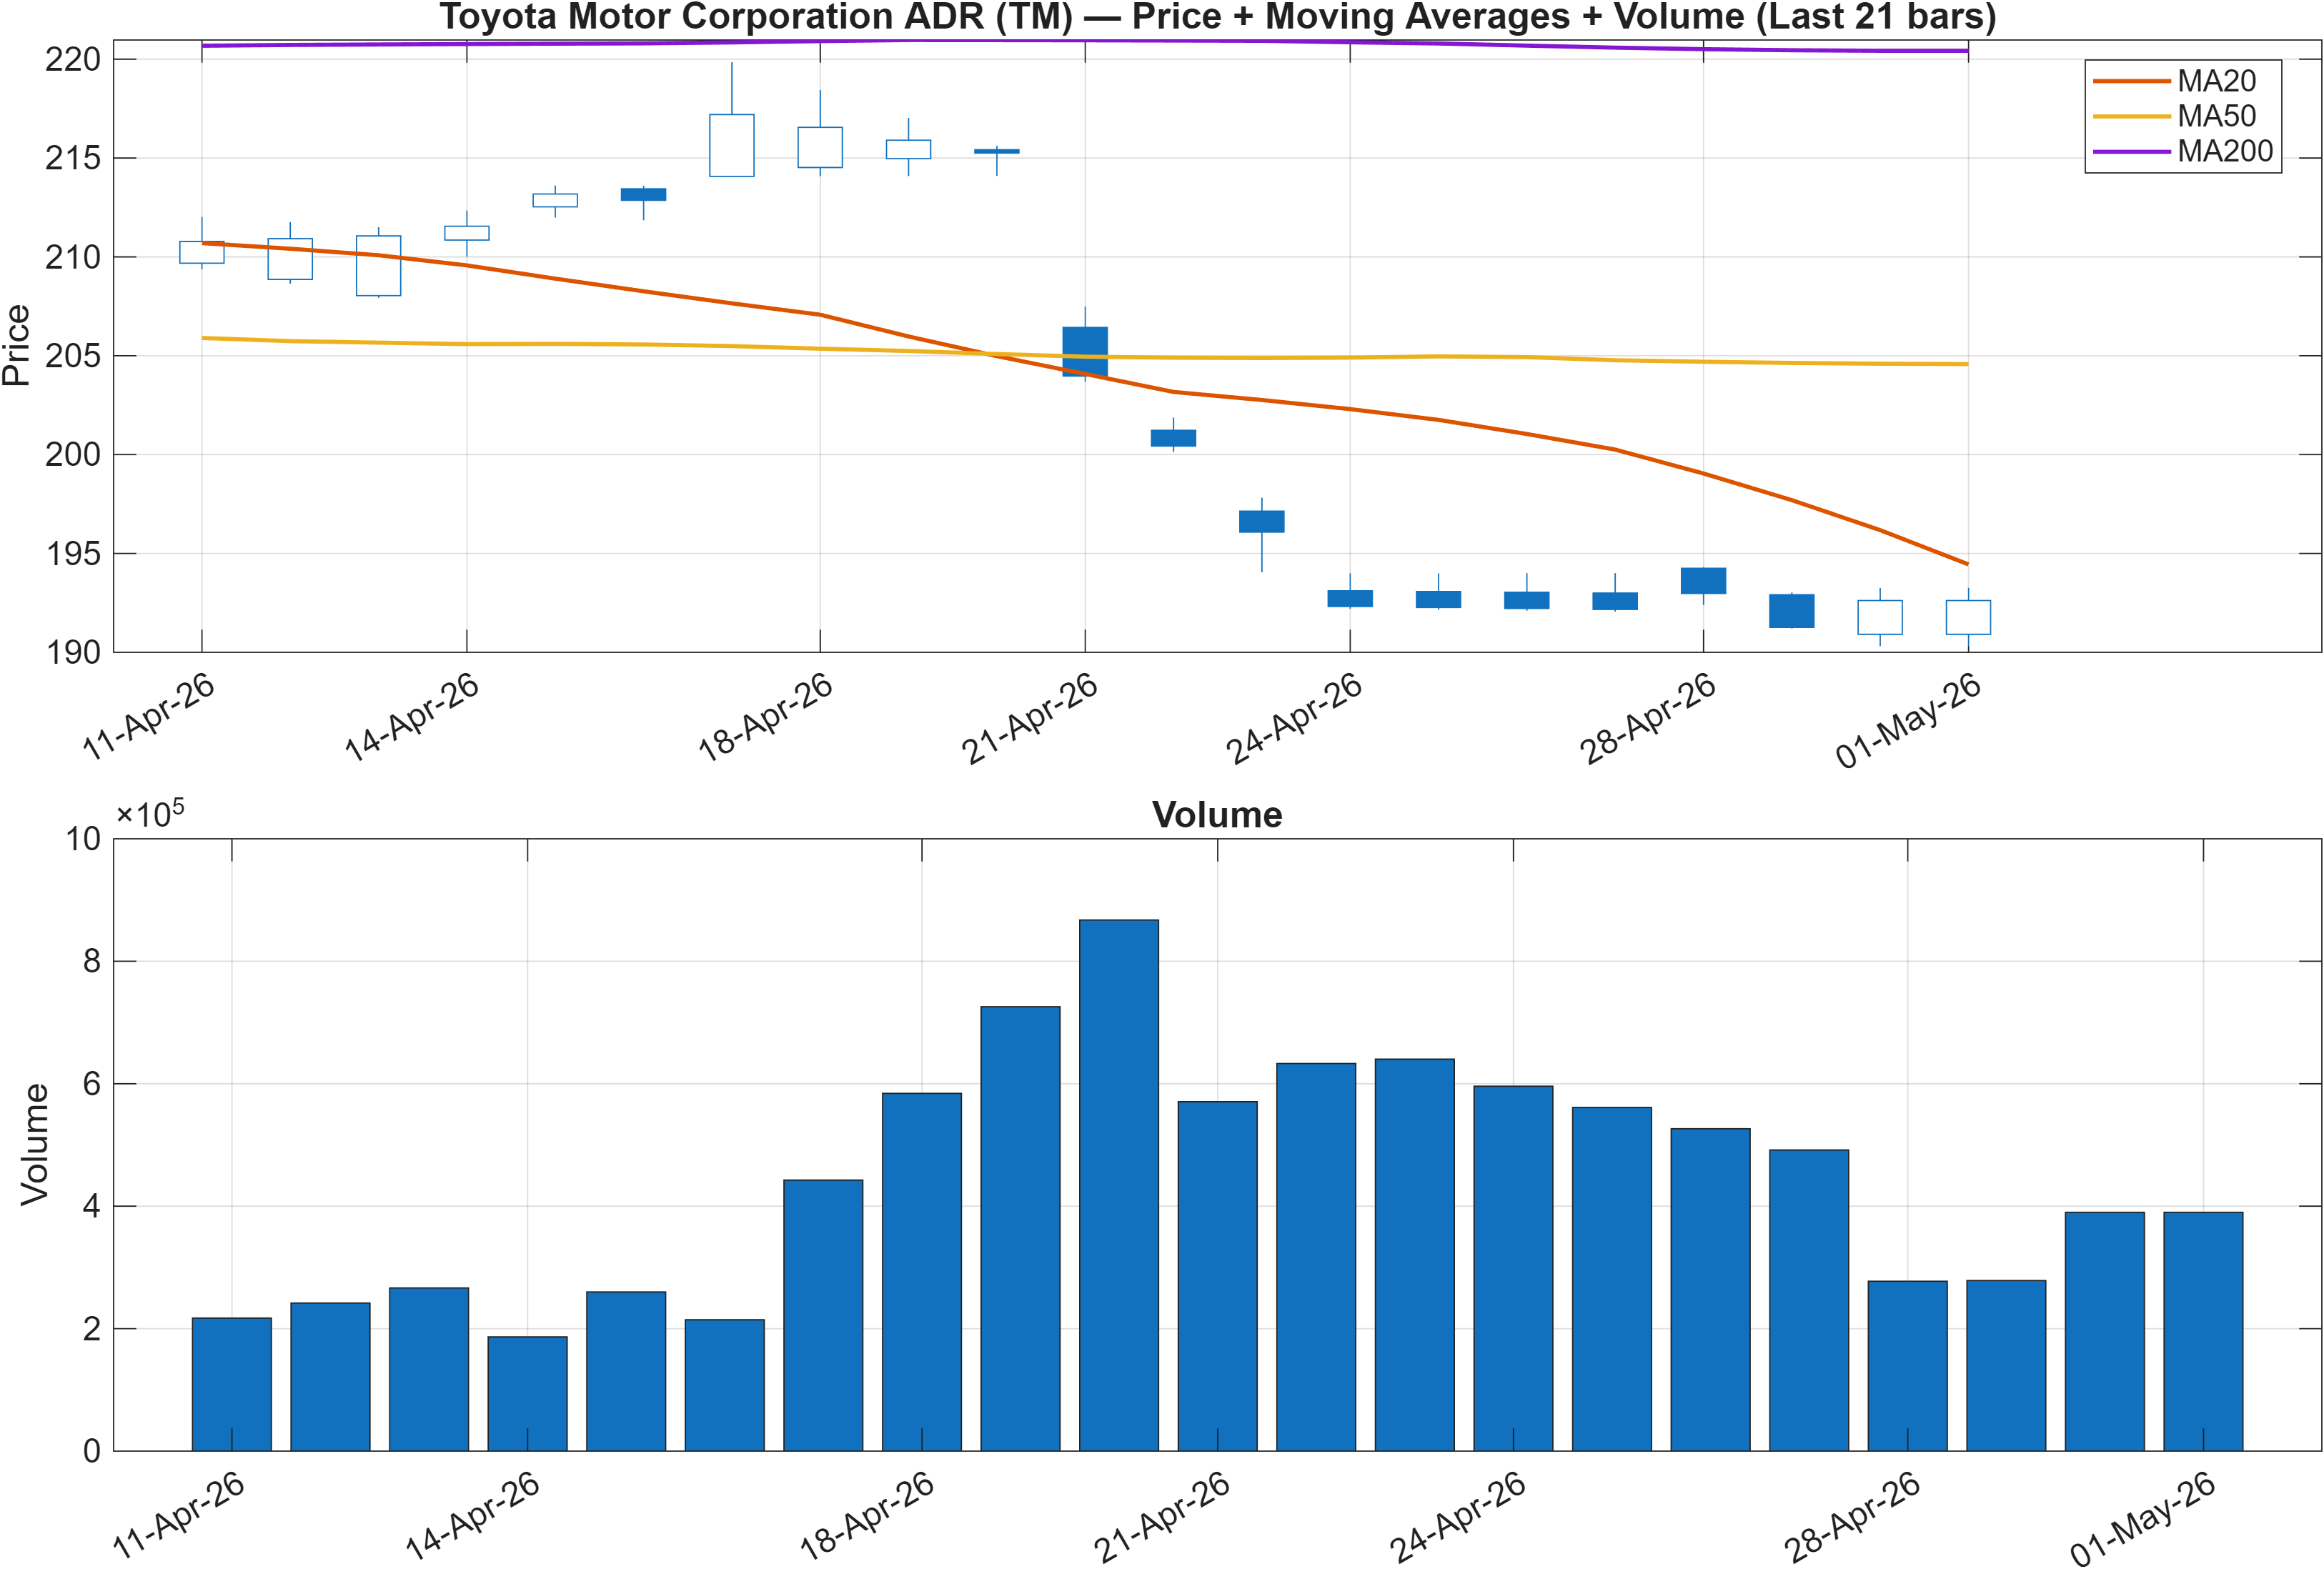
The moving-average stack is explicitly negative on two independent checks: Close vs MA50 = Bearish and MA50 vs MA200 = Bearish. Together, these conditions describe a trend channel where price is trading below the intermediate mean while the intermediate mean itself is below the long-run mean—an environment that typically penalizes premature bottom-fishing unless corroborated by improving breadth/volume behavior.
This is where TM’s rank profile becomes useful as a constraint. The Monthly rank (#353) indicates the broader universe model is not treating TM as structurally weak, yet the price/MA configuration suggests execution risk remains elevated in the near term. When ranks are neutral-to-constructive but trend structure is bearish, the usual interpretation is “wait for price to prove it” rather than infer a turn solely from valuation narratives or prior range memory.
From a market-structure angle, the MA200 relationship is often a dividing line between institutional “risk-on” versus “risk-managed” positioning. With the MA50 below the MA200, the market is signaling that rallies may be met with supply until the slope/stack begins to repair. That does not preclude tactical upside; it simply shifts the burden of proof to follow-through rather than single-day rebounds.
The cleanest way to frame this section alongside later signals is: trend conditions are Bearish, while ranks are predominantly Neutral. The gap between those two is where inflection setups either succeed (repair) or fail (continuation).
Interpretation: Close vs MA50 = Bearish, MA50 vs MA200 = Bearish.
3) Momentum & volatility dashboard
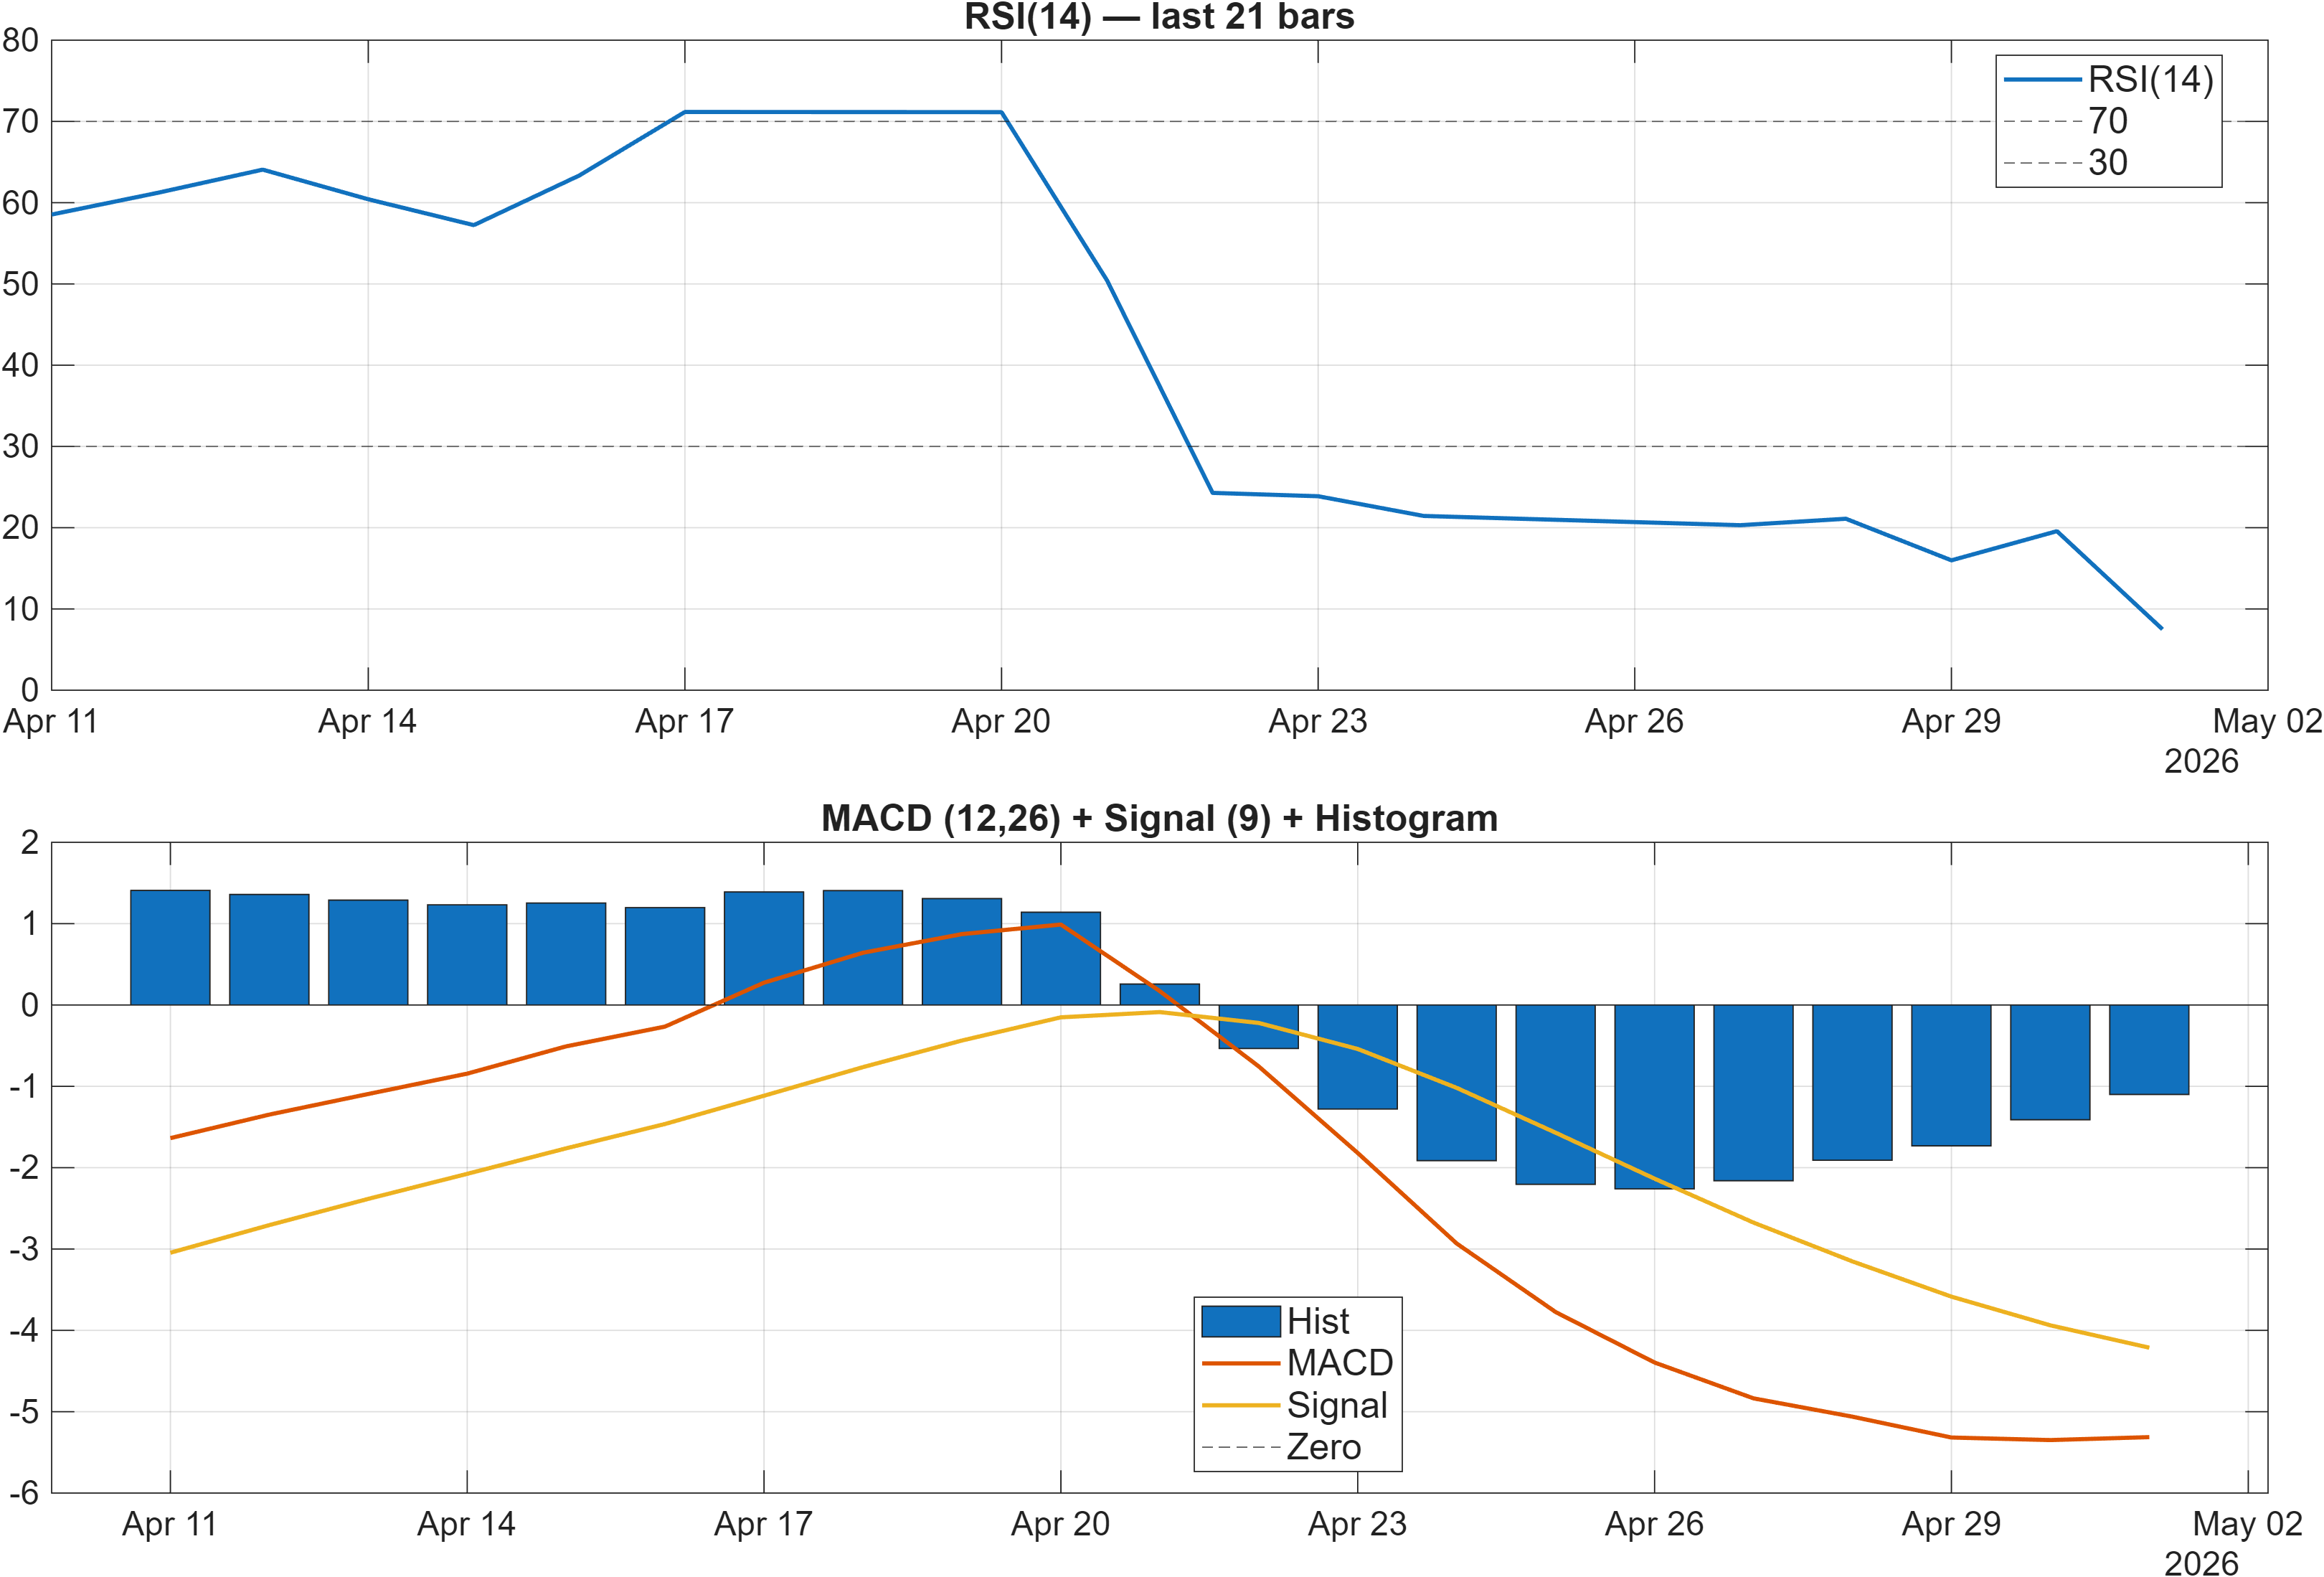
Momentum is compressed to the downside in a way that can be interpreted as trend continuation with late-stage stress, rather than healthy downside acceleration. The MACD histogram (-1.0995) remains negative, consistent with bearish impulse. At the same time, the RSI(14) reading (7.496) is deeply depressed, an extreme that often coincides with either capitulation dynamics or liquidity-driven drawdowns.
The key analytical distinction is that MACD and RSI are answering different questions: MACD is capturing the direction and persistence of the swing (still negative), while RSI is describing the degree of stretch (very low). When both are bearish, the dominant bias is still risk-off; however, the deeper RSI moves, the more the setup becomes vulnerable to sharp countertrend snaps—especially if the market shifts from selling “at any price” to selling “at better prices.”
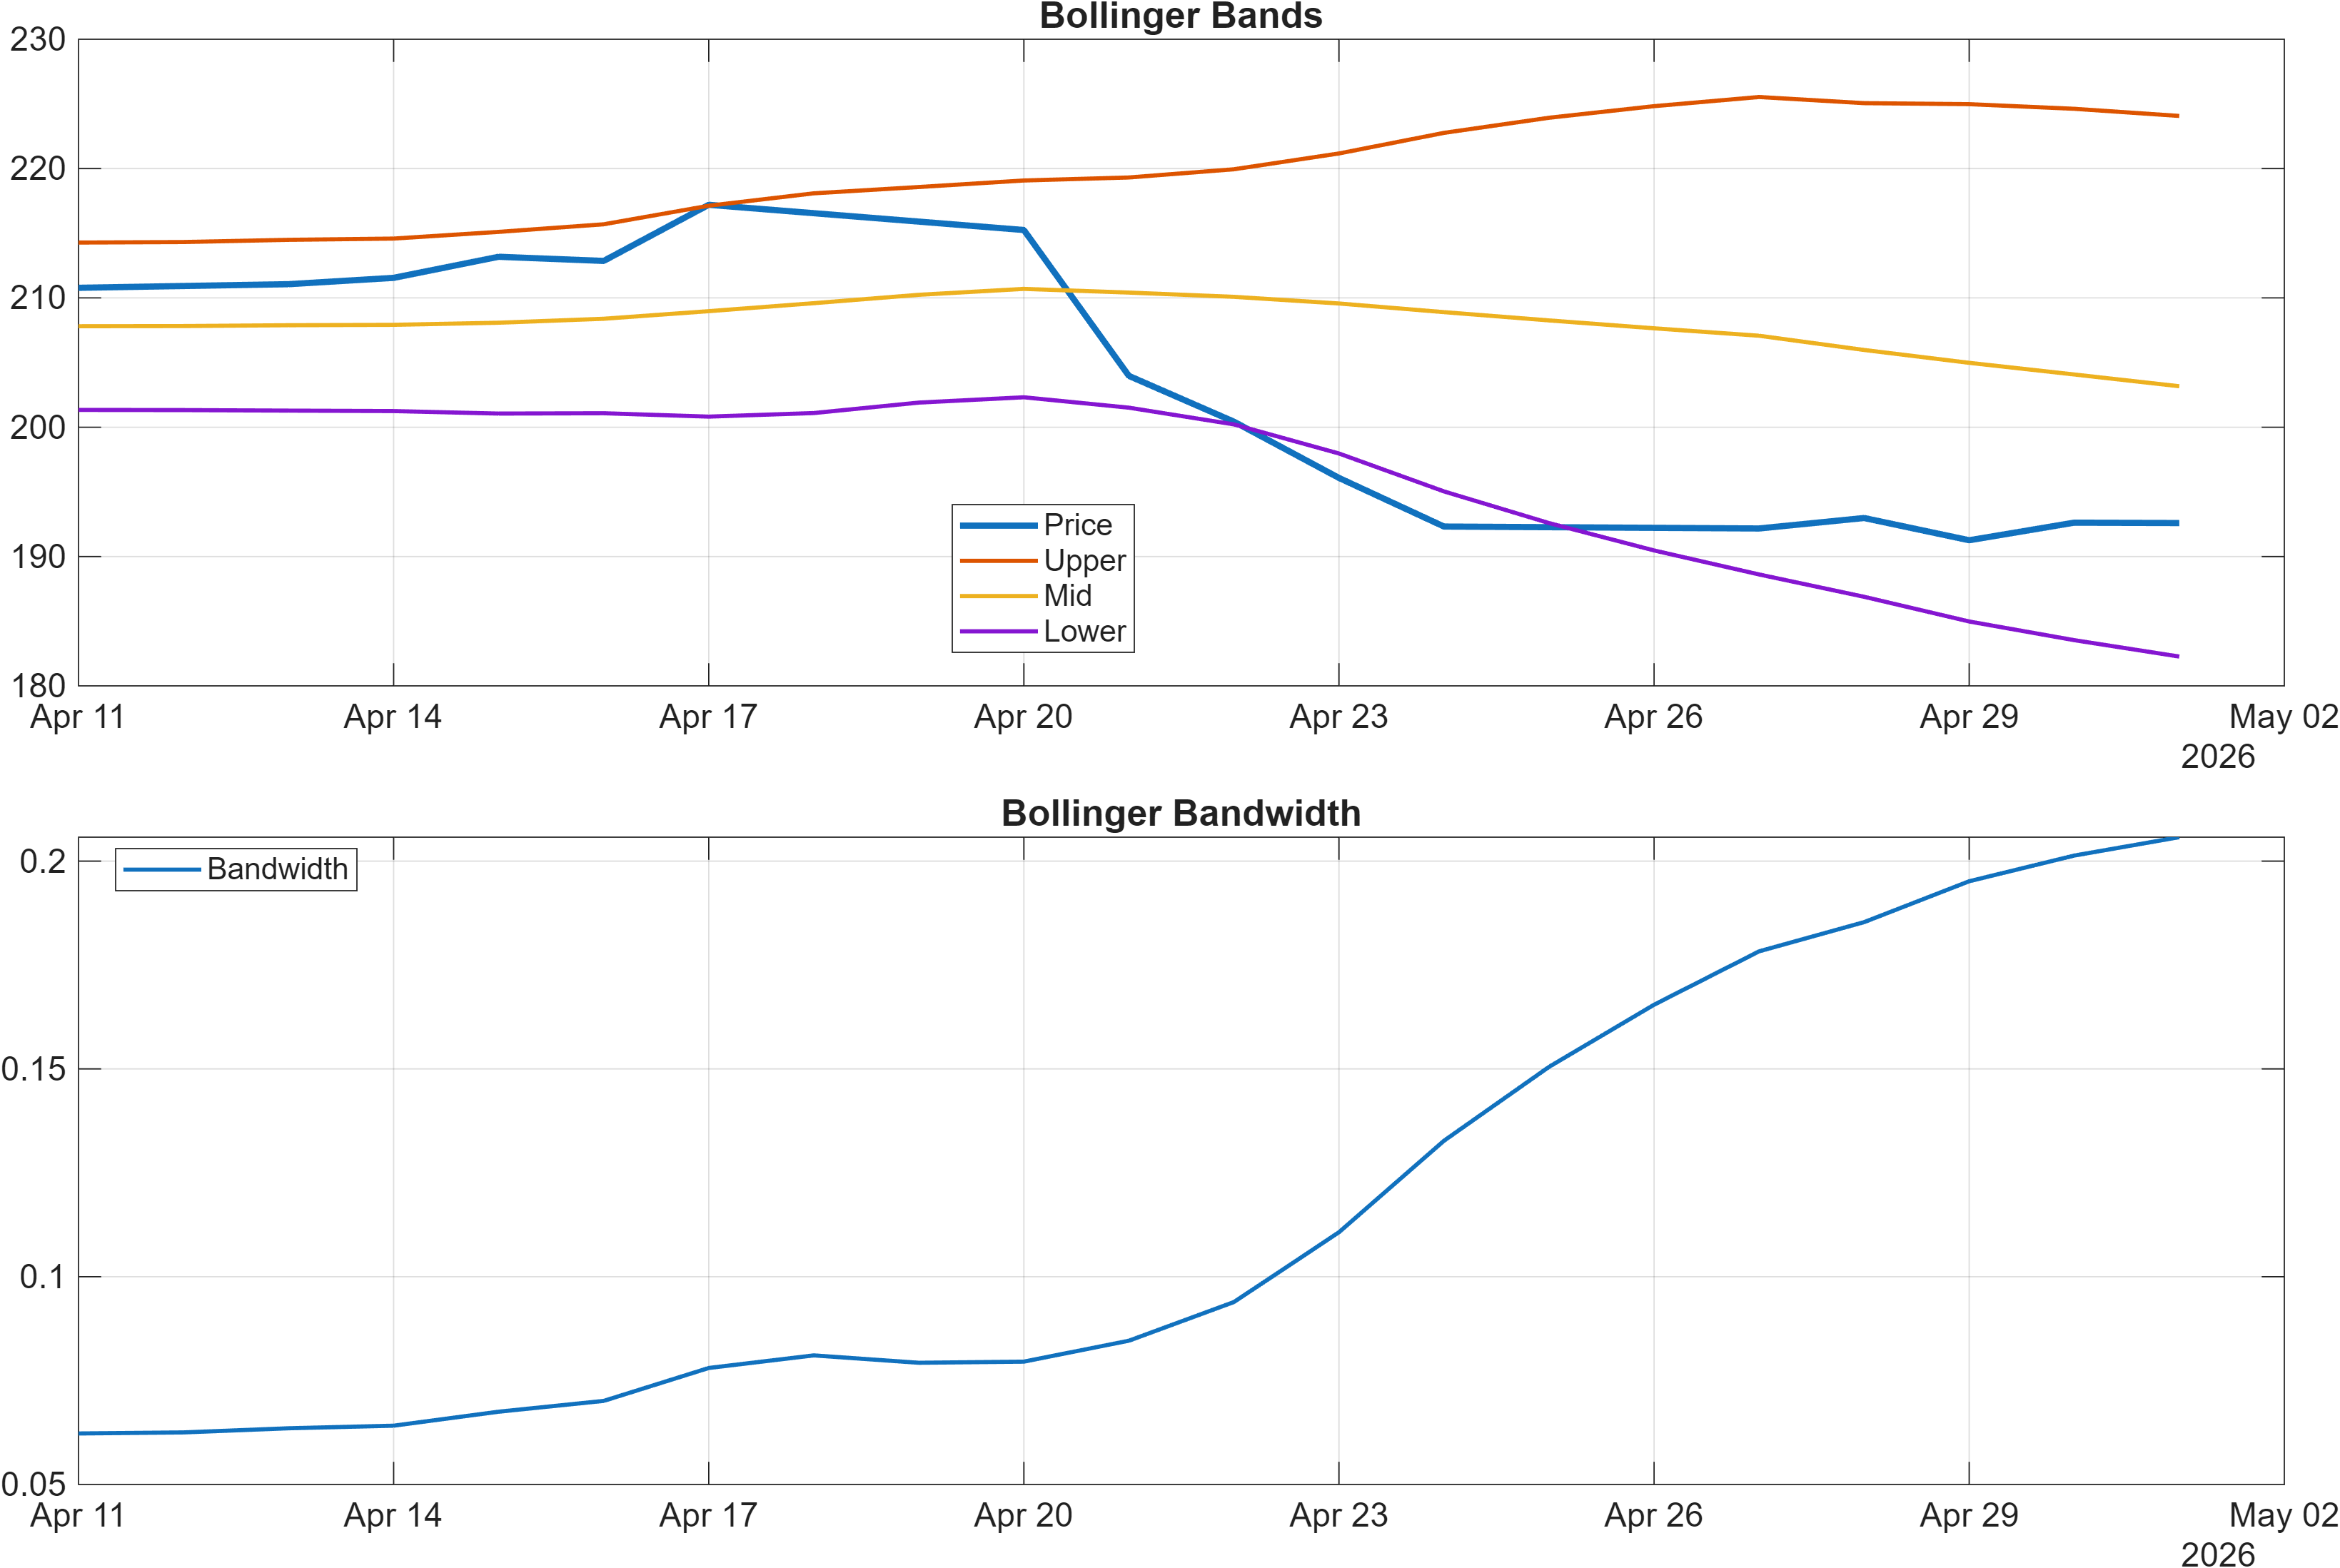
Volatility context helps interpret whether the oversold condition is occurring in an expanding-risk regime. The Bollinger Bandwidth latest is 0.2058, marked as a volatility-regime reading rather than a directional signal by itself. A moderate bandwidth alongside extreme RSI can imply that the move is more persistent drift than a single volatility shock—often harder to fade without a clear catalyst.
Overall, this dashboard frames TM as Bearish on impulse (MACD), Bearish on bias (RSI), but potentially near a mean-reversion sensitivity threshold due to the extremity of RSI(14) at 7.496.
Interpretation: RSI bias = Bearish, MACD hist = -1.0995.
Interpretation: Bandwidth (volatility regime) latest = 0.2058.
4) Support / Resistance zones
Support ~ 192.1767 | Resistance ~ 220.5833
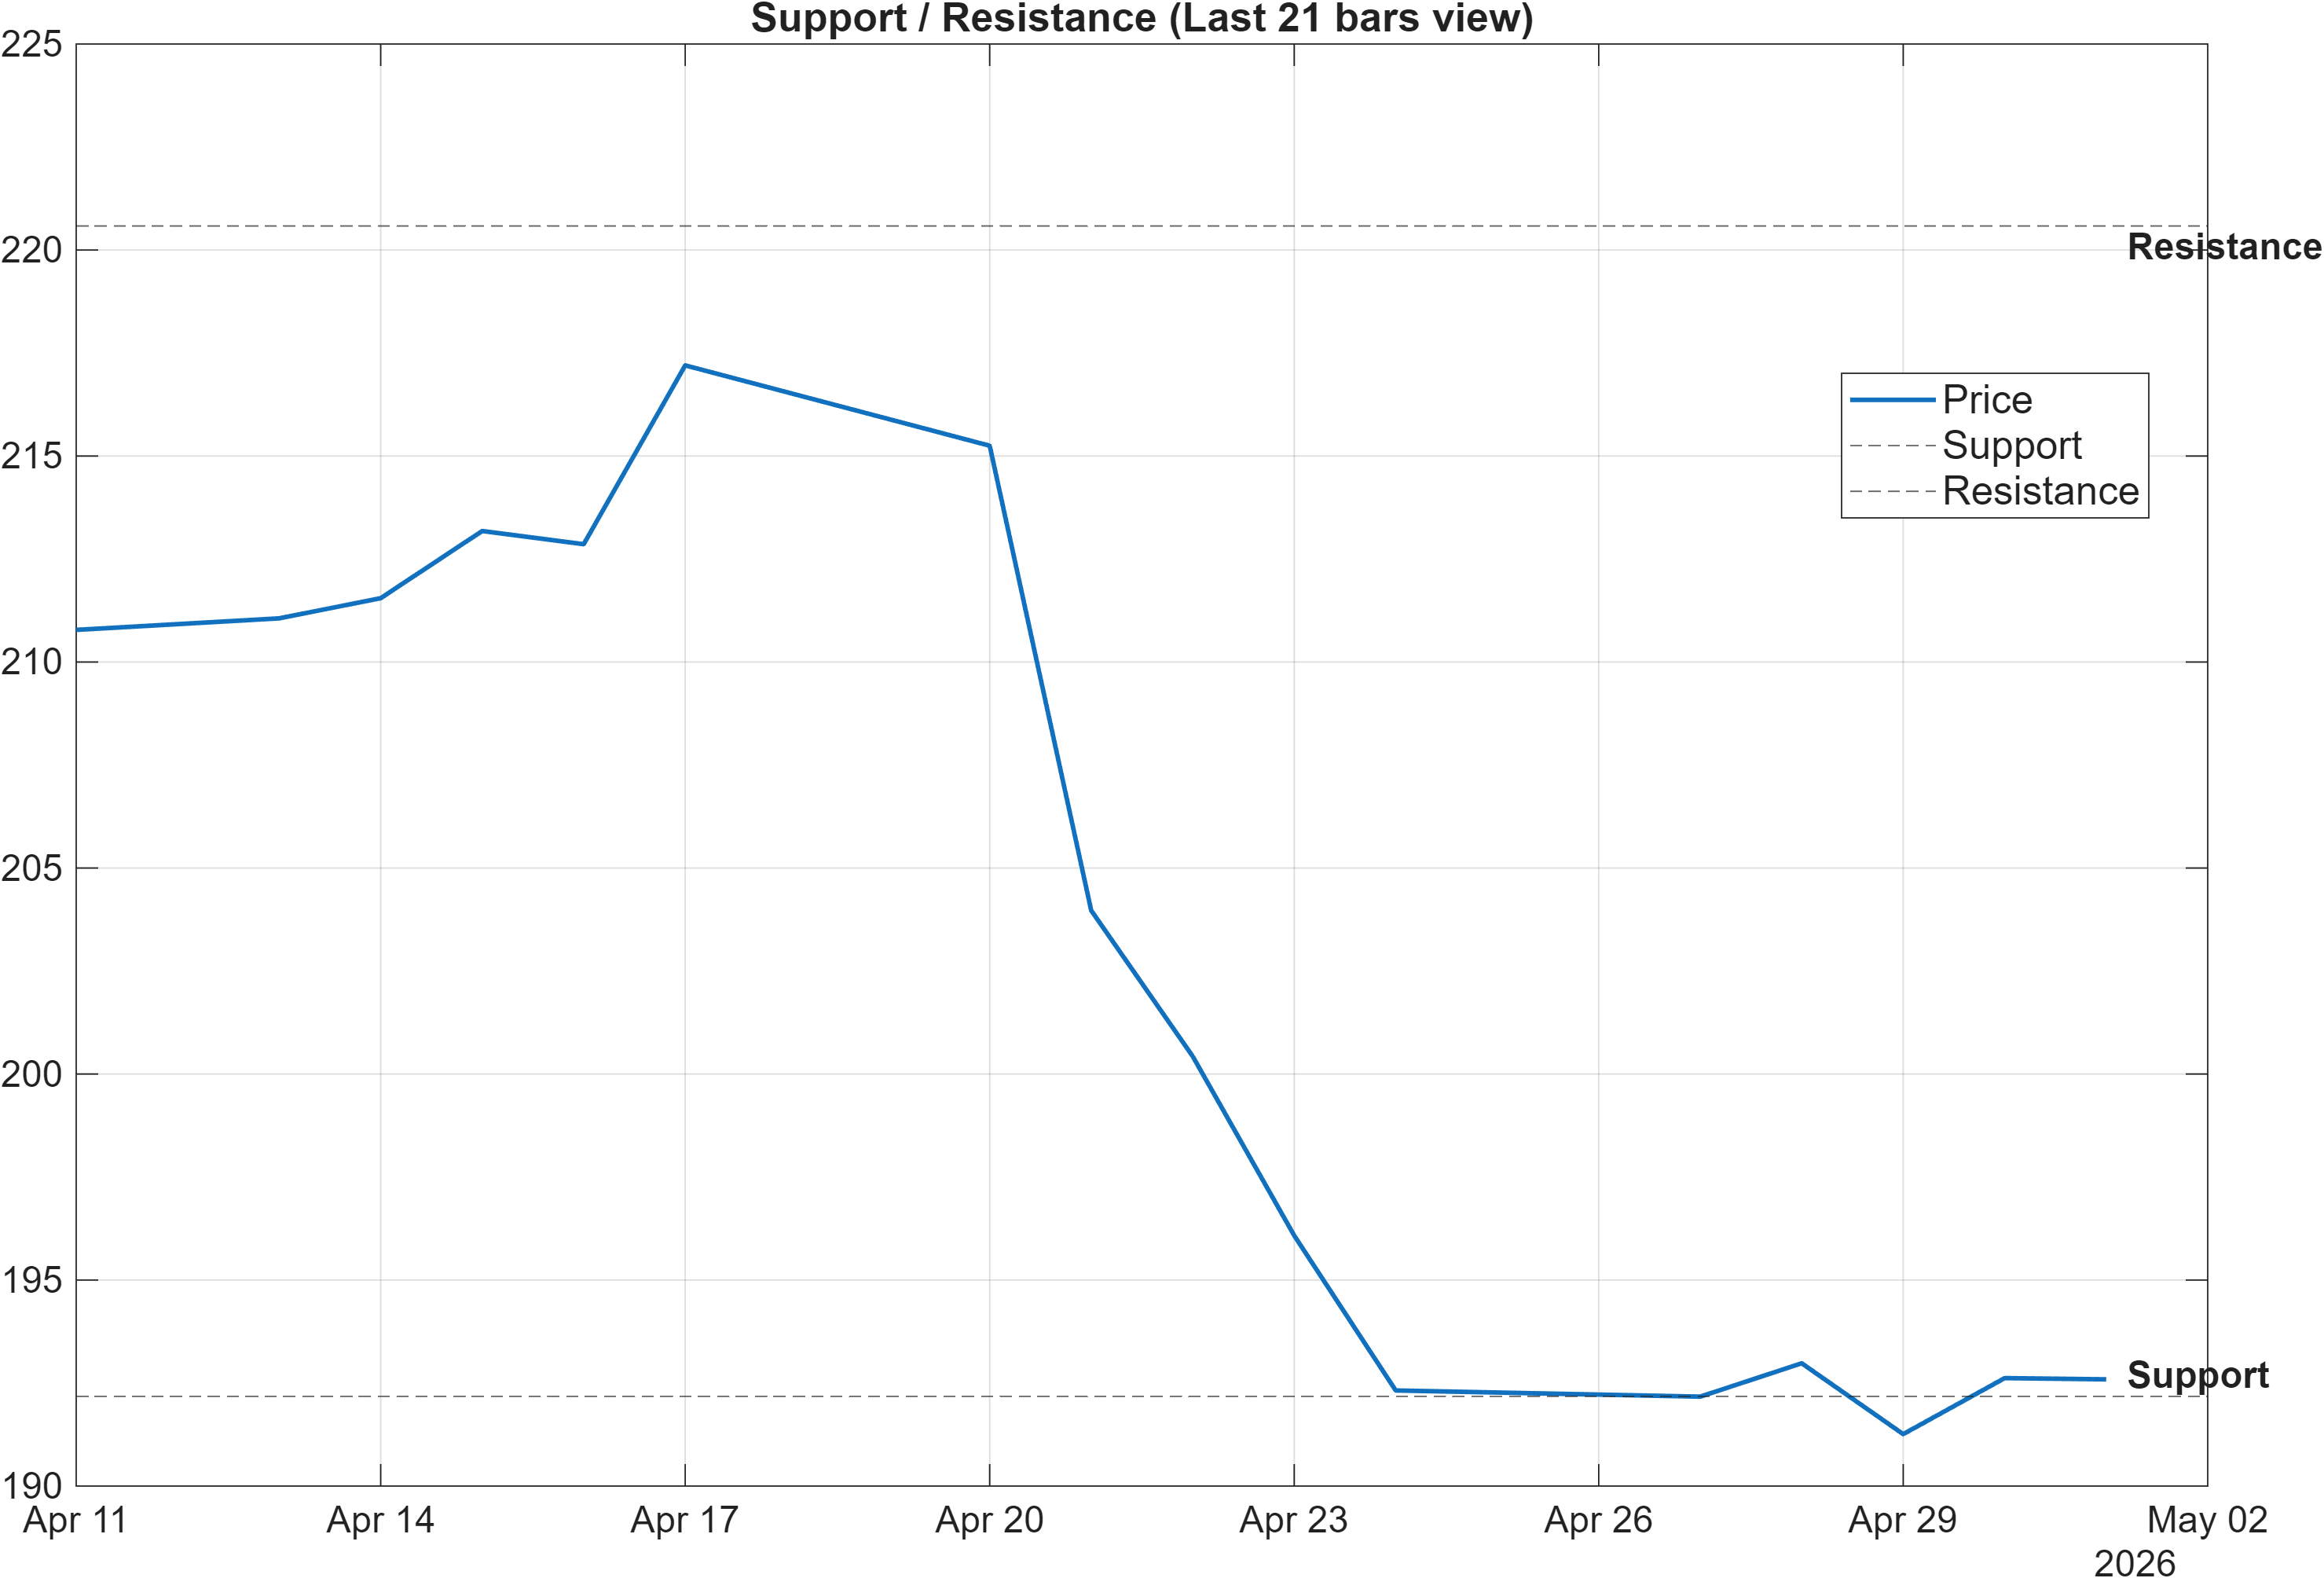
The current map is straightforward: 192.1767 defines the main downside decision zone, while 220.5833 is the primary overhead barrier. Given the bearish trend conditions (Close vs MA50 and MA50 vs MA200 both bearish) and negative momentum (MACD histogram -1.0995), the immediate question is whether support behaves as an absorption level or as a waypoint on a continuation move.
From a probabilistic trading-structure perspective, support is most credible when it coincides with improving internal signals. Here, multiple breadth/volume-adjacent signals in the technical table are still negative (e.g., OBV slope(10) -3.06e+06 and AD Line slope(10) -2.205e+06), which argues for respecting the possibility of a clean break if supply persists. That said, the setup also contains “pressure-release” ingredients: the extreme RSI(14) 7.496 can make breaks below support prone to fast reversals if selling becomes exhausted.
On the upside, 220.5833 is less about a single tick and more about reclaiming a level that can transition positioning from defensive to rebuilding. The scenario note (“break above resistance with volume → continuation”) is consistent with how moving average repair typically begins: price recovers key horizontal supply, then progressively pulls the MA50 upward. Without that, rebounds can remain tactical and fade-prone within a bearish MA stack.
Operationally, this creates a two-sided framework: below 192.1767, risk of deterioration increases; above 220.5833, continuation odds improve. Between those levels, TM is more likely to trade as a range with asymmetric headlines risk, where sentiment (Section 6) can shape short-term flows but does not override the level structure.
Scenario view: Break above resistance with volume → continuation. Close below support → signal deterioration risk.
5) Quant Technical Dashboard (18 Signals)
KGNAI AI Technical Analysis Score (Deep Reinforcement Learning): Rank #1373 out of 2057 (Rank 1 represents the strongest technical positioning and a higher probability of favorable price behavior. As ranks increase toward the maximum, the probability of favorable outcomes weakens and bearish positioning becomes more dominant.) | Label: Neutral | Score: -0.335
18-Signal Technical Confluence Score: -0.500 (Bearish)
Overall Technical Score (18-signal confluence + DRL rank blend): -0.450 (Bearish)
Note: The blended score reflects signal strength weighted against broader AI technical ranking, which may temporarily diverge.
Blended technical score breakdown: -0.450 (Bearish | Bull 3 / Bear 12 / Neutral 3)
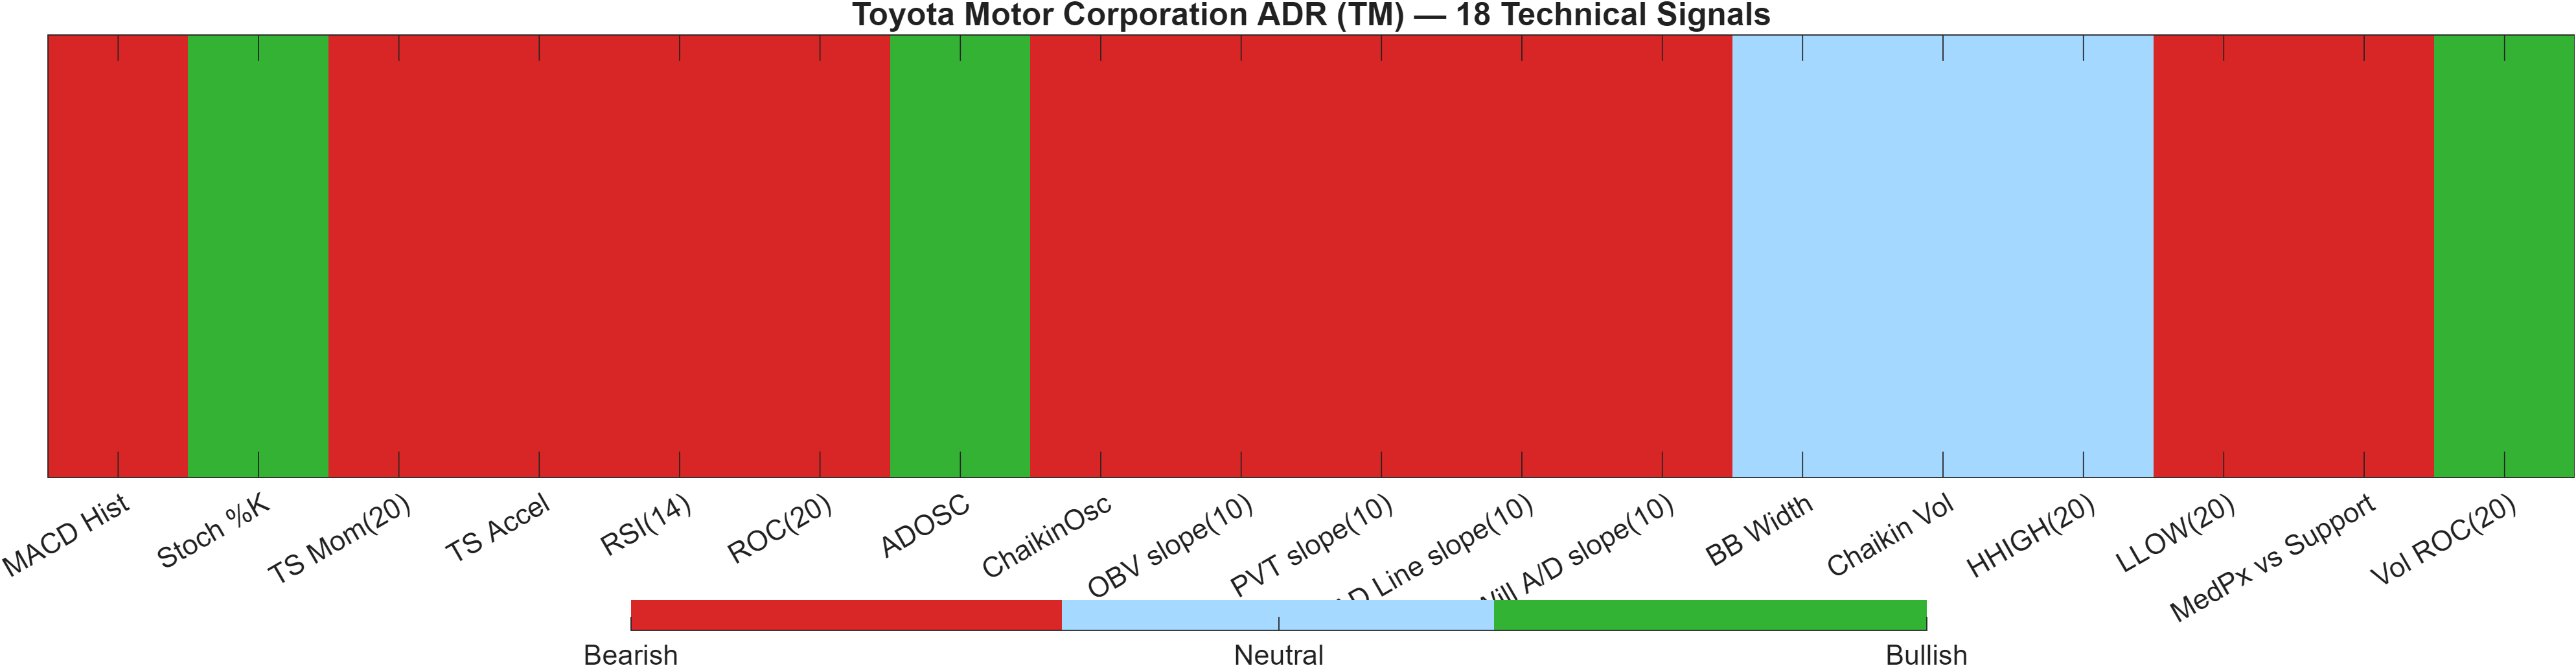
This section is where alignment vs divergence is most visible. The rule-based confluence is decisively bearish (-0.500), and the blended overall technical score remains bearish (-0.450), with the breakdown showing Bear 12 / Bull 3 / Neutral 3. In isolation, that breadth of bearish readings signals that weakness is not confined to a single indicator family.
Yet the separate DRL technical rank is labeled Neutral despite being relatively high at #1373 out of 2057 with a score of -0.335. That combination can occur when the learned model identifies patterns where downside conditions sometimes stabilize, even while classic indicator stacks remain bearish. It does not negate the confluence—rather it flags that the market may be approaching a zone where outcomes become more path-dependent.
Signal table (Bull/Bear/Neutral)
| Indicator | Value | Signal |
|---|---|---|
| MACD Hist | -1.1 | Bearish |
| Stoch %K | 19.98 | Bullish |
| TS Mom(20) | -18.3 | Bearish |
| TS Accel | -19.44 | Bearish |
| RSI(14) | 7.496 | Bearish |
| ROC(20) | -8.69 | Bearish |
| ADOSC | 78.98 | Bullish |
| ChaikinOsc | -5.137e+05 | Bearish |
| OBV slope(10) | -3.06e+06 | Bearish |
| PVT slope(10) | -3.526e+04 | Bearish |
| AD Line slope(10) | -2.205e+06 | Bearish |
| Will A/D slope(10) | -15.64 | Bearish |
| BB Width | 0.2058 | Neutral |
| Chaikin Vol | -14 | Neutral |
| HHIGH(20) | 219.8 | Neutral |
| LLOW(20) | 190.3 | Bearish |
| MedPx vs Support | -0.3917 | Bearish |
| Vol ROC(20) | 61.26 | Bullish |
Interpretively, the table highlights a market where momentum and participation are still mostly negative (e.g., TS Mom(20) -18.3 and ROC(20) -8.69) even as some “late-cycle” oscillators can flash tactical positives (e.g., Stoch %K 19.98 bullish). The risk is mistaking oversold readings for trend reversal; the opportunity is identifying whether those bullish pockets expand beyond a few indicators into a broader repair in the next price swing.
Interpretation: Indicator-level signals form the base confluence, which is then adjusted using a separate AI-driven technical ranking model. The final technical score summarizes this combined view.
6) News sentiment + extractive gist
Sentiment score (avg): 0.118 | Positive: 40% | Neutral: 60% | Negative: 0%
KGNAI AI News Sentiment Score (normalized -1 to +1): 1.00 (as of 2026-05-01) | Label: Bullish | Overall news score: 0.92
Positive Developments
Recent coverage across major financial outlets indicates a constructive narrative bias around Toyota Motor Corporation ADR (TM), with commentary that leans toward comparative positioning and perceived value framing. That aligns with the dataset’s normalized sentiment score of 1.00 and a strong overall news score of 0.92, while the distribution shows 40% Positive and 60% Neutral with 0% Negative. Importantly, the tone here is supportive rather than catalytic: it can help stabilize investor perception during a weak tape, but it does not mechanically reverse bearish technicals. With the technical confluence still -0.500 (Bearish), positive sentiment is best read as a buffer—potentially reducing the probability of persistent downside follow-through if price begins to base above support. If sentiment remains elevated while momentum improves (e.g., MACD histogram lifting from -1.0995), the narrative and tape can start to reinforce each other.
Neutral / Mixed Developments
A large portion of the news flow appears informational and performance-recap in nature, consistent with 60% Neutral classification and a modest average sentiment of 0.118. This type of coverage typically tracks price moves rather than leading them, which is relevant given the current technical posture: Close vs MA50 = Bearish and MA50 vs MA200 = Bearish. Neutral flow can still matter for market structure because it tends to coincide with lower incremental conviction, leaving price more sensitive to technical levels. In this setting, the support/resistance framework (192.1767 / 220.5833) can dominate near-term decision-making, with news acting as context rather than a directional driver.
Negative / Risk Signals
Despite the sentiment model showing 0% Negative in the provided classification, risk signals still exist in the combined picture because price-action headlines often highlight downside technical events. The tension is straightforward: the news score is bullish (1.00 normalized), but the market’s own diagnostics remain heavy—particularly the negative MACD histogram (-1.0995) and the bearish moving-average stack. When sentiment is positive but price is weak, the common failure mode is a narrative that persists while the tape continues to grind lower, especially if the instrument cannot hold 192.1767. Until TM can demonstrate resilience around support and begin reclaiming overhead structure, bullish news sentiment should be treated as contextual, not confirmatory.
- What to monitor next: Whether price can hold 192.1767 on closing basis versus a breakdown scenario.
- What to monitor next: Any follow-through that challenges 220.5833 alongside improving participation signals (e.g., stabilization in OBV slope).
- What to monitor next: Whether momentum repairs from extreme conditions (RSI(14) 7.496) while MACD histogram remains negative.
Sources referenced: Reuters, Bloomberg, Yahoo Finance, MarketWatch, Investing.com
7) Sources
Not available in the provided data.
You may also like: How KGNAI AI ranks instruments across global markets
Disclaimer: KGNAI provides AI-generated analytics and educational market commentary only. This is not financial advice. Markets involve risk. Always do your own research.