
Brookfield Infrastructure Corp (BIPC) — 26-Apr-2026 Technical & Rank View: Neutral With Mixed Horizon Alignment
Brookfield Infrastructure Corp (BIPC) shows a mixed horizon profile as of 26-Apr-2026, where cross-horizon ranks lean constructive in the medium term while price/MA structure remains pressured. Within KGNAI’s 2058-instrument universe, BIPC’s 3-month rank (#21) is exceptionally strong, while the weekly rank (#818) and 6-month rank (#1498) sit in comparatively weaker territory—an alignment gap that often coincides with regime transition rather than a clean trend. Technically, the blended read is Neutral (overall technical score 0.122) despite a bullish DRL technical rank signal (#342 with score 0.667), reflecting internal disagreement between model layers. Momentum gauges also skew cautious: RSI(14) at 35.92 and a negative MACD histogram (-0.05636) indicate softer short-term impulse, while Bollinger bandwidth (0.0716) points to a relatively contained volatility regime. Key decision zones remain support ~37.8900 and resistance ~49.1725, framing confirmation and invalidation conditions.
- Rank stance: Short-term Neutral; Mid-term Bullish (notably the 3-month rank #21); Long-term Neutral with the 6-month rank #1498 lagging.
- Technical confluence: Neutral (18-signal score -0.111; overall technical score 0.122).
- Key levels: Support ~37.8900 and Resistance ~49.1725 define the decision band.
- News sentiment bias: Slightly positive-tilted but mostly neutral coverage (avg sentiment 0.068; 71% neutral; normalized sentiment score 1.00 as of 2026-04-17).
- Confirmation / invalidation: A volume-backed break above 49.1725 improves continuation odds; a close below 37.8900 increases deterioration risk.
What KGNAI Measures
KGNAI evaluates assets using large cross-sectional datasets built from millions of structured data points. Inputs incorporate fundamental metrics, technical structures, and systematically processed news sentiment. Statistical models, machine learning, and AI frameworks are used to assess relative positioning, signal alignment, and probabilistic behavior across broad universes.
How to Read This Report
- Ranks are comparative across the tracked universe, not absolute price targets.
- Confluence reflects alignment among independent signal groups.
- Support/resistance levels are probabilistic decision zones, not guarantees.
- Sentiment provides contextual bias within the broader analytical framework.
1) KGNAI AI Analysis
Region: USA
Total universe size: 2058 ranked instruments
- Daily rank: #213 out of 2058 — Bullish
- Weekly rank: #818 out of 2058 — Neutral
- Monthly rank: #114 out of 2058 — Bullish
- 3-Monthly rank: #21 out of 2058 — Bullish
- 6-Monthly rank: #1498 out of 2058 — Neutral
- Yearly rank: Not available for this horizon — Not available
KGNAI ranks each instrument across large universes using multiple proprietary AI tests and statistical models (millions of data points). Lower ranks generally indicate stronger probability of favorable performance behavior, while higher ranks indicate weaker probability and more bearish positioning.
BIPC’s rank curve is non-linear across horizons. The 3-month rank (#21) places it in the top tier of the universe, while the daily rank (#213) and monthly rank (#114) remain supportive, consistent with a constructive intermediate profile. In contrast, the weekly rank (#818) and especially the 6-month rank (#1498) suggest the longer window has not fully validated the shorter-window improvement. This type of spread commonly indicates that the market is testing whether a new regime can persist, rather than confirming a uniformly improving trend.
The explicit term mapping reinforces that interpretation: Short-term Neutral, mid-term Bullish, long-term Neutral. Practically, the mid-term strength can coexist with near-term friction if participation and trend structure remain uneven, and it becomes more credible only when complementary evidence from price/MA structure and momentum reduces the current divergences.
Yearly rank: Not available in the provided data. That omission matters because the available horizons already show dispersion; without the yearly lens, risk assessment should lean on confirmation at key technical levels and consistency across multiple signal groups rather than any single rank point.
Term view: Short-term: Neutral. Mid-term: Bullish. Long-term: Neutral.
Want the full universe and complete rank tables? Unlock full access on KGNAI: https://www.kgnai.com/pricing
2) Price & trend overview
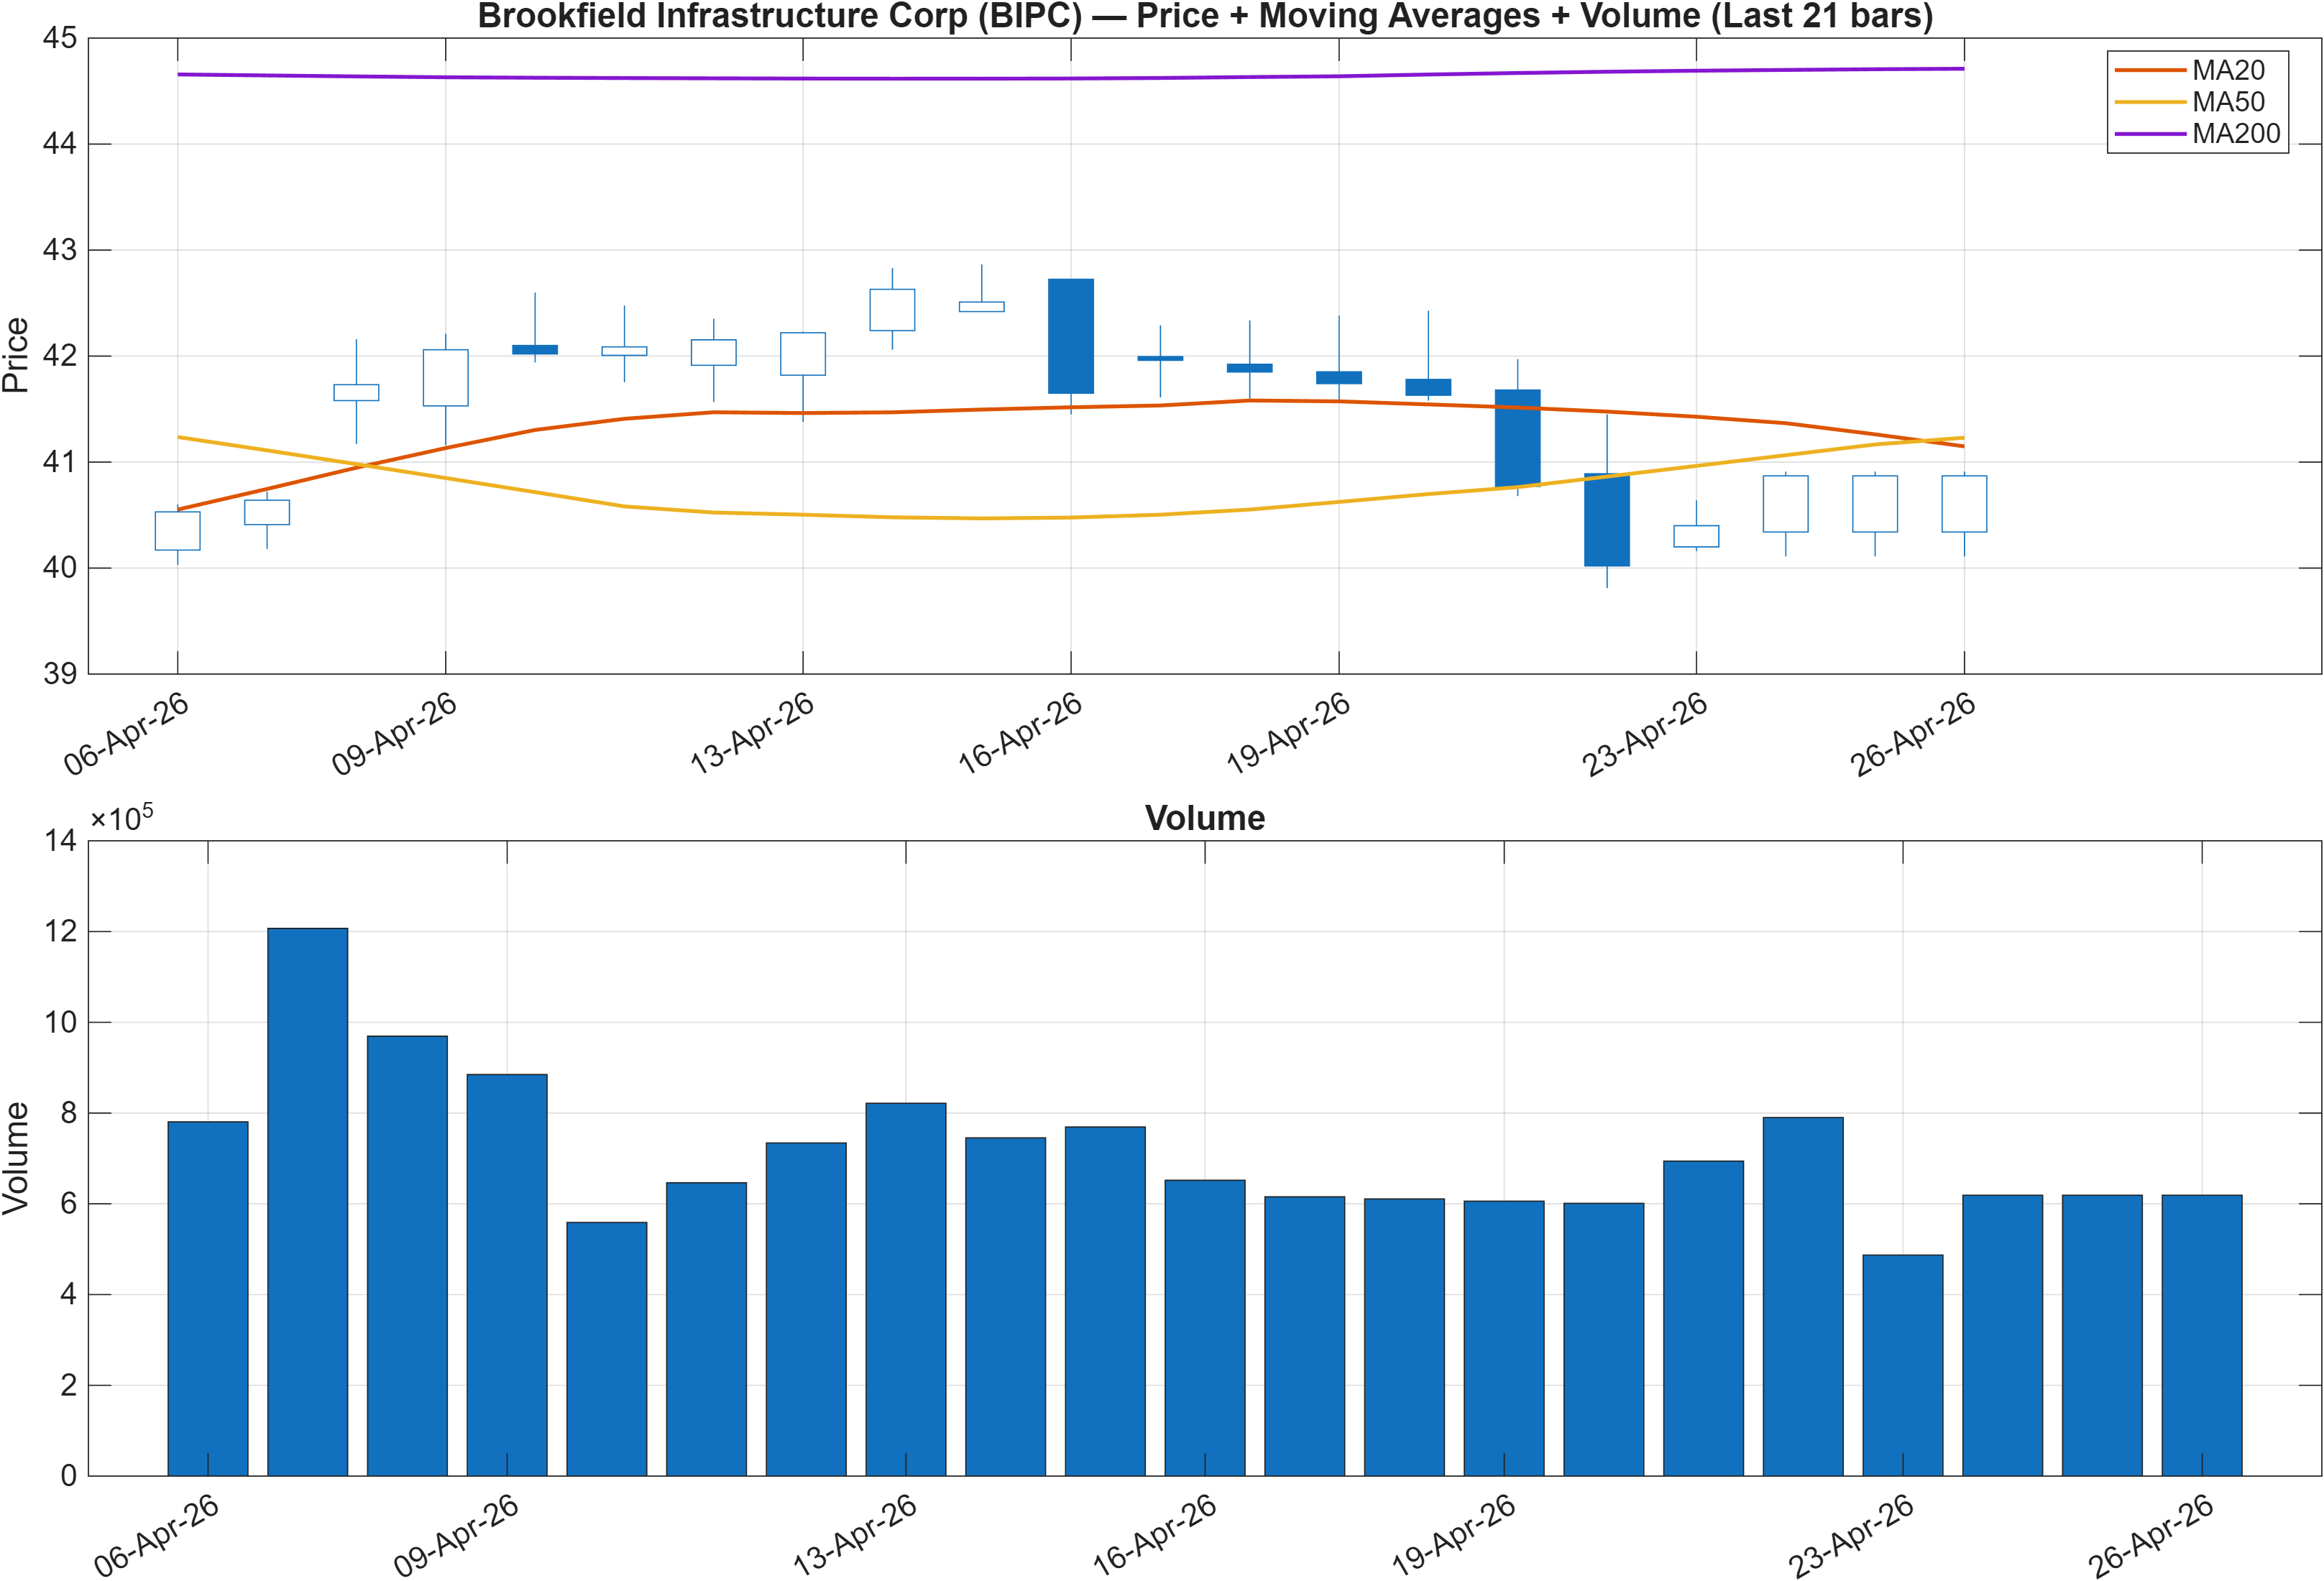
Interpretation: Close vs MA50 = Bearish, MA50 vs MA200 = Bearish.
The trend layer is currently the primary constraint on an otherwise constructive rank profile. With price below the 50-day moving average and the 50-day below the 200-day, the setup reflects a bearish moving-average stack—typically associated with persistent supply or incomplete basing. This matters because it can mute follow-through even when shorter-horizon ranks improve (as seen in the monthly rank #114 and 3-month rank #21).
The key analytical question is whether this is continuation of a longer-window downtrend or a late-stage phase where ranks lead and trend structure follows. When ranks strengthen ahead of moving averages, the usual confirmation path is a shift in price relative to the MA50 first, followed by stabilization or turn in the MA50/MA200 relationship. Until that sequence begins, the trend signal remains a drag on the aggregate view.
Volume behavior (see Figure 1) is most useful here as a verifier of acceptance or rejection around moving averages. Given the defined resistance zone at 49.1725, a move toward that level without improving trend structure would still be interpreted as mean-reversion within a broader bearish stack. Conversely, evidence of sustained price acceptance above the MA50 would reduce the probability that the strong 3-month rank is merely an episodic factor.
In short, the current regime reads as trend-fragile: ranks argue for resilience, but moving averages argue that the market has not fully transitioned. This divergence is consistent with a neutral stance rather than directional conviction.
3) Momentum & volatility dashboard
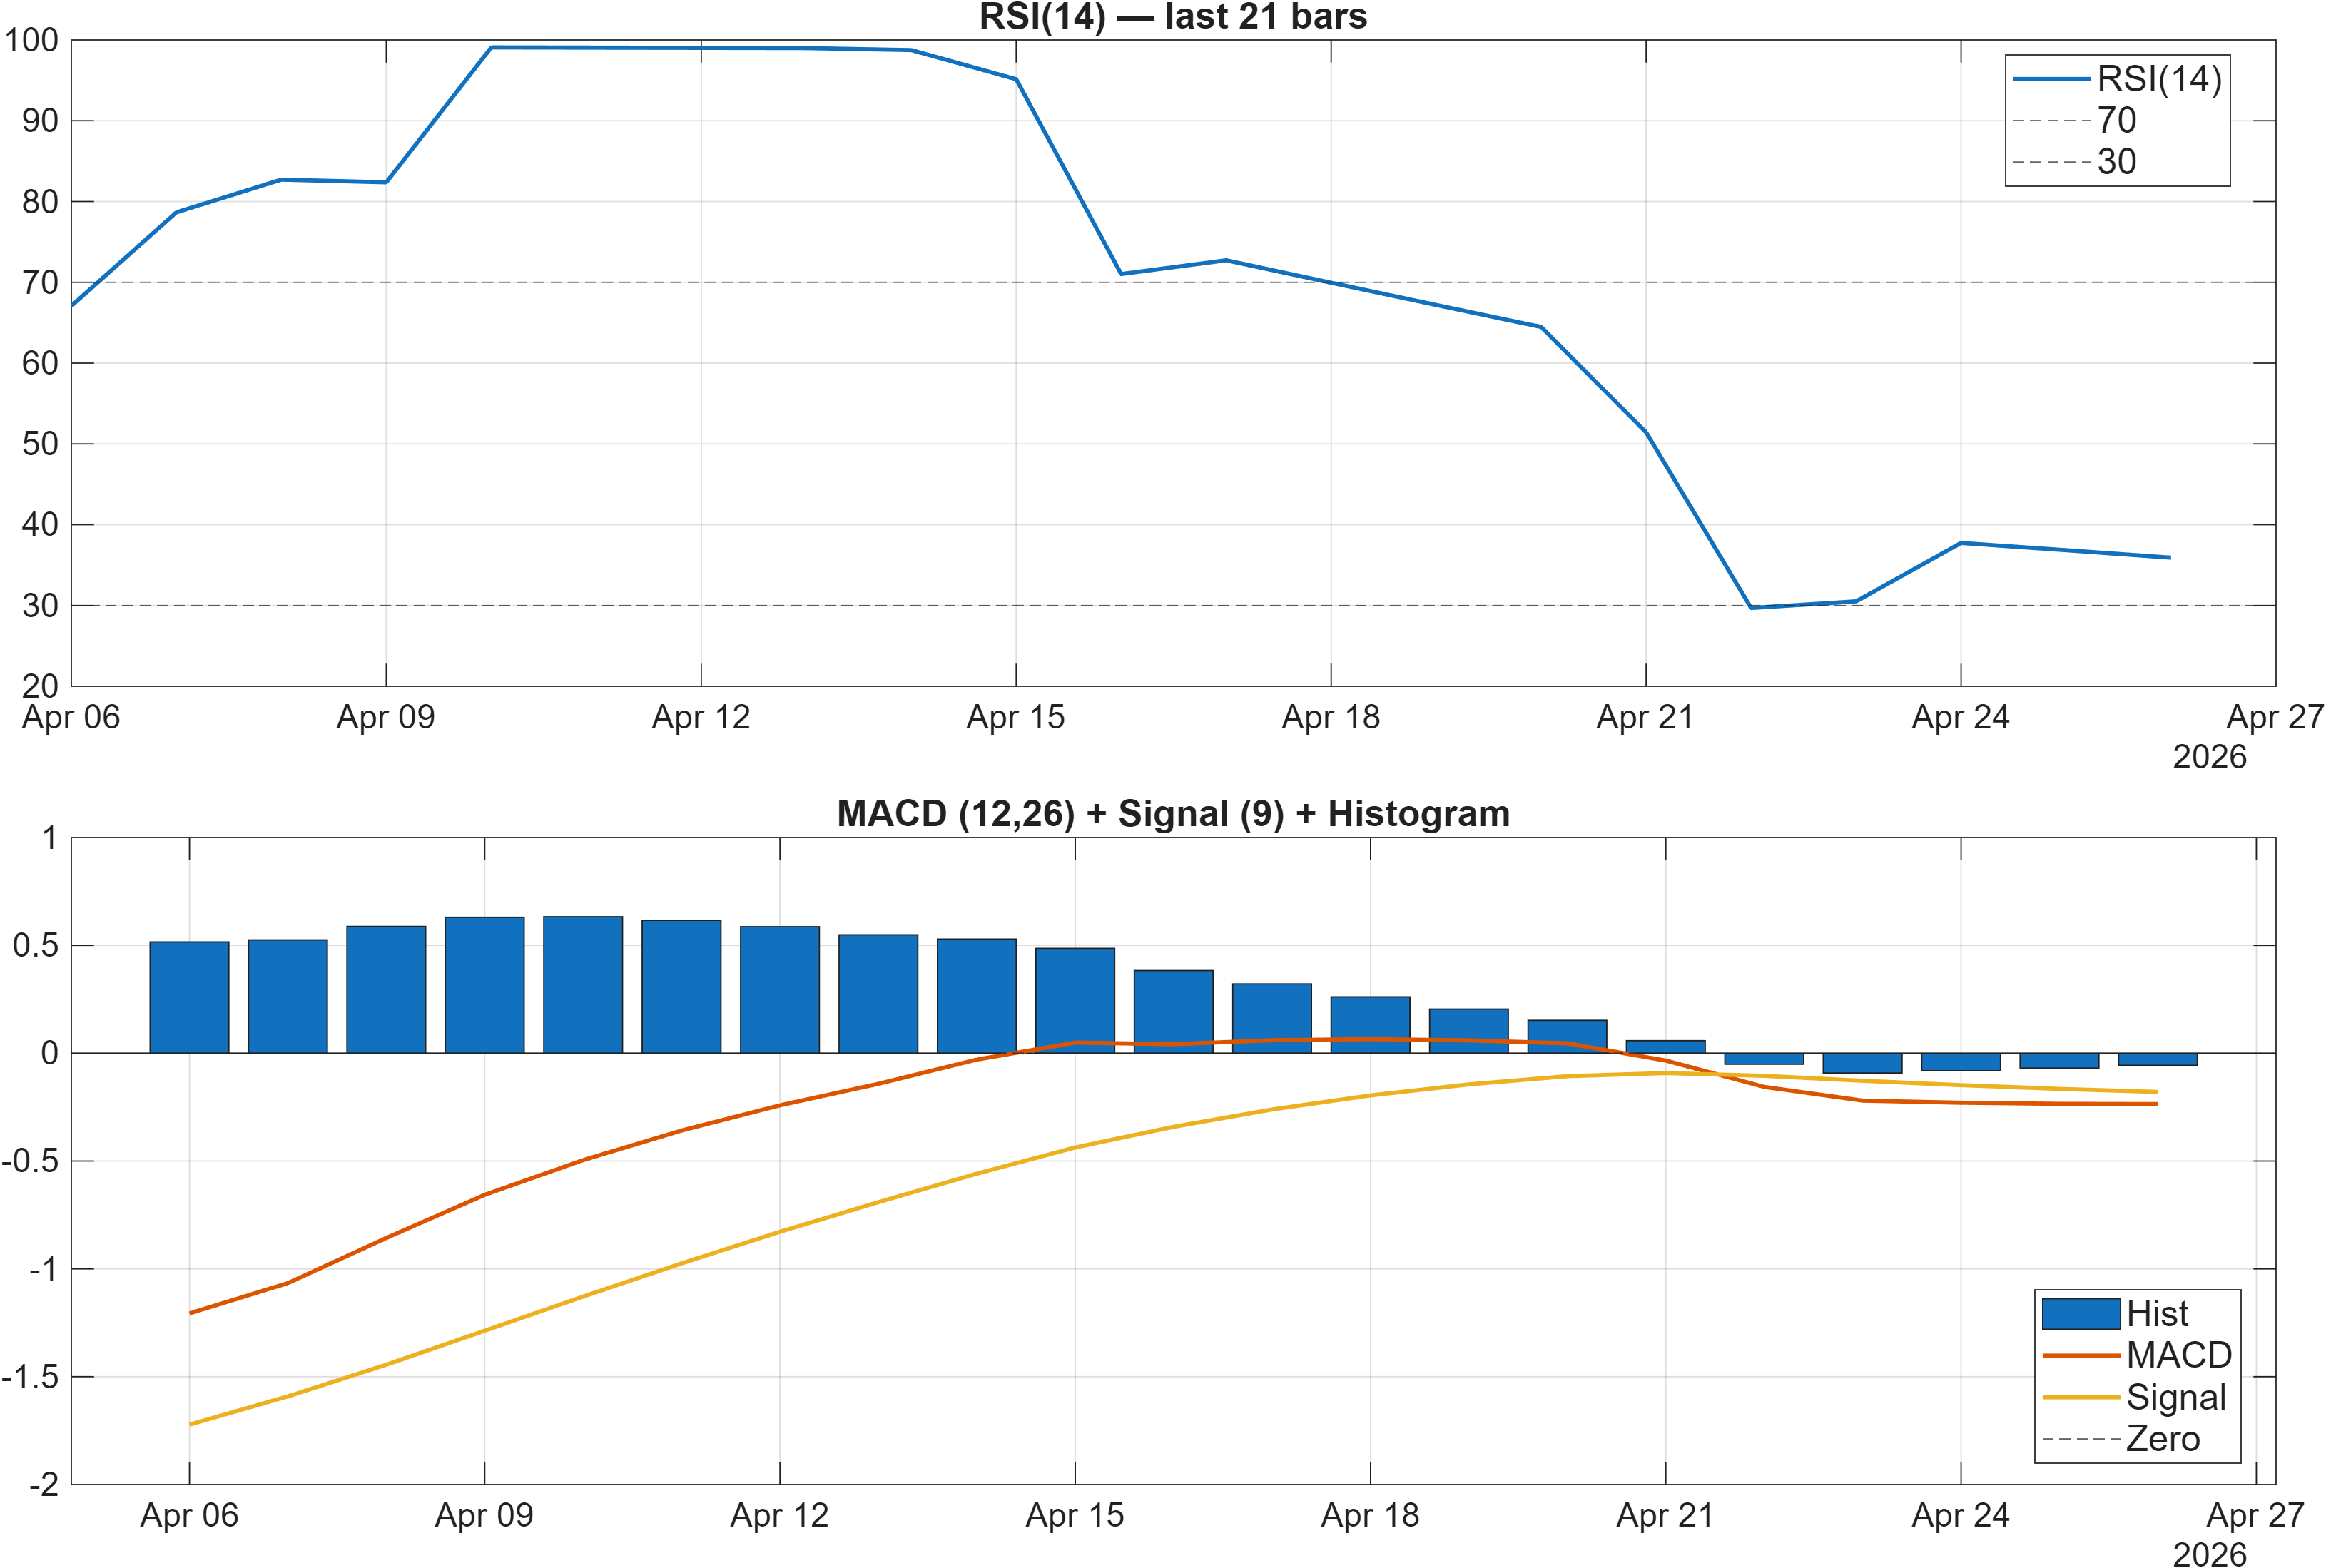
Interpretation: RSI bias = Bearish, MACD hist = -0.0564.
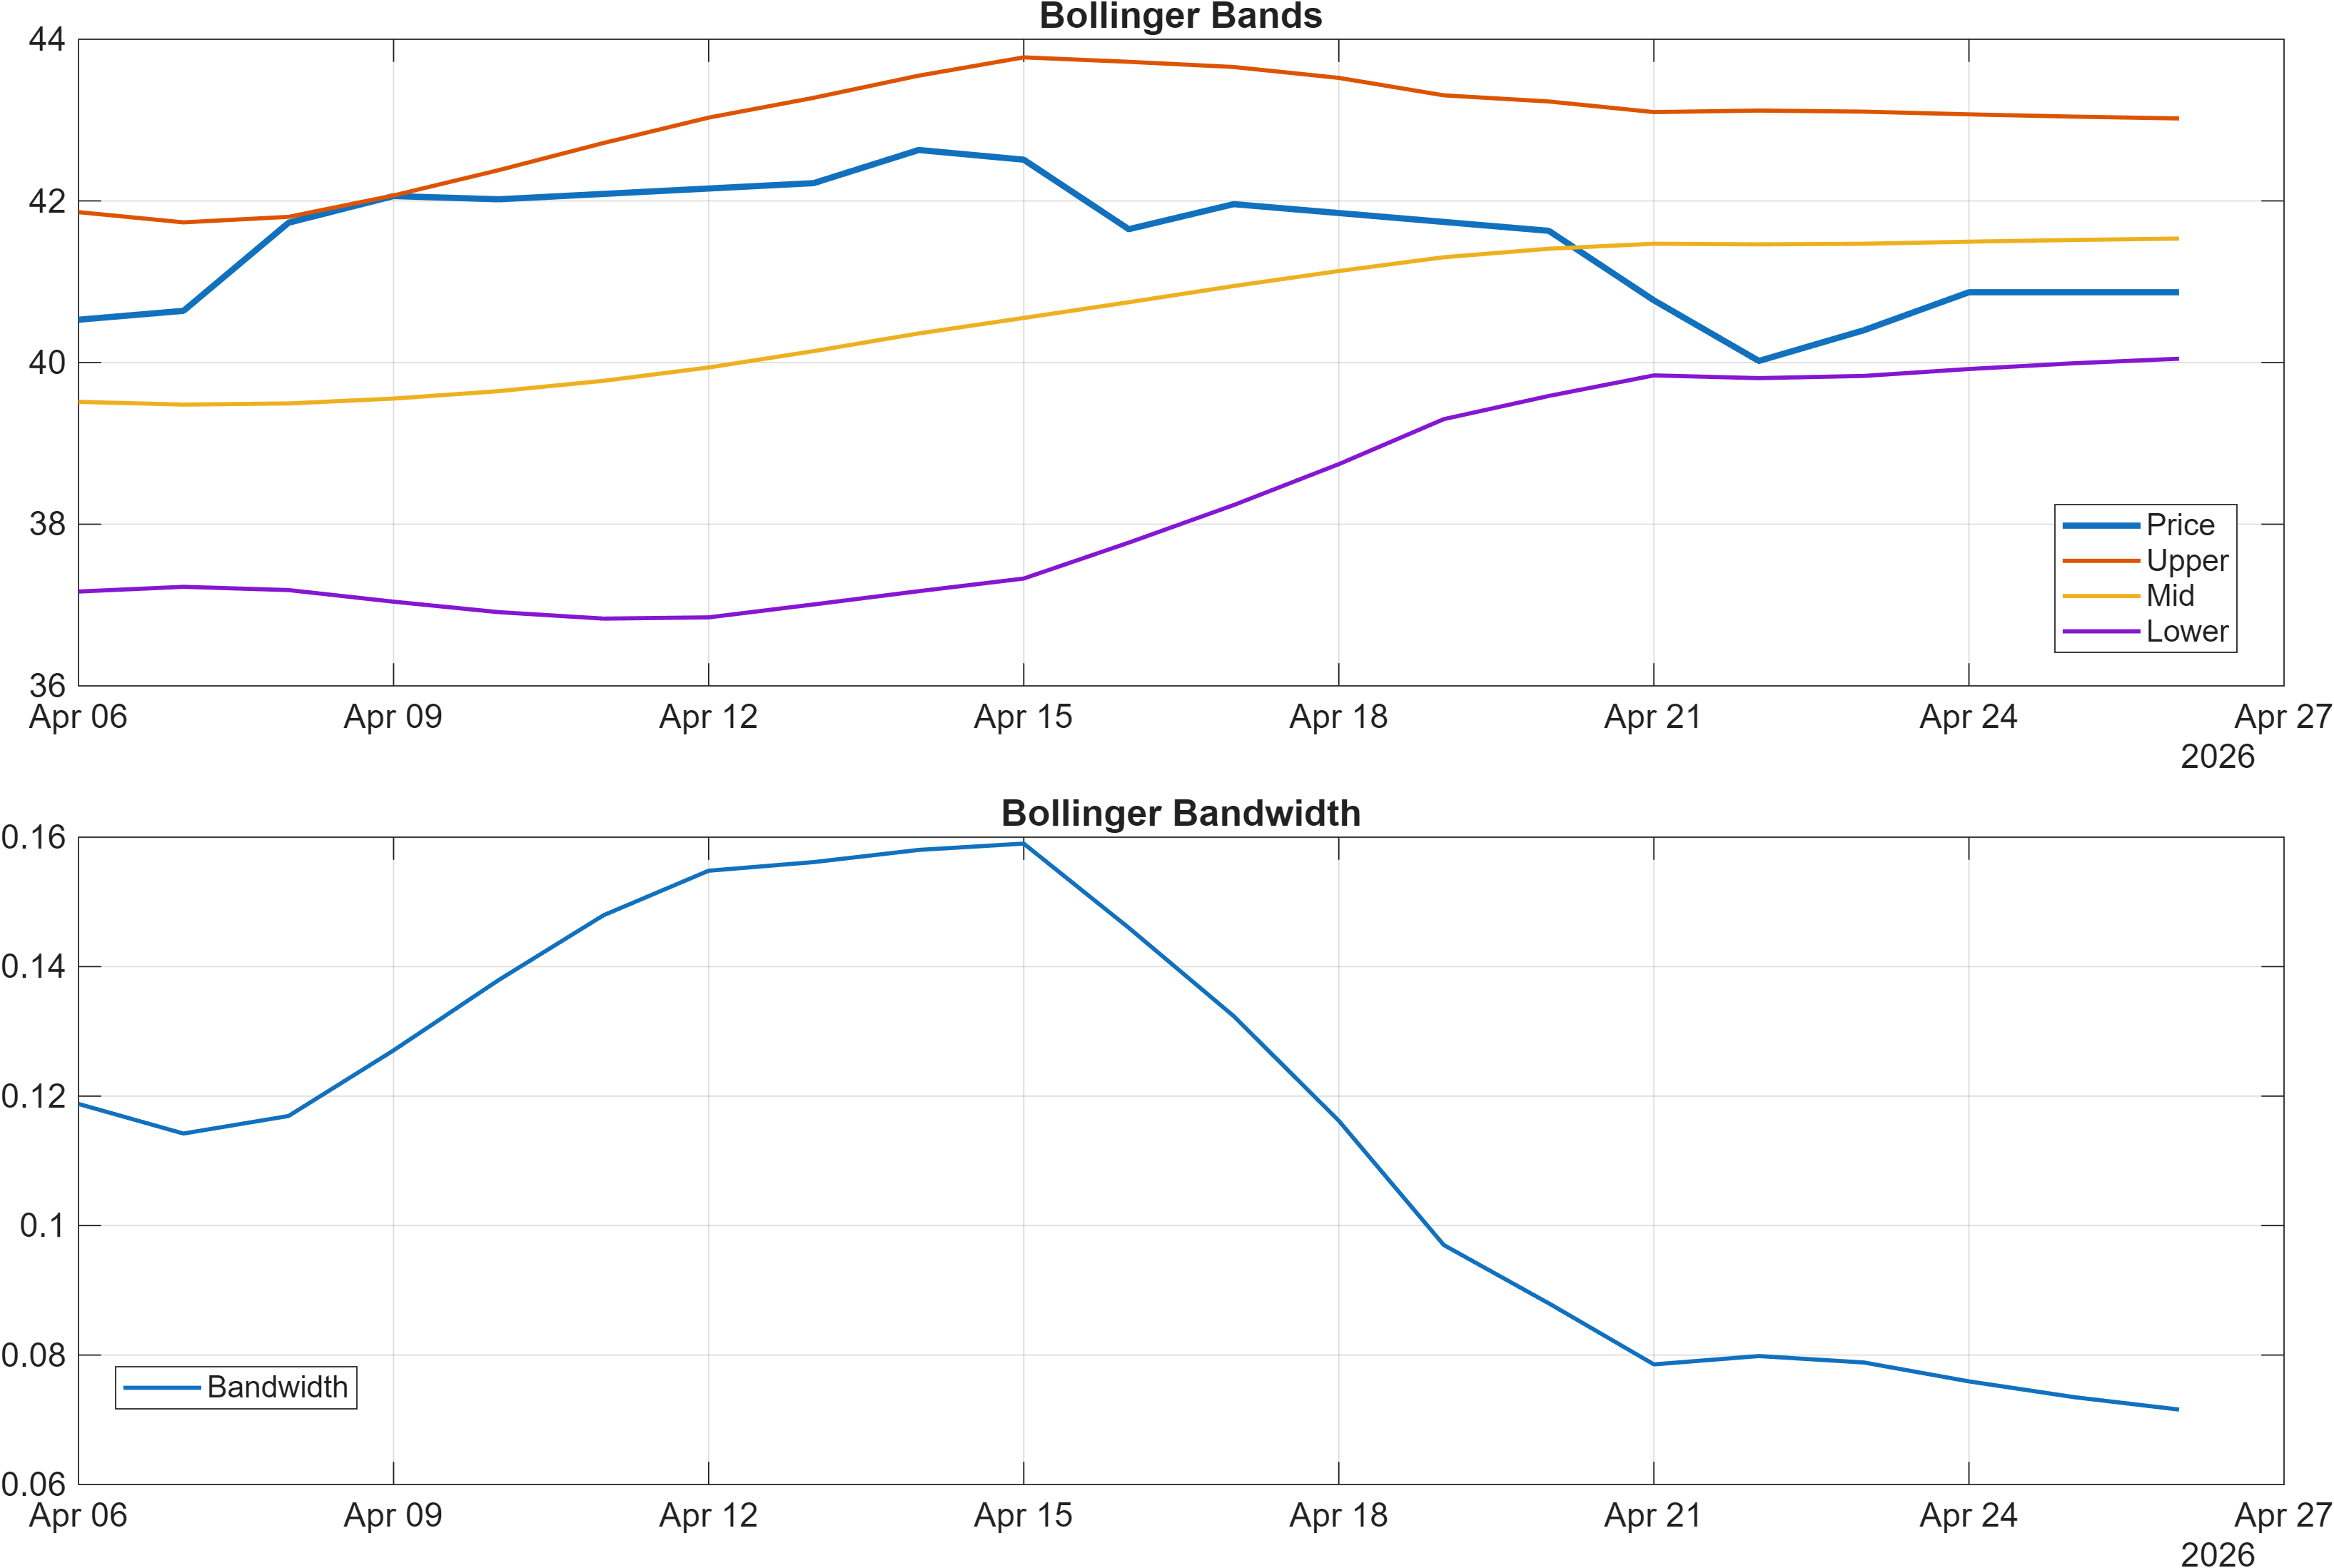
Interpretation: Bandwidth (volatility regime) latest = 0.0716.
Momentum indicators tilt cautious, but the volatility regime suggests conditions are not disorderly. The RSI(14) at 35.92 is in a weaker zone and consistent with the bearish short-term bias. At the same time, RSI at this level can also coincide with late-stage downside pressure, so the key is whether RSI begins to recover while price improves versus the MA50 (Section 2).
The MACD histogram at -0.05636 reinforces that the current impulse remains negative. Rather than treating the MACD reading as a standalone direction call, it’s more informative as a measure of whether downside momentum is accelerating or fading. A histogram that remains negative while becoming less negative can precede stabilization; a histogram that deepens would align with a renewed leg lower, particularly if support at 37.8900 is tested.
Volatility, measured by Bollinger bandwidth, is relatively contained with a latest reading of 0.0716. This is important for framing risk: a tight bandwidth often signals compression, where subsequent expansion can amplify the next directional move. In that context, support and resistance levels become more consequential, as a breakout or breakdown from compression tends to produce clearer follow-through than in high-noise regimes.
Taken together, the dashboard indicates bearish momentum inside a lower-volatility envelope. That combination is frequently associated with grinding pullbacks rather than panic, leaving room for ranks (notably the 3-month #21) to remain strong even while momentum is still repairing.
4) Support / Resistance zones
Support ~ 37.8900 | Resistance ~ 49.1725
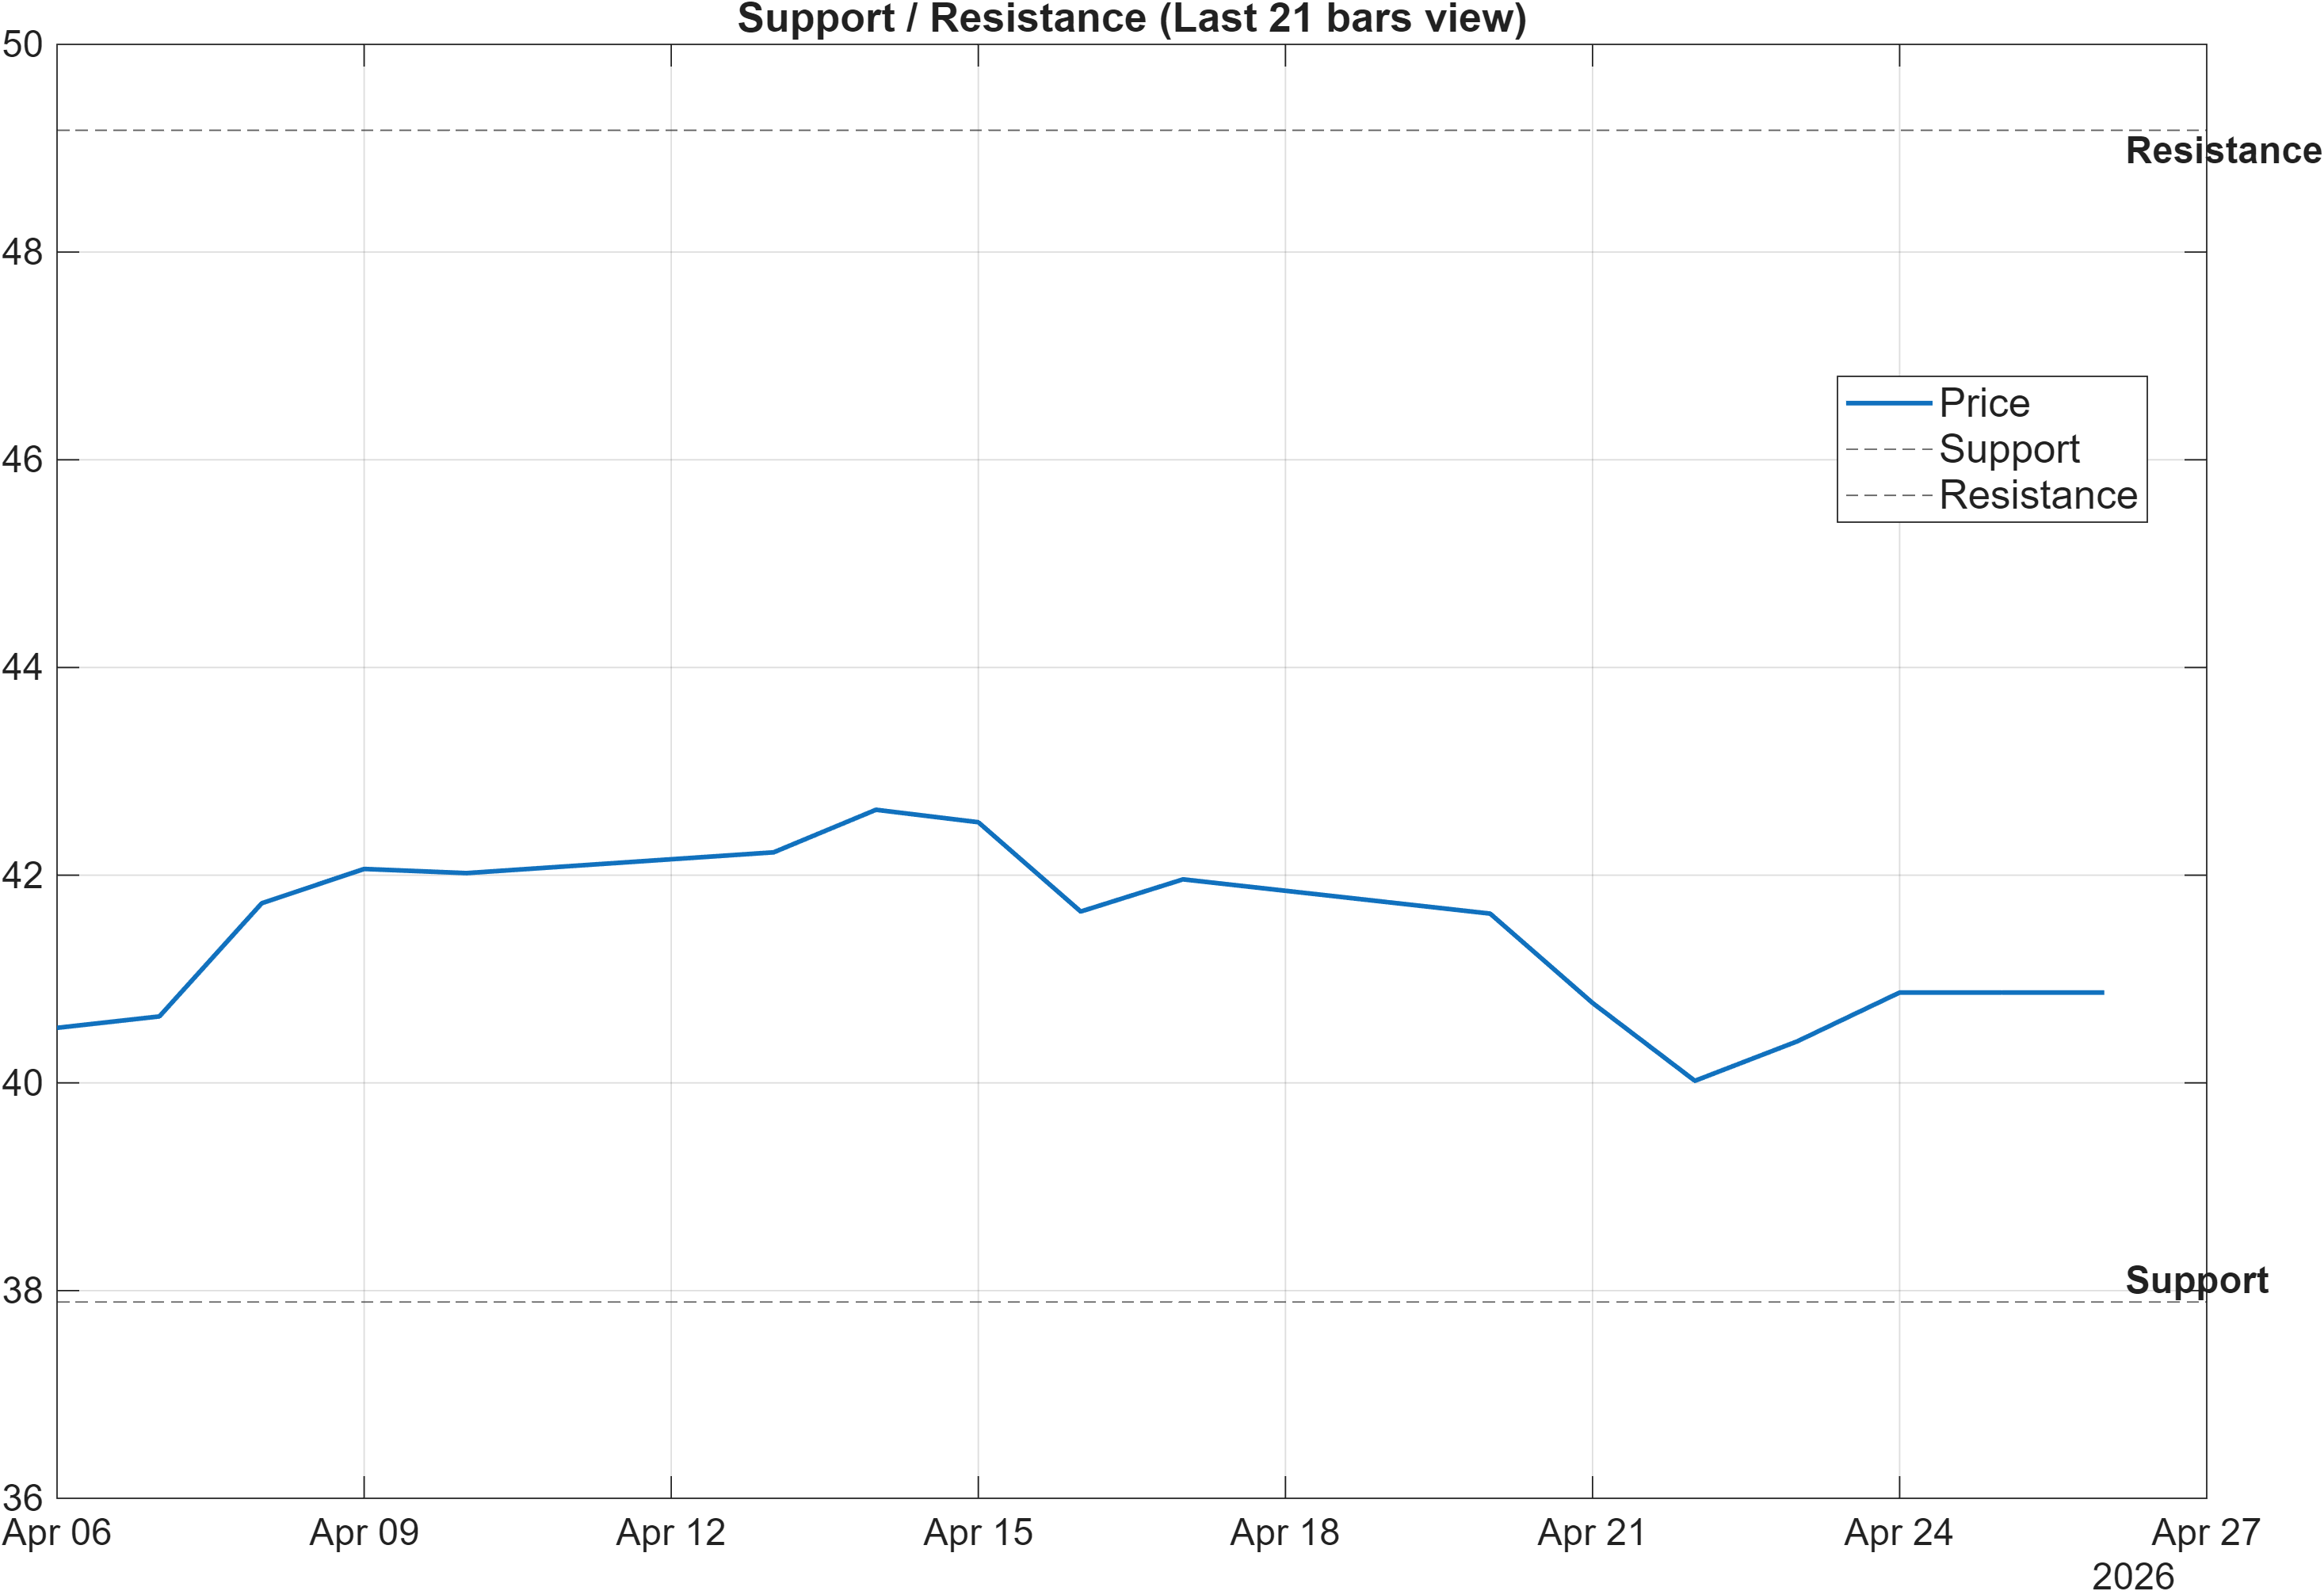
Scenario view: Break above resistance with volume → continuation. Close below support → signal deterioration risk.
The current technical map is defined by a wide but clean decision corridor: 37.8900 as support and 49.1725 as resistance. With momentum still soft (RSI 35.92, MACD histogram -0.05636) and trend structure bearish versus key moving averages, these levels serve less as targets and more as validation gates for whether the mid-term rank strength can translate into durable price behavior.
The highest-quality bullish confirmation in this framework is not simply touching resistance, but acceptance above 49.1725 with volume. That would align the breakout condition with the already supportive mid-term ranks (monthly #114, 3-month #21) and could reduce the internal conflicts currently present in the technical stack (Section 5). In a compressed volatility regime (bandwidth 0.0716), such acceptance can be more informative because breakouts are less likely to be immediately reversed by elevated noise.
On the downside, the risk signal is explicit: a close below 37.8900 increases the probability that the longer-window weakness (6-month rank #1498) is still the dominant regime. In that scenario, the bearish moving-average structure would have fewer counterweights, and the negative momentum readings would be interpreted as persistence rather than repair.
Until either boundary is resolved, the more conservative interpretation is range management: respecting the corridor as a probabilistic zone where confirmation requires multiple layers—price action, volume, and indicator behavior—to converge.
5) Quant Technical Dashboard (18 Signals)
KGNAI AI Technical Analysis Score (Deep Reinforcement Learning): Rank #342 out of 2057 (Rank 1 represents the strongest technical positioning and a higher probability of favorable price behavior. As ranks increase toward the maximum, the probability of favorable outcomes weakens and bearish positioning becomes more dominant.) | Label: Bullish | Score: 0.667
18-Signal Technical Confluence Score: -0.111 (Neutral)
Overall Technical Score (18-signal confluence + DRL rank blend): 0.122 (Neutral)
Note: The blended score reflects signal strength weighted against broader AI technical ranking, which may temporarily diverge.
Blended technical score breakdown: 0.122 (Neutral | Bull 6 / Bear 8 / Neutral 4)
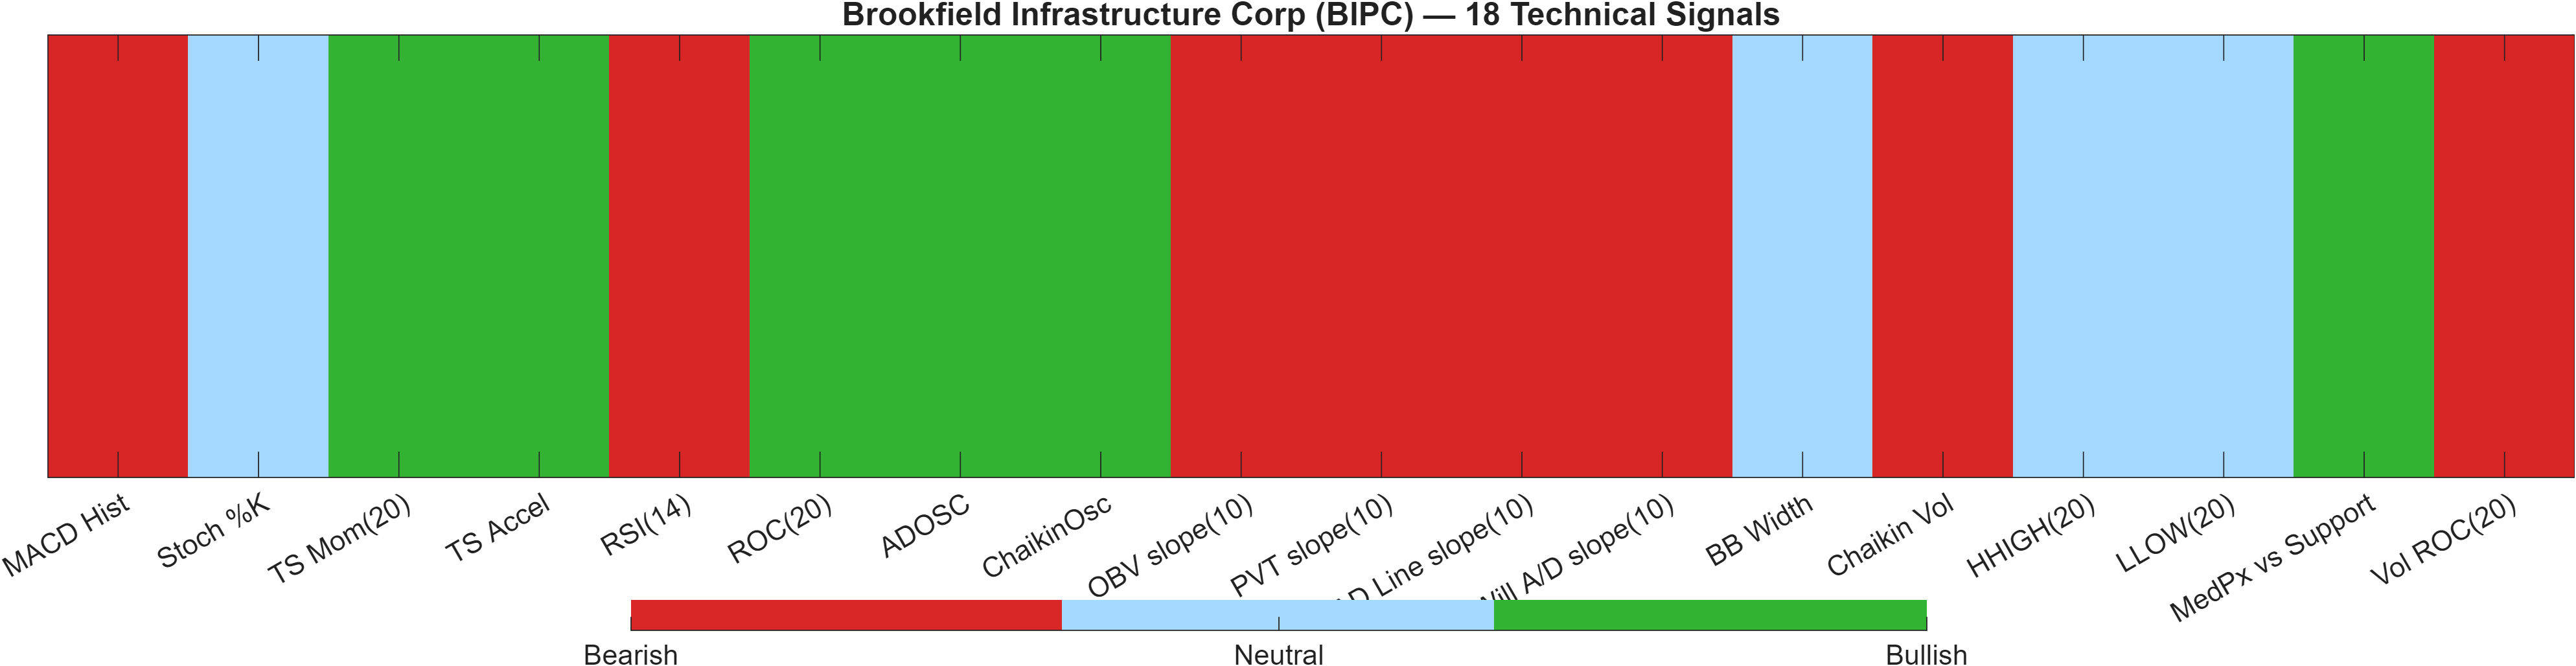
Signal table (Bull/Bear/Neutral)
| Indicator | Value | Signal |
|---|---|---|
| MACD Hist | -0.05636 | Bearish |
| Stoch %K | 40.49 | Neutral |
| TS Mom(20) | 0.23 | Bullish |
| TS Accel | 1.04 | Bullish |
| RSI(14) | 35.92 | Bearish |
| ROC(20) | 0.5659 | Bullish |
| ADOSC | 83.12 | Bullish |
| ChaikinOsc | 9.578e+04 | Bullish |
| OBV slope(10) | -1.58e+06 | Bearish |
| PVT slope(10) | -1.724e+04 | Bearish |
| AD Line slope(10) | -5.983e+05 | Bearish |
| Will A/D slope(10) | -3.066 | Bearish |
| BB Width | 0.07158 | Neutral |
| Chaikin Vol | 6.023 | Bearish |
| HHIGH(20) | 42.87 | Neutral |
| LLOW(20) | 39.81 | Neutral |
| MedPx vs Support | 2.62 | Bullish |
| Vol ROC(20) | -48.72 | Bearish |
Interpretation: Indicator-level signals form the base confluence, which is then adjusted using a separate AI-driven technical ranking model. The final technical score summarizes this combined view.
The dashboard is best read as a model-layer divergence rather than a single verdict. The DRL technical model flags a Bullish posture via rank #342 (score 0.667), while the 18-signal confluence score is -0.111 and the blended overall technical score is 0.122, both Neutral. The distribution (Bull 6 / Bear 8 / Neutral 4) implies the median indicator set still leans defensive even as the AI rank blend detects improving structure.
Looking at representative drivers, the momentum/oscillator cluster remains a headwind: RSI(14) at 35.92 and MACD histogram -0.05636 are bearish, which is consistent with the MA stack in Section 2. At the same time, there are pockets of constructive behavior—e.g., rate-of-change and time-series momentum factors register bullish—suggesting that the downside impulse may be less uniform than the headline RSI/MACD might imply.
The more material caution comes from participation/volume-linked measures. Several accumulation/distribution and volume-rate components register bearish (including Vol ROC(20) at -48.72), which can limit breakout durability in a low-bandwidth environment (BB Width 0.07158). This is why the resistance condition in Section 4 explicitly requires volume confirmation.
Netting these layers: the technical state is neutral with selective stabilization signals. A shift toward fewer bearish participation readings, combined with improving RSI/MACD behavior, would be the cleanest way for the DRL bullish rank to propagate into stronger confluence.
6) News sentiment + extractive gist
Sentiment score (avg): 0.068 | Positive: 24% | Neutral: 71% | Negative: 6%
KGNAI AI News Sentiment Score (normalized -1 to +1): 1.00 (as of 2026-04-17) | Label: Bullish | Overall news score: 0.99
Positive Developments
Recent coverage across major financial outlets indicates a constructive tone around operational positioning and longer-run platform themes, contributing to a normalized sentiment score of 1.00 (as of 2026-04-17). Commentary has tended to emphasize business resilience narratives and ongoing portfolio actions, which is consistent with the modestly positive aggregate sentiment profile (avg 0.068) despite most articles being categorized as neutral. From a market-structure lens, that mix can matter: when 71% of coverage is neutral and only 24% is explicitly positive, incremental improvements in tone can still lift marginal demand without creating crowded positioning. For BIPC specifically, the relevance is contextual—positive sentiment can help sustain mid-term rank strength (e.g., the 3-month rank #21), but it is unlikely to override the current bearish MA configuration without a price/volume catalyst.
Neutral / Mixed Developments
The bulk of the news flow is informational, reflected in the 71% neutral classification and the report’s overall framing of sentiment as largely non-directional. Coverage frequently concentrates on scheduled corporate communications and filings, which generally function as volatility catalysts only if they introduce surprises. In a chart context where Bollinger bandwidth is relatively contained (0.0716), routine events can still coincide with volatility expansion, but the direction tends to be decided by how price behaves around pre-defined decision zones. That places added emphasis on the technical map—particularly the 49.1725 resistance and 37.8900 support—because neutral news cycles often shift the market’s focus back to technical acceptance/rejection rather than narrative.
Negative / Risk Signals
The negative bucket remains small (6%), but risk should be framed less by headline count and more by whether narrative optimism conflicts with weaker market internals. At present, the technical layer still contains notable caution signals—bearish RSI bias (RSI 35.92) and a negative MACD histogram (-0.05636)—which can create a sentiment/price tension: coverage can lean constructive while price behavior remains heavy. Additionally, repeated attention around thematic areas can heighten sensitivity to event outcomes, raising the probability of gap risk even when average sentiment is mildly positive (0.068). Within this setup, the clearest risk trigger remains technical: a close below 37.8900 would align news-neutral conditions with a more negative price structure, increasing deterioration risk regardless of broader narrative tone.
- Whether price action can hold above the MA50 and improve breadth/participation readings alongside momentum repair.
- Reaction behavior near 49.1725 (acceptance vs rejection), especially if accompanied by a visible volume shift.
- Downside integrity of 37.8900 during any volatility expansion from the current bandwidth regime.
Sources referenced: Reuters, Bloomberg, Yahoo Finance, MarketWatch, Investing.com
7) Sources
Source links are not reproduced here. See the provided data for the original source list.
Snapshot: AI Rank (Short–Mid–Long): Mixed (Neutral–Bullish–Neutral) · Technical Confluence: Neutral · Key Levels: Support ~37.89 | Resistance ~49.17 · News Sentiment: Neutral
You may also like: How KGNAI AI ranks instruments across global markets
Disclaimer: KGNAI provides AI-generated analytics and educational market commentary only. This is not financial advice. Markets involve risk. Always do your own research.