
Brookfield Infrastructure Corp (BIPC) — 03-May-2026 Technical & Rank Read: No Strong Confirmation Yet
Brookfield Infrastructure Corp (BIPC) presents a mixed cross-horizon profile as of 03-May-2026: stronger relative positioning in the medium window contrasts with softer short-term technical structure. KGNAI ranks show BIPC in the upper quartile on the Daily rank (#287/2057) and notably strong medium-term placement on the 3-Monthly rank (#21/2057), while the Weekly rank (#1105/2057) and 6-Monthly rank (#1437/2057) are more muted. Technically, trend framing remains cautious with Close vs MA50 = Bearish and MA50 vs MA200 = Bearish. Momentum indicators also lean defensive, including RSI(14) at 28.06 and a MACD histogram of -0.3647. Volatility conditions are moderate with Bollinger Bandwidth at 0.2057. News analytics skew mildly constructive in aggregate, with a sentiment score (avg) of 0.068 alongside a normalized news sentiment score of 1.00, suggesting a supportive narrative that is not yet fully confirmed by price-based signals.
- Rank stance (Short / Mid / Long): Neutral / Bullish / Neutral (Daily #287; 3-Monthly #21; 6-Monthly #1437)
- Technical confluence label: Neutral (blended) with 18-signal confluence at -0.333 (Bearish)
- Key levels: Support 37.4825 | Resistance 47.4675
- News sentiment bias: Slightly constructive/neutral in distribution (30% positive, 60% neutral, 10% negative) with avg 0.068
- Confirmation / invalidation condition: Sustained strength is better supported on a break above 47.4675 with volume; a close below 37.4825 increases deterioration risk
KGNAI evaluates assets using large cross-sectional datasets built from millions of structured data points. Inputs incorporate fundamental metrics, technical structures, and systematically processed news sentiment. Statistical models, machine learning, and AI frameworks are used to assess relative positioning, signal alignment, and probabilistic behavior across broad universes.
- Ranks are comparative across the tracked universe, not absolute price targets.
- Confluence reflects alignment among independent signal groups.
- Support/resistance levels are probabilistic decision zones, not guarantees.
- Sentiment provides contextual bias within the broader analytical framework.
1) KGNAI AI Analysis
Region: USA
Total universe size: 2057 ranked instruments
- Daily rank: #287 out of 2057 — Bullish
- Weekly rank: #1105 out of 2057 — Neutral
- Monthly rank: #182 out of 2057 — Bullish
- 3-Monthly rank: #21 out of 2057 — Bullish
- 6-Monthly rank: #1437 out of 2057 — Neutral
- Yearly rank: Not available for this horizon — Not available
The rank stack is best read as a dispersion signal across horizons rather than a single directional read. BIPC’s 3-Monthly rank (#21/2057) places it in the top decile of the tracked universe and aligns with the Monthly rank (#182/2057) and Daily rank (#287/2057), indicating the medium window continues to screen well on KGNAI’s cross-sectional tests. The tension comes from slower-horizon neutrality: the Weekly rank (#1105/2057) sits closer to the mid-pack, while the 6-Monthly rank (#1437/2057) falls into the weaker half of the universe, consistent with longer-cycle consolidation or a still-unresolved regime shift.
This multi-speed profile supports the platform’s current Term view of Short-term: Neutral, Mid-term: Bullish, and Long-term: Neutral. In practice, that configuration often occurs when a previously stronger medium-term structure is being tested by near-term drawdown dynamics, but has not yet degraded enough to fully unwind the intermediate ranking.
The Yearly rank is Not available in the provided data. With that limitation, the cleanest read is to treat BIPC as an instrument with mid-term relative strength but incomplete confirmation from slower-horizon ranking—an environment where persistence (or reversal) matters more than any single update.
Want the full universe and complete rank tables? Unlock full access on KGNAI: https://www.kgnai.com/pricing
2) Price & trend overview
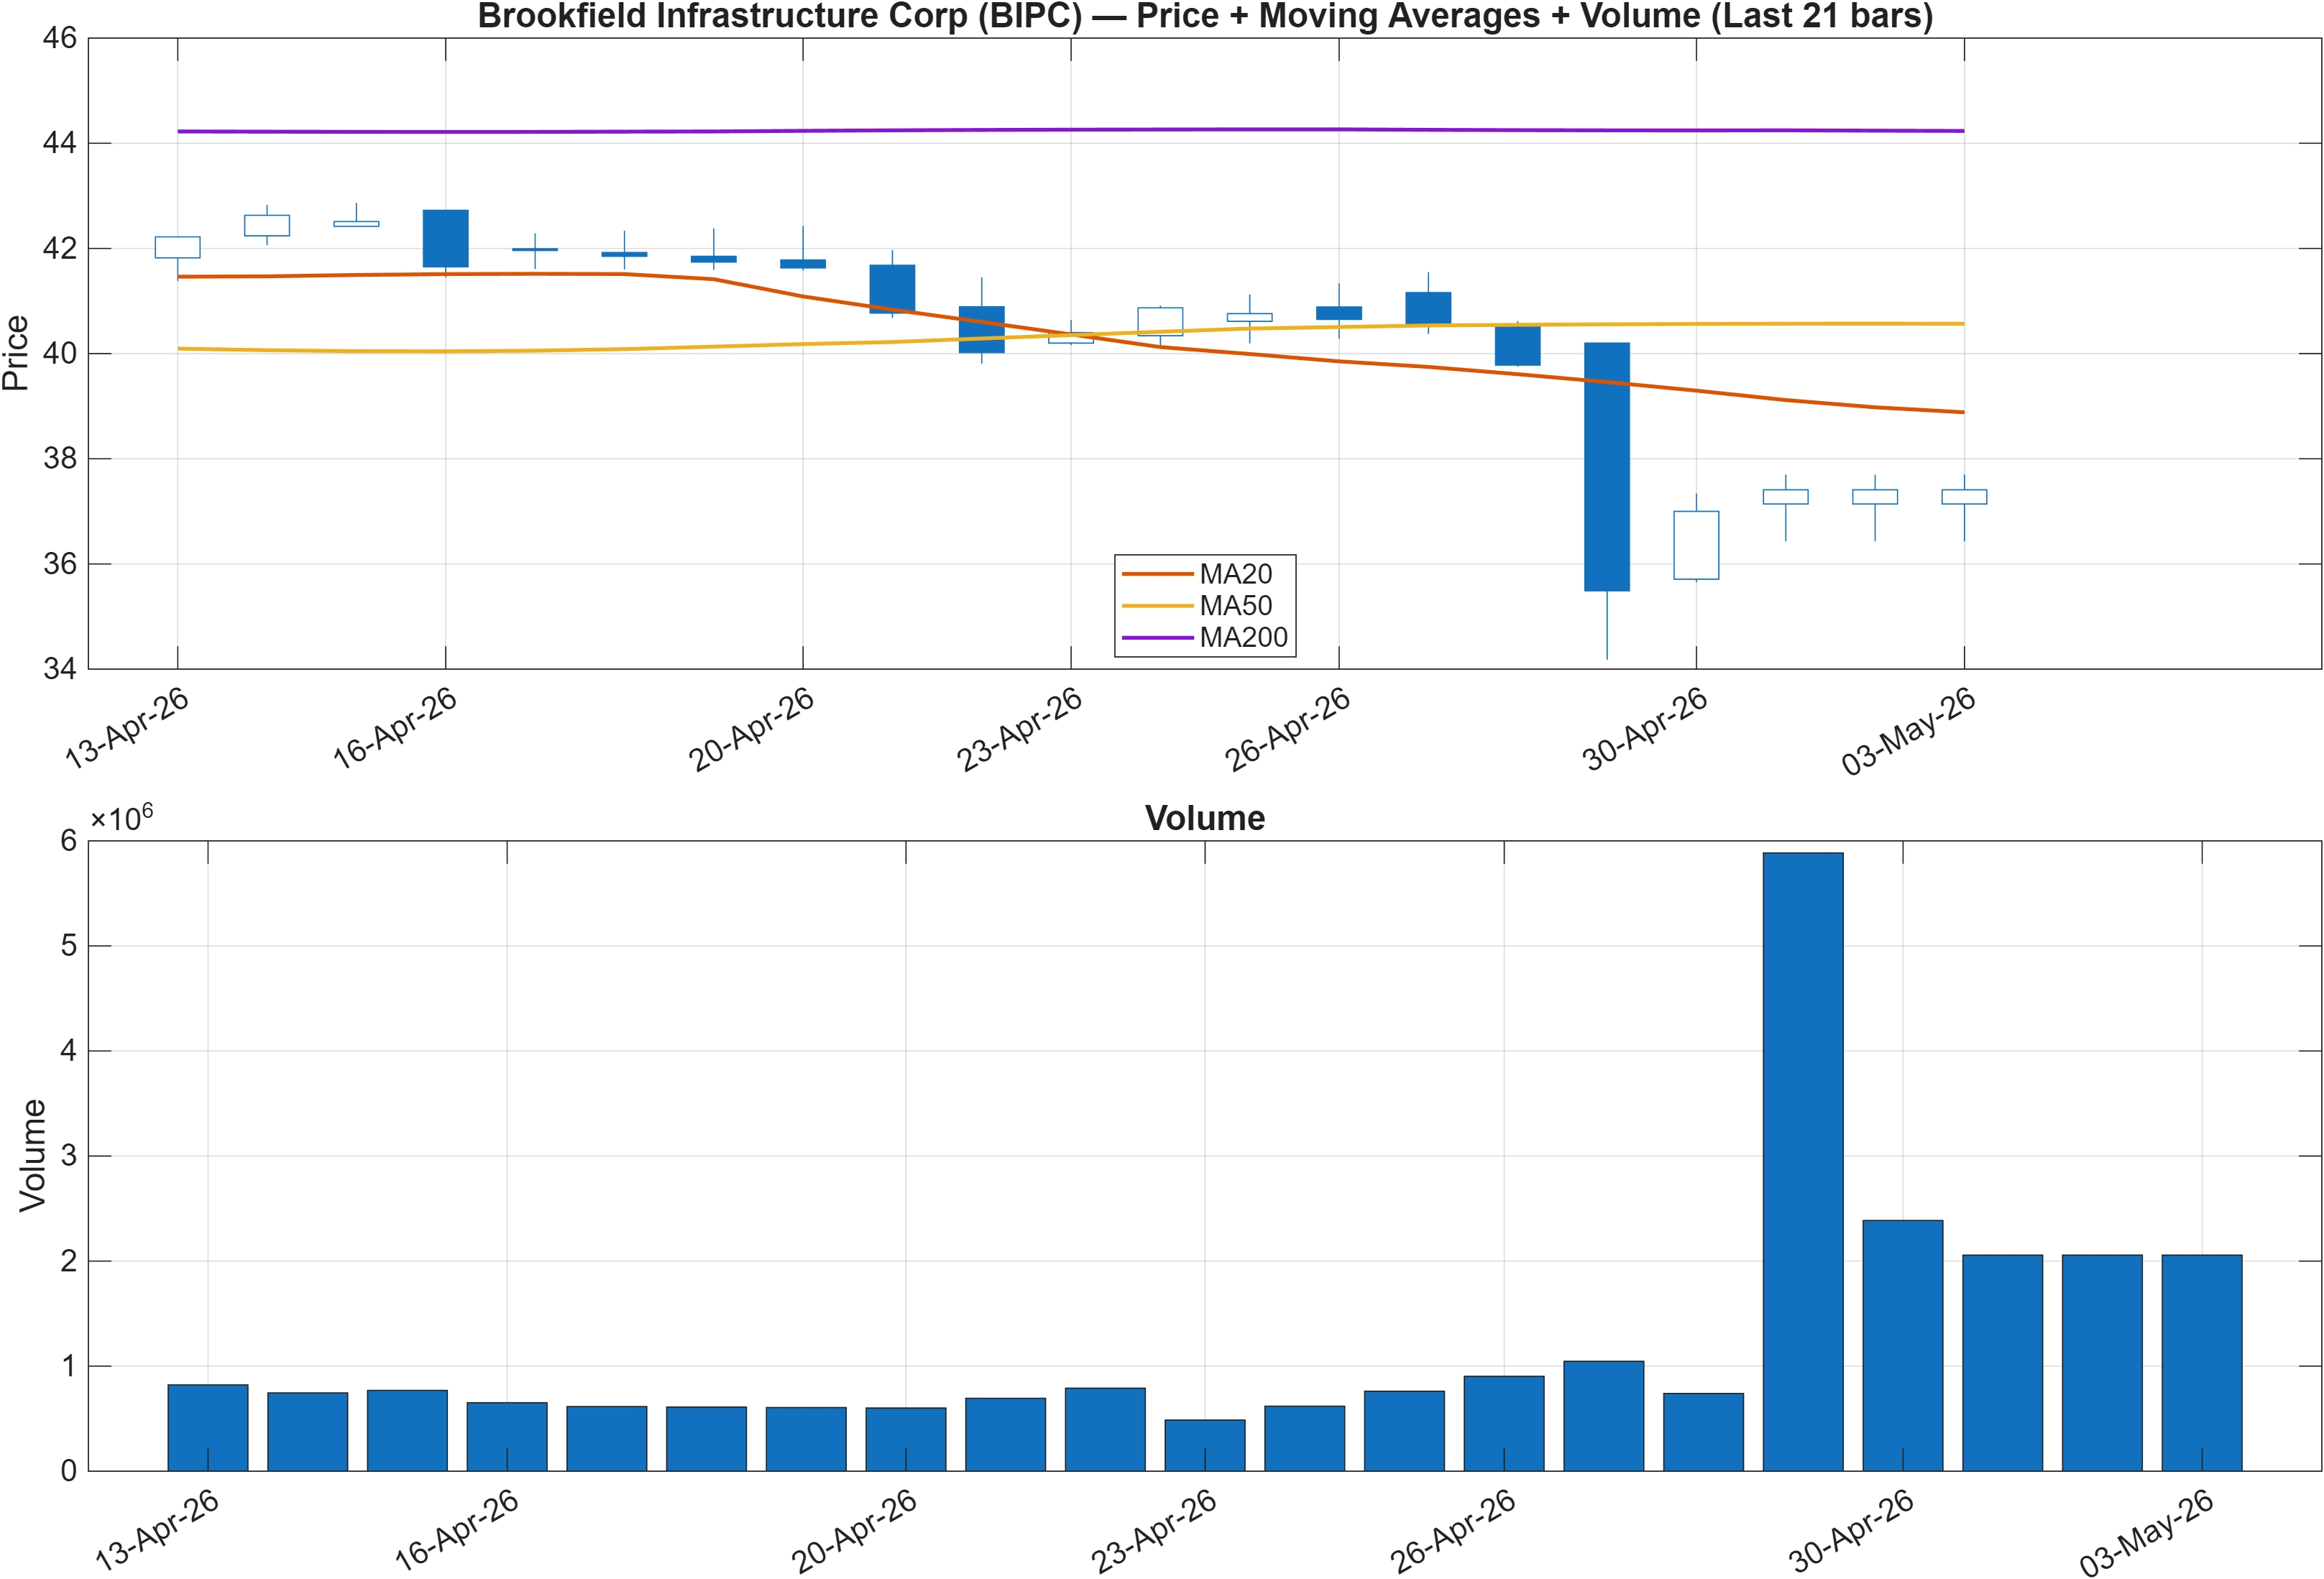
The trend layer remains the primary constraint on bullish confirmation. With Close vs MA50 = Bearish and MA50 vs MA200 = Bearish, BIPC is framed as trading below a declining or disadvantaged intermediate trend while the longer moving-average relationship also points to a softer regime. This configuration often implies that rallies may face systematic supply from trend-following participants until the MA structure improves.
That said, the rank profile (notably #21/2057 on the 3-month horizon) argues that the broader medium-term behavior has still screened well relative to the universe, creating a rank–trend divergence: cross-sectional strength is present while the classic moving-average trend template is still bearish. When these disagree, follow-through typically depends on whether participation and momentum can rotate before trend definitions catch up.
The report’s key levels provide a practical map for evaluating whether the trend pressure is easing. With Support ~ 37.4825 and Resistance ~ 47.4675, the distance between zones is wide enough that interim swings can occur without resolving the regime. A move toward resistance without improvement in momentum indicators (see RSI/MACD below) would keep the structure “unconfirmed,” while stabilization above support helps preserve the argument that the bearish MA stack is being tested rather than reaffirmed.
Overall, price/trend conditions are consistent with a market that is still negotiating direction: the MA relationships point bearish, while the broader KGNAI ranks suggest the medium-term backdrop has not fully capitulated.
3) Momentum & volatility dashboard
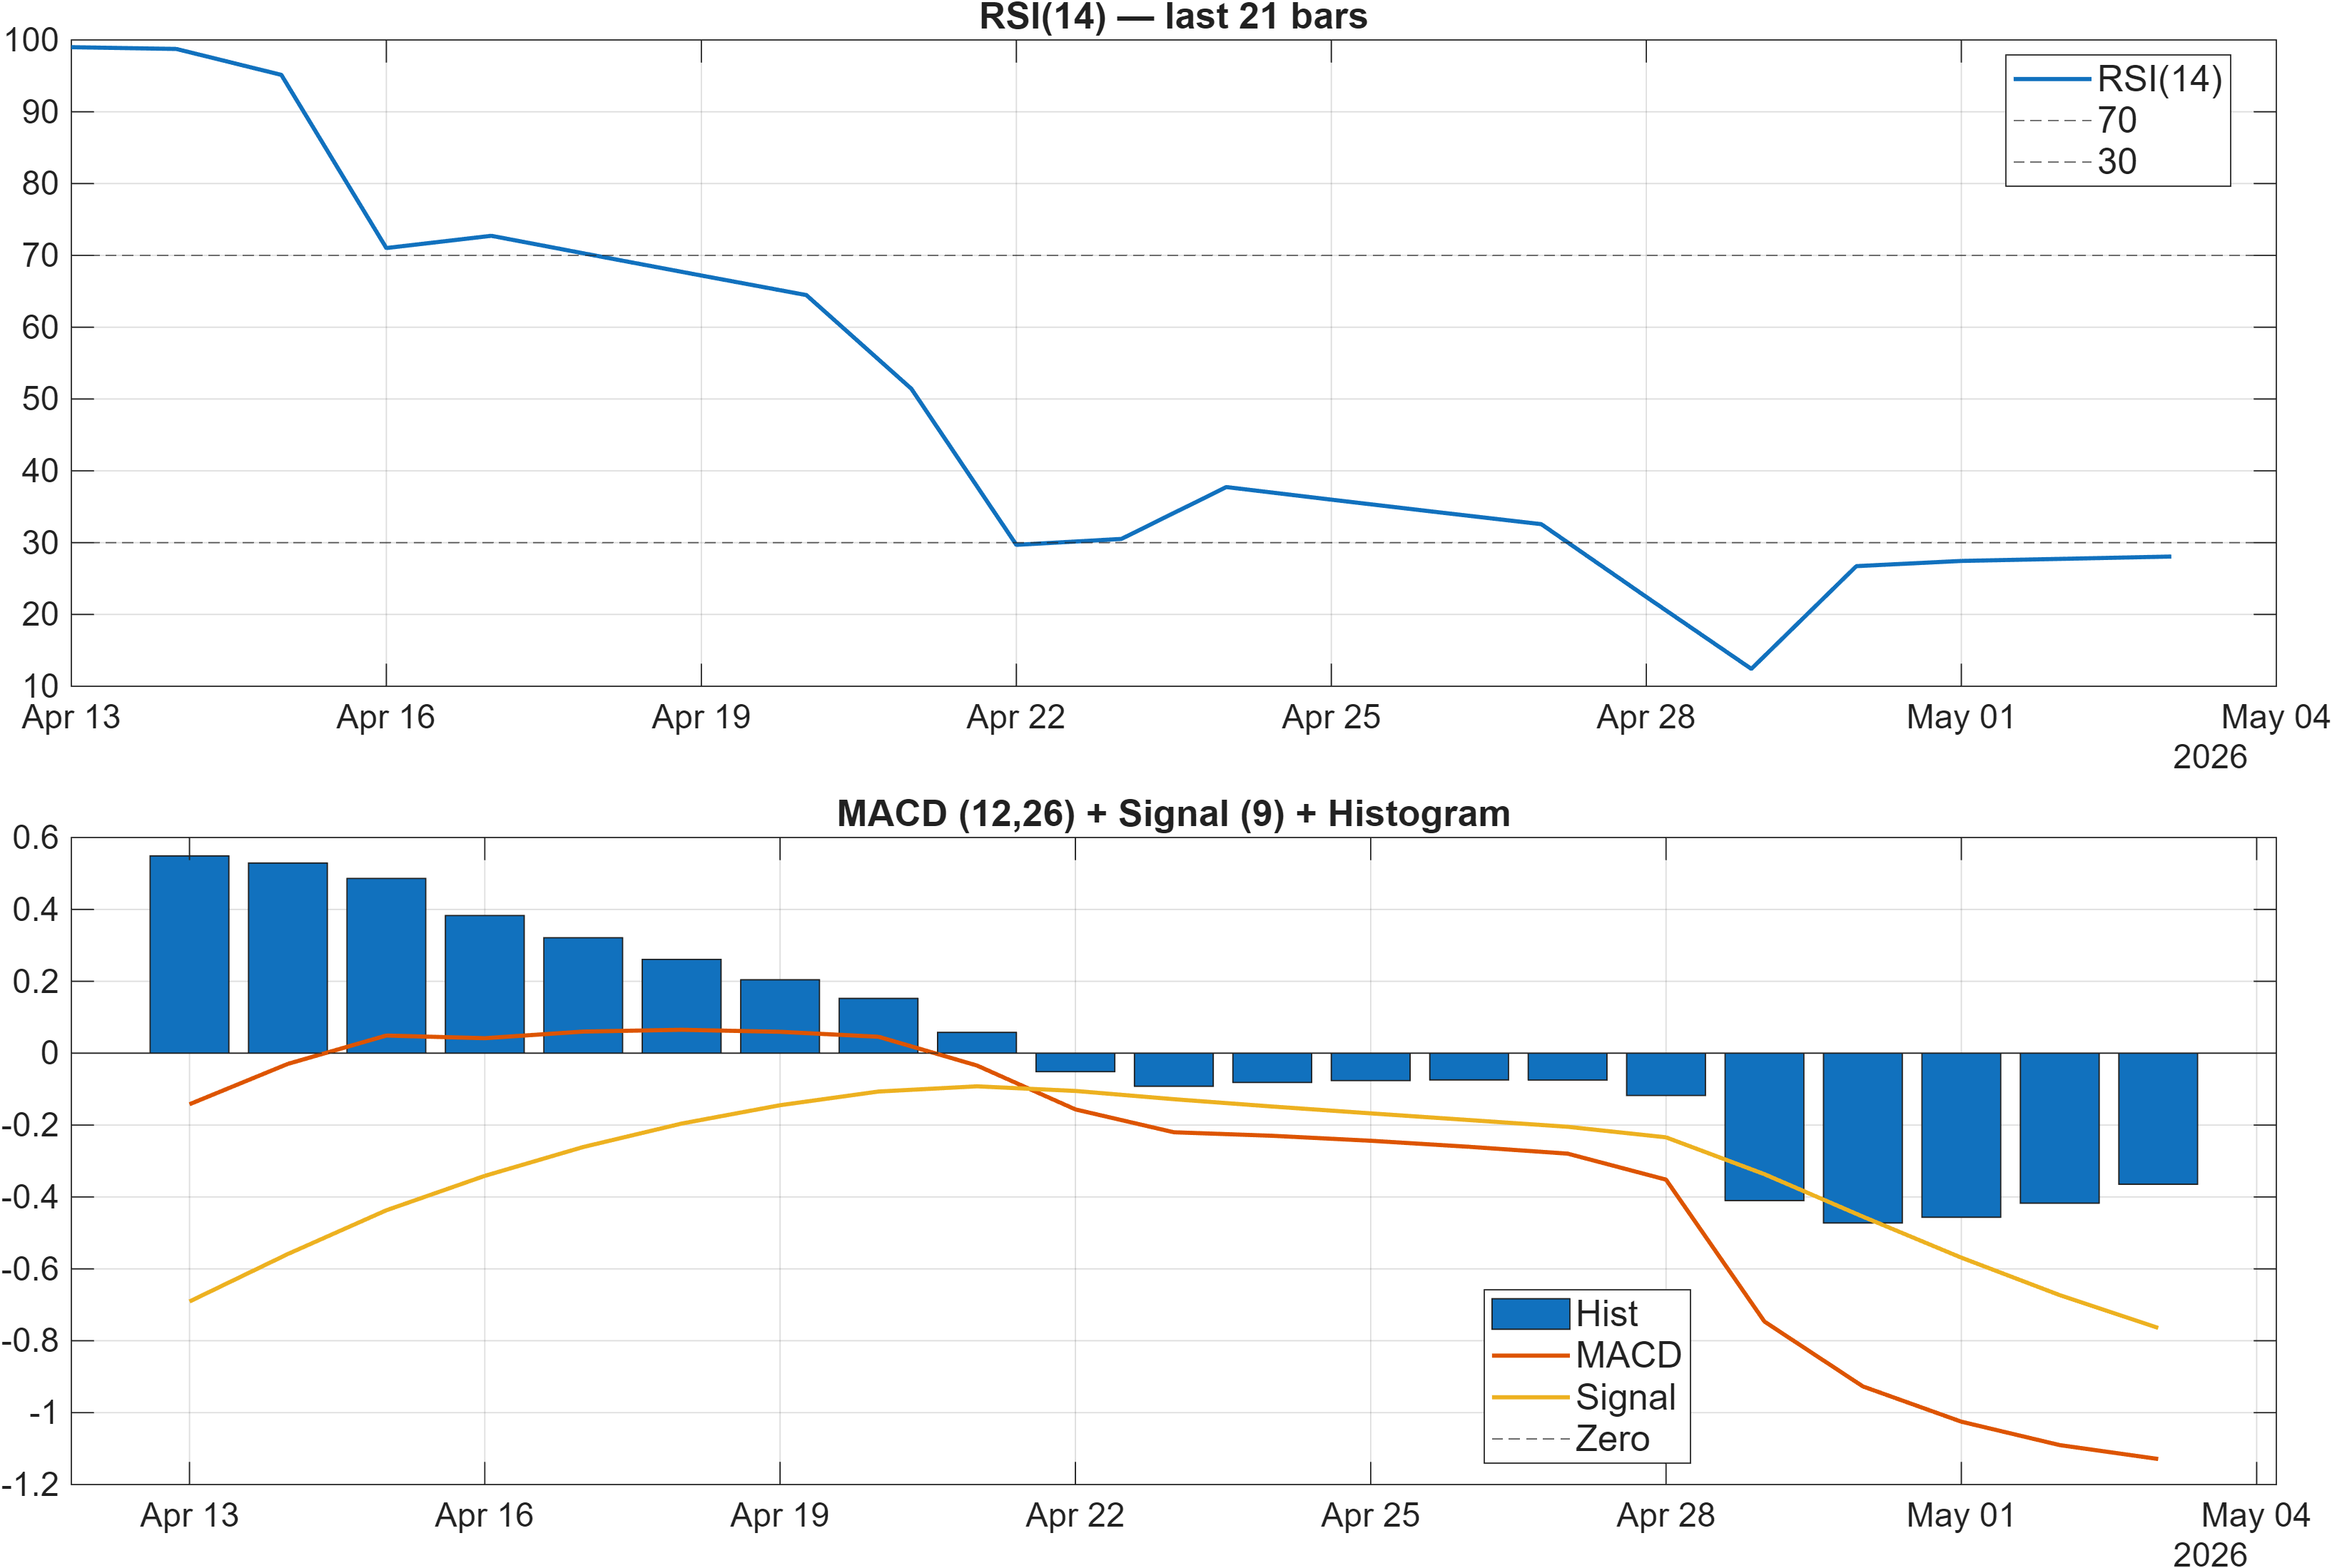
Momentum signals are currently more consistent than the rank stack—and they lean defensive. The RSI(14) at 28.06 is accompanied by an RSI bias = Bearish, indicating pressure strong enough to push the oscillator into a deeply weak zone. At the same time, the MACD histogram at -0.3647 confirms that downside momentum remains dominant rather than merely mean-reverting noise.
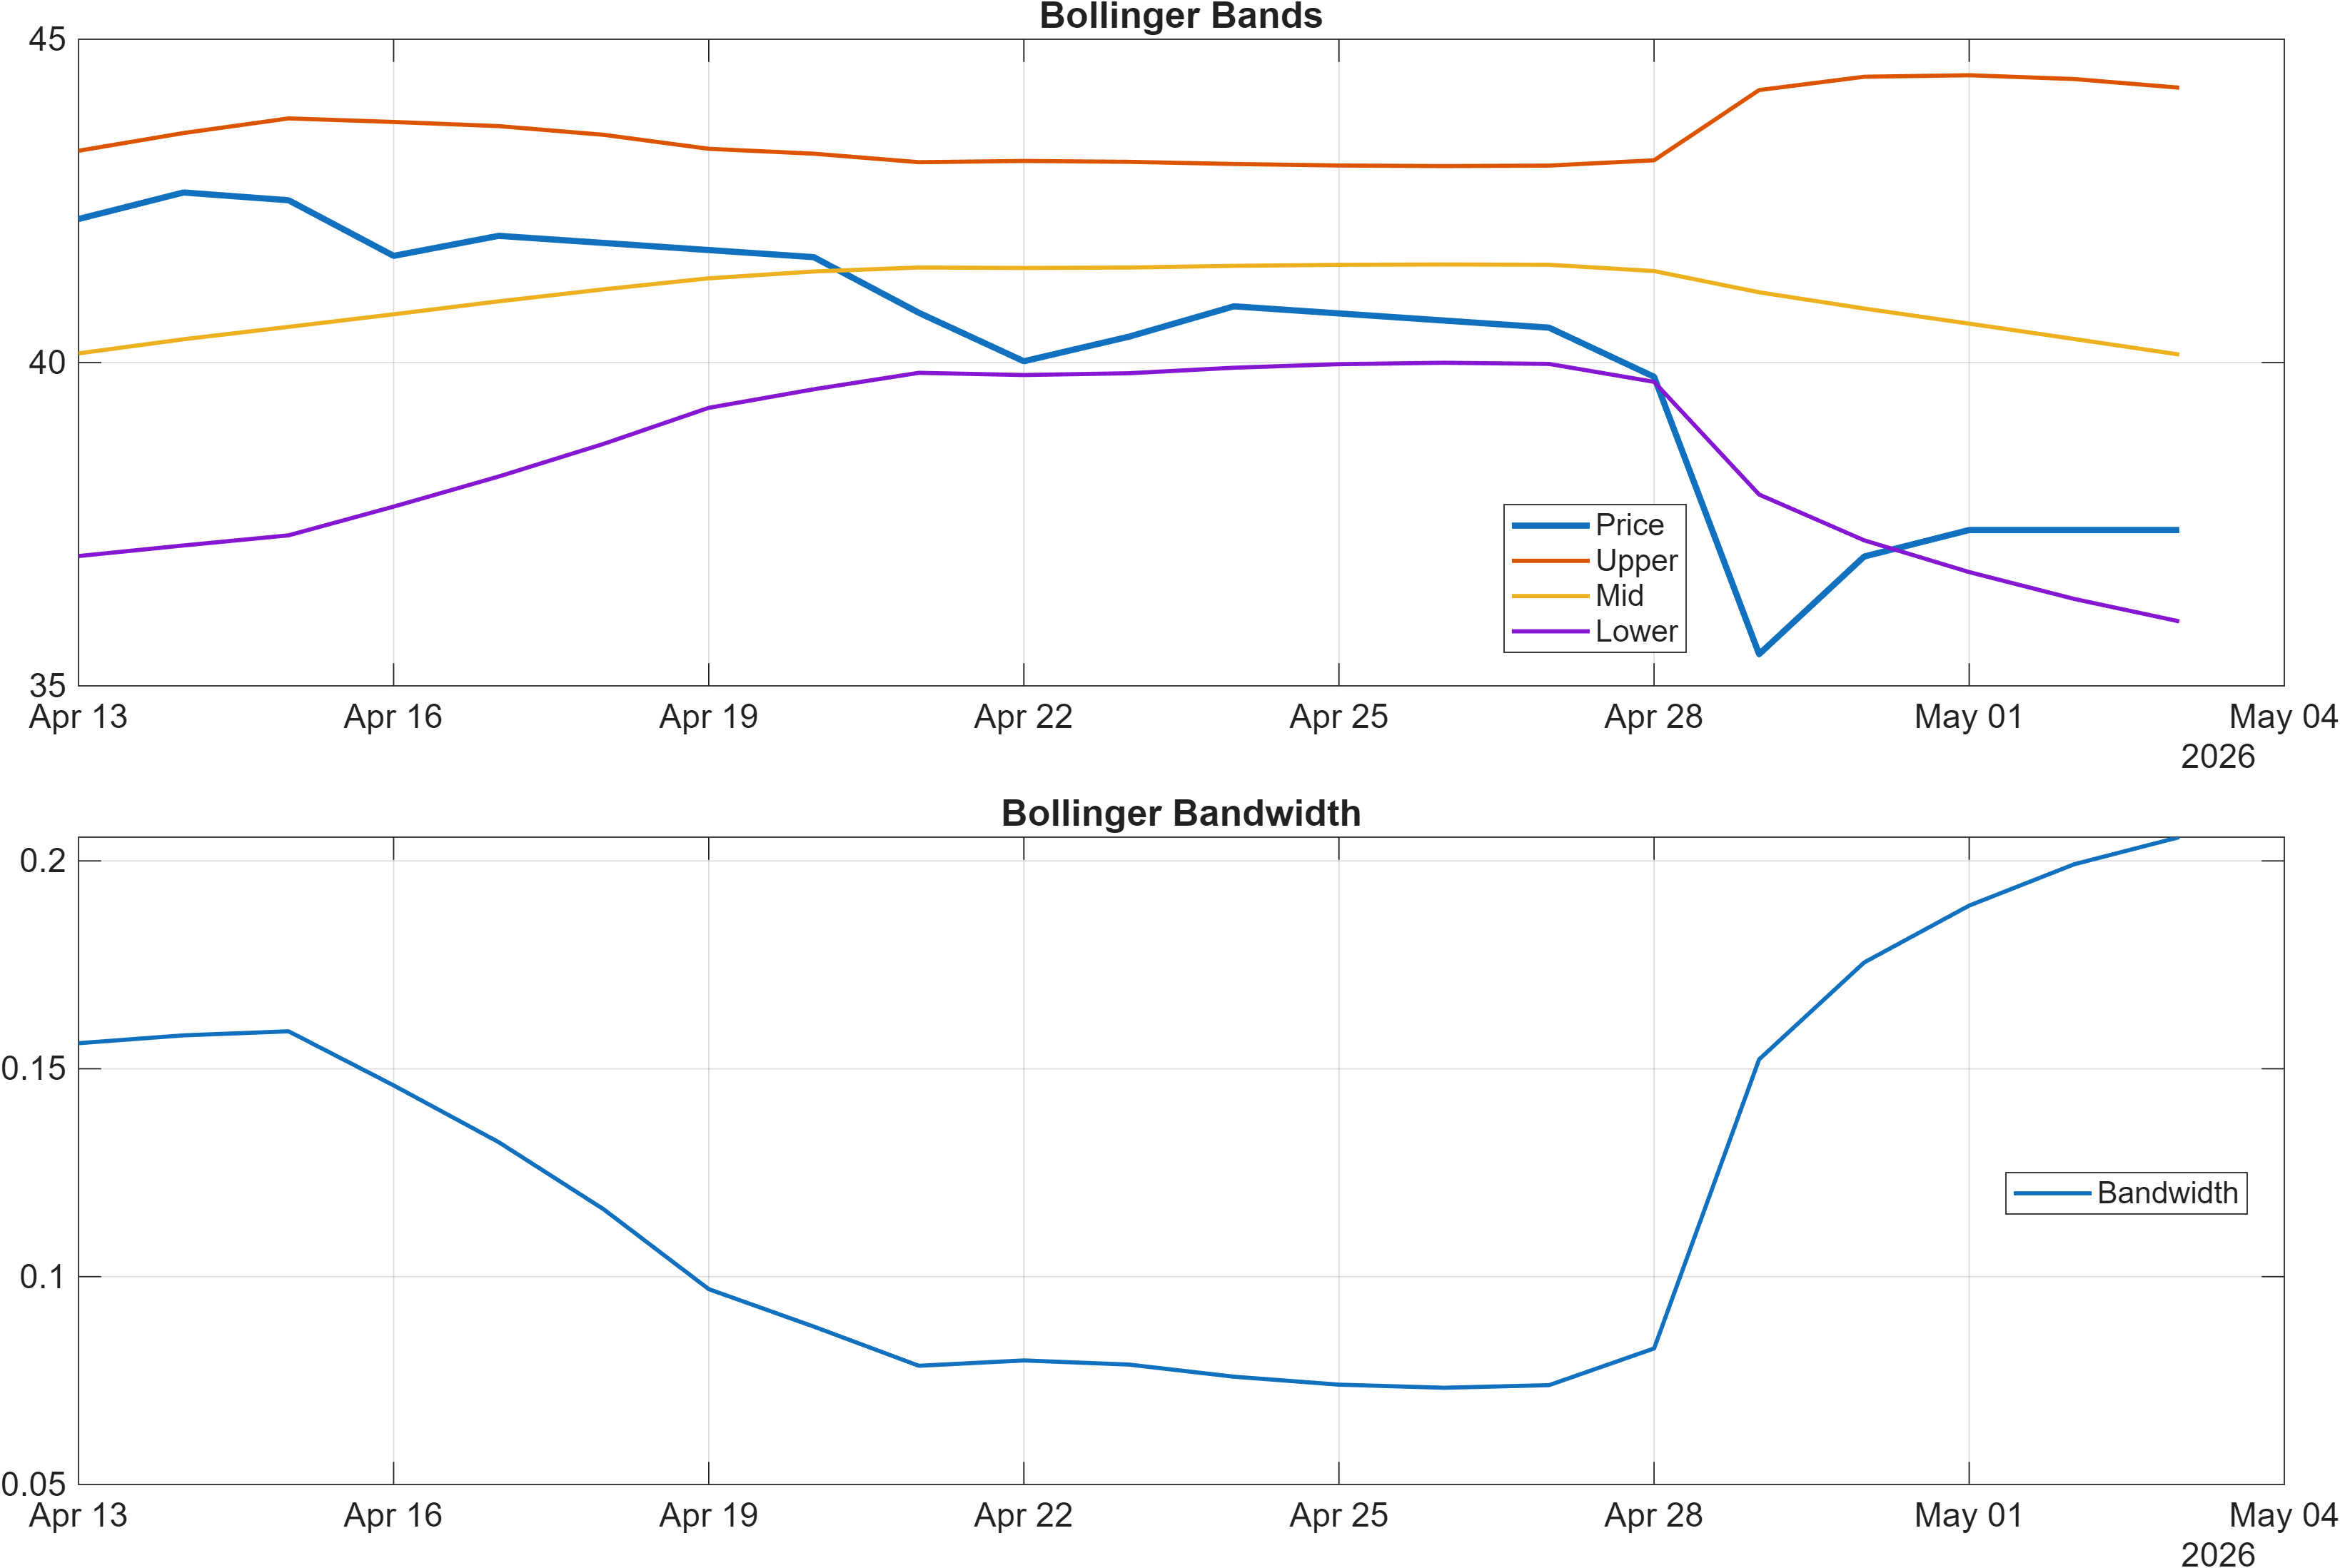
Volatility conditions are not signaling a high-compression base. Bollinger Bandwidth at 0.2057 reads as a moderate regime rather than an extreme squeeze, suggesting that the market is not yet in a tight equilibrium state that typically precedes sharp breakouts. In other words, weakness is being expressed through momentum deterioration more than through volatility contraction.
The internal consistency between RSI and MACD aligns with the moving-average trend read (both bearish), which helps explain why the article’s title stance is “no strong confirmation yet.” For confirmation to improve, the first tell is usually a reduction in downside momentum (MACD histogram moving toward zero) alongside RSI recovering from depressed readings—without needing immediate trend reversal in the MA stack.
Until that occurs, momentum remains a near-term headwind even if cross-sectional ranks (such as the 3-Monthly rank #21) continue to look favorable relative to peers.
4) Support / Resistance zones
Support ~ 37.4825 | Resistance ~ 47.4675
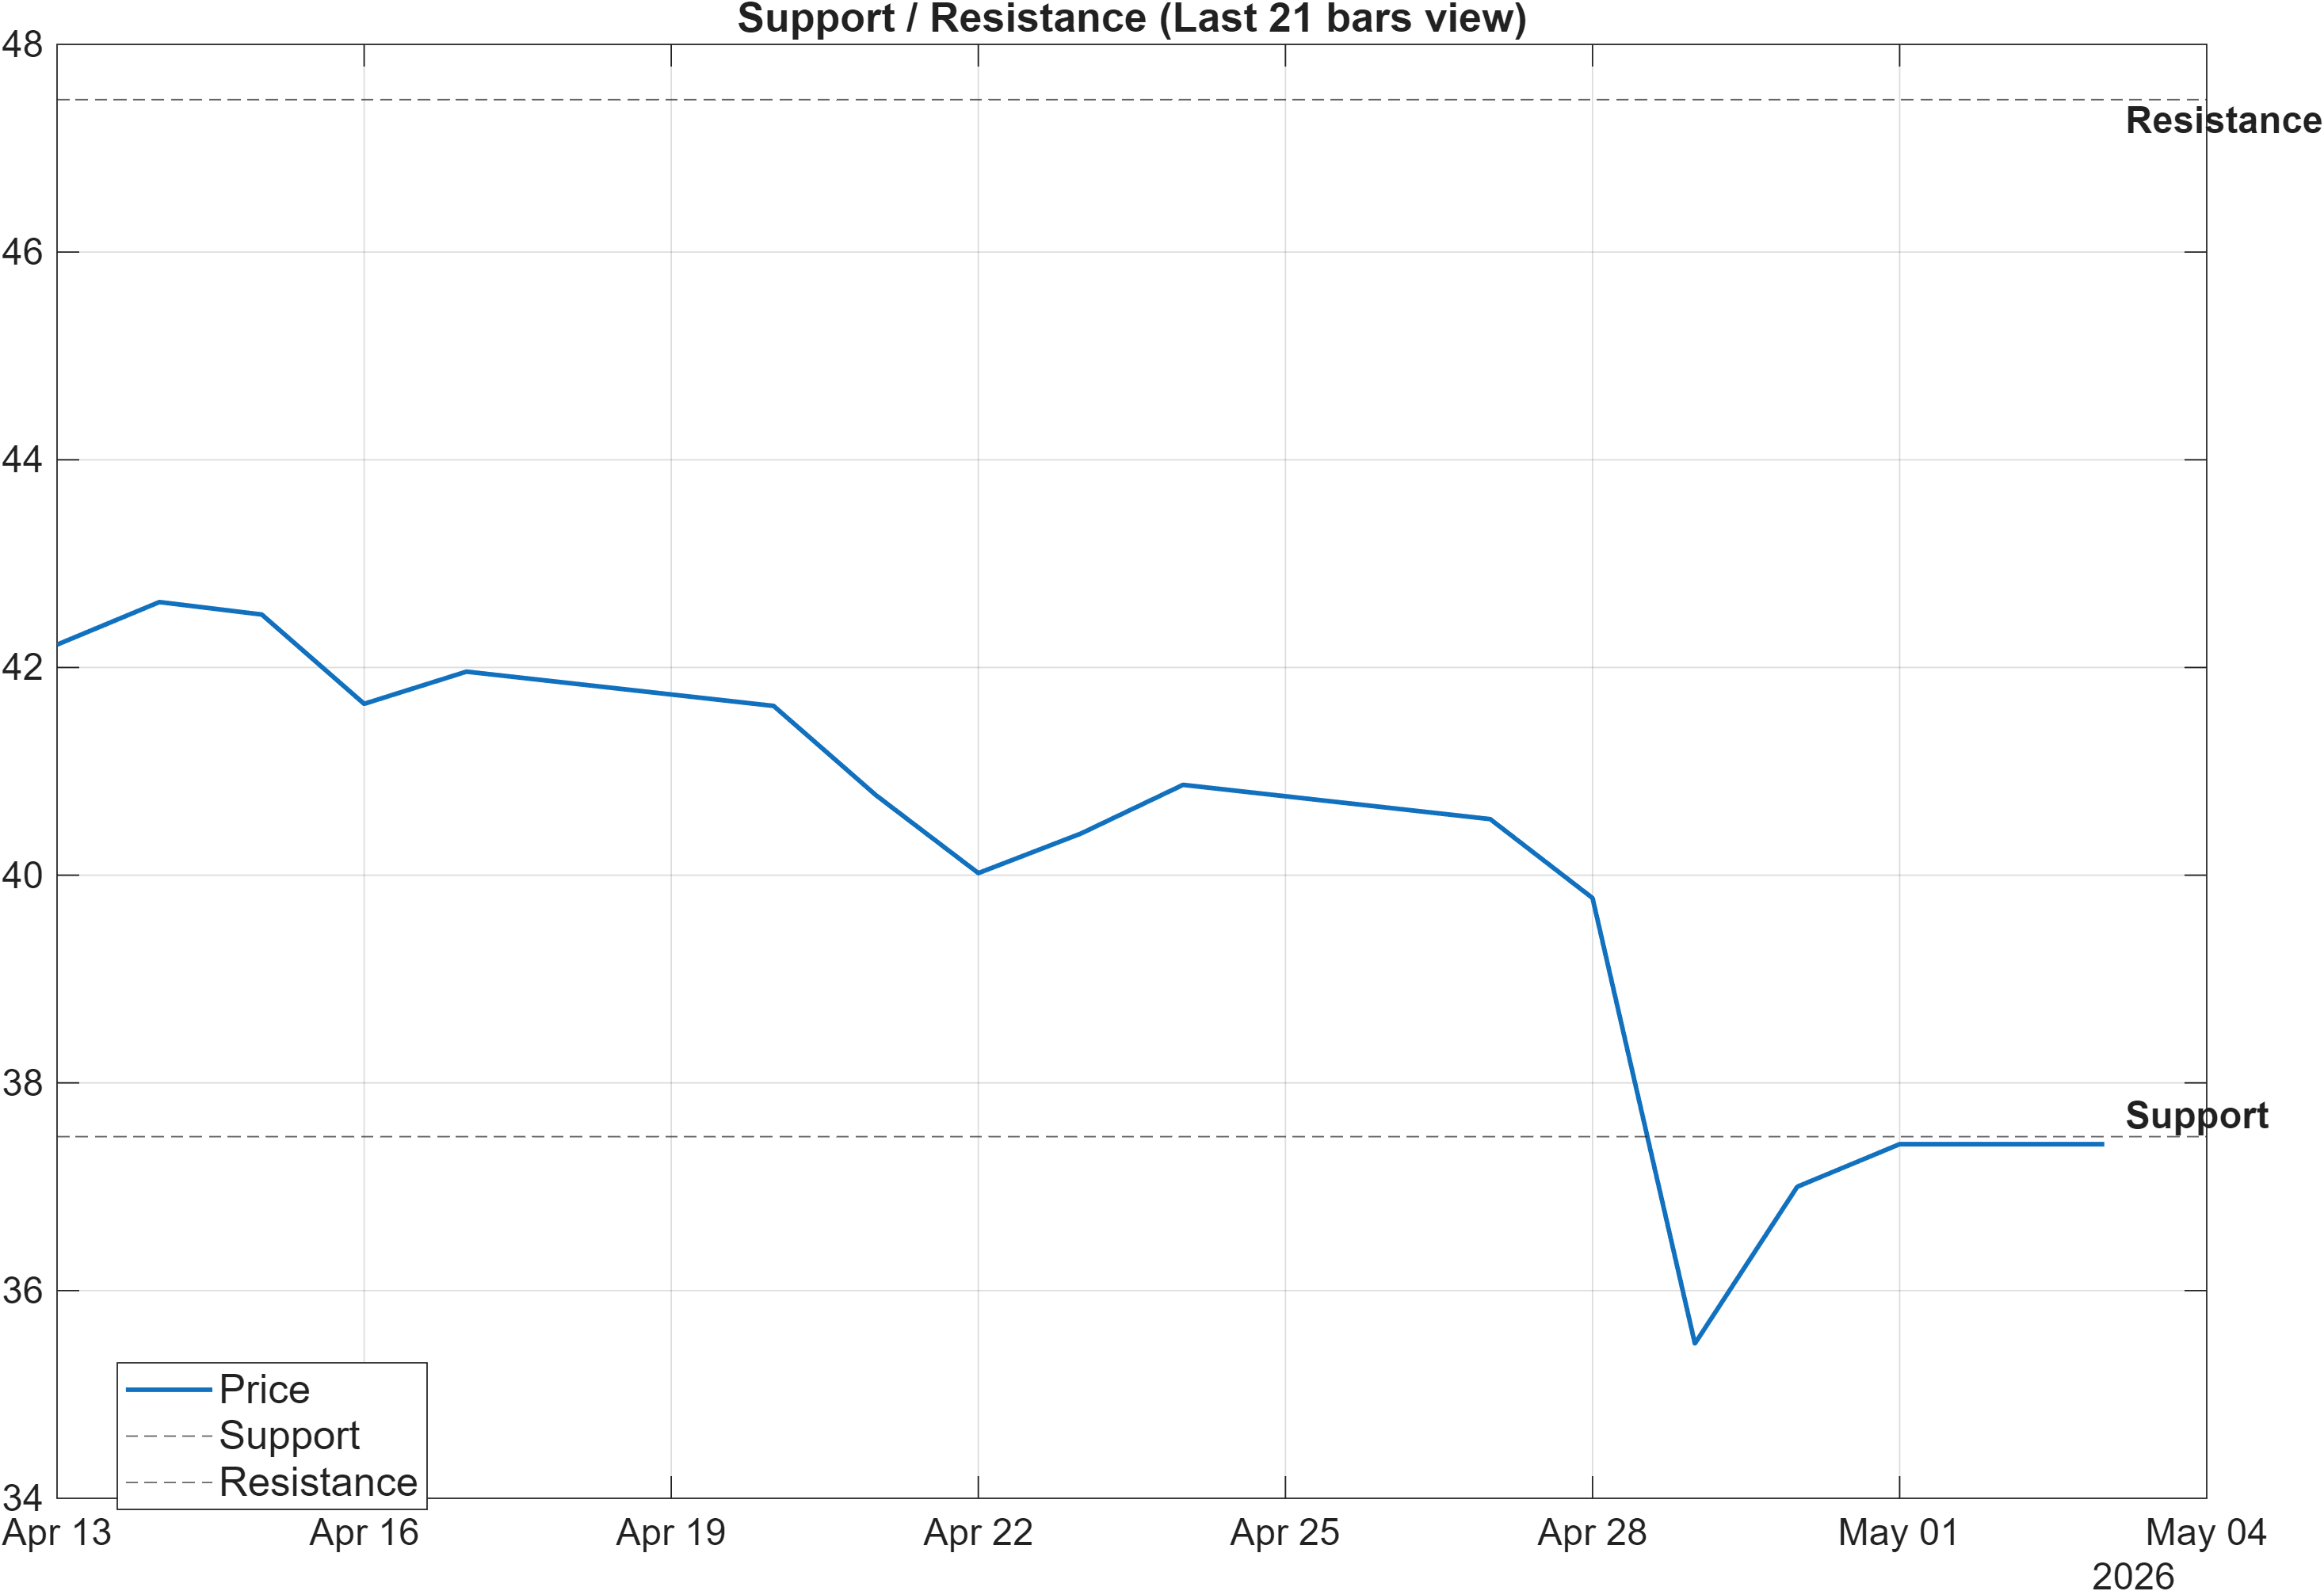
The support/resistance structure frames the current regime as decision-zone trading rather than a clean trend. With support at 37.4825, the market has a defined level where prior demand is expected to be more active; with resistance at 47.4675, overhead supply is the zone most likely to challenge upside attempts. These zones also contextualize the momentum weakness: an RSI(14) of 28.06 is consistent with price probing closer to support than resistance in many market environments.
The scenario language in the draft is appropriately conditional: a break above resistance with volume → continuation, while a close below support → signal deterioration risk. The emphasis on volume is consistent with the platform’s broader approach: directional breaks that are not accompanied by participation often fail, especially when the moving-average stack remains bearish.
The wide span between 37.4825 and 47.4675 also matters for interpreting ranks. A strong medium-term rank (e.g., 3-Monthly #21) can coexist with short-term weakness if the market is cycling within a broader band, producing relative strength versus peers without providing a clean, trend-following entry template.
From a market-structure standpoint, the higher-quality confirmation typically arrives when price can hold above prior decision levels while momentum indicators (MACD histogram currently -0.3647) transition from downside impulse toward stabilization.
5) Quant Technical Dashboard (18 Signals)
KGNAI AI Technical Analysis Score (Deep Reinforcement Learning): Rank #717 out of 2056 (Rank 1 represents the strongest technical positioning and a higher probability of favorable price behavior. As ranks increase toward the maximum, the probability of favorable outcomes weakens and bearish positioning becomes more dominant.) | Label: Neutral | Score: 0.303
18-Signal Technical Confluence Score: -0.333 (Bearish)
Overall Technical Score (18-signal confluence + DRL rank blend): -0.143 (Neutral)
Note: The blended score reflects signal strength weighted against broader AI technical ranking, which may temporarily diverge.
Blended technical score breakdown: -0.143 (Neutral | Bull 4 / Bear 10 / Neutral 4)
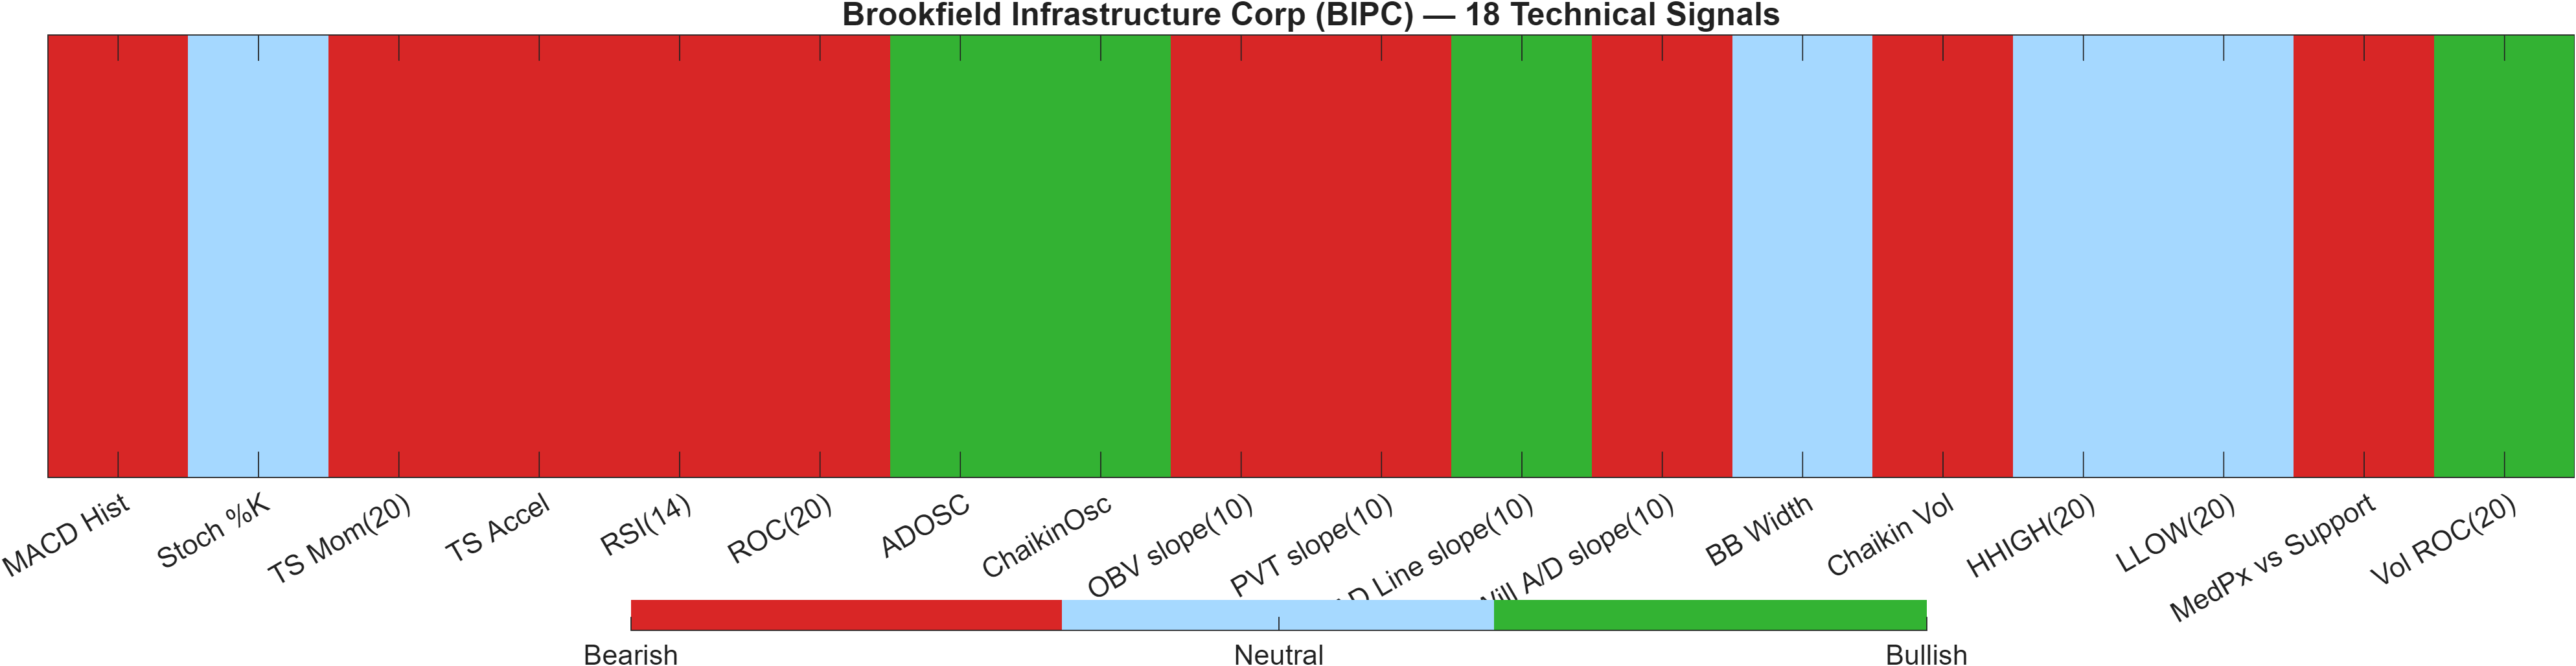
The dashboard highlights a blend divergence: the 18-signal confluence score of -0.333 is labeled Bearish, yet the overall blended technical score of -0.143 is Neutral due to the DRL technical rank overlay (#717/2056, score 0.303). When these layers diverge, it often means the indicator set is reacting quickly to recent price action, while the broader AI technical rank is less reactive and still detecting offsets in the wider pattern.
The underlying composition supports that interpretation: the blended breakdown shows Bear 10 versus Bull 4, which is consistent with the negative momentum signals already visible in the RSI and MACD. In the signal table, RSI(14) = 28.06 and MACD Hist = -0.3647 contribute directly to the bearish skew, while the volatility read is more equivocal (e.g., BB Width = 0.2057 is Neutral), limiting the case for a volatility-driven inflection.
Signal table (Bull/Bear/Neutral)
| Indicator | Value | Signal |
|---|---|---|
| MACD Hist | -0.3647 | Bearish |
| Stoch %K | 43.83 | Neutral |
| TS Mom(20) | -5.22 | Bearish |
| TS Accel | -9.17 | Bearish |
| RSI(14) | 28.06 | Bearish |
| ROC(20) | -12.24 | Bearish |
| ADOSC | 60.63 | Bullish |
| ChaikinOsc | 2.626e+05 | Bullish |
| OBV slope(10) | -4.274e+06 | Bearish |
| PVT slope(10) | -5.244e+05 | Bearish |
| AD Line slope(10) | 4.677e+05 | Bullish |
| Will A/D slope(10) | -4.36 | Bearish |
| BB Width | 0.2057 | Neutral |
| Chaikin Vol | 74.44 | Bearish |
| HHIGH(20) | 42.87 | Neutral |
| LLOW(20) | 34.18 | Neutral |
| MedPx vs Support | -0.4175 | Bearish |
| Vol ROC(20) | 175.9 | Bullish |
Across signals, the most constructive offset is that some volume/accumulation measures are positive (e.g., ADOSC = 60.63 is Bullish), while price-momentum remains weak. That combination can sometimes occur when participation improves before price structure repairs—yet it is not, by itself, a confirmation without trend/momentum agreement.
6) News sentiment + extractive gist
Sentiment score (avg): 0.068 | Positive: 30% | Neutral: 60% | Negative: 10%
KGNAI AI News Sentiment Score (normalized -1 to +1): 1.00 (as of 2026-05-01) | Label: Bullish | Overall news score: 0.99
Positive Developments
Recent coverage across major financial outlets indicates a generally constructive narrative around Brookfield Infrastructure Corp (BIPC), centered on operational updates, analyst commentary, and results-related messaging. The aggregate distribution is tilted away from outright negativity, with 30% positive and only 10% negative items in the digest, while the average sentiment score of 0.068 suggests mild (not exuberant) optimism. Notably, the normalized model read is strong at 1.00 (with an overall news score of 0.99), implying that the tone and phrasing of coverage have recently clustered on the constructive side. From a market-structure standpoint, supportive news flow can help stabilize participation when technical momentum is weak (e.g., MACD histogram -0.3647), but it typically requires price confirmation near key levels to translate into durable trend improvement.
Neutral / Mixed Developments
The predominant bucket is still Neutral at 60%, which is consistent with informational corporate communications and event scheduling updates that do not, by themselves, reprice expectations. This mix can be favorable in one sense: it limits the probability that the market is reacting to a single shock catalyst. However, it also means technicals may remain the primary driver in the near term. With RSI(14) at 28.06 and the moving-average trend template still bearish, neutral coverage is unlikely to offset momentum unless accompanied by clearer evidence of stabilization. In this context, sentiment is best treated as a background condition rather than a standalone signal.
Negative / Risk Signals
The negative bucket is smaller (10%), but it introduces specific risk framing around reported results and distribution-related discussion. Even when the broader narrative is constructive, these items can amplify sensitivity around key technical zones—particularly if price revisits Support ~ 37.4825 while momentum remains weak. The current setup already reflects “no strong confirmation yet,” and negative angles can slow the transition from a Neutral blended technical state (-0.143) toward a more directional bullish regime. The practical risk is less about headline intensity and more about whether softer narratives coincide with failed attempts to reclaim trend markers (Close vs MA50 currently bearish).
- What to monitor next: Reaction quality if price approaches 47.4675 (resistance) versus another test of 37.4825 (support).
- What to monitor next: Whether momentum repairs (MACD histogram moving up from -0.3647; RSI recovering from 28.06) occur alongside improving participation.
- What to monitor next: Whether the medium-term rank strength (3-Monthly #21) persists if longer-horizon neutrality (6-Monthly #1437) remains unchanged.
Sources referenced: Reuters, Bloomberg, Yahoo Finance, MarketWatch, Investing.com
Snapshot: AI Rank (Short–Mid–Long): Mixed (Neutral–Bullish–Neutral) · Technical Confluence: Bearish · Key Levels: Support ~37.48 | Resistance ~47.47 · News Sentiment: Neutral
7) Sources
- Does Brookfield Infrastructure (BIPC) Dividends Still Reflect Strength After First-Quarter Loss And Lower Sales? — https://finance.yahoo.com/markets/stocks/articles/does-brookfield-infrastructure-bipc-dividends-201234358.html?.tsrc=rss
- Brookfield Infrastructure Reports Strong First Quarter 2026 Results — https://finance.yahoo.com/markets/stocks/articles/brookfield-infrastructure-reports-strong-first-105900426.html?.tsrc=rss
- Brookfield Infrastructure to Host First Quarter 2026 Results Conference Call — https://finance.yahoo.com/markets/stocks/articles/brookfield-infrastructure-host-first-quarter-110000886.html?.tsrc=rss
- Brookfield Infrastructure Completes Annual Filings — https://finance.yahoo.com/news/brookfield-infrastructure-completes-annual-filings-010800694.html?.tsrc=rss
- A Look At Brookfield Infrastructure (BIPC) Valuation After Recent Share Price Volatility — https://finance.yahoo.com/news/look-brookfield-infrastructure-bipc-valuation-070946332.html?.tsrc=rss
- BMO Lifts Brookfield Infrastructure Corporation (BIPC) Price Target to $44 on Growth Outlook — https://finance.yahoo.com/news/bmo-lifts-brookfield-infrastructure-corporation-122207083.html?.tsrc=rss
- The Under-the-Radar AI Infrastructure Stock You Won't Want to Miss — https://www.fool.com/investing/2026/02/03/the-under-the-radar-ai-infrastructure-stock-you-wo/?.tsrc=rss
- Brookfield Infrastructure Leans Into AI Assets As Valuation Signals Mixed — https://finance.yahoo.com/news/brookfield-infrastructure-leans-ai-assets-190540770.html?.tsrc=rss
You may also like: How KGNAI AI ranks instruments across global markets
Disclaimer: KGNAI provides AI-generated analytics and educational market commentary only. This is not financial advice. Markets involve risk. Always do your own research.