
DNOW (Now Inc) Technical & Sentiment Review — 06-May-2026 | Weak Cross-Horizon Alignment
DNOW (Now Inc) presents a split profile as of 06-May-2026: short-horizon ranks remain Neutral while mid-to-long horizons skew Bearish, suggesting the broader cross-sectional backdrop has not rebuilt constructive persistence. At the same time, the technical dashboard leans Bullish, with a positive 18-signal confluence and a Bullish blended technical score despite a middling AI technical rank. This combination typically reflects near-term momentum/participation improving inside a weaker longer-horizon regime. Key decision zones are clearly defined around support ~11.1400 and resistance ~13.5117, which matter because they frame whether the recent signal strength converts into trend continuation or fails into a mean-reversion move. News sentiment inputs are constructive at the model level, but the mix of coverage still reads more context-driven than thesis-defining.
- Rank stance: Short-term Neutral | Mid-term Bearish | Long-term Bearish
- Technical confluence: Bullish (18-signal confluence score 0.611; overall technical score 0.383)
- Key levels: Support ~11.1400 | Resistance ~13.5117
- News sentiment bias: Model-normalized news sentiment Bullish (score 1.00 as of 2026-05-05), while the headline mix remains broadly Neutral
- Confirmation / invalidation: A break above 13.5117 with volume supports continuation; a close below 11.1400 increases deterioration risk.
KGNAI evaluates assets using large cross-sectional datasets built from millions of structured data points. Inputs incorporate fundamental metrics, technical structures, and systematically processed news sentiment. Statistical models, machine learning, and AI frameworks are used to assess relative positioning, signal alignment, and probabilistic behavior across broad universes.
- Ranks are comparative across the tracked universe, not absolute price targets.
- Confluence reflects alignment among independent signal groups.
- Support/resistance levels are probabilistic decision zones, not guarantees.
- Sentiment provides contextual bias within the broader analytical framework.
1) KGNAI AI Analysis
Region: USA
Total universe size: 2056 ranked instruments
- Daily rank: #1422 out of 2056 — Neutral
- Weekly rank: #1644 out of 2056 — Neutral
- Monthly rank: #1955 out of 2056 — Bearish
- 3-Monthly rank: #1883 out of 2056 — Bearish
- 6-Monthly rank: #1726 out of 2056 — Bearish
- Yearly rank: #1707 out of 2056 — Bearish
DNOW’s cross-sectional profile shows timeframe asymmetry: the daily rank (#1422) and weekly rank (#1644) sit in the weaker half of the universe but are labeled Neutral, while the longer windows shift materially into Bearish territory. The monthly rank (#1955) and 3-month rank (#1883) sit deep in the lower tail of the 2056-instrument universe, consistent with a regime where longer-horizon relative behavior remains challenged even if short-run pricing has stabilized.
This matters because KGNAI ranks are designed as a probabilistic filter: when shorter horizons improve without confirmation from the 6-month and yearly frames (here, #1726 and #1707), it often implies that recent strength may be situational rather than persistent. In that configuration, the bar for continuation typically shifts from “signals turned up” to “signals stay up,” especially when the longer windows still signal weaker comparative positioning across the broader universe.
The stated term view remains consistent with the rank ladder: Short-term Neutral but Mid-term and Long-term Bearish. From a workflow standpoint, this mix tends to prioritize risk-defined technical execution over broad directional conviction, because small changes in price structure around major levels can quickly flip the short-term picture while leaving the longer-term cross-sectional posture unchanged.
KGNAI ranks each instrument across large universes using multiple proprietary AI tests and statistical models (millions of data points). Lower ranks generally indicate stronger probability of favorable performance behavior, while higher ranks indicate weaker probability and more bearish positioning.
Term view: Short-term: Neutral. Mid-term: Bearish. Long-term: Bearish.
Want the full universe and complete rank tables? Unlock full access on KGNAI: https://www.kgnai.com/pricing
2) Price & trend overview
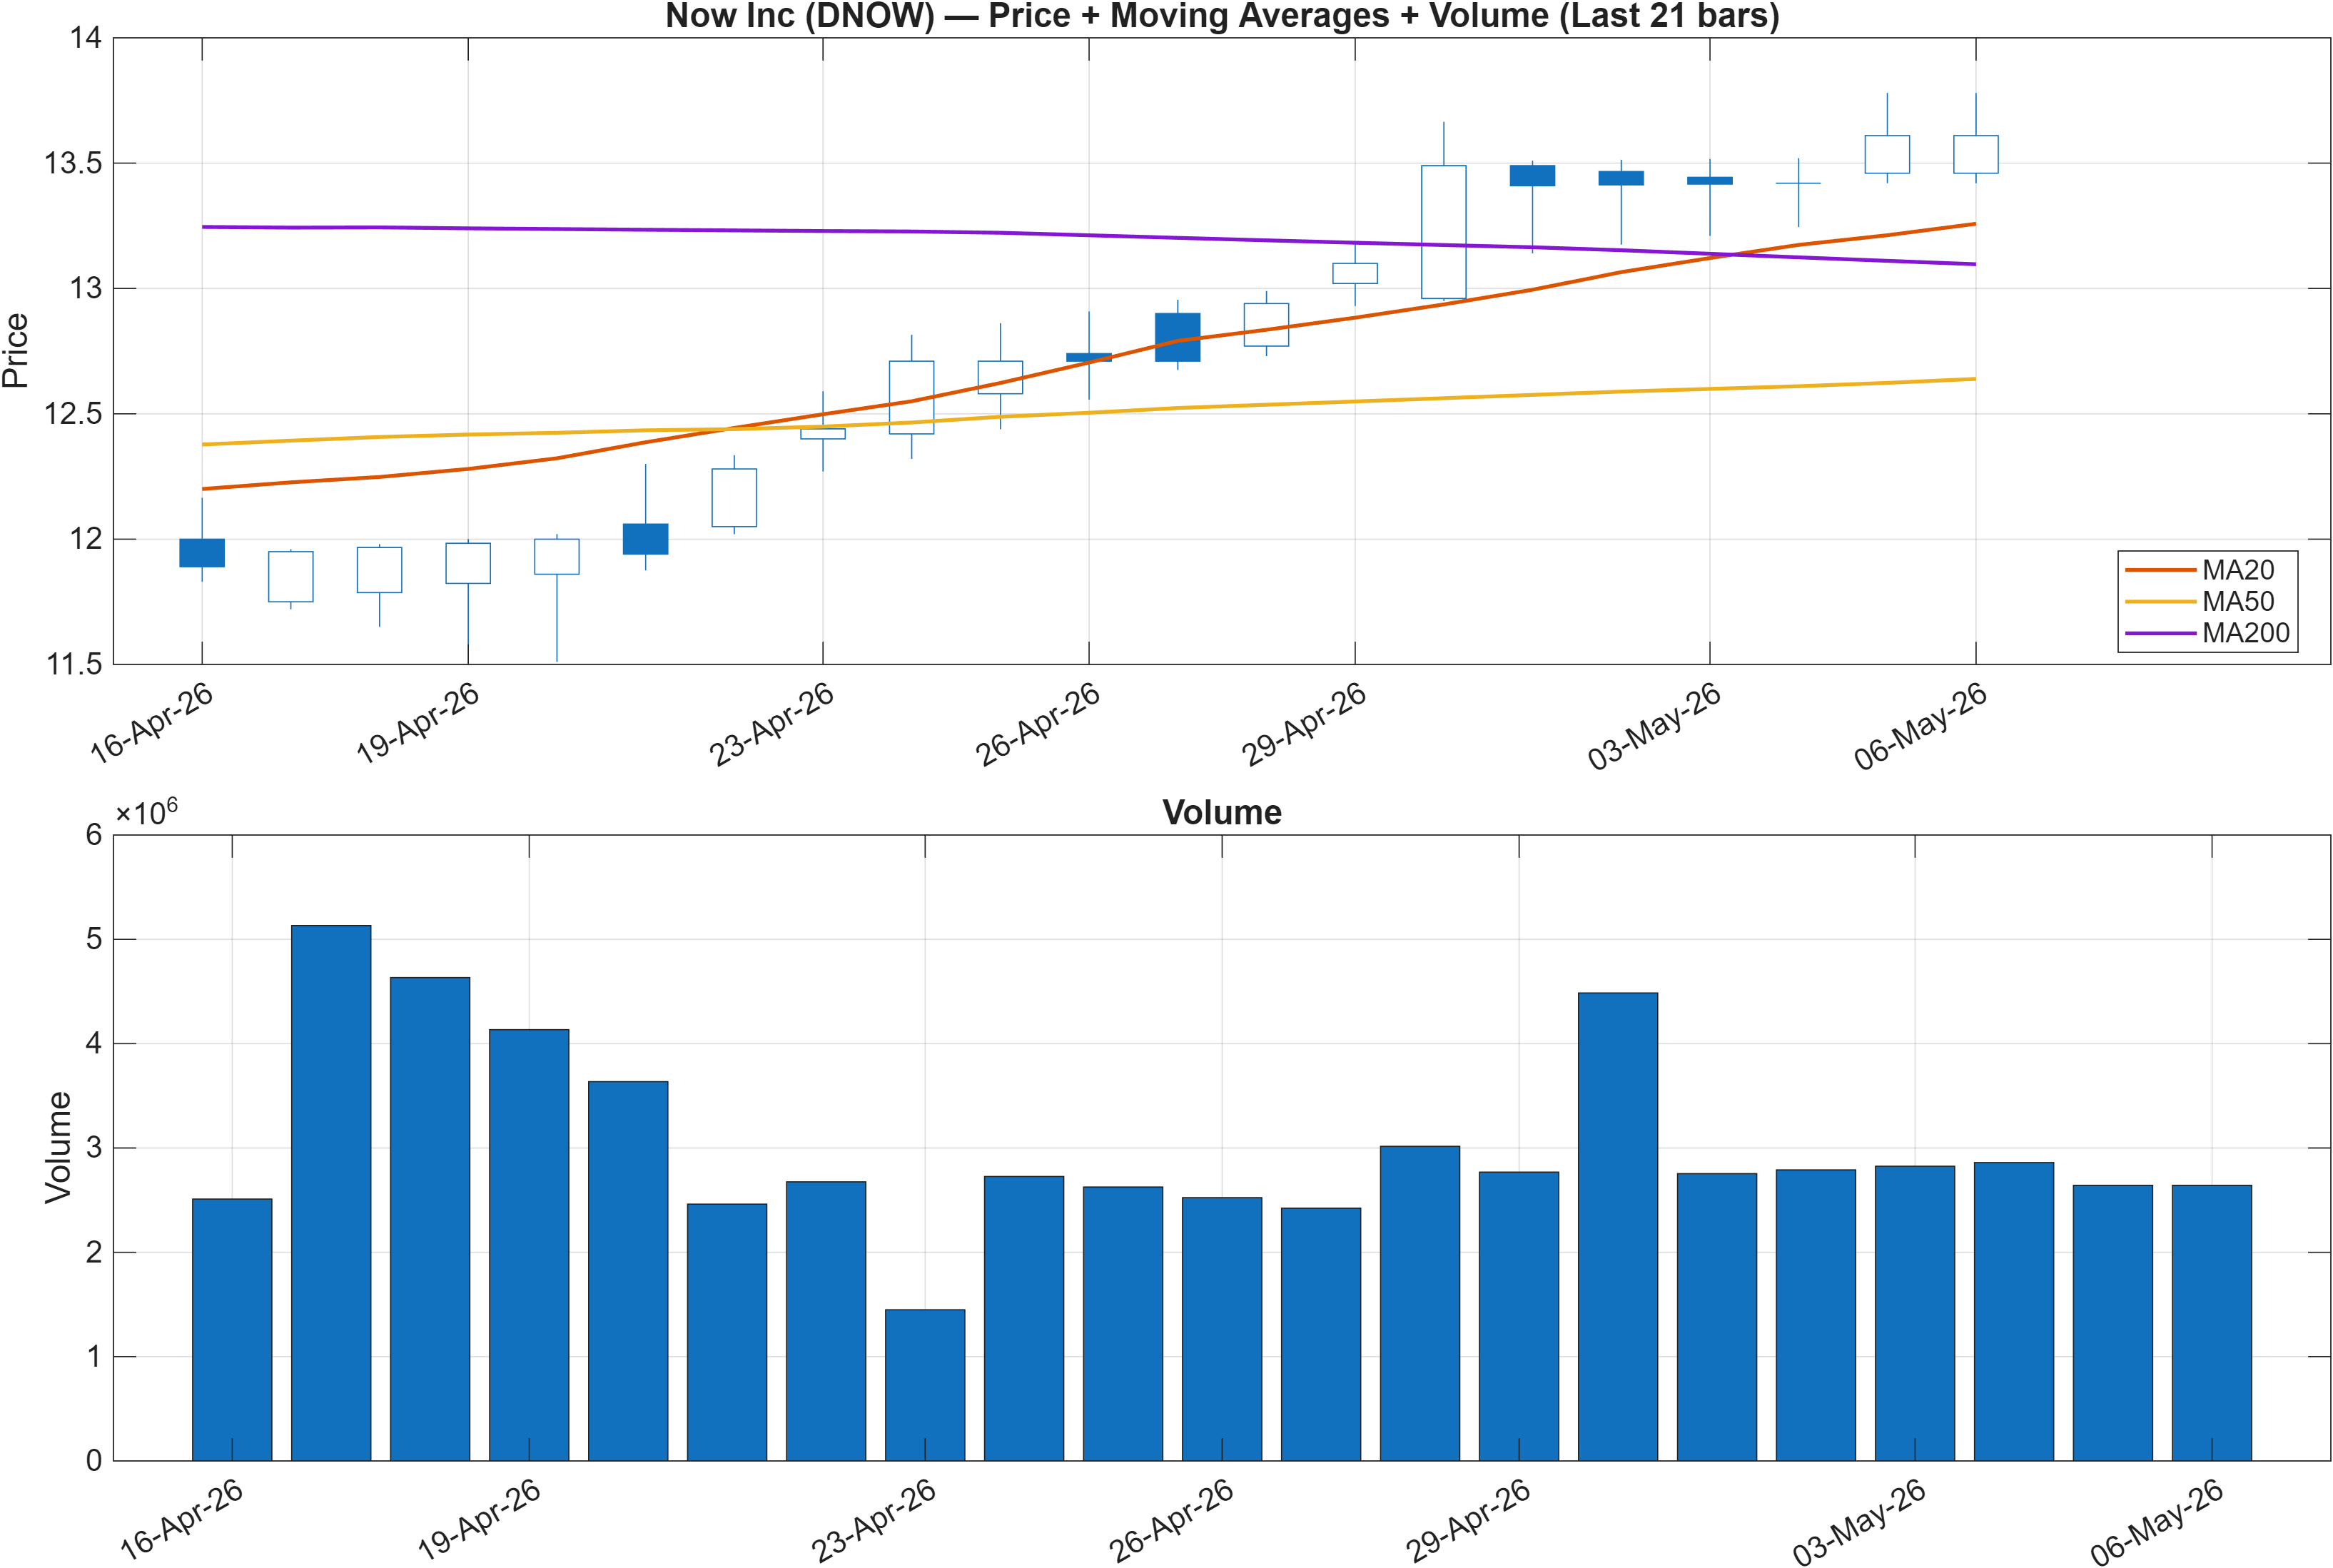
The moving-average mapping highlights a transitional tape rather than a clean trend state. The interpretation embedded in the chart framework—close vs MA50 = Bullish, while MA50 vs MA200 = Bearish—describes a common setup where price has improved enough to sit constructively relative to the intermediate trend, but the longer-term structure remains impaired. In practice, this can produce sharp, tradable swings while longer-horizon participants still treat rallies as tests rather than confirmations.
In that regime, the main question becomes persistence: can the market keep price supported above the intermediate trend line long enough to pressure the longer-term relationship? The rank stack adds context here: with the monthly and 3-month ranks still deep in Bearish territory (#1955 and #1883), the trend improvement implied by the MA50 relationship may be more consistent with a counter-trend recovery than a fully rehabilitated trend.
Volume is explicitly included in the figure, and the scenario language later in the report emphasizes “with volume” as the qualifier for continuation. That emphasis aligns with the idea that when MA relationships are split, follow-through requires participation—otherwise, the setup is vulnerable to fading. The next sections (RSI/MACD and bandwidth) help determine whether this is a momentum-driven extension or a move that is starting to lose incremental strength.
Interpretation: Close vs MA50 = Bullish, MA50 vs MA200 = Bearish.
3) Momentum & volatility dashboard
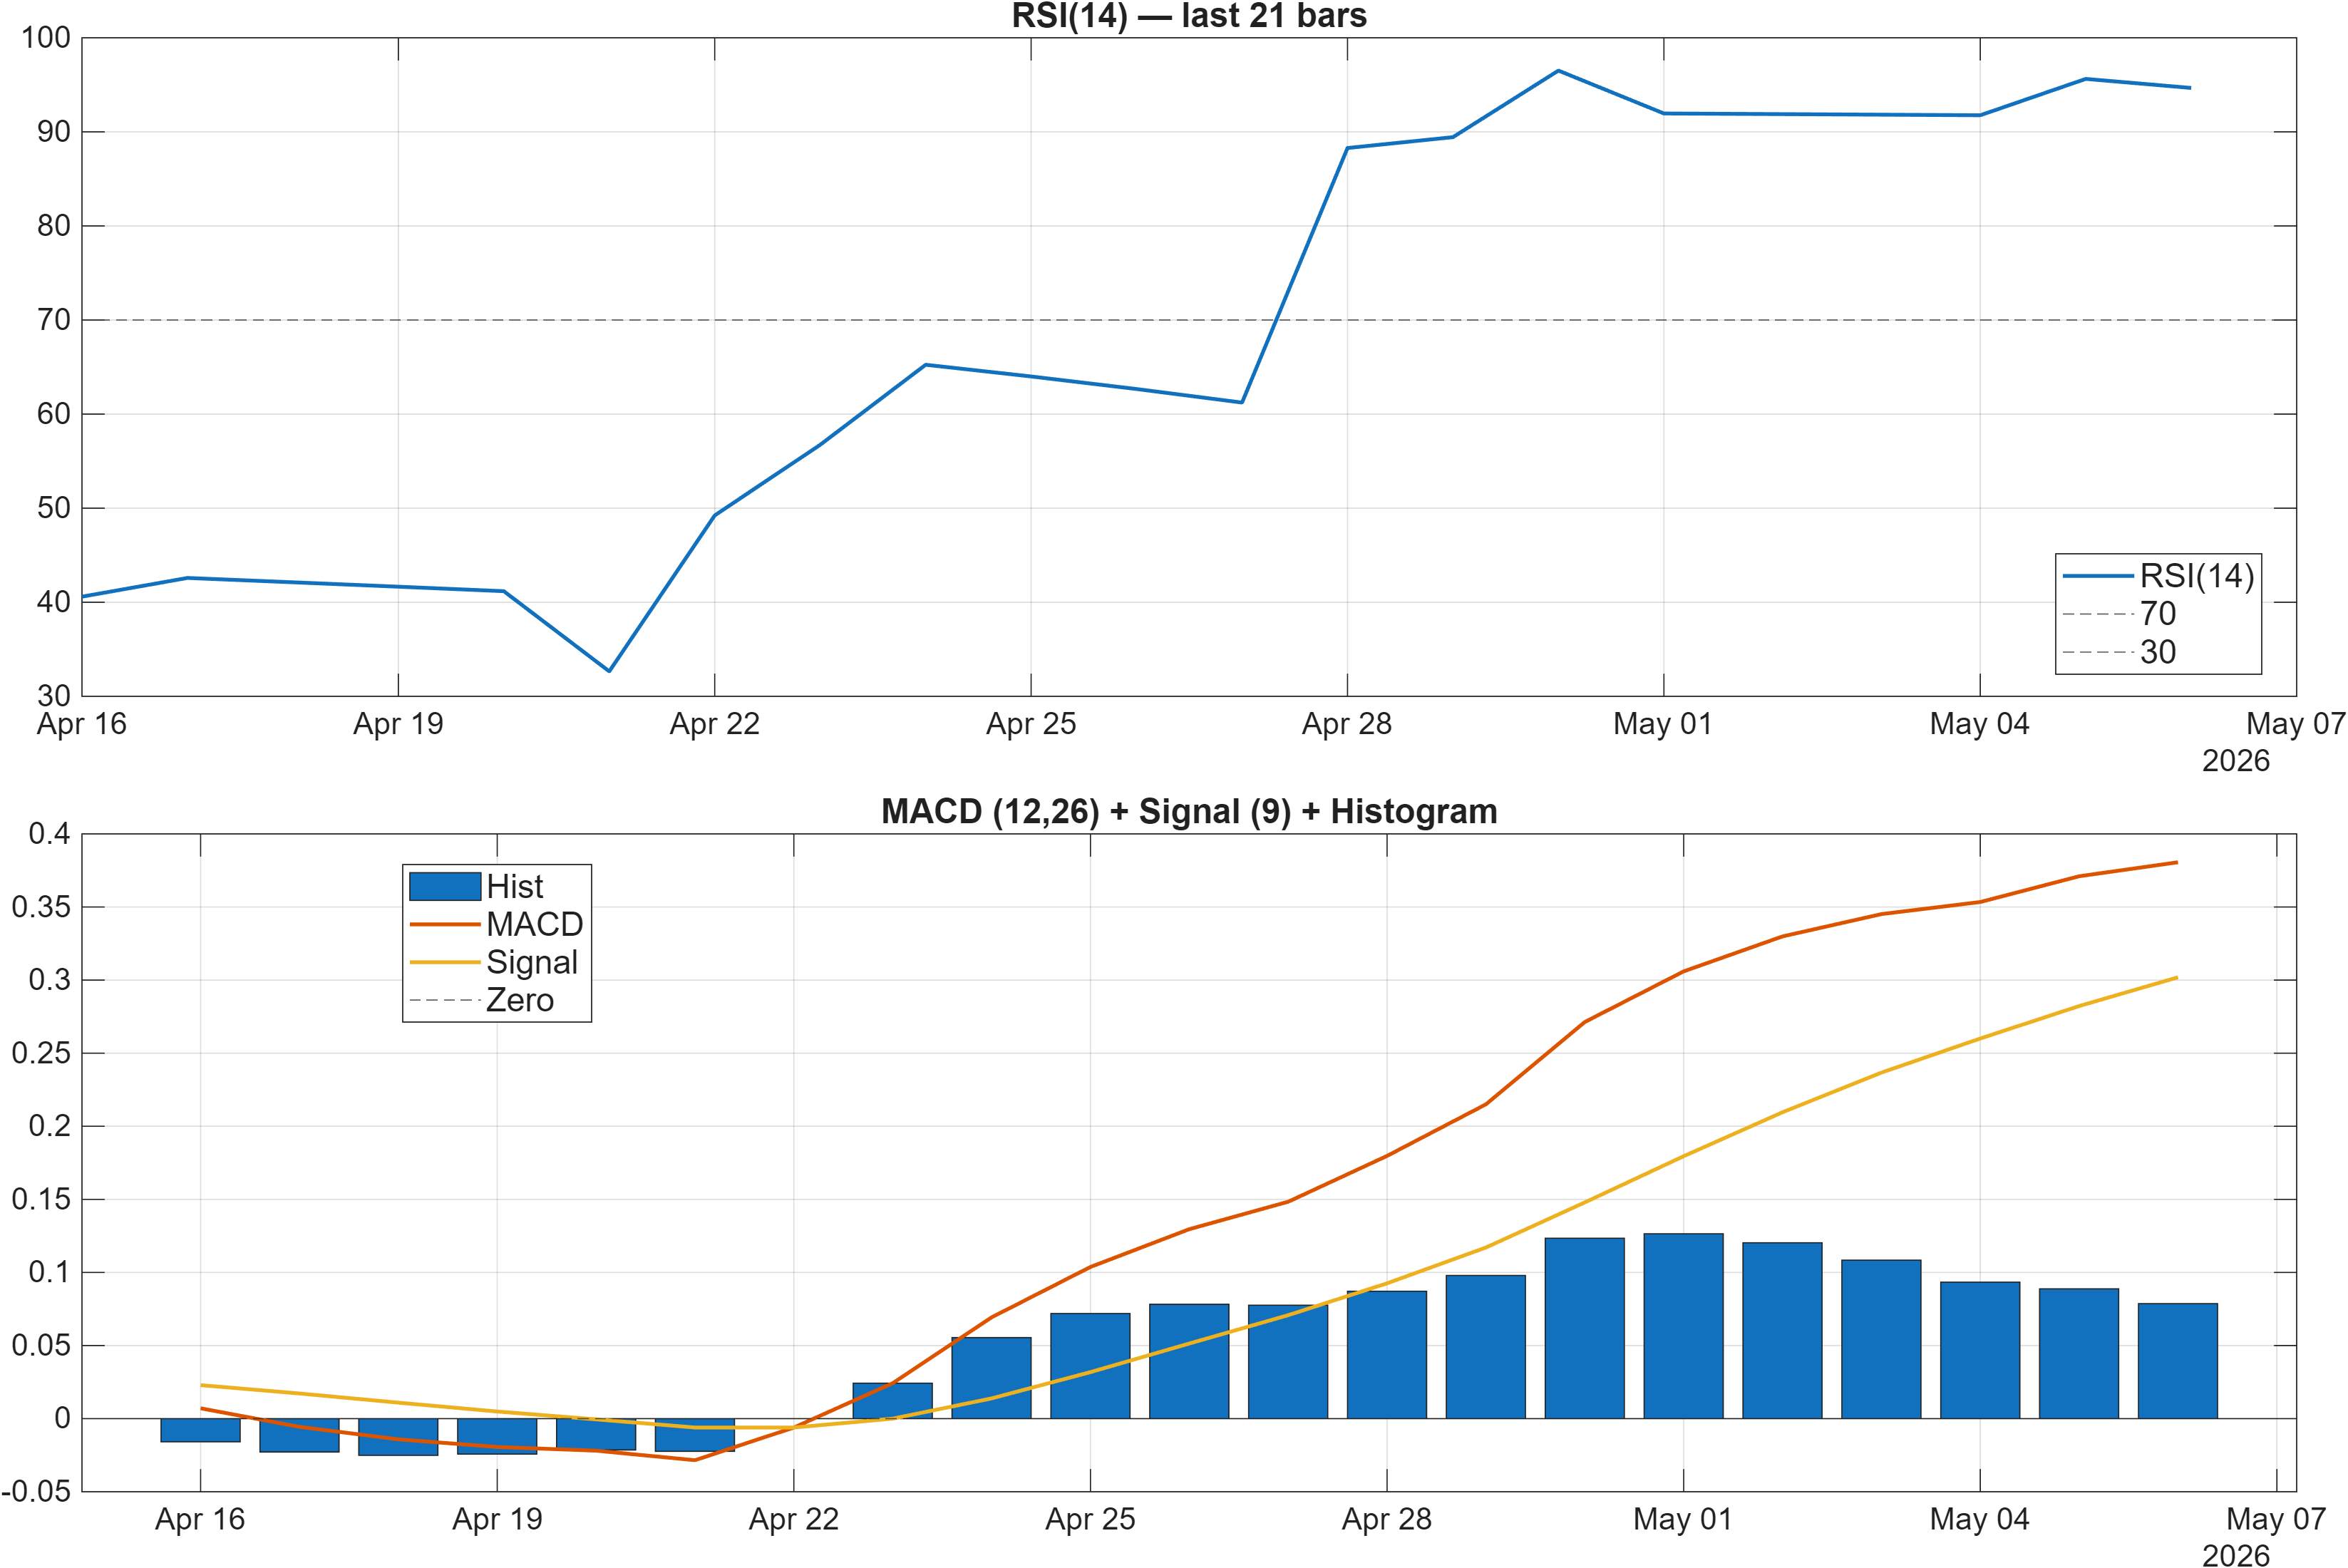
Momentum reads as strong but potentially late-cycle on the shorter horizon. The RSI component is labeled Bullish, and the signal table confirms RSI(14) at 94.67, a level that often appears during sharp advances or squeeze-like behavior. At the same time, MACD remains constructive with a positive histogram; the dashboard interpretation references MACD hist = 0.0787, consistent with positive impulse.
The key analytical nuance is that an elevated RSI does not automatically imply reversal; rather, it raises sensitivity to marginal changes in flow. This is reinforced by the signal table’s internal tension: while many momentum/acceleration measures are Bullish, Stoch %K is Bearish at 84.62, a configuration that can occur when upside momentum is strong but the very short-term oscillators begin to roll. That “fast oscillator vs broader momentum” split is one way markets signal cooling without breaking.
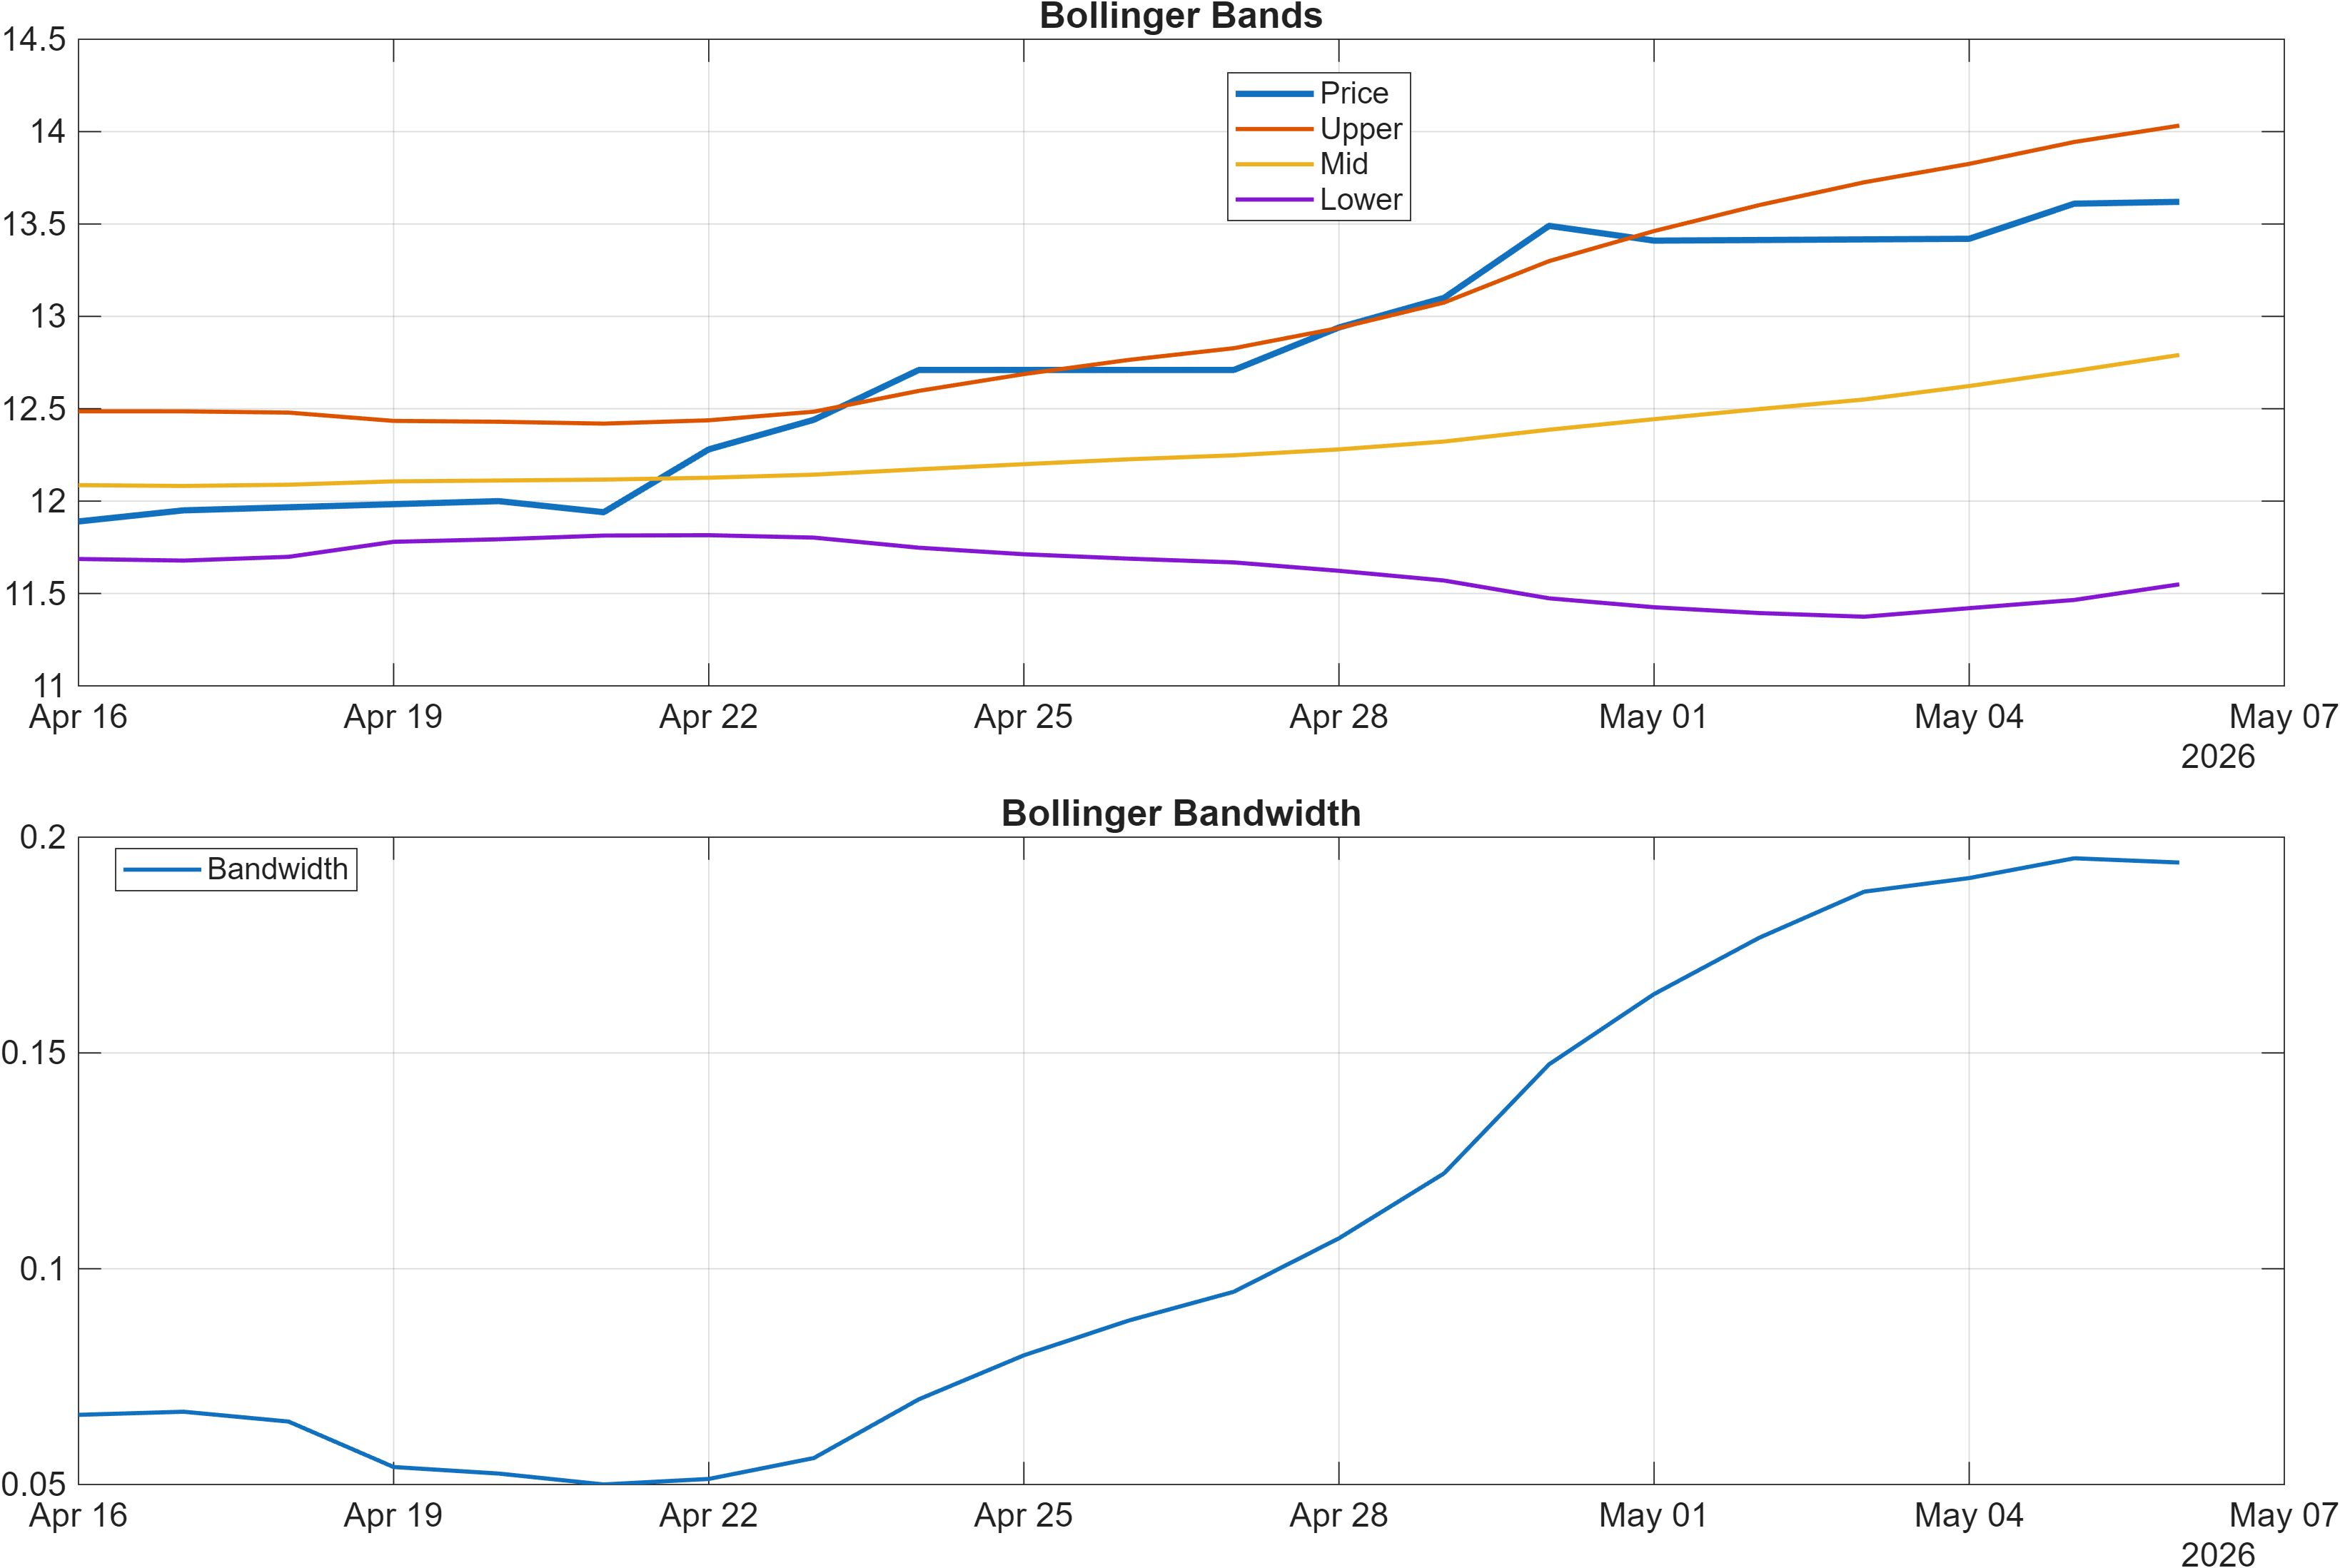
Volatility context is clearer in Bollinger metrics. The latest bandwidth is 0.1941, flagged as the current regime reading. In combination with strong momentum readings, a nontrivial bandwidth often corresponds to expanded dispersion, where pullbacks can be larger even if the trend remains intact. That makes the support/resistance section more than a formality: it becomes the operational map for determining whether momentum is absorbed into consolidation or rejected into breakdown.
Interpretation: RSI bias = Bullish, MACD hist = 0.0787.
Interpretation: Bandwidth (volatility regime) latest = 0.1941.
4) Support / Resistance zones
Support ~ 11.1400 | Resistance ~ 13.5117
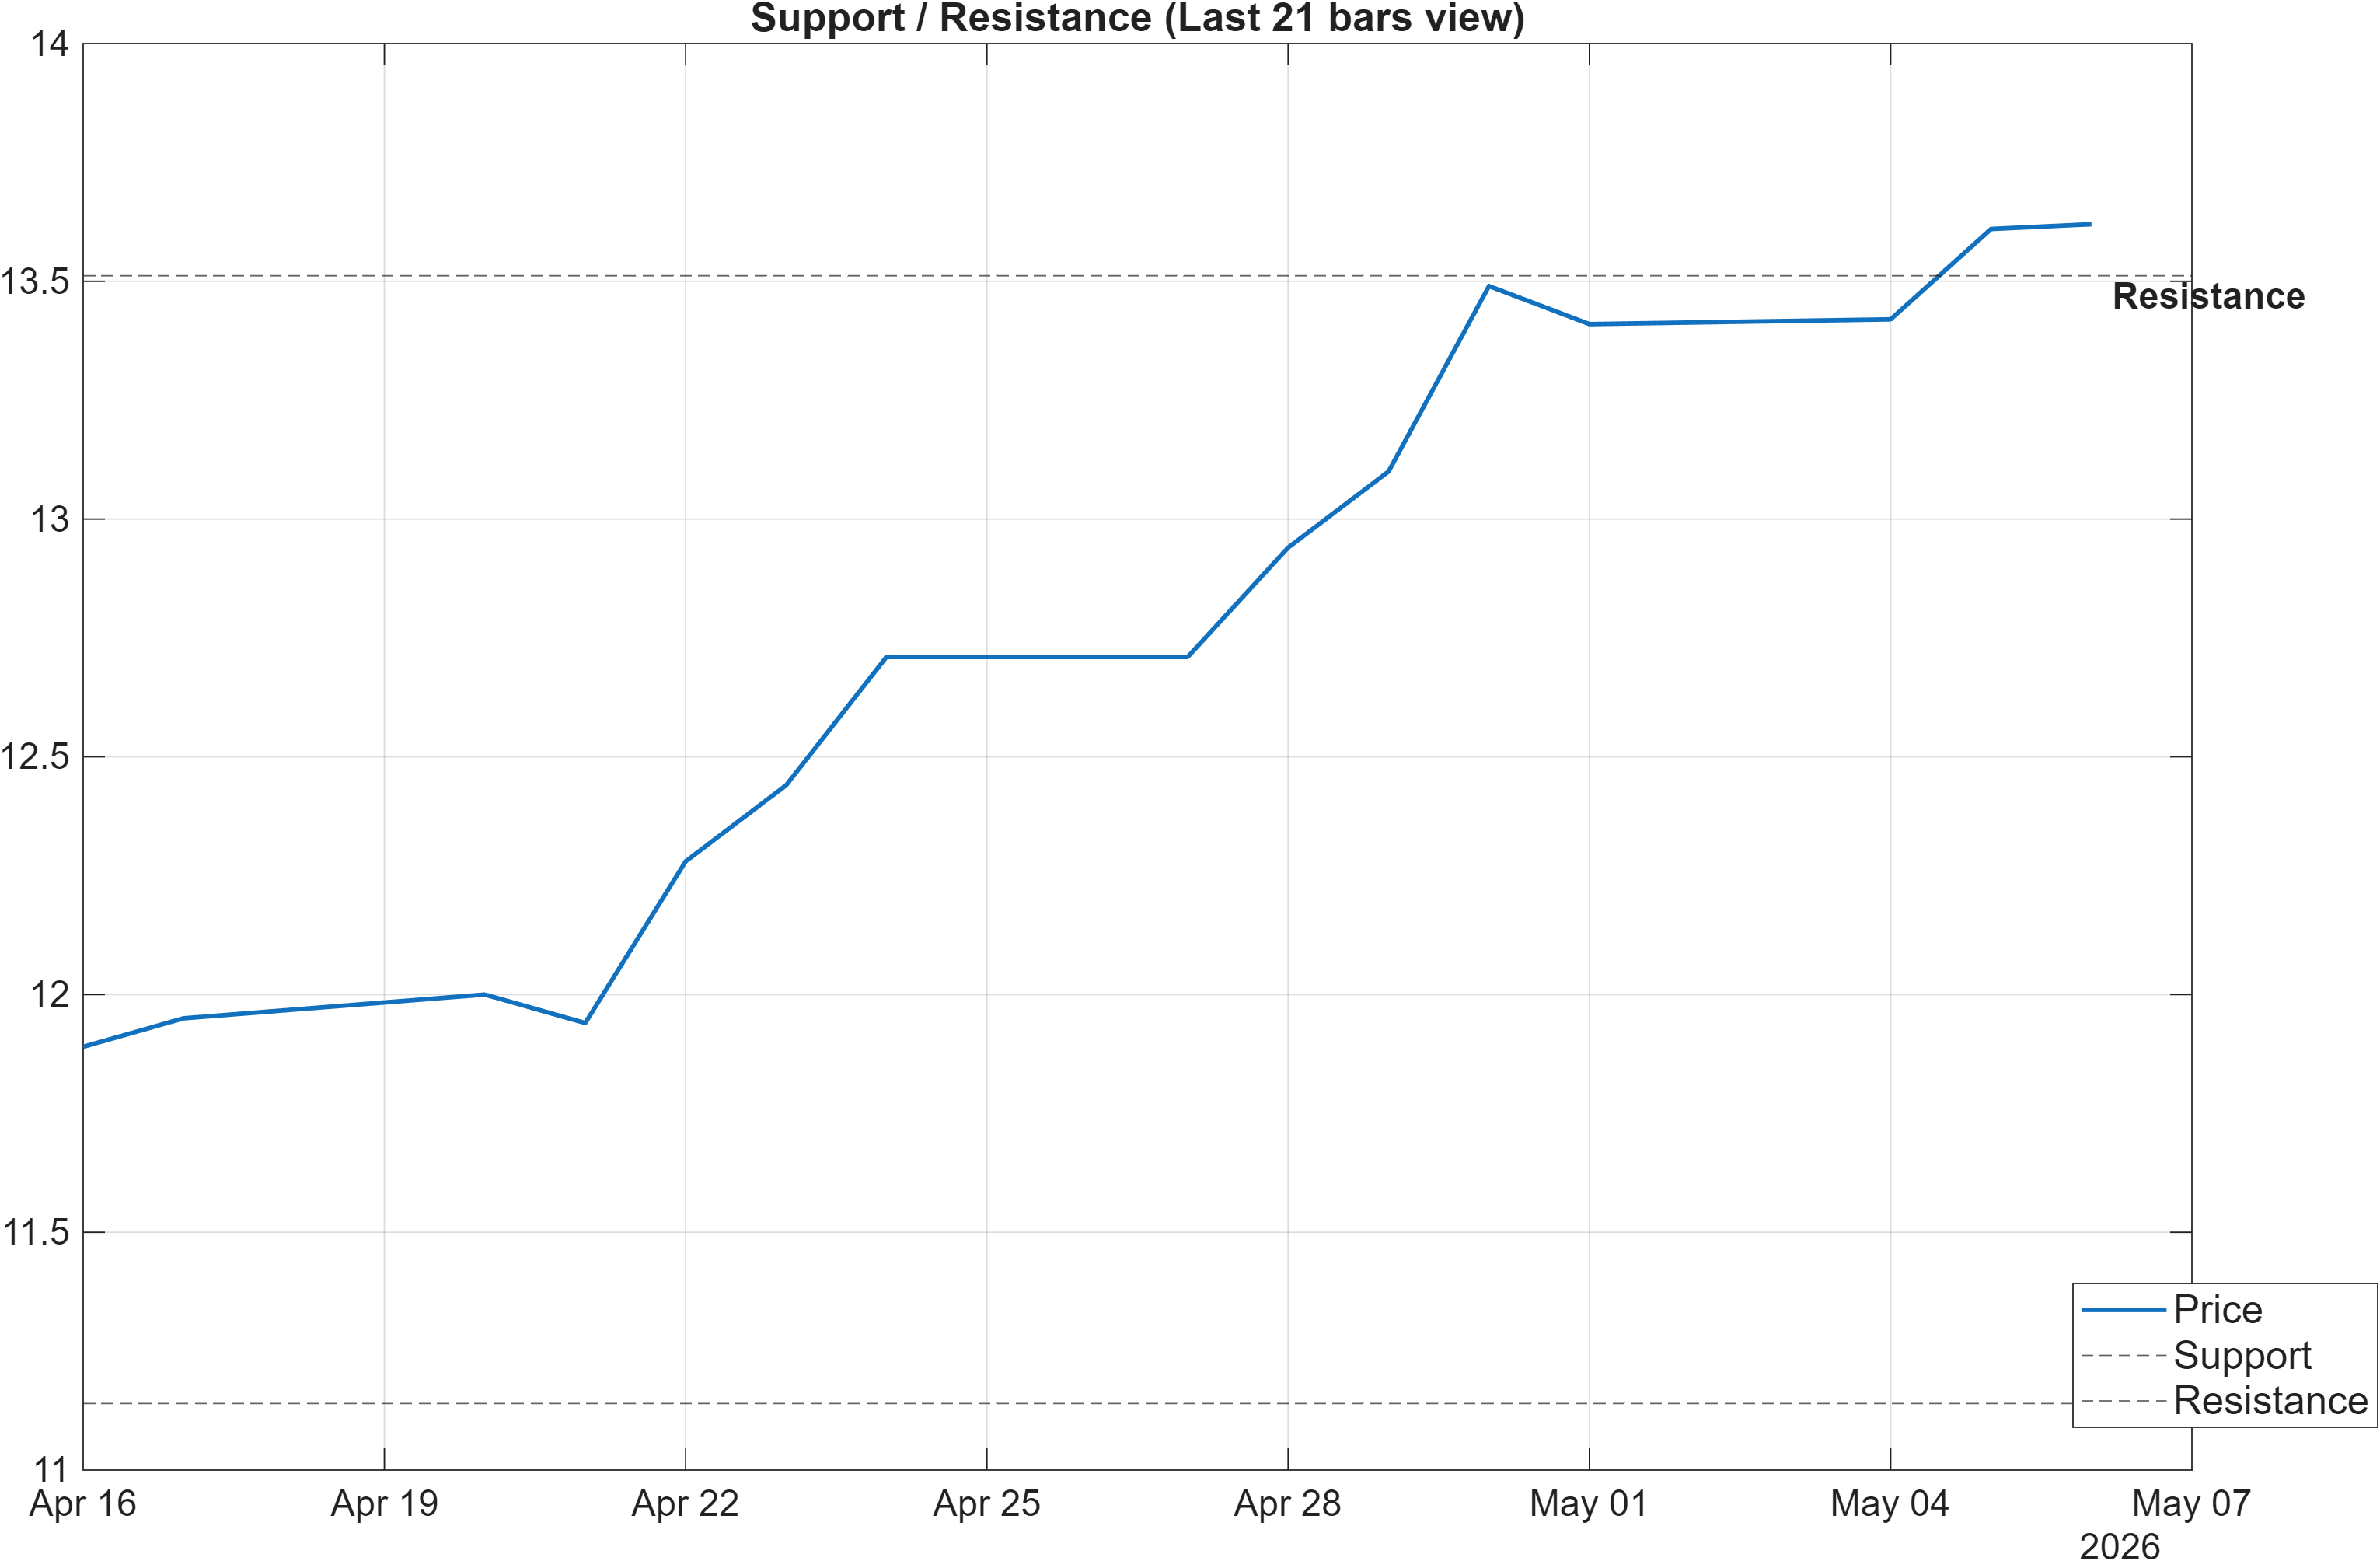
The current structure is framed by a well-defined range of decision, with support at ~11.1400 and resistance at ~13.5117. Given the earlier regime split (close above MA50 but MA50 below MA200), these zones function as validation gates: a push through resistance can force reassessment of the longer-horizon posture, while a failure that breaks support would align price structure with the Bearish longer-term ranks.
Momentum conditions add specificity to how these levels may behave. With RSI(14) at 94.67 and positive MACD histogram (0.0787), the tape has the capacity to test resistance quickly; however, elevated momentum can also create thin error margins, where rejection from resistance triggers a faster retracement than participants expect. This is consistent with the report’s scenario framing that emphasizes volume: a breakout without participation is more vulnerable when oscillators are stretched.
The ranks strengthen the “decision-zone” interpretation. With the monthly rank at #1955 and the 3-month rank at #1883, the longer-horizon cross-sectional signal argues that DNOW remains in a weaker cohort. In that setting, resistance tests tend to be more informative than routine pullbacks, because they reveal whether demand is strong enough to overcome a broader regime headwind. Conversely, a close below 11.1400 would add coherence across ranks, trend structure, and momentum cooling.
Scenario view: Break above resistance with volume → continuation. Close below support → signal deterioration risk.
5) Quant Technical Dashboard (18 Signals)
KGNAI AI Technical Analysis Score (Deep Reinforcement Learning): Rank #1181 out of 2055 (Rank 1 represents the strongest technical positioning and a higher probability of favorable price behavior. As ranks increase toward the maximum, the probability of favorable outcomes weakens and bearish positioning becomes more dominant.) | Label: Neutral | Score: -0.149
18-Signal Technical Confluence Score: 0.611 (Bullish)
Overall Technical Score (18-signal confluence + DRL rank blend): 0.383 (Bullish)
Note: The blended score reflects signal strength weighted against broader AI technical ranking, which may temporarily diverge.
Blended technical score breakdown: 0.383 (Bullish | Bull 13 / Bear 2 / Neutral 3)
The technical stack shows a confluence vs model-rank divergence that is analytically meaningful. On one side, the 18-signal engine is decisively positive with a confluence score of 0.611, and the blended outcome remains Bullish at 0.383 with 13 Bull signals versus only 2 Bear. On the other side, the Deep Reinforcement Learning (DRL) technical rank is #1181 out of 2055 with a Neutral label and a score of -0.149, implying the broader pattern library does not rate the setup as strong relative to the universe.
When these disagree, the most common interpretation is recent improvement that has not yet “earned” cross-sectional credibility. The signal table supports that: MACD histogram is Bullish (0.07869) and ROC(20) is Bullish (13.97), indicating strong directional impulse, while volatility metrics such as BB Width are Neutral at 0.1941—suggesting the move is not occurring in a compressed, low-noise environment. That can produce strong confluence readings even as regime-aware models remain cautious.
The bear signals also carry interpretive weight because they point to potential fragility beneath headline momentum. Vol ROC(20) is Bearish at -48.53, which can indicate that price progress is occurring with decelerating volume change over the lookback. In conjunction with stretched oscillator conditions (RSI high, Stoch turning Bearish), that setup tends to focus attention on whether breakouts are supported by sufficient participation—particularly near 13.5117.
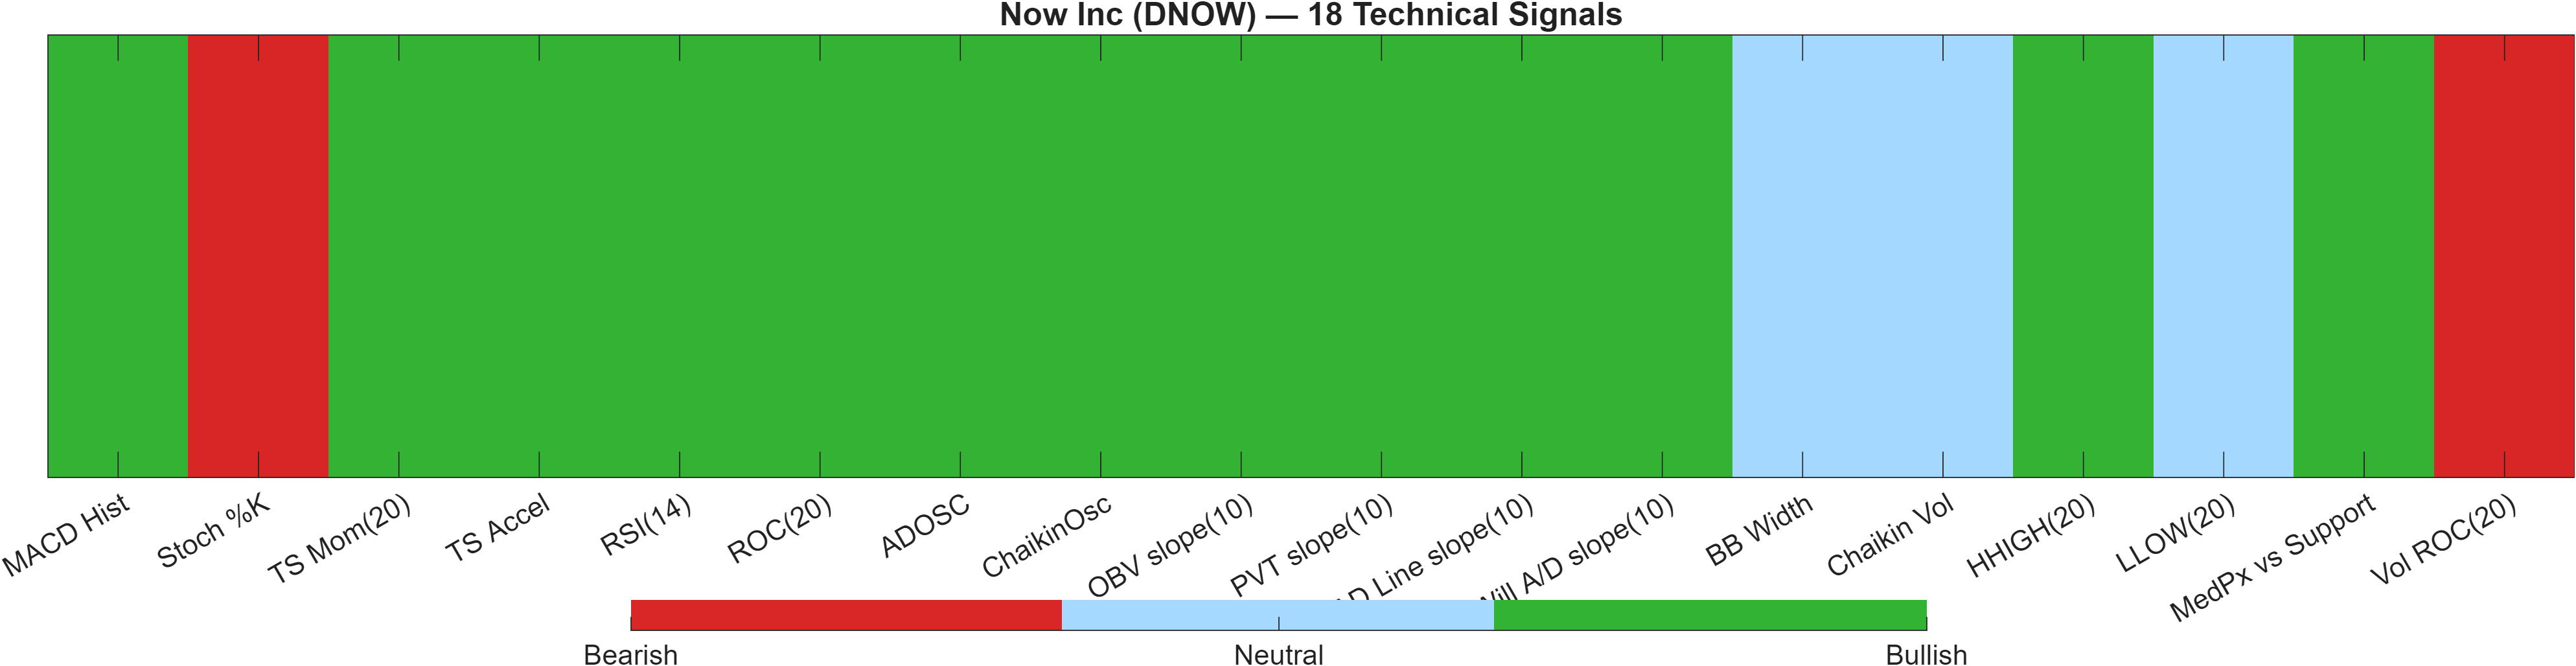
Signal table (Bull/Bear/Neutral)
| Indicator | Value | Signal |
|---|---|---|
| MACD Hist | 0.07869 | Bullish |
| Stoch %K | 84.62 | Bearish |
| TS Mom(20) | 1.66 | Bullish |
| TS Accel | 1.54 | Bullish |
| RSI(14) | 94.67 | Bullish |
| ROC(20) | 13.97 | Bullish |
| ADOSC | 70.83 | Bullish |
| ChaikinOsc | 2.889e+06 | Bullish |
| OBV slope(10) | 1.863e+07 | Bullish |
| PVT slope(10) | 2.455e+05 | Bullish |
| AD Line slope(10) | 7.833e+06 | Bullish |
| Will A/D slope(10) | 1.65 | Bullish |
| BB Width | 0.1941 | Neutral |
| Chaikin Vol | -3.222 | Neutral |
| HHIGH(20) | 13.78 | Bullish |
| LLOW(20) | 11.51 | Neutral |
| MedPx vs Support | 2.46 | Bullish |
| Vol ROC(20) | -48.53 | Bearish |
Interpretation: Indicator-level signals form the base confluence, which is then adjusted using a separate AI-driven technical ranking model. The final technical score summarizes this combined view.
6) News sentiment + extractive gist
Sentiment score (avg): 0.065 | Positive: 42% | Neutral: 42% | Negative: 15%
KGNAI AI News Sentiment Score (normalized -1 to +1): 1.00 (as of 2026-05-05) | Label: Bullish | Overall news score: 0.99
Positive Developments
Recent coverage across major financial outlets indicates a constructive contextual backdrop around risk appetite and thematic rotations, which can indirectly improve the trading environment for smaller and mid-cap names. The model-level read is notably strong: the normalized news sentiment is 1.00 (as of 2026-05-05), and the headline distribution is skewed away from negative outcomes with 42% positive and only 15% negative in the provided mix. For DNOW specifically, the presence of scheduled corporate communications and investment commentary tends to reduce ambiguity on “what’s next,” even if those items are informational rather than catalytic. Combined with the technical confluence remaining Bullish (0.611), this supportive sentiment profile can help explain why short-run momentum readings are elevated despite weaker longer-horizon ranks.
Neutral / Mixed Developments
The average sentiment score is modest at 0.065, and the distribution shows a large 42% Neutral share, which points to coverage that is more event-calendar and positioning oriented than thesis-defining. In these conditions, price can respond more to microstructure and technical levels than to new narrative information. This is consistent with the broader report setup: ranks remain Neutral in the near term (daily #1422, weekly #1644) while longer horizons are Bearish, implying the market may be balancing short-run improvement against unresolved longer-run constraints. The result is often a “wait-for-confirmation” tape where the most actionable information comes from how price behaves at ~13.5117 and ~11.1400.
Negative / Risk Signals
The negative cluster in the provided items highlights that DNOW has recently been framed alongside drawdown and earnings-related volatility narratives, which can raise sensitivity around key levels even when current momentum looks strong. While the model labels news as Bullish (normalized 1.00), the presence of explicitly negative items helps explain why longer-horizon ranks remain Bearish (monthly #1955, 3-month #1883)—markets often require multiple cycles of follow-through before those windows rehabilitate. From a risk lens, the signal table also flags a participation concern with Vol ROC(20) at -48.53 (Bearish), reinforcing that sentiment tailwinds can fade quickly if price breaks structure. A close below 11.1400 would likely amplify attention to these risk narratives.
- Whether price can sustain a move above 13.5117 with confirming participation.
- Any shift in the Neutral-heavy news mix (42%) toward decisively positive or negative framing.
- Whether weakness re-emerges through a close below 11.1400 (structure failure).
Sources referenced: Reuters, Bloomberg, Yahoo Finance, MarketWatch, Investing.com
Snapshot: AI Rank (Short–Mid–Long): Mixed (Bearish tilt) (Neutral–Bearish–Bearish) · Technical Confluence: Bullish · Key Levels: Support ~11.14 | Resistance ~13.51 · News Sentiment: Neutral
7) Sources
- DNOW Announces First Quarter 2026 Earnings Conference Call — https://finance.yahoo.com/news/dnow-announces-first-quarter-2026-104500557.html?.tsrc=rss
- Earnings Preview: DNOW (DNOW) Q1 Earnings Expected to Decline — https://finance.yahoo.com/markets/stocks/articles/earnings-preview-dnow-dnow-q1-140029835.html?.tsrc=rss
- What Makes DNOW (DNOW) a Lucrative Investment? — https://finance.yahoo.com/markets/stocks/articles/makes-dnow-dnow-lucrative-investment-142603103.html?.tsrc=rss
- Earnings Preview: DNOW (DNOW) Q1 Earnings Expected to Decline — https://www.nasdaq.com/articles/earnings-preview-dnow-dnow-q1-earnings-expected-decline
- DNOW and Data Centers: A New Tailwind for PVF and Pumps — https://www.nasdaq.com/articles/dnow-and-data-centers-new-tailwind-pvf-and-pumps
- Is DNOW Stock a Buy After the Pullback? Key Catalysts and Risks — https://www.nasdaq.com/articles/dnow-stock-buy-after-pullback-key-catalysts-and-risks
- DNOW's Merger Deal With MRC Global: What It Means for 2026 — https://www.nasdaq.com/articles/dnows-merger-deal-mrc-global-what-it-means-2026
- This Fund Exited a $5 Million DNOW Stake Last Quarter. The Stock Has Fallen 12% This Year — https://www.nasdaq.com/articles/fund-exited-5-million-dnow-stake-last-quarter-stock-has-fallen-12-year
You may also like: How KGNAI AI ranks instruments across global markets
Disclaimer: KGNAI provides AI-generated analytics and educational market commentary only. This is not financial advice. Markets involve risk. Always do your own research.