
Walmart Inc (WMT) Technical & Rank Outlook — 24-Apr-2026 (Measured Optimistic Stance)
Walmart Inc (WMT) is currently characterized by broadly constructive cross-horizon ranking, supportive trend structure, and a bullish technical confluence reading, while momentum indicators suggest late-stage strength that may require confirmation through price acceptance above nearby resistance. Across KGNAI’s ranked universe of 2058 instruments, WMT’s ranks cluster in the upper quartile to top decile range (notably the Weekly rank at #141 and Yearly rank at #162), consistent with a favorable relative regime rather than a single-timeframe anomaly. Technically, the blended technical score remains bullish at 0.754, supported by a DRL technical rank of #176 out of 2057 and a 14/1/3 Bull/Bear/Neutral split. Volatility is not elevated (Bollinger bandwidth latest 0.0777), implying that continuation—if it occurs—may be more incremental than explosive. News sentiment is modestly positive on the normalized model (0.65) even as the distribution skews neutral (74%), suggesting an informational flow that is not strongly polarizing.
- Rank stance (Short / Mid / Long): Bullish / Bullish / Bullish (Weekly #141; Yearly #162 signal stronger relative standing).
- Technical confluence: Bullish (Overall technical score 0.754; 18-signal confluence 0.722).
- Key levels: Support ~ 120.9100 | Resistance ~ 129.2000.
- News sentiment bias: Slightly constructive by model (0.65), but flow is predominantly neutral (74%).
- Confirmation / invalidation: Acceptance above 129.2000 with volume favors continuation; a close below 120.9100 increases deterioration risk.
What KGNAI Measures
KGNAI evaluates assets using large cross-sectional datasets built from millions of structured data points. Inputs incorporate fundamental metrics, technical structures, and systematically processed news sentiment. Statistical models, machine learning, and AI frameworks are used to assess relative positioning, signal alignment, and probabilistic behavior across broad universes.
How to Read This Report
- Ranks are comparative across the tracked universe, not absolute price targets.
- Confluence reflects alignment among independent signal groups.
- Support/resistance levels are probabilistic decision zones, not guarantees.
- Sentiment provides contextual bias within the broader analytical framework.
KGNAI Signal + Technical Snapshot + News Sentiment Digest
As of: 24-Apr-2026
Ticker: WMT
1) KGNAI AI Analysis
Region: USA
Total universe size: 2058 ranked instruments
- Daily rank: #306 out of 2058 — Bullish
- Weekly rank: #141 out of 2058 — Bullish
- Monthly rank: #408 out of 2058 — Bullish
- 3-Monthly rank: #267 out of 2058 — Bullish
- 6-Monthly rank: #275 out of 2058 — Bullish
- Yearly rank: #162 out of 2058 — Bullish
The ranking panel shows a notable feature: consistency across horizons. While the Daily rank (#306) is less aggressive than the Weekly rank (#141), both remain in bullish territory and within the upper quartile of the 2058-instrument universe. The Yearly rank (#162) reinforces that the current profile is not purely short-term momentum, but also compatible with longer-horizon relative strength.
From an alignment perspective, the Monthly rank (#408) is weaker than the Weekly and Yearly readings, which can occur when price strength accelerates faster than some slower-moving cross-sectional features adjust. That type of timeframe divergence is often where confirmation matters: if price and technical confluence remain constructive (see Sections 2–5), the lagging rank can converge upward; if price stalls near resistance, it can remain a drag on the composite view.
KGNAI ranks each instrument across large universes using multiple proprietary AI tests and statistical models (millions of data points). Lower ranks generally indicate stronger probability of favorable performance behavior, while higher ranks indicate weaker probability and more bearish positioning.
Term view: Short-term: Bullish. Mid-term: Bullish. Long-term: Bullish.
Rank implication: WMT’s cluster around #141–#306 in the nearer horizons, alongside a Yearly #162, reads as an upper-quartile relative setup with moderate dispersion—supportive, but still sensitive to confirmation at nearby structural levels.
2) Price & trend overview
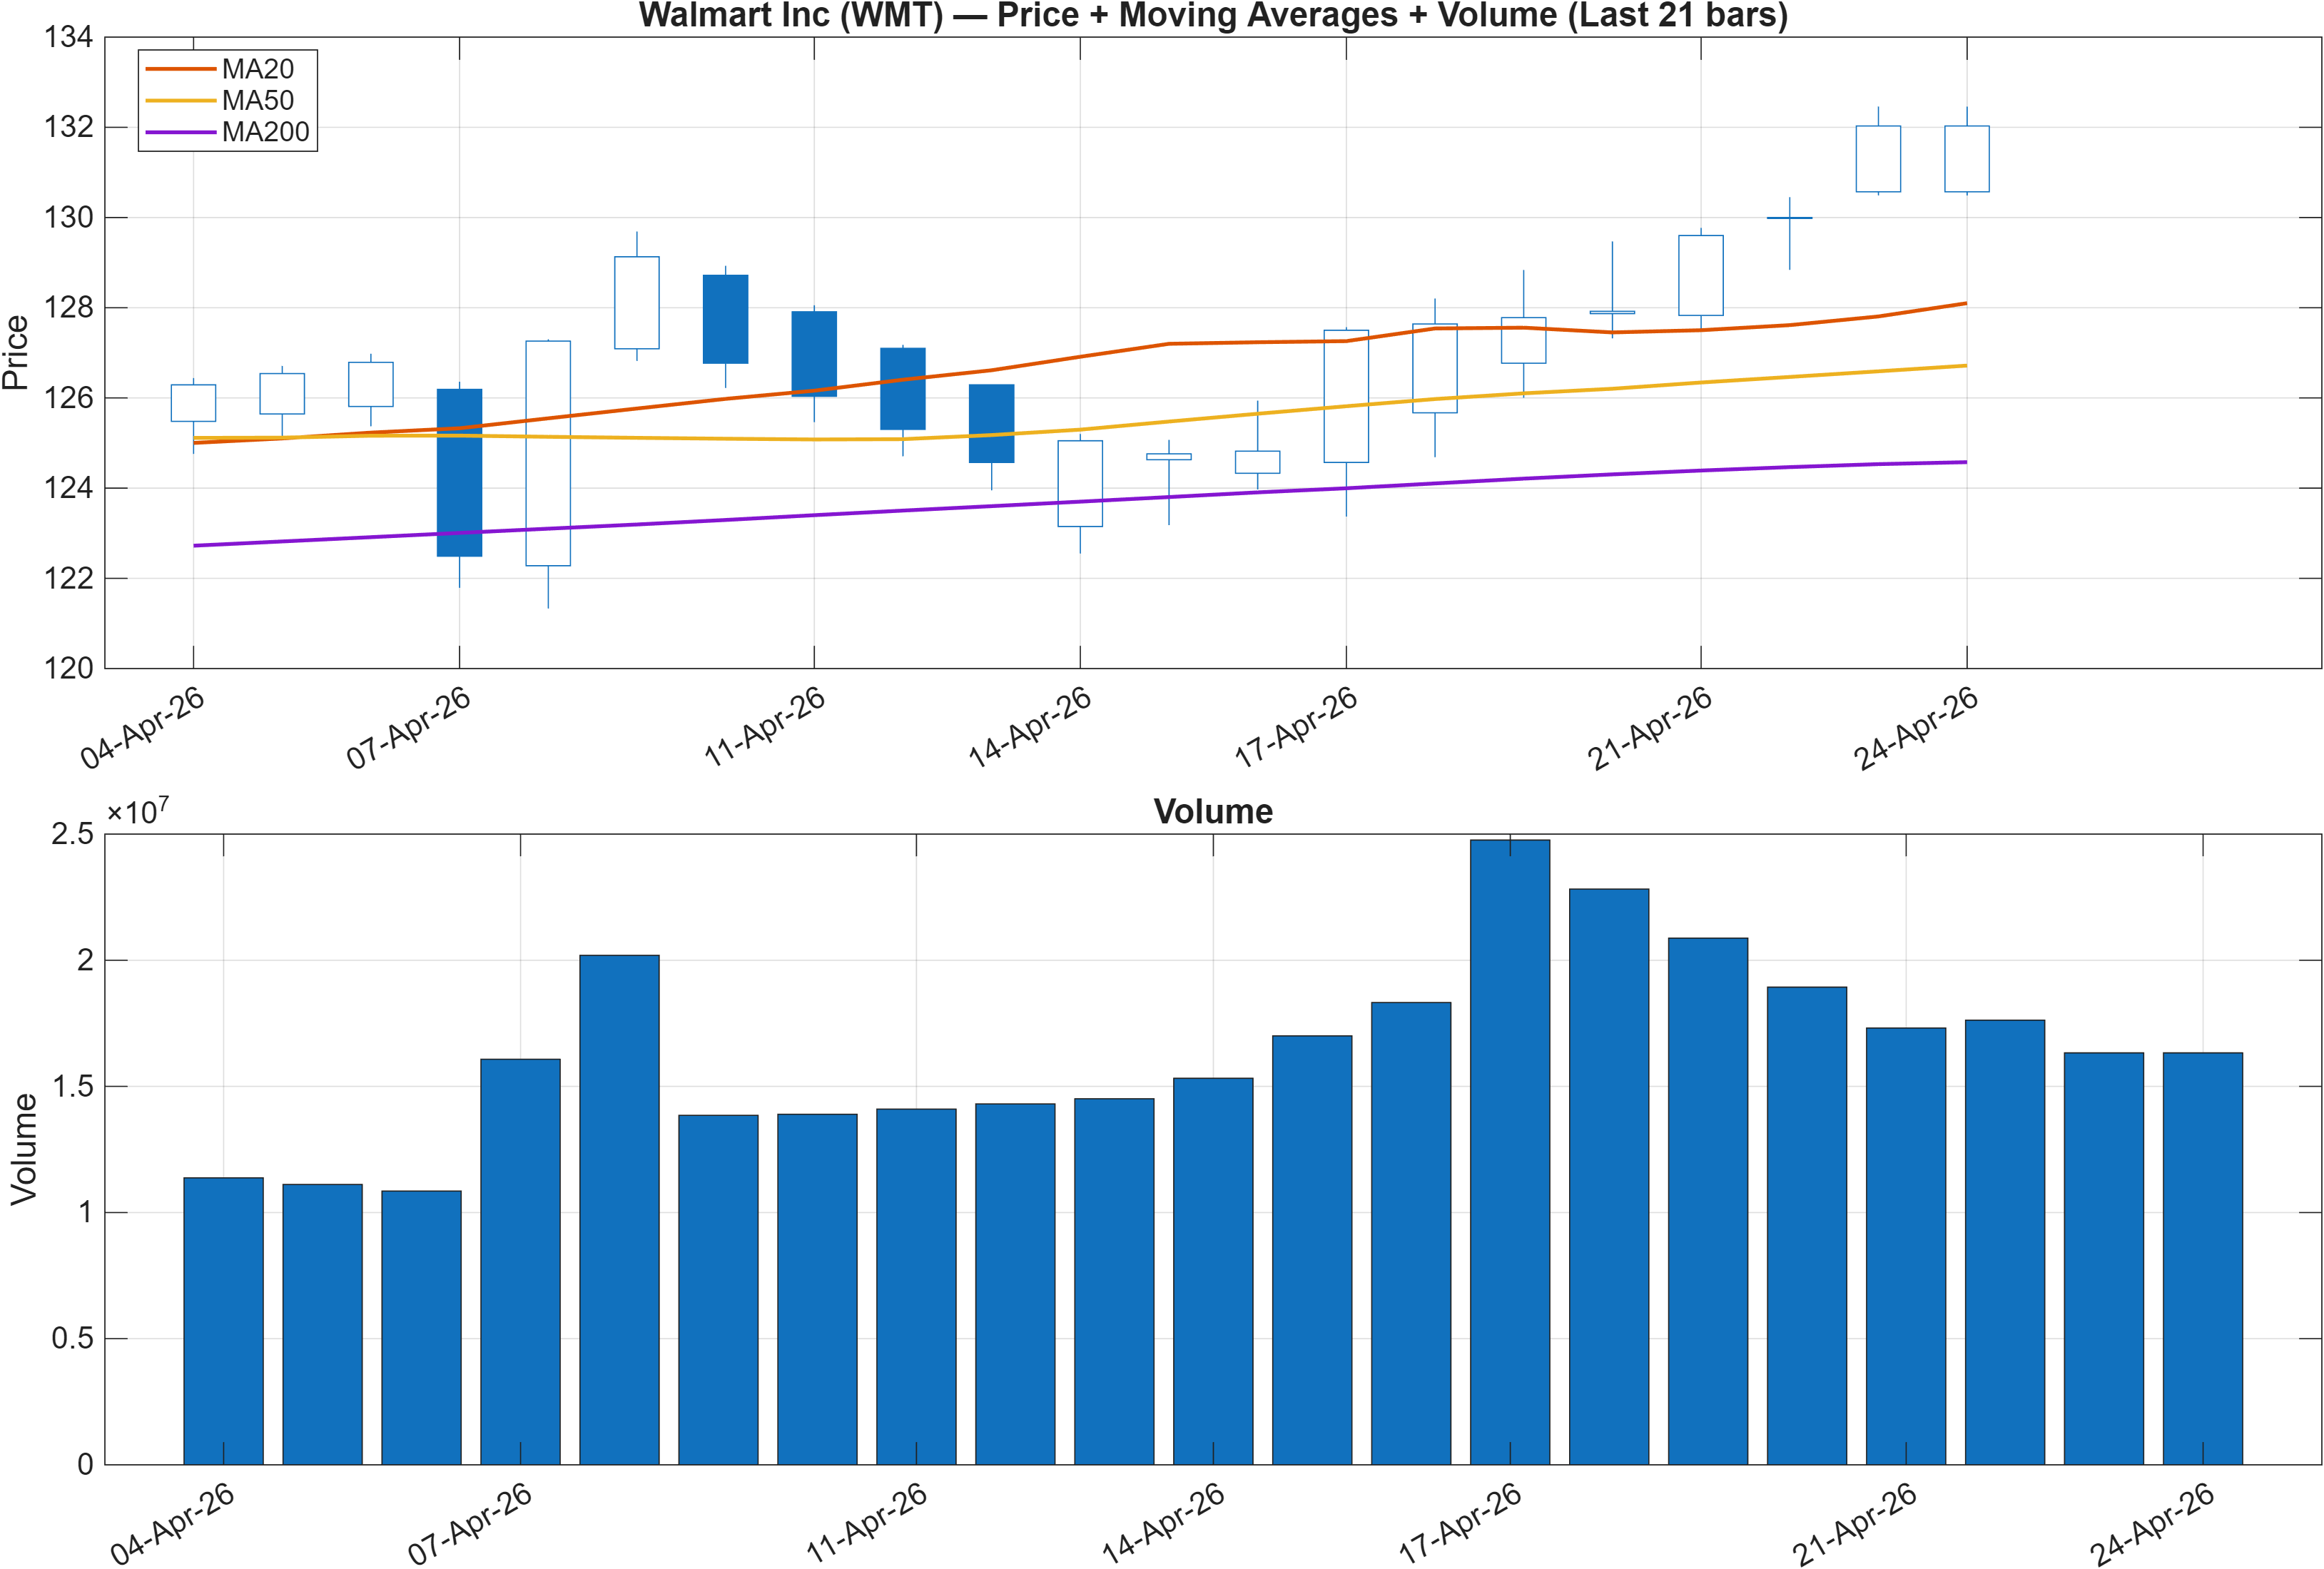
Interpretation: Close vs MA50 = Bullish, MA50 vs MA200 = Bullish.
Trend structure is supportive on both common institutional filters: price above the 50-day moving average and the 50-day above the 200-day. That two-layer alignment generally reflects a regime where pullbacks are more likely to be absorbed than to expand into sustained drawdowns—until proven otherwise by a break in structure.
A key analytical question is whether the current advance is still in trend persistence mode or entering trend maintenance mode. With resistance defined at 129.2000 (Section 4), the chart context becomes less about identifying the trend (already bullish by the MA relationships) and more about whether price can accept above a nearby ceiling without immediate mean reversion.
Volume, when read alongside the moving-average structure, is best treated here as a confirmation tool rather than a standalone signal. The Daily rank (#306) being less strong than the Weekly rank (#141) can be consistent with a market that is trending but pausing—where incremental buyers need to demonstrate follow-through at or above resistance rather than relying on the existing MA slope alone.
With the MA stack bullish and the ranked profile supportive (Yearly #162), the price/trend view favors a constructive bias, while remaining conditional on behavior around 129.2000 and the integrity of the 120.9100 support zone.
3) Momentum & volatility dashboard
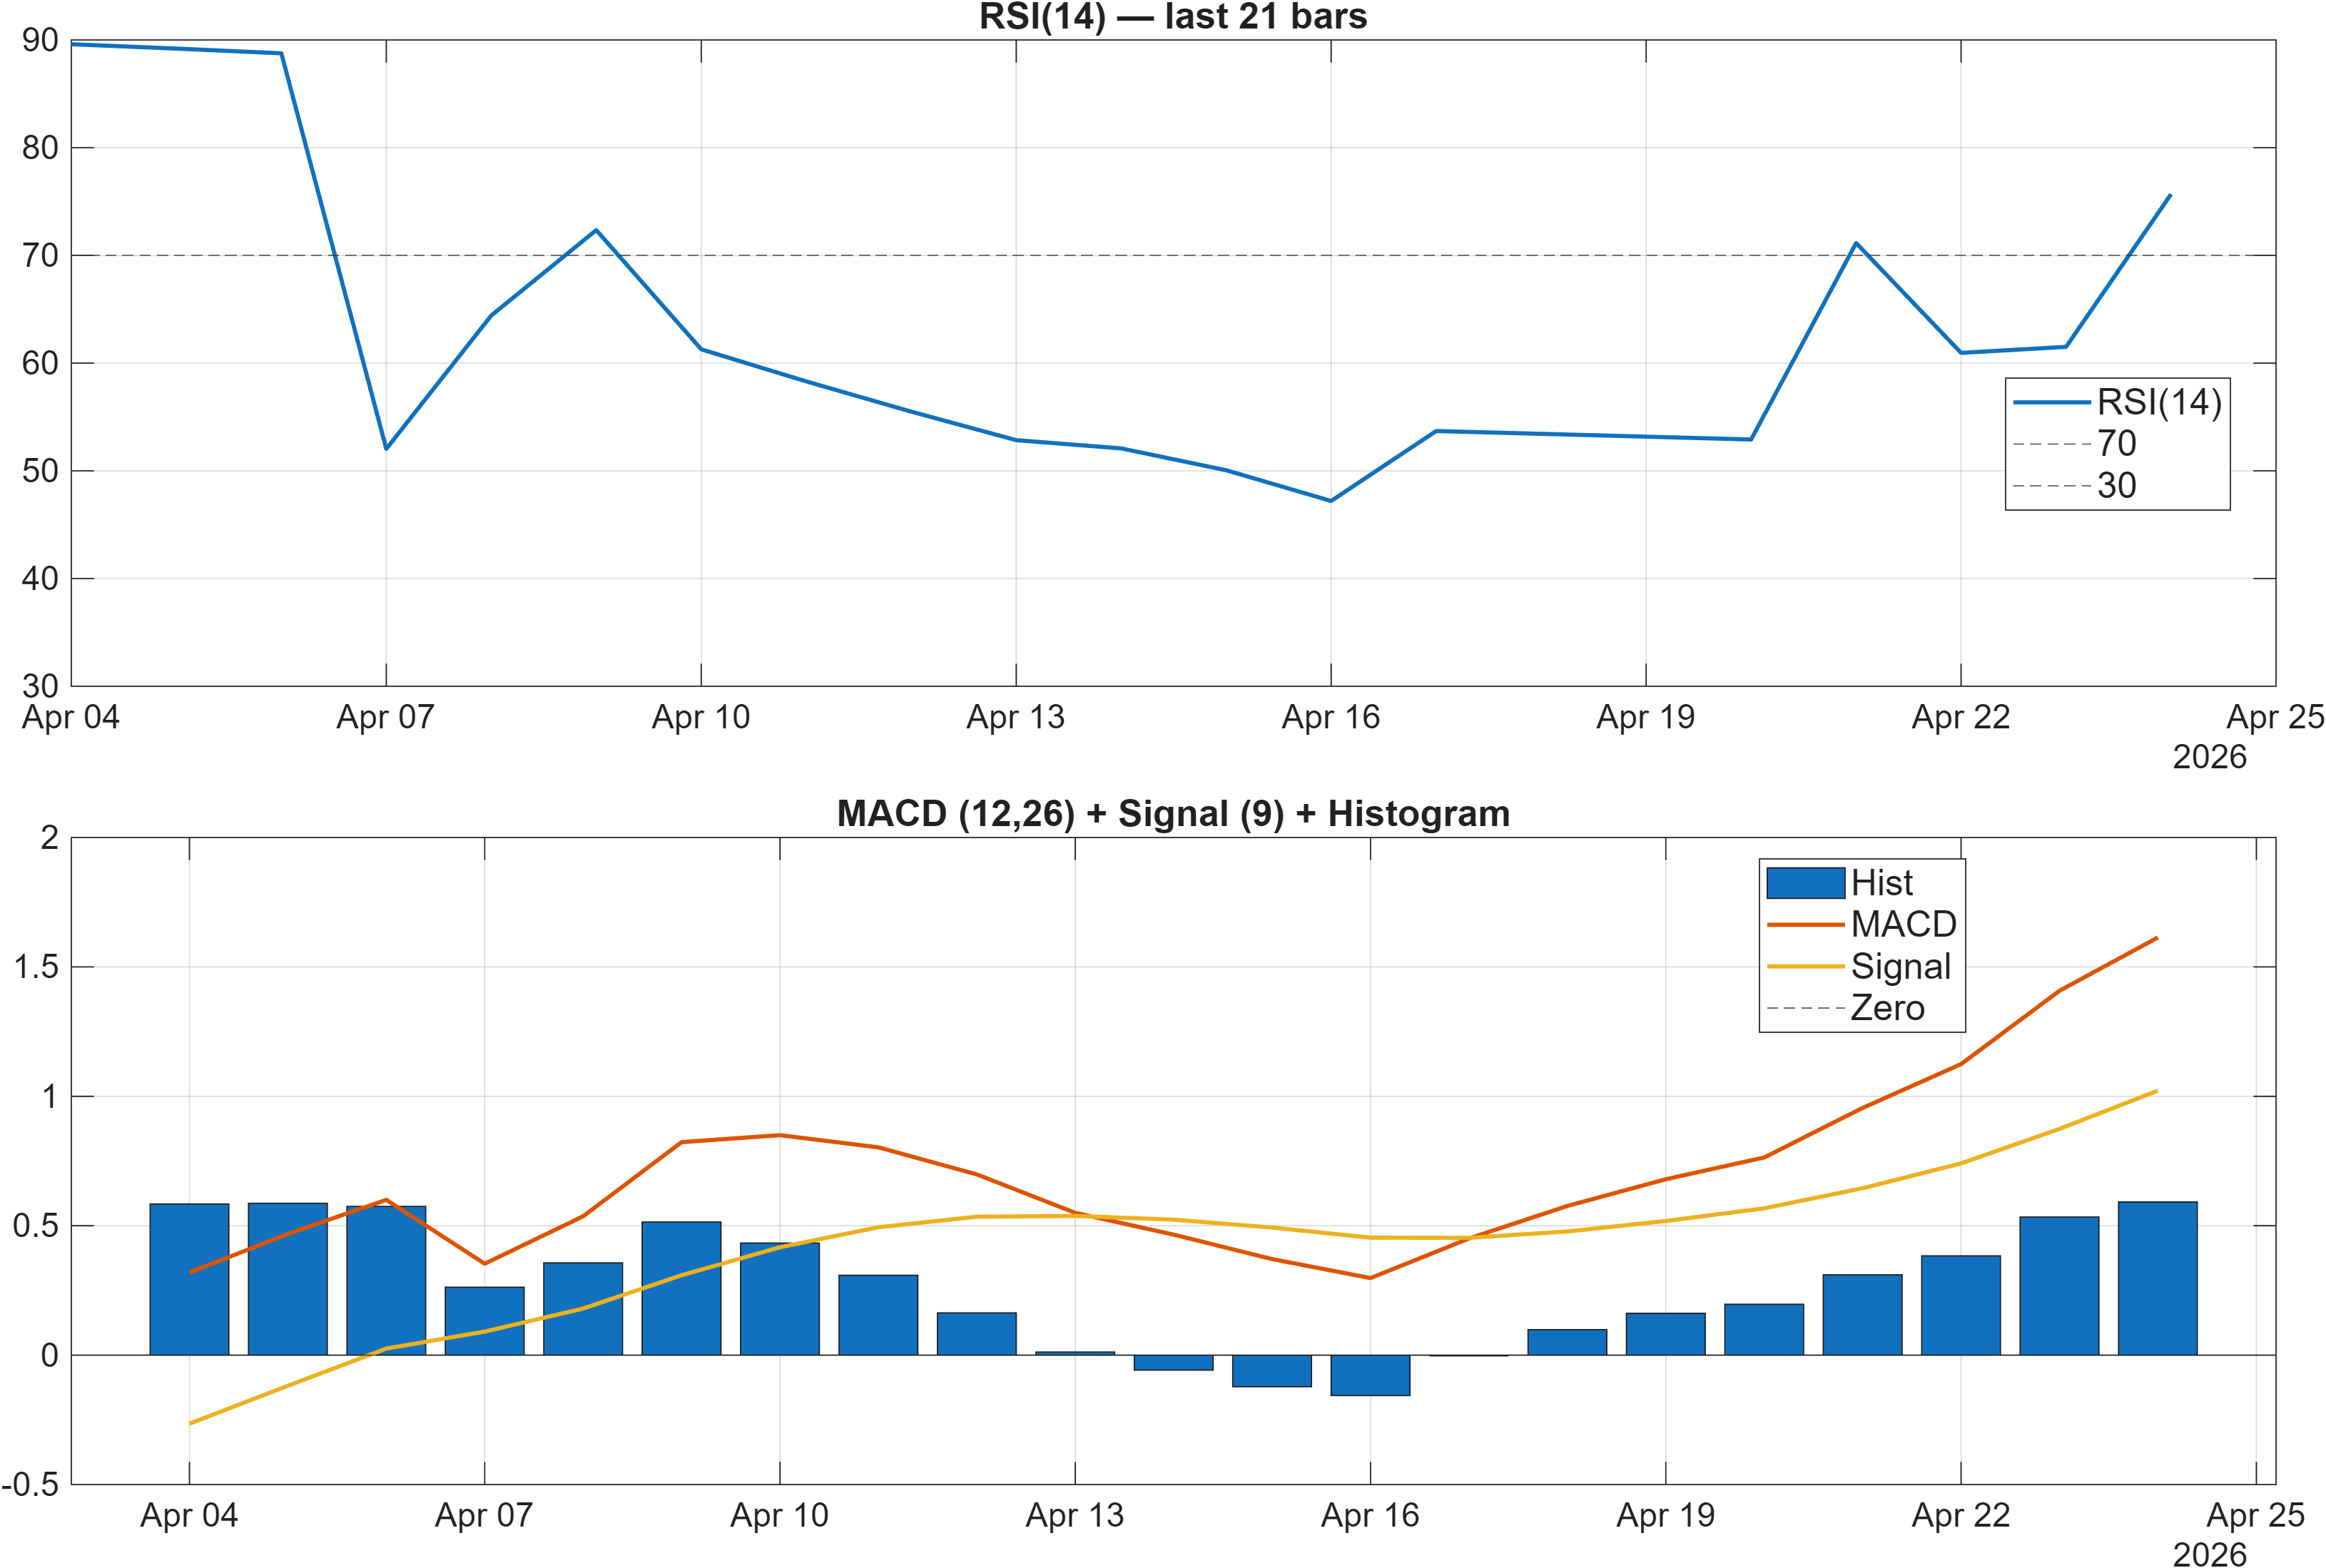
Interpretation: RSI bias = Bullish, MACD hist = 0.5917.
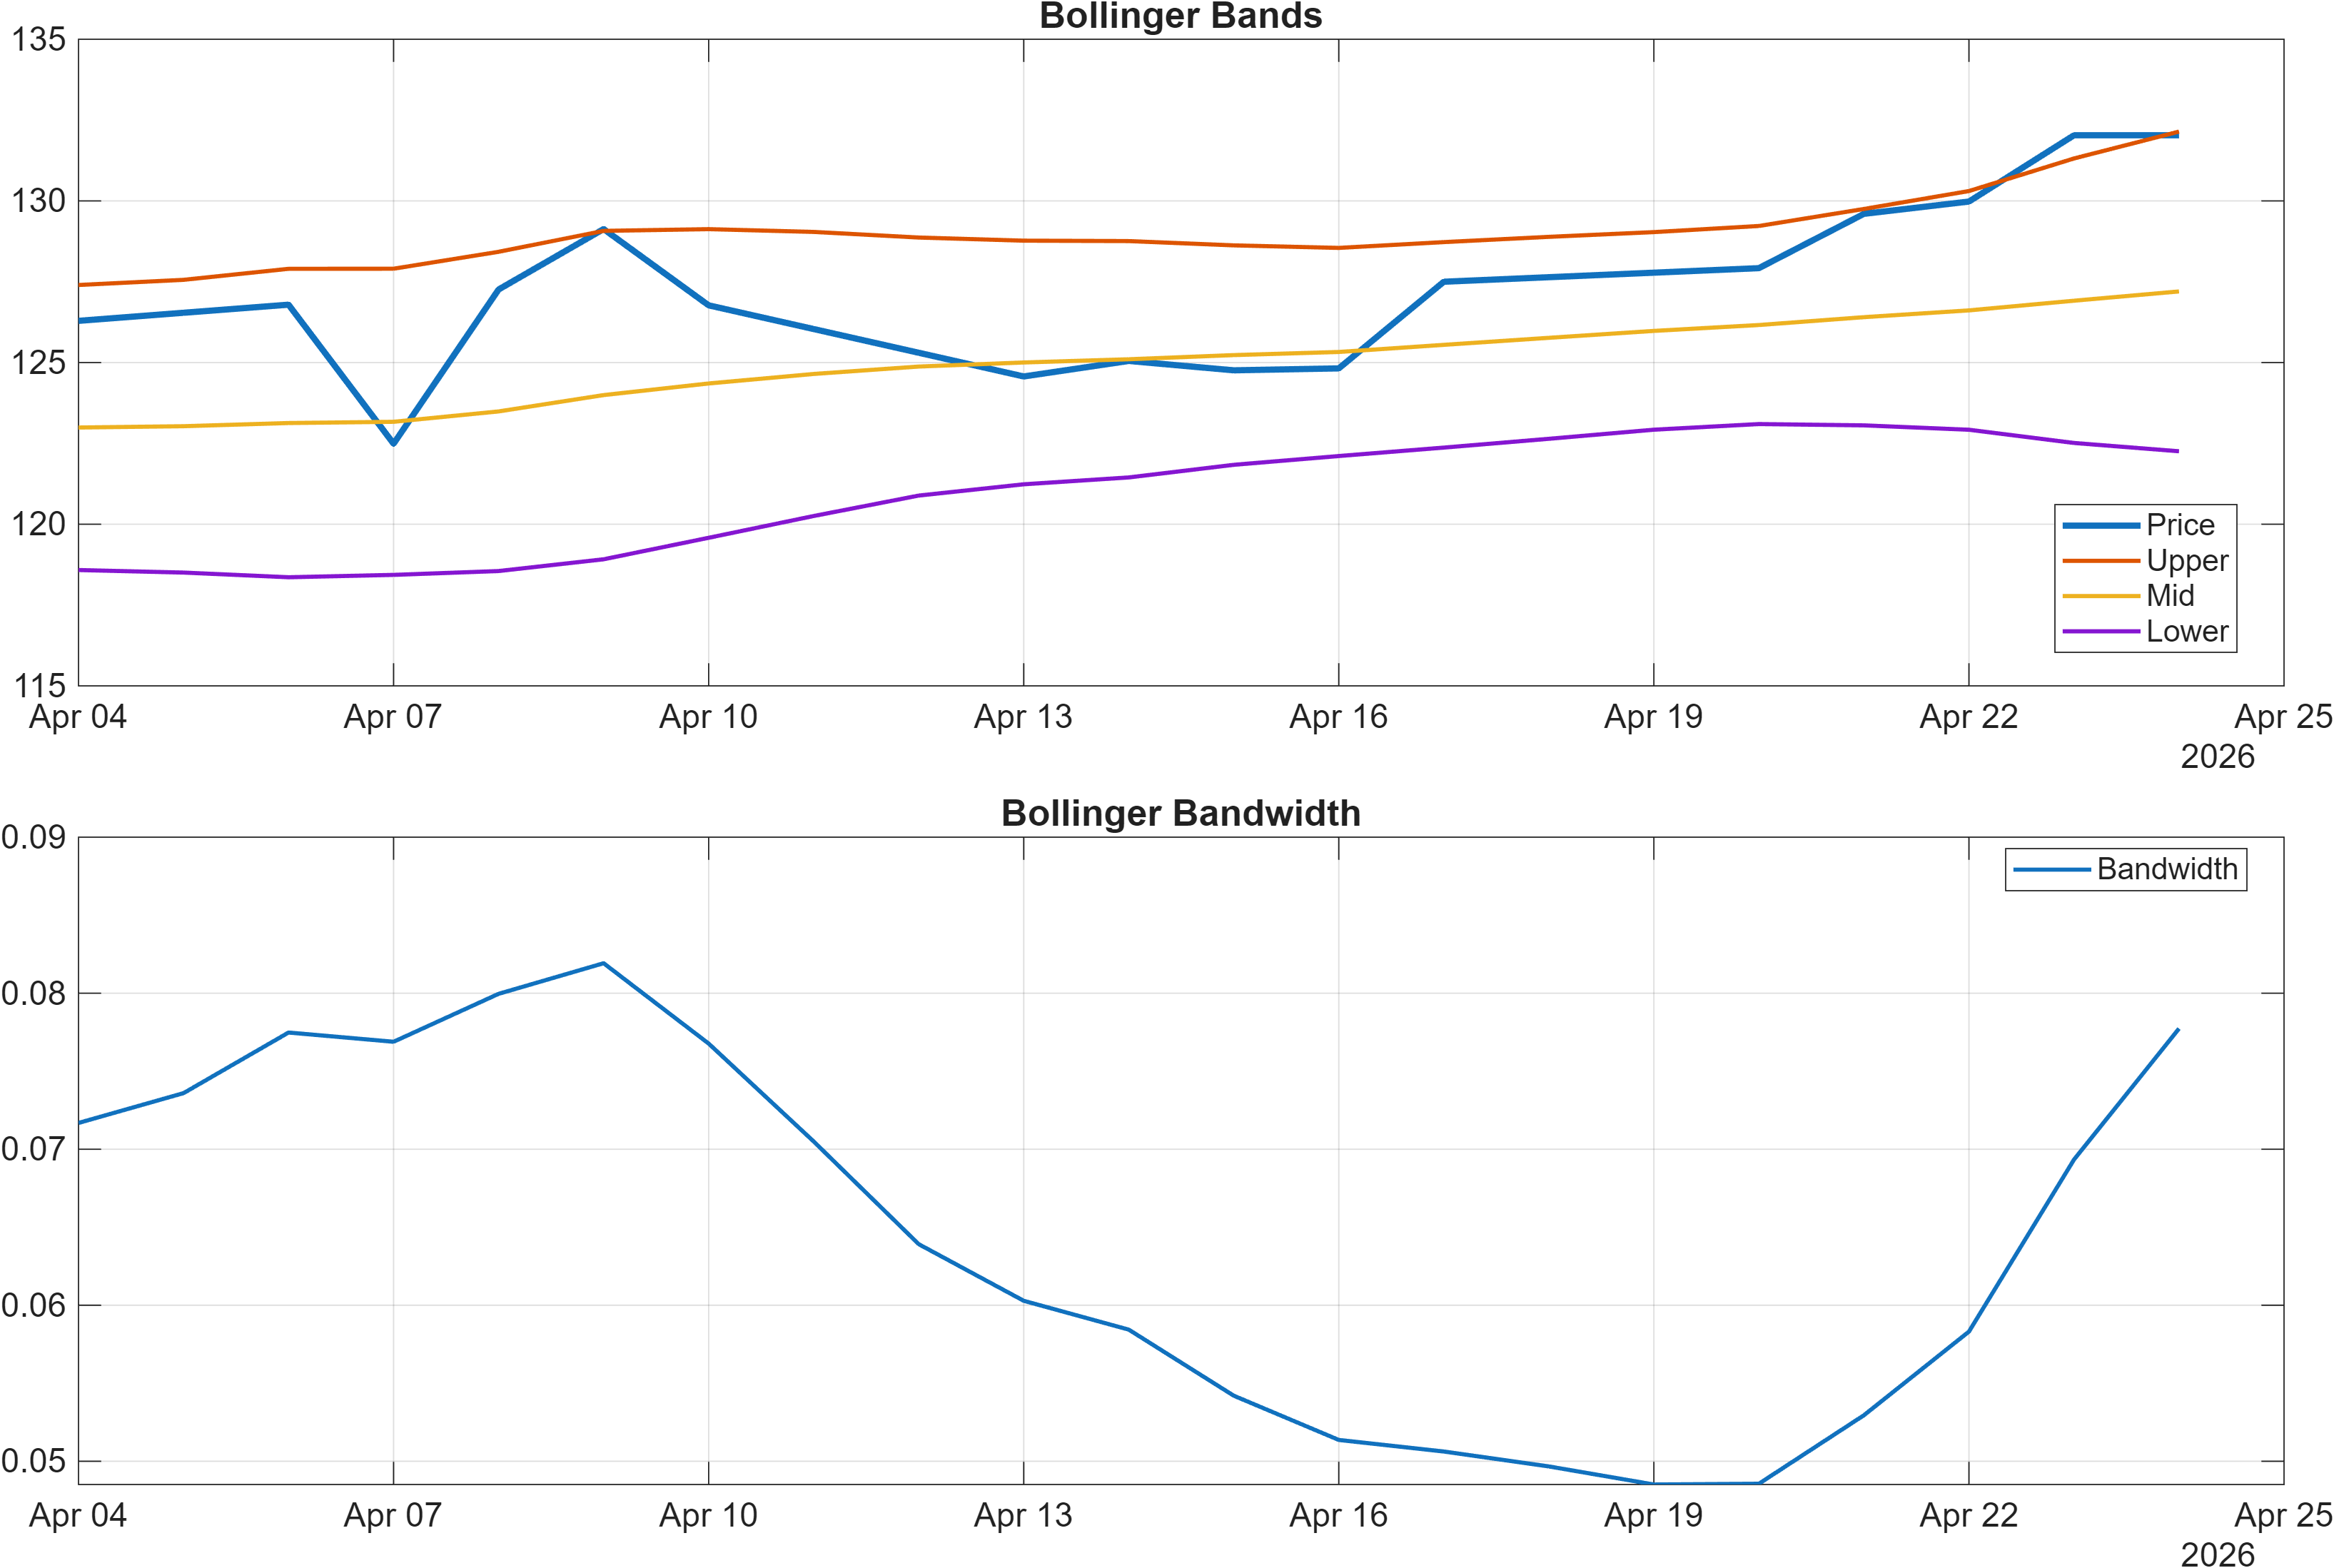
Interpretation: Bandwidth (volatility regime) latest = 0.0777.
Momentum is constructive, but the composition matters. RSI(14) is elevated at 75.68, which can occur during healthy uptrends but also tends to coincide with reduced marginal upside unless price transitions into a higher-volatility expansion. At the same time, MACD histogram remains positive at 0.5917, indicating that upside momentum is still present rather than rolling over.
Volatility, however, is not signaling an aggressive breakout regime. Bollinger bandwidth at 0.0777 suggests a relatively contained volatility backdrop. When RSI is high while bandwidth remains moderate, the more common market behavior is grind-up continuation or consolidation, rather than immediate acceleration—unless a catalyst pushes volatility higher.
This creates a useful “compression vs. extension” framing: momentum is extended (RSI), trend is aligned (MA relationships), but volatility is not expanding materially (bandwidth). In that mix, the next decisive information often comes from how price behaves at clearly defined levels—particularly 129.2000—and whether momentum can persist without broadening volatility.
Net assessment: momentum remains Bullish (MACD hist 0.5917), but elevated RSI (75.68) and moderate bandwidth (0.0777) point to a market that may require price-level confirmation rather than expecting immediate expansion.
4) Support / Resistance zones
Support ~ 120.9100 | Resistance ~ 129.2000
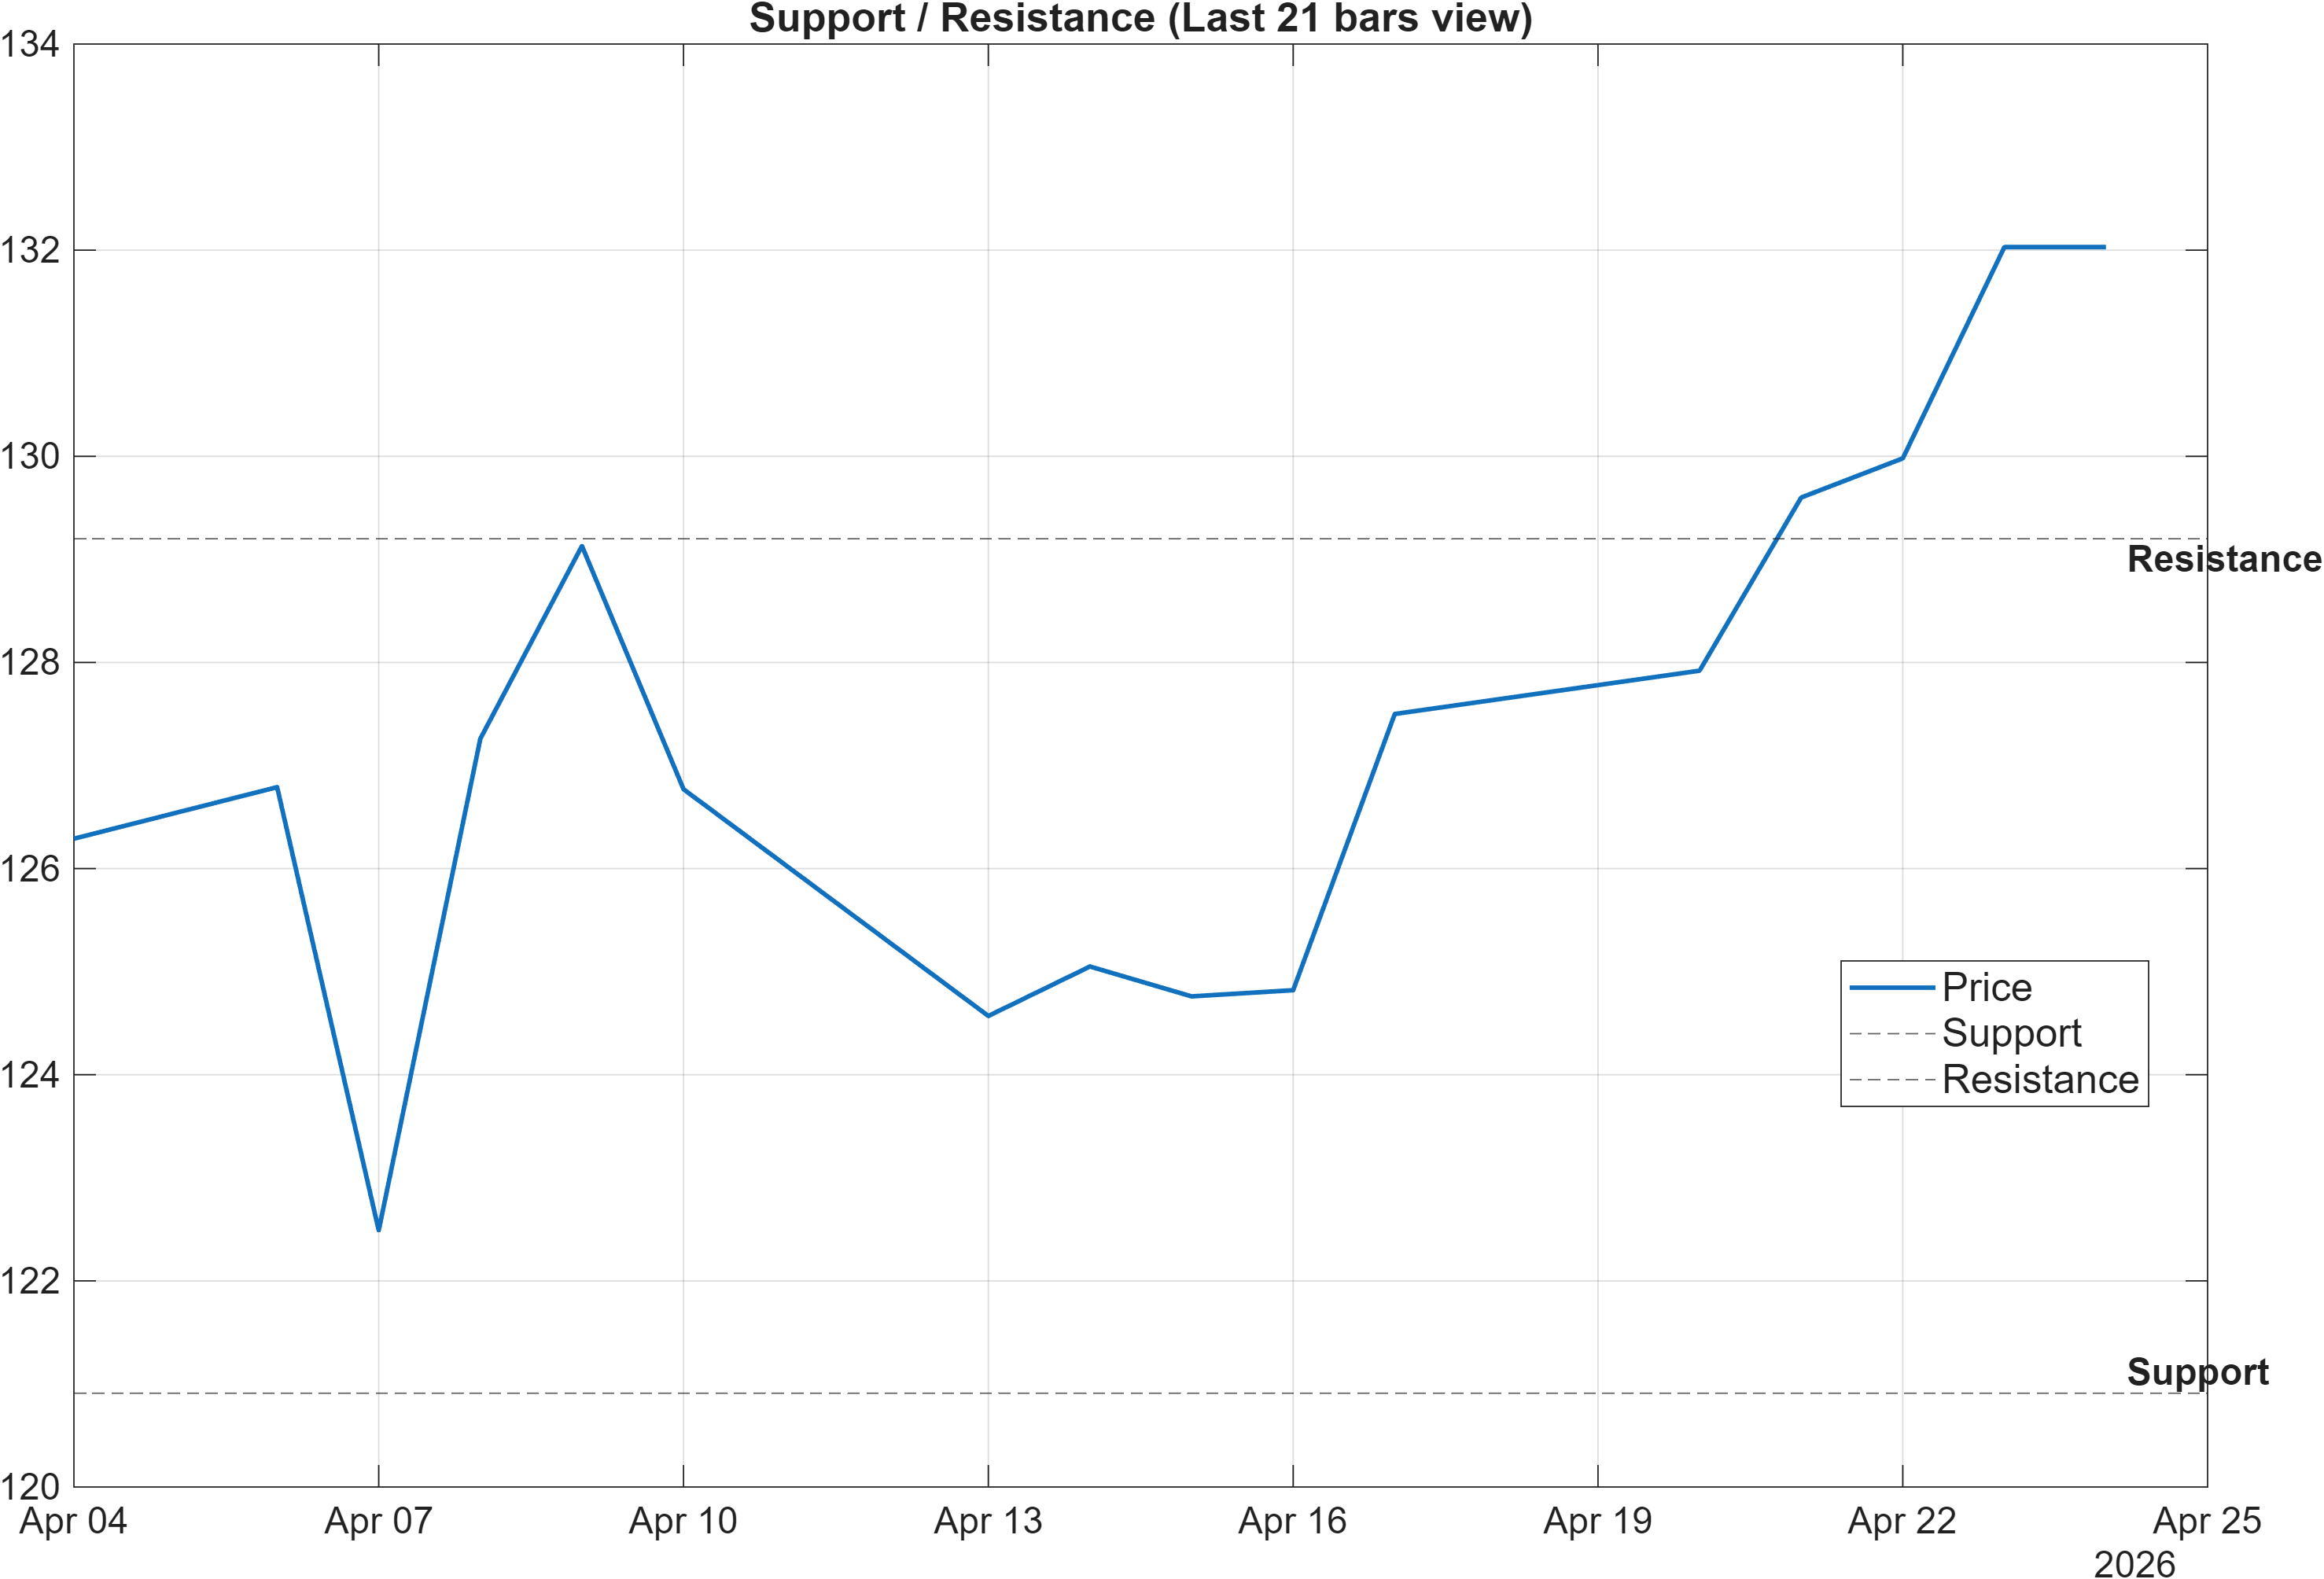
Scenario view: Break above resistance with volume → continuation. Close below support → signal deterioration risk.
The current structure is defined by a fairly tight decision range: support near 120.9100 and resistance near 129.2000. With the broader technical stack bullish (MA alignment and positive MACD histogram at 0.5917), resistance functions less as a “cap” and more as a confirmation threshold—a level where follow-through determines whether trend strength is persisting or pausing.
The bullish confluence reading (Overall technical score 0.754) suggests that pressure is skewed toward testing and potentially resolving above resistance. Yet, elevated RSI(75.68) increases the probability that initial tests of resistance can be met with profit-taking before a cleaner break occurs. That is consistent with a market where level behavior—especially closes relative to these zones—matters more than intraday probes.
On the downside, 120.9100 is not just a “line”; it is the area where the current bullish thesis experiences the most direct stress. A close below that zone would represent deterioration in the structural narrative and likely raise the bar for the supportive ranks (e.g., Weekly #141; Yearly #162) to remain stable.
For positioning discipline, the key is regime validation: sustained acceptance above 129.2000 supports continuation logic, while a close below 120.9100 shifts the discussion toward drawdown containment and signal decay.
5) Quant Technical Dashboard (18 Signals)
KGNAI AI Technical Analysis Score (Deep Reinforcement Learning): Rank #176 out of 2057 (Rank 1 represents the strongest technical positioning and a higher probability of favorable price behavior. As ranks increase toward the maximum, the probability of favorable outcomes weakens and bearish positioning becomes more dominant.) | Label: Bullish | Score: 0.829
18-Signal Technical Confluence Score: 0.722 (Bullish)
Overall Technical Score (18-signal confluence + DRL rank blend): 0.754 (Bullish)
Note: The blended score reflects signal strength weighted against broader AI technical ranking, which may temporarily diverge.
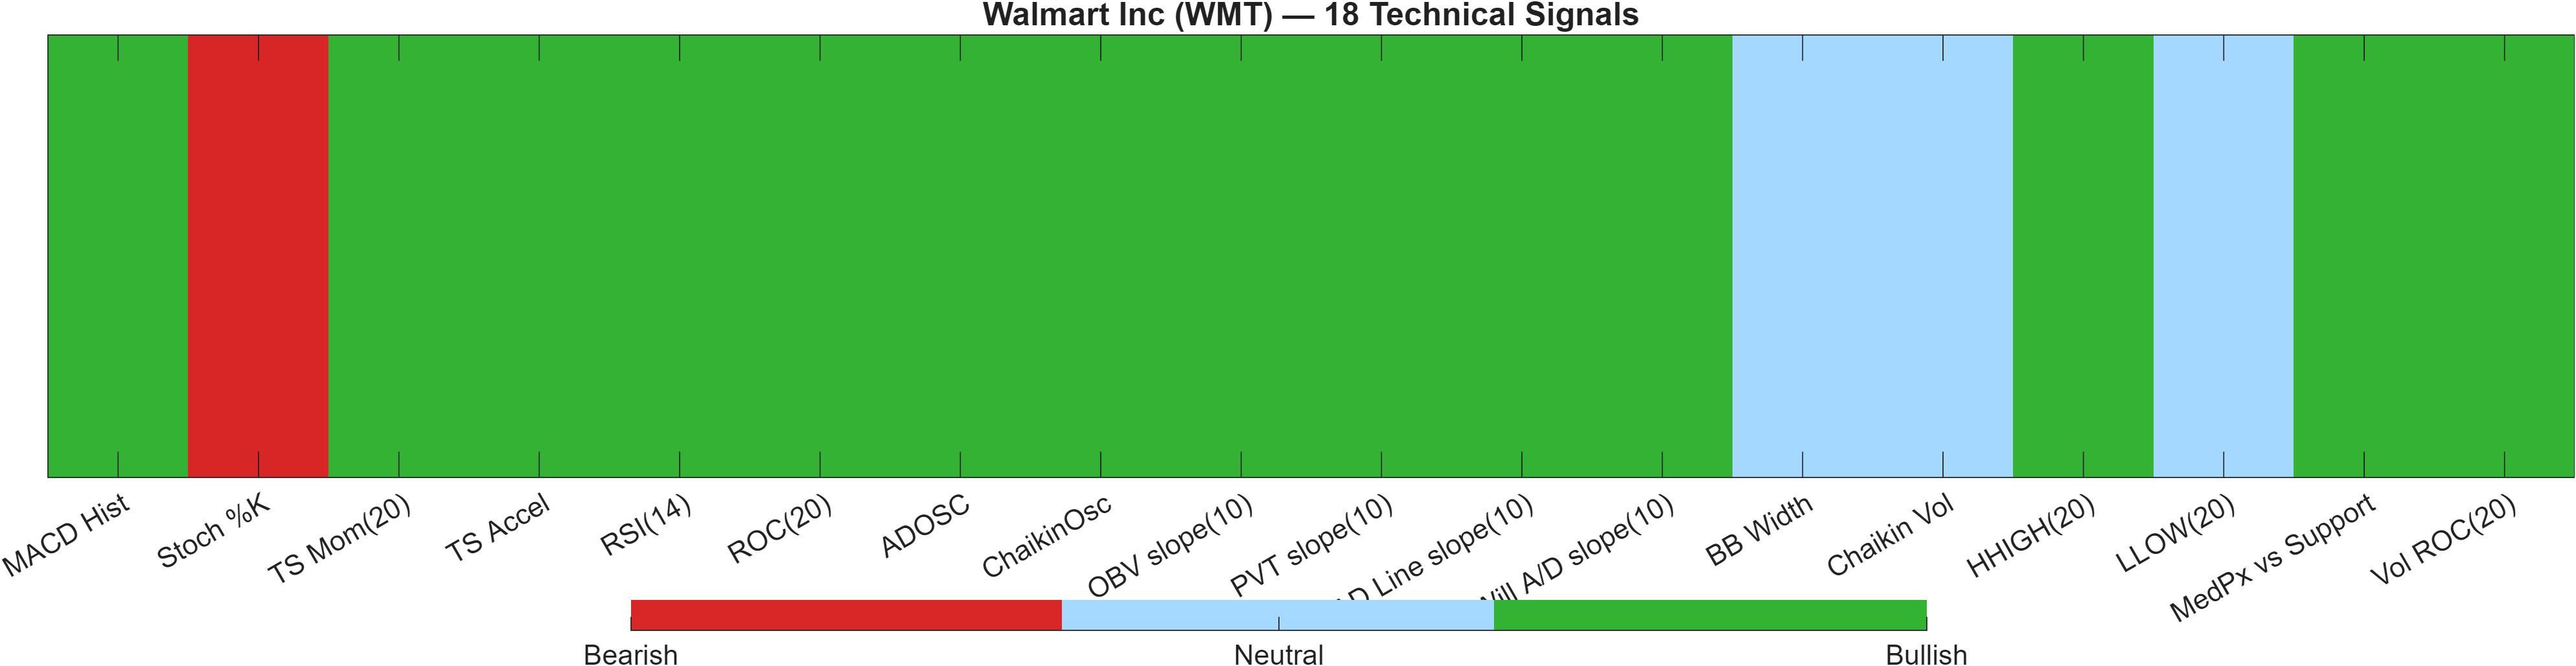
Blended technical score breakdown: 0.754 (Bullish | Bull 14 / Bear 1 / Neutral 3)
Signal alignment vs. late-cycle momentum risk
The dashboard is notable for breadth of agreement. The blended framework remains bullish at 0.754, combining an 18-signal confluence score of 0.722 with a bullish DRL technical rank of #176 (score 0.829). In cross-sectional terms, #176 out of 2057 sits in the upper decile, consistent with the broader rank profile (Weekly #141; Yearly #162).
However, the “how” matters as much as the “what.” The signal mix shows only one bearish reading, and it is concentrated in an oscillator: Stoch %K at 95.37 (Bearish). That configuration often appears in strong uptrends where upside momentum is present but more vulnerable to short-lived pullbacks or sideways digestion, especially when RSI is also elevated (75.68).
The bullish side is supported by both momentum and participation cues: MACD histogram is positive at 0.5917, and volume-sensitive measures (e.g., Vol ROC(20) at 46.94) indicate participation is not absent. Meanwhile, the volatility channel remains relatively neutral (BB Width 0.07773 labeled Neutral), reinforcing the view that the market may be advancing without broad volatility expansion.
Signal compression vs. breakout requirements
With 14 bullish signals and contained volatility, the technical state reads as strong but not necessarily explosive. The practical confirmation remains structural: behavior around 129.2000 should determine whether bullish alignment converts into continuation or rotates into consolidation while the ranks and scores remain supportive.
Signal table (Bull/Bear/Neutral)
| Indicator | Value | Signal |
|---|---|---|
| MACD Hist | 0.5917 | Bullish |
| Stoch %K | 95.37 | Bearish |
| TS Mom(20) | 5.49 | Bullish |
| TS Accel | 4.03 | Bullish |
| RSI(14) | 75.68 | Bullish |
| ROC(20) | 4.339 | Bullish |
| ADOSC | 87.06 | Bullish |
| ChaikinOsc | 2.461e+07 | Bullish |
| OBV slope(10) | 1.4e+08 | Bullish |
| PVT slope(10) | 1.106e+06 | Bullish |
| AD Line slope(10) | 8.578e+07 | Bullish |
| Will A/D slope(10) | 15.31 | Bullish |
| BB Width | 0.07773 | Neutral |
| Chaikin Vol | -9.782 | Neutral |
| HHIGH(20) | 132.5 | Bullish |
| LLOW(20) | 121.3 | Neutral |
| MedPx vs Support | 10.57 | Bullish |
| Vol ROC(20) | 46.94 | Bullish |
Interpretation: Indicator-level signals form the base confluence, which is then adjusted using a separate AI-driven technical ranking model. The final technical score summarizes this combined view.
6) News sentiment + extractive gist
Sentiment score (avg): 0.060 | Positive: 21% | Neutral: 74% | Negative: 5%
KGNAI AI News Sentiment Score (normalized -1 to +1): 0.65 (as of 2026-04-24) | Label: Bullish | Overall news score: 0.69
Positive Developments
Recent coverage across major financial outlets indicates a generally constructive tone around Walmart’s positioning, with narrative emphasis on resilience and operational initiatives. The model-level news read is bullish at 0.65 (overall news score 0.69), which aligns with the technical regime being supportive (Overall technical score 0.754). Even with the average sentiment score only slightly positive at 0.060, the balance of coverage appears to lean toward steady execution themes rather than one-off events. Importantly, the distribution shows 21% positive versus 5% negative, implying that incremental updates tend to land more constructively than critically. In a lower-volatility tape (bandwidth 0.0777), this type of sentiment backdrop often acts as a stabilizer—more about reducing downside narrative pressure than creating immediate upside volatility.
Neutral / Mixed Developments
The dominant feature of the news mix is neutrality, with 74% of items classified as neutral. That is consistent with informational flow—operational updates, comparative commentary, and broad sector context—rather than strongly directional catalysts. In market-structure terms, a neutral-heavy stream often coincides with price action being governed more by technical levels (support 120.9100, resistance 129.2000) and systematic flows than by discrete narrative shocks. This neutrality also helps explain why the average sentiment score remains modest (0.060) even as the normalized score is bullish (0.65): the model detects a positive skew, but the bulk of the content is not overtly emotive.
Negative / Risk Signals
Risk-oriented coverage appears limited but not absent, and the 5% negative share suggests a low-intensity headwind rather than a dominant narrative. Where negative items matter most is in how they interact with an already extended momentum profile—RSI(14) at 75.68 and Stoch %K at 95.37 can amplify sensitivity to unfavorable headlines even when trend remains bullish. In that environment, downside risk is less about a wholesale regime flip and more about tactical pullbacks that test structure. A close below 120.9100 would be the clearest technical condition under which negative coverage could become more price-relevant, particularly if it coincided with weakening participation signals.
What to monitor next
- Whether price acceptance improves above 129.2000 alongside confirming participation.
- Whether sentiment remains model-bullish (0.65) while neutrality (74%) persists or breaks toward more polarized flow.
- Whether any risk-driven stories coincide with momentum cooling (RSI 75.68) and pressure on 120.9100.
Sources referenced: Reuters, Bloomberg, Yahoo Finance, MarketWatch, Investing.com
Snapshot: AI Rank (Short–Mid–Long): Bullish (Bullish–Bullish–Bullish) · Technical Confluence: Bullish · Key Levels: Support ~120.91 | Resistance ~129.20 · News Sentiment: Neutral
7) Sources
- Not available in the provided data.
You may also like: How KGNAI AI ranks instruments across global markets
Disclaimer: KGNAI provides AI-generated analytics and educational market commentary only. This is not financial advice. Markets involve risk. Always do your own research.