
Berkshire Hathaway Inc (BRK-A) — 08-May-2026 Technical Structure Turns Constructive, Mid/Long Ranks Lead
Berkshire Hathaway Inc (BRK-A) enters 08-May-2026 with a generally constructive cross-horizon profile: mid-to-long ranks are stronger than the short-term view, while the technical stack shows a modest bullish bias despite pockets of momentum cooling. In the KGNAI universe of 2054 instruments, the 6-Monthly rank of #78 and 3-Monthly rank of #97 place BRK-A in a comparatively strong cohort, even as the Weekly rank at #509 signals less urgency in the near term. Technically, the blended view remains supportive—Overall Technical Score 0.387 (Bullish)—but the underlying 18-signal confluence is 0.278 (Neutral), implying the bullish tilt is not uniformly confirmed across all indicator groups. Volatility is notably contained with Bollinger Bandwidth near 0.0272, increasing the importance of clearly defined decision zones at 702017.8350 (support) and 741084.3850 (resistance). News sentiment is slightly constructive (normalized score 0.26) but dominated by neutral coverage.
- Rank stance: Short-term Neutral (Daily #152, Weekly #509) | Mid-term Bullish (Monthly #326, 3-Monthly #97) | Long-term Bullish (6-Monthly #78, Yearly #175)
- Technical confluence label: Neutral (0.278) with a Bullish blended technical score (0.387)
- Key levels: Support ~ 702017.8350 | Resistance ~ 741084.3850
- News sentiment bias: Mildly constructive (0.26 normalized; Positive 25%, Neutral 67%, Negative 8%)
- Confirmation / invalidation: Confirmation favors acceptance above 741084.3850 with volume; invalidation risk increases on closes below 702017.8350
What KGNAI Measures
KGNAI evaluates assets using large cross-sectional datasets built from millions of structured data points. Inputs incorporate fundamental metrics, technical structures, and systematically processed news sentiment. Statistical models, machine learning, and AI frameworks are used to assess relative positioning, signal alignment, and probabilistic behavior across broad universes.
How to Read This Report
- Ranks are comparative across the tracked universe, not absolute price targets.
- Confluence reflects alignment among independent signal groups.
- Support/resistance levels are probabilistic decision zones, not guarantees.
- Sentiment provides contextual bias within the broader analytical framework.
1) KGNAI AI Analysis
Region: USA
Total universe size: 2054 ranked instruments
- Daily rank: #152 out of 2054 — Bullish
- Weekly rank: #509 out of 2054 — Neutral
- Monthly rank: #326 out of 2054 — Bullish
- 3-Monthly rank: #97 out of 2054 — Bullish
- 6-Monthly rank: #78 out of 2054 — Bullish
- Yearly rank: #175 out of 2054 — Bullish
The rank stack is best read as a time-horizon consistency check. BRK-A shows a clear improvement as the horizon extends: the 3-Monthly rank of #97 and 6-Monthly rank of #78 sit in the upper cohort of the 2054-instrument universe, which tends to coincide with more stable trend-following behavior than isolated short-term strength. The Yearly rank at #175 reinforces that the longer regime remains constructive rather than purely tactical.
The main divergence is the Weekly rank at #509, which places BRK-A closer to the middle of the universe and supports the stated Short-term: Neutral stance. In practice, this kind of split often appears when price action remains supported structurally, but marginal impulse (or breadth/flow confirmation) is less decisive. The Daily rank #152 is relatively strong, yet the weekly softness argues for treating near-term moves as more sensitive to level-based validation.
Framed as a composite: Short-term Neutral, Mid-term Bullish, Long-term Bullish. The risk in this configuration is not “trend failure” by default; it is timing risk—the possibility that the market requires additional consolidation before the stronger 3–6 month regime reasserts itself. The analytical emphasis therefore shifts toward whether technical indicators and key levels (Sections 2–4) confirm continued acceptance within the prevailing structure.
KGNAI ranks each instrument across large universes using multiple proprietary AI tests and statistical models (millions of data points). Lower ranks generally indicate stronger probability of favorable performance behavior, while higher ranks indicate weaker probability and more bearish positioning.
Term view: Short-term: Neutral. Mid-term: Bullish. Long-term: Bullish.
Want the full universe and complete rank tables? Unlock full access on KGNAI: https://www.kgnai.com/pricing
2) Price & trend overview
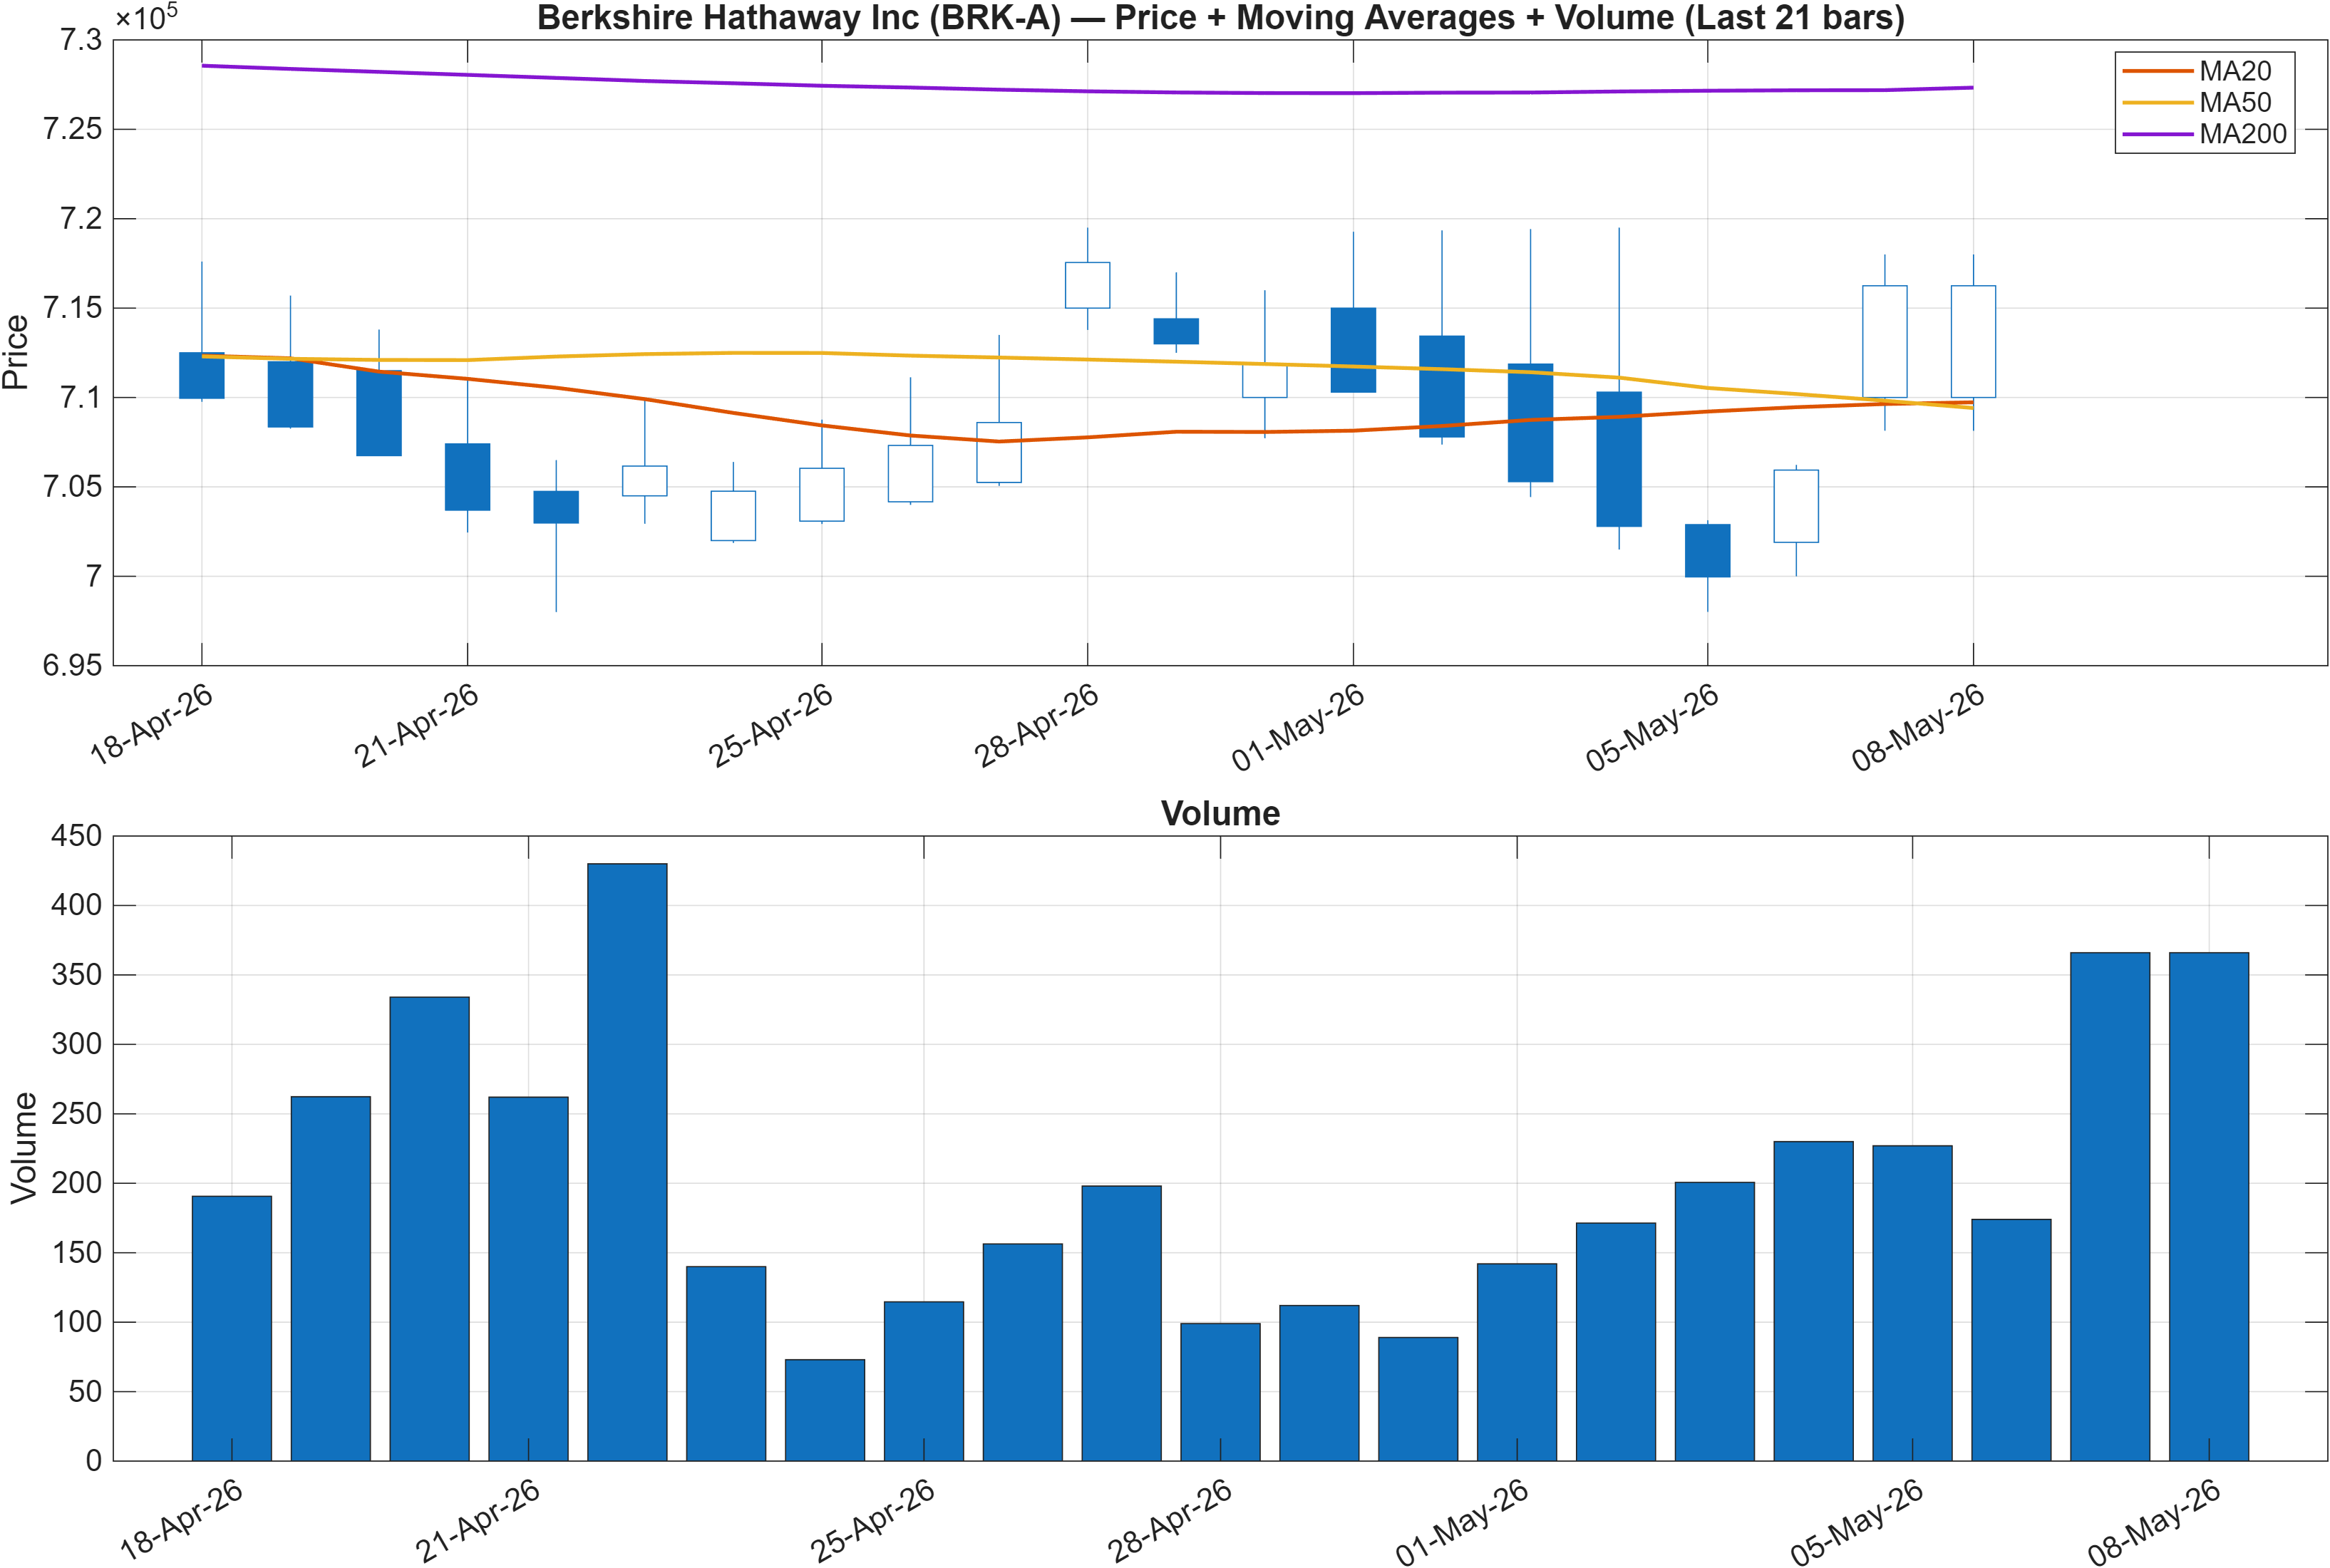
Interpretation: Close vs MA50 = Bullish, MA50 vs MA200 = Bearish.
Trend alignment vs regime friction
The moving-average readout is intentionally split: Close vs MA50 is Bullish, while MA50 vs MA200 is Bearish. This combination typically signals shorter-term strength developing inside a longer-term recovery or transition, rather than a fully synchronized uptrend across timeframes. It also helps explain why the rank picture is stronger in the 3–6 month window (#97, #78) than in the weekly window (#509).
What the split suggests for continuation risk
When price is above the 50-day average but the 50-day remains below the 200-day, the structure can be resilient yet more dependent on maintaining higher lows. In that context, the support zone highlighted later at 702017.8350 becomes more than a tactical line; it functions as a checkpoint for whether the developing up-leg remains intact. Conversely, a clean approach toward the resistance region at 741084.3850 is where the market often “tests” whether the trend can graduate from recovery dynamics into broader acceptance.
Volume and confirmation sensitivity
Because the longer moving-average relationship remains bearish, confirmation tends to be more sensitive to participation. This dovetails with the scenario framework that emphasizes a break above resistance “with volume.” The current backdrop of contained volatility—Bollinger Bandwidth near 0.0272—often precedes expansion phases, but it can also keep price pinned within ranges until a catalyst (technical or sentiment) shifts positioning.
3) Momentum & volatility dashboard
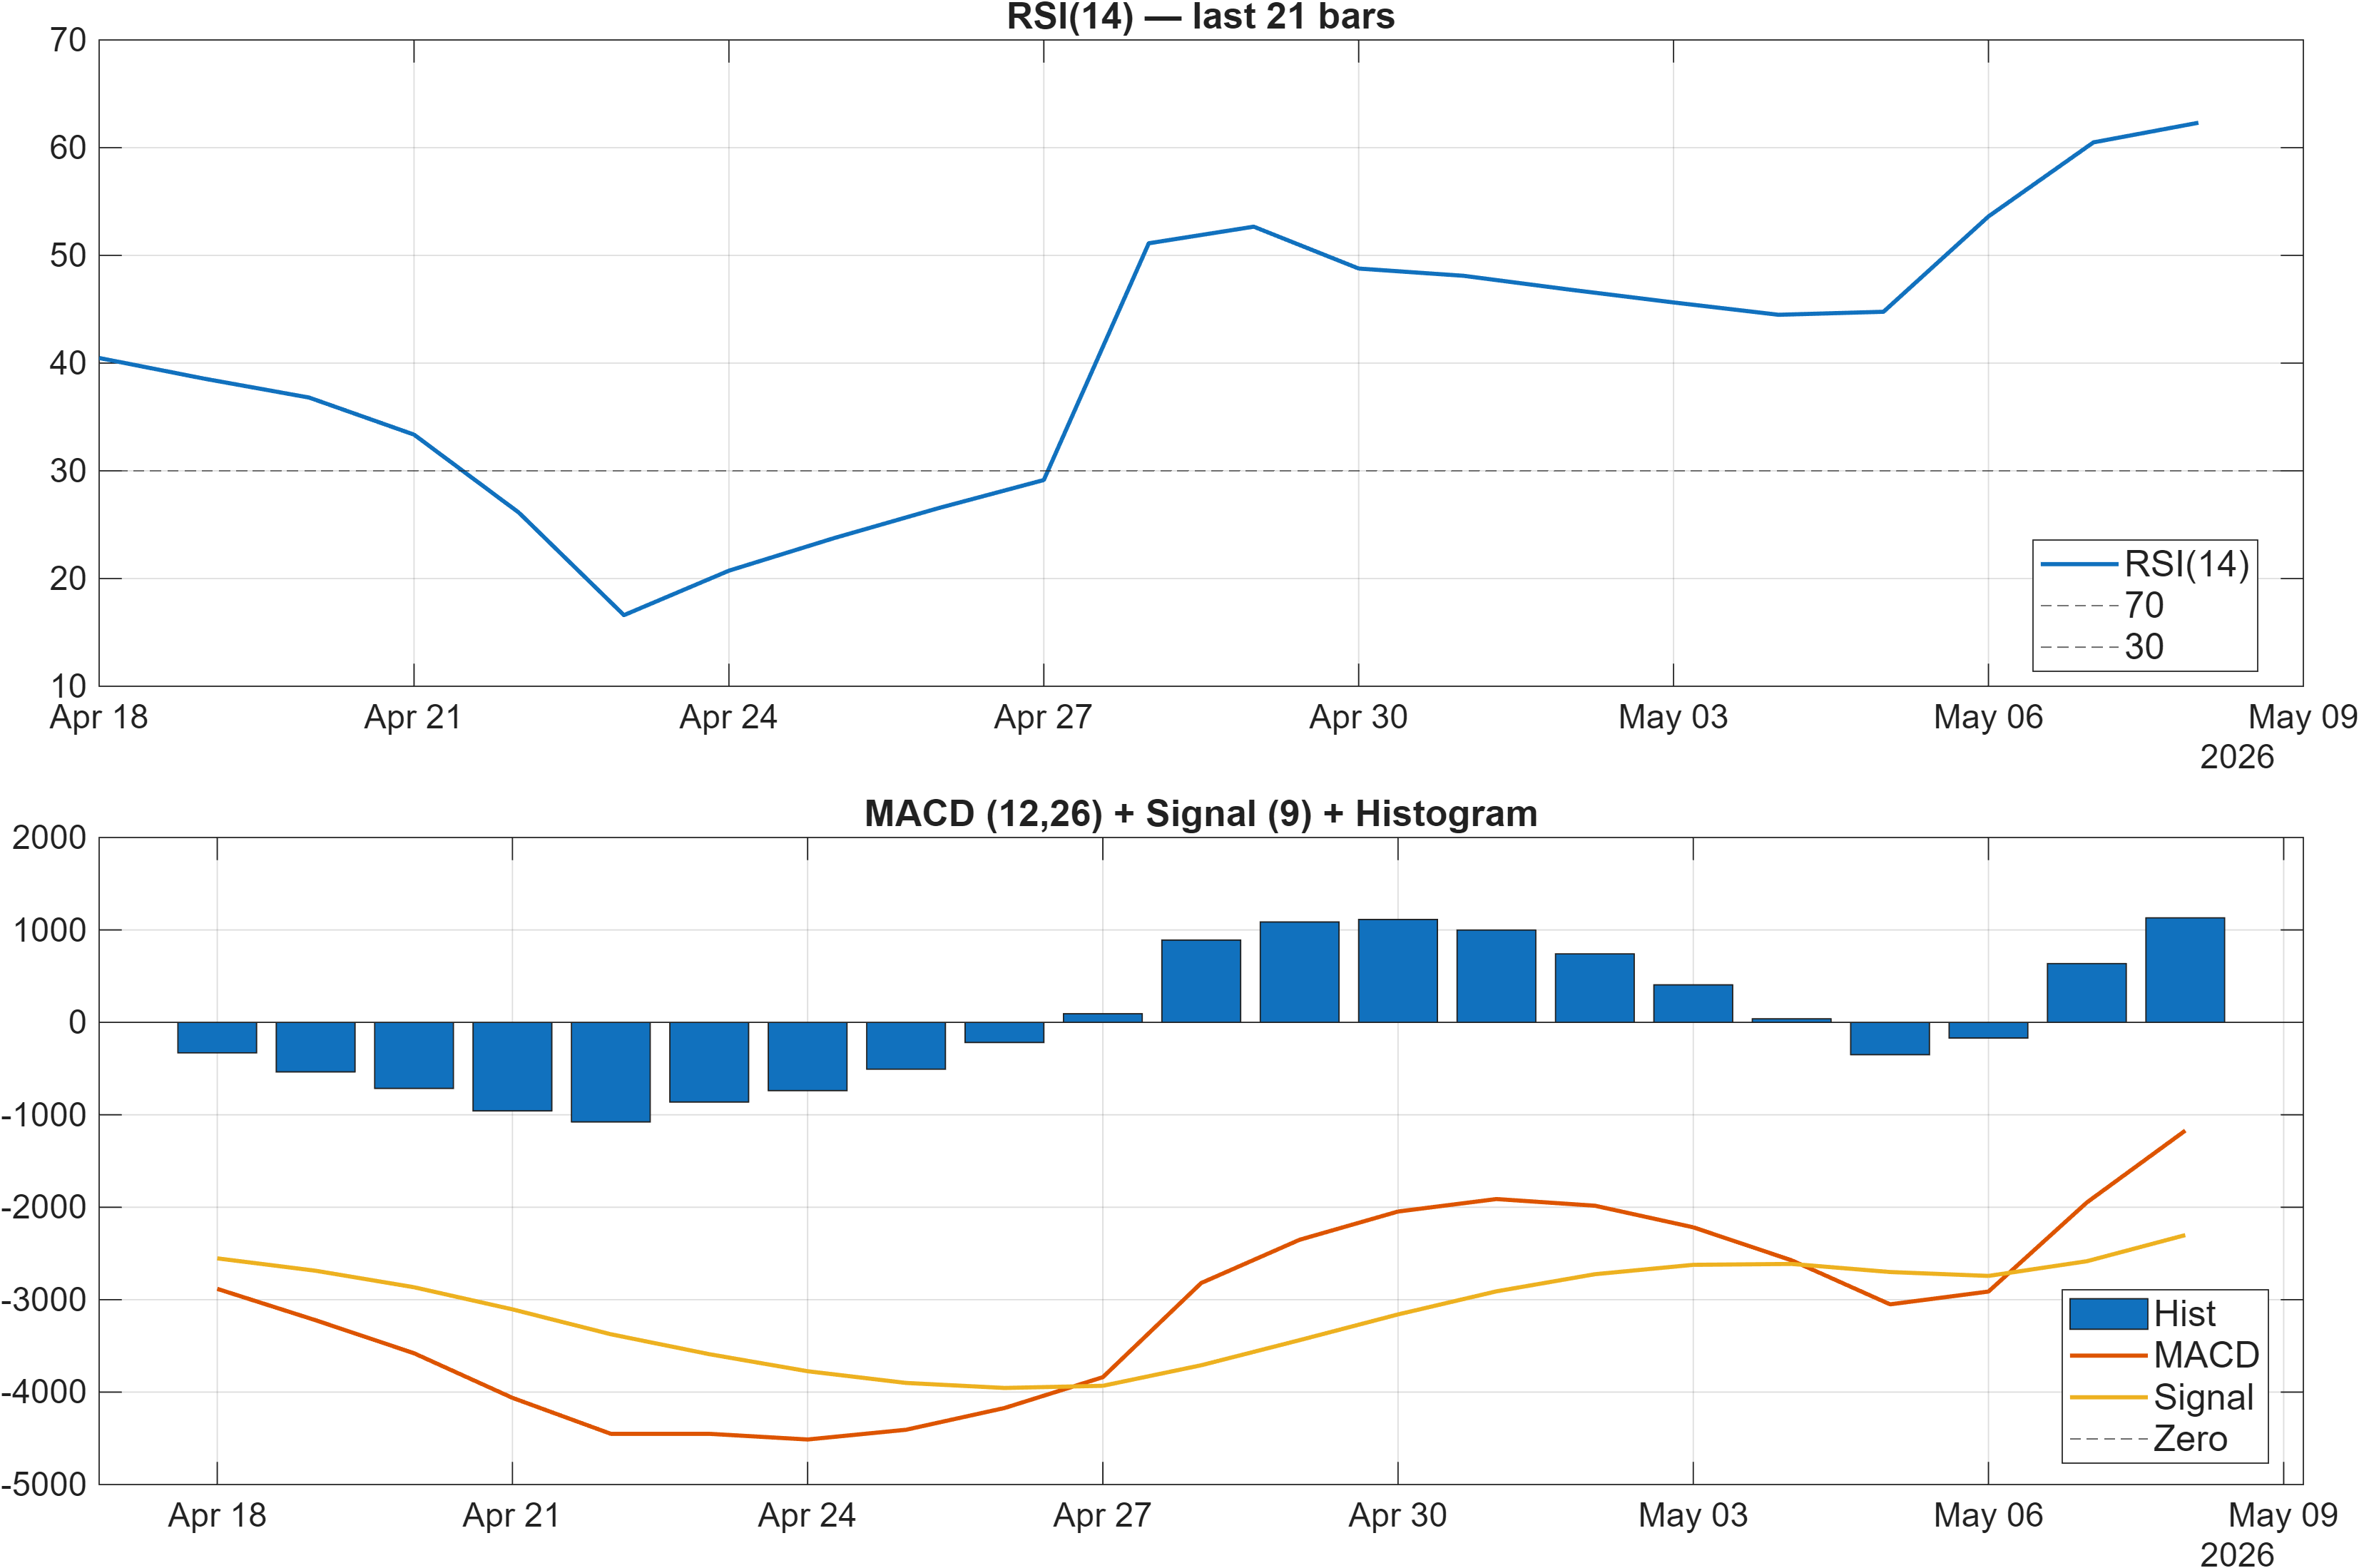
Interpretation: RSI bias = Bullish, MACD hist = 1130.7991.
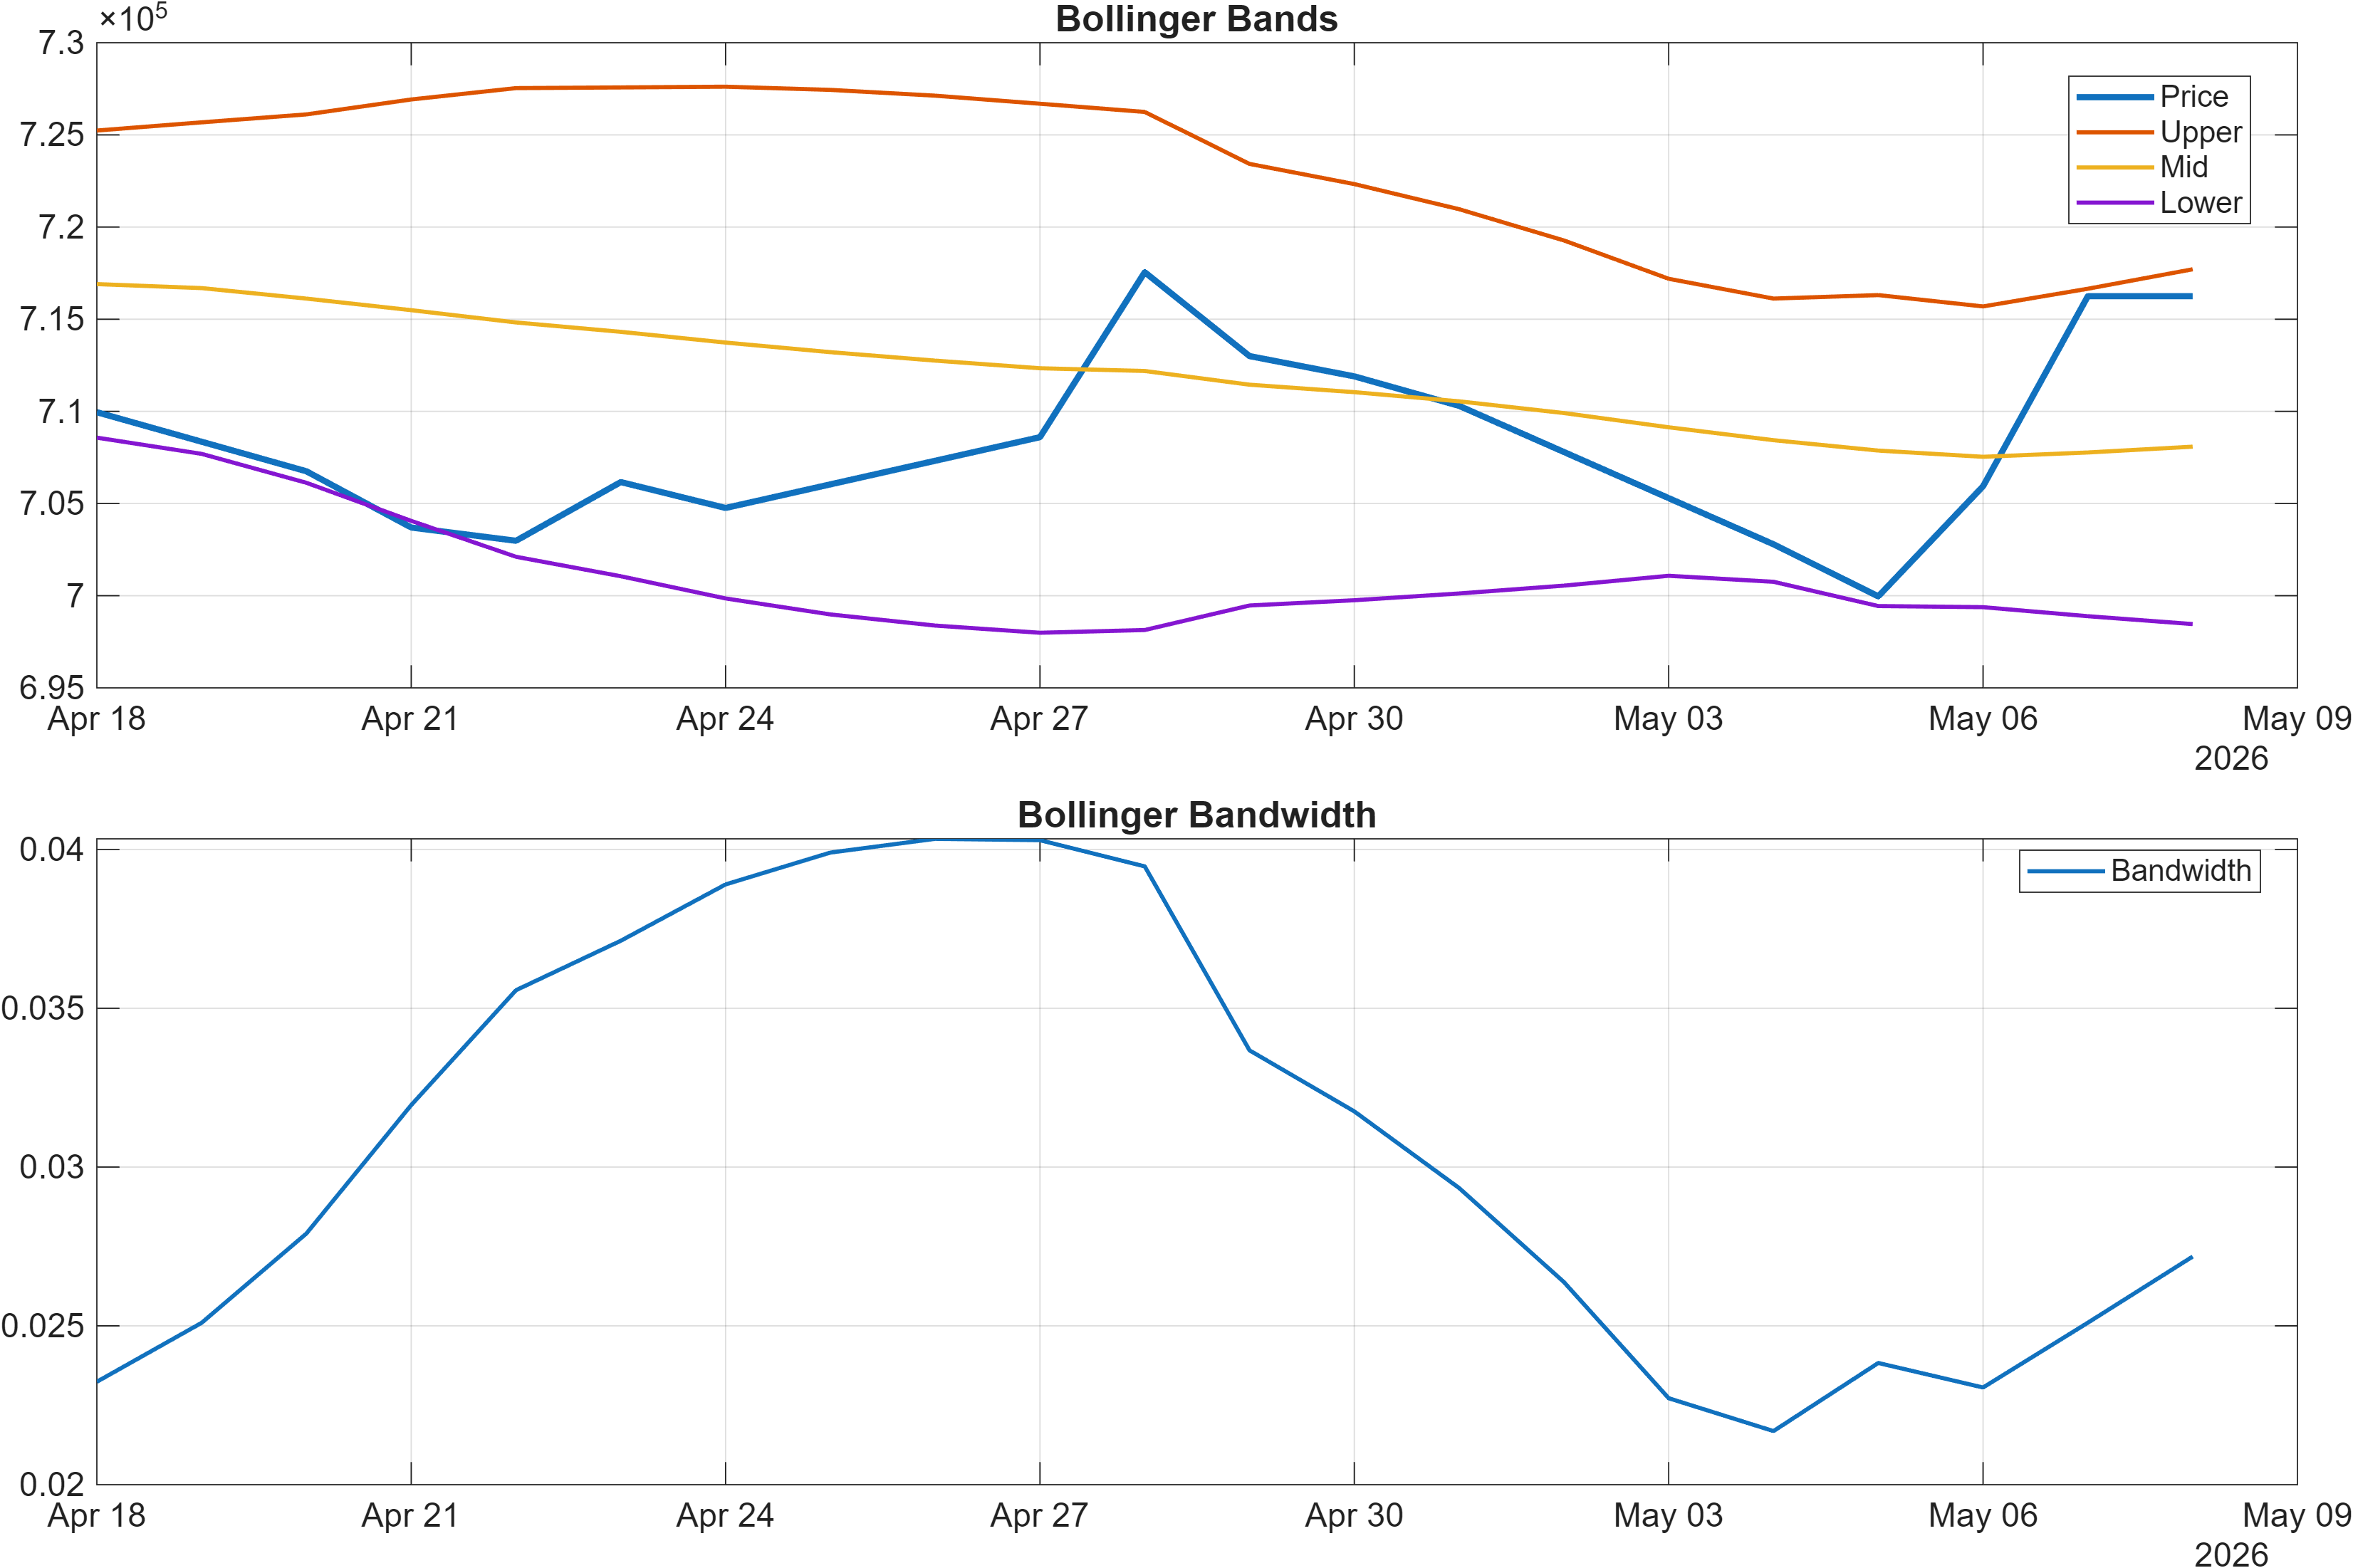
Interpretation: Bandwidth (volatility regime) latest = 0.0272.
Momentum strength vs short-cycle overheating
Momentum readings are directionally supportive: the RSI bias is Bullish, and the MACD histogram remains positive at 1130.7991, both consistent with constructive trend-following conditions. The signal table later corroborates this tone with RSI(14) at 62.31 and MACD Hist at 1131 flagged bullish. Together, these suggest that upside attempts are not purely mean-reversion; the impulse component remains present.
At the same time, the short-cycle picture shows a potential momentum compression risk: Stoch %K at 84.88 is marked bearish, a common sign that near-term price has approached an overbought zone where follow-through can slow even if the larger structure stays intact. This aligns with the weekly rank being less favorable (#509) despite stronger 3–6 month ranks.
Volatility regime: contained, but not directionless
Volatility is notably tight with Bandwidth around 0.0272 (and BB Width shown near 0.02718 as neutral). Low bandwidth does not imply a forecast of breakout; it indicates that price variability is currently compressed, which can amplify the importance of well-defined levels and indicator agreement. In such regimes, trend continuation typically requires a fresh expansion—often reflected in rising bandwidth and sustained MACD support—while failed attempts can show up as momentum divergences against nearby resistance.
4) Support / Resistance zones
Support ~ 702017.8350 | Resistance ~ 741084.3850
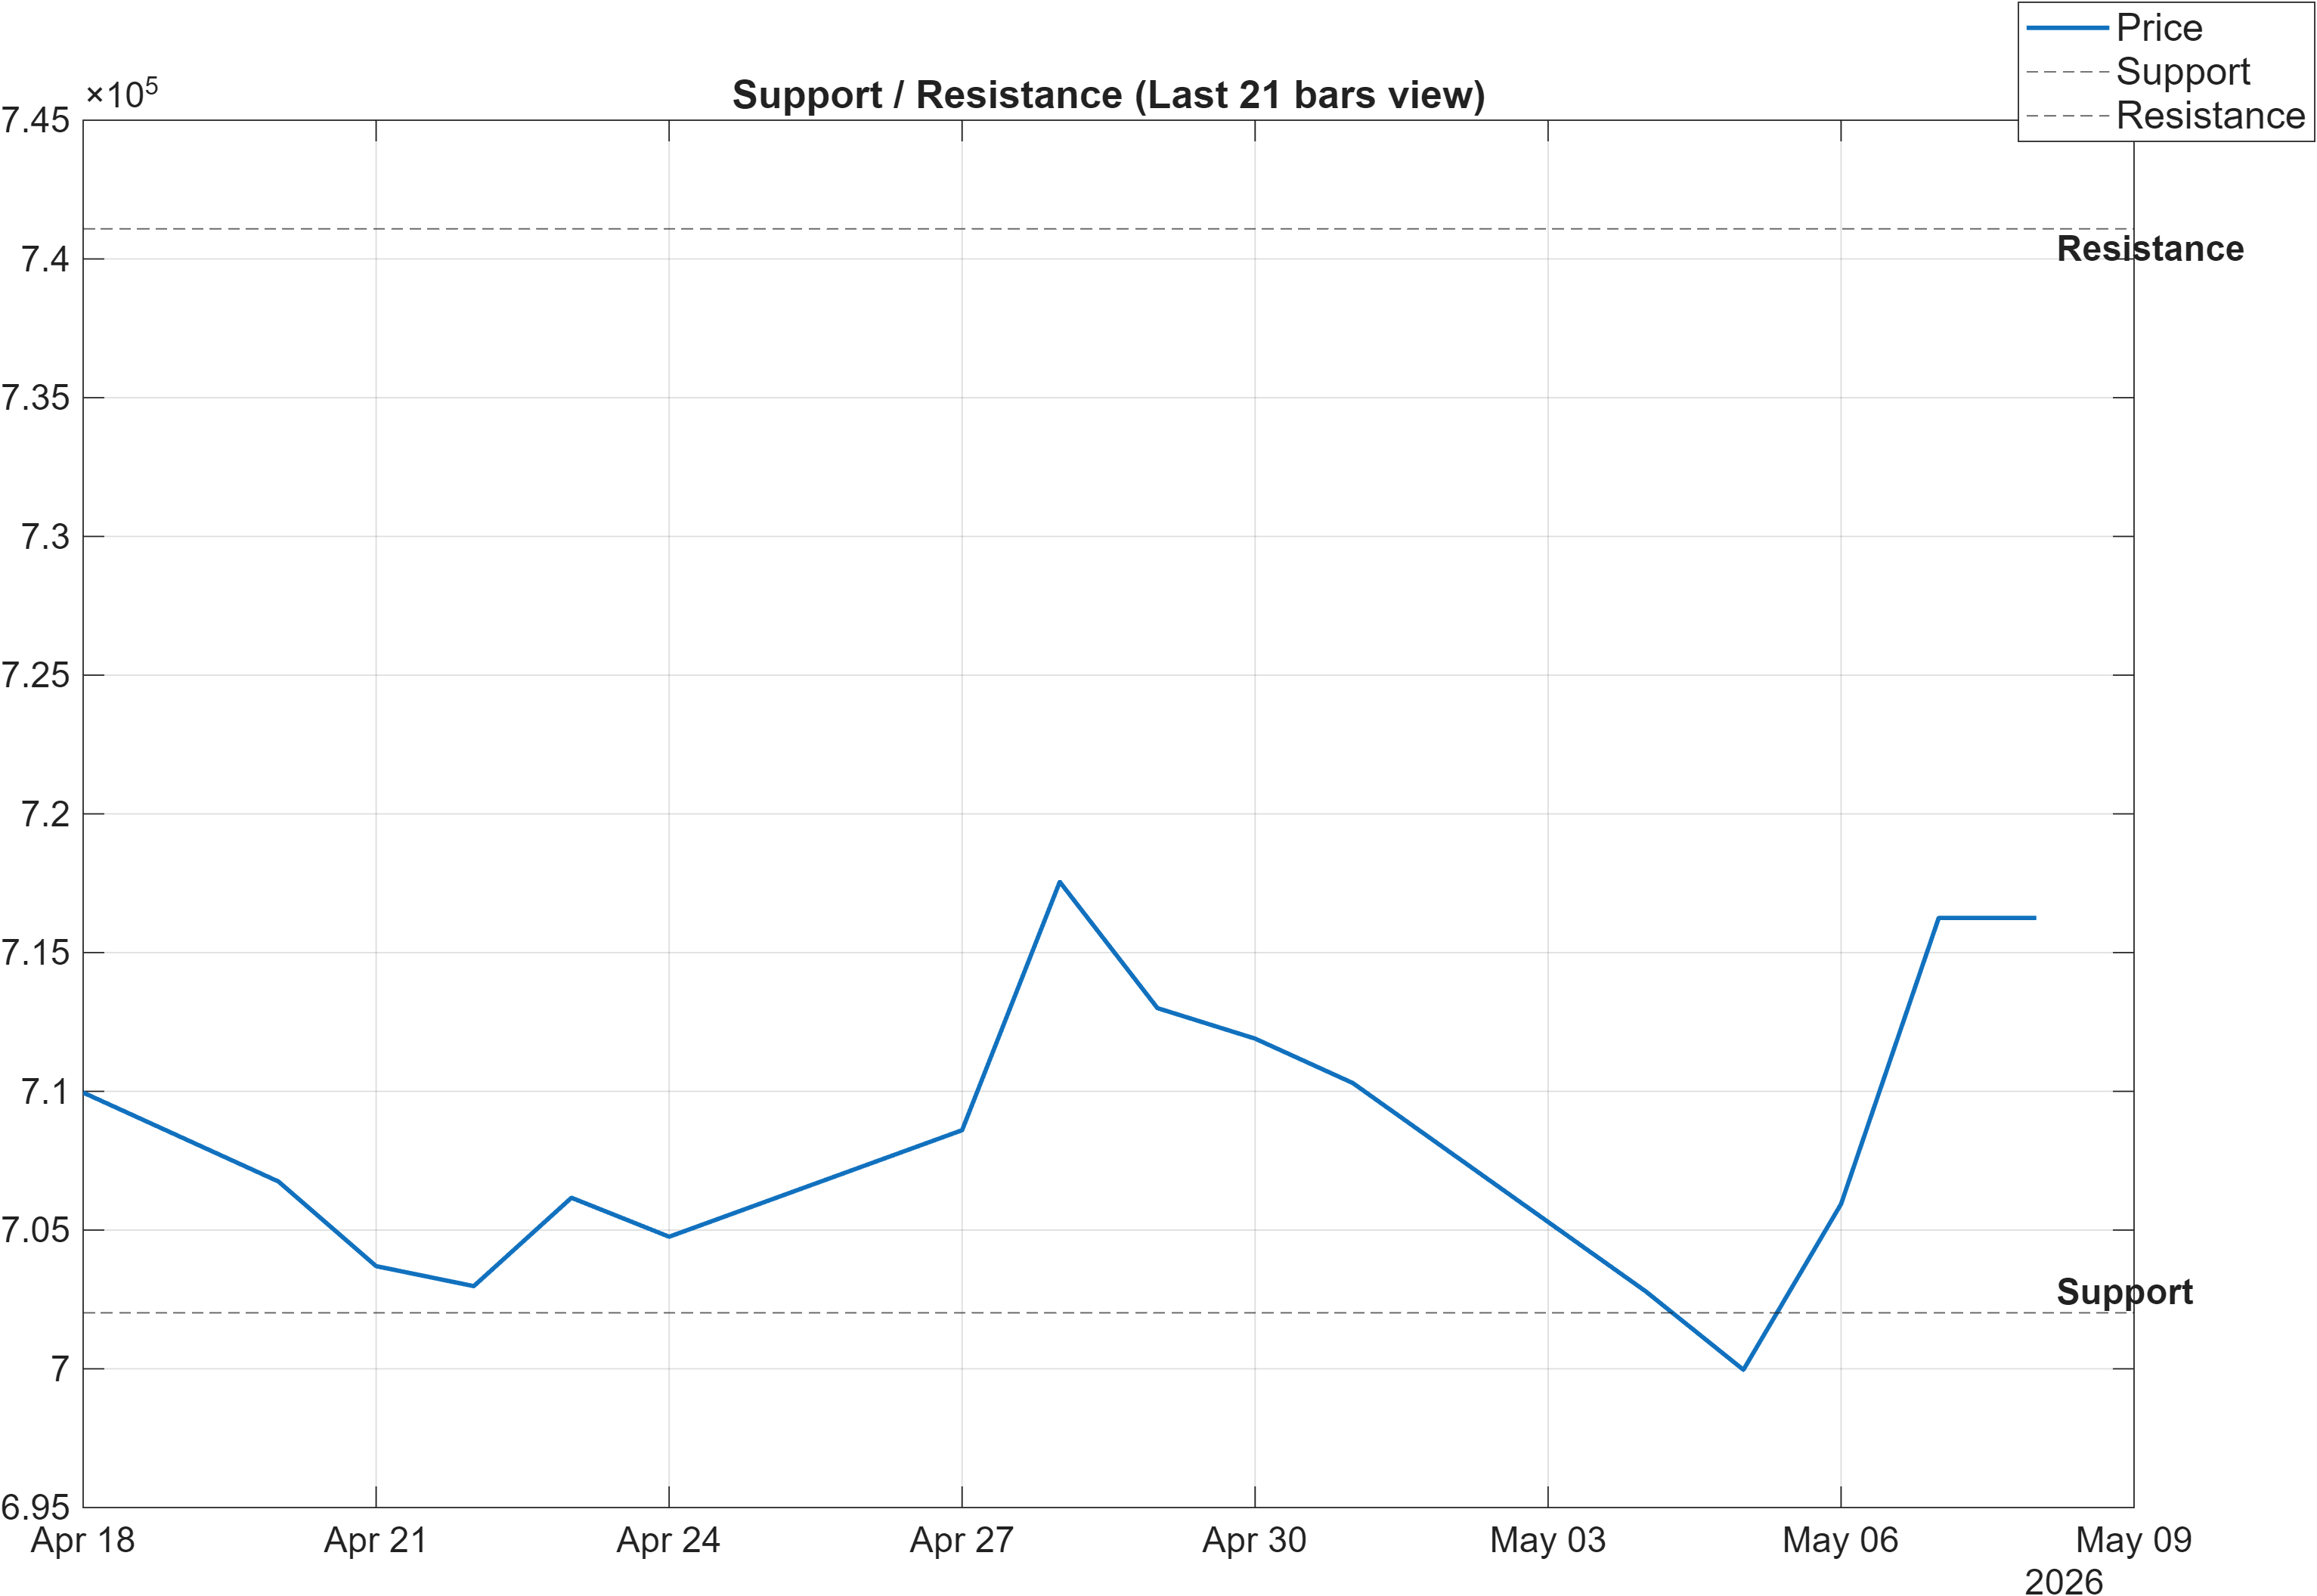
Scenario view: Break above resistance with volume → continuation. Close below support → signal deterioration risk.
Decision zones under low-volatility conditions
With Bollinger Bandwidth near 0.0272, support and resistance become more influential as market-defined decision zones. The support level at 702017.8350 represents the key area where the developing bullish structure would be expected to hold if the mid/long-term ranks (#97, #78) are accurately capturing persistence. In contrast, repeated acceptance below this zone would be consistent with the weekly neutrality (#509) evolving into broader deterioration.
Resistance as a confirmation gate, not a finish line
The resistance band around 741084.3850 should be treated as a confirmation gate for continuation rather than a destination. That framing is reinforced by the mixed moving-average state (close above MA50, but MA50 below MA200): even constructive moves can fail to convert into durable trend if they lack participation. The scenario note explicitly conditions continuation on a break above resistance with volume, consistent with many transition regimes where price must demonstrate sponsorship before the longer-term averages can “catch up.”
Level behavior vs indicator behavior
Indicator momentum (e.g., MACD histogram at 1130.7991 and RSI(14) at 62.31) can remain supportive while price oscillates between these zones. In that case, the more actionable evidence often comes from how price reacts at levels: shallow pullbacks that hold above support suggest trend control, while rejection near resistance paired with weakening momentum would shift the balance of evidence toward consolidation or a failed expansion attempt.
5) Quant Technical Dashboard (18 Signals)
KGNAI AI Technical Analysis Score (Deep Reinforcement Learning): Rank #368 out of 2053 (Rank 1 represents the strongest technical positioning and a higher probability of favorable price behavior. As ranks increase toward the maximum, the probability of favorable outcomes weakens and bearish positioning becomes more dominant.) | Label: Bullish | Score: 0.642
18-Signal Technical Confluence Score: 0.278 (Neutral)
Overall Technical Score (18-signal confluence + DRL rank blend): 0.387 (Bullish)
Note: The blended score reflects signal strength weighted against broader AI technical ranking, which may temporarily diverge.
Blended technical score breakdown: 0.387 (Bullish | Bull 10 / Bear 5 / Neutral 3)
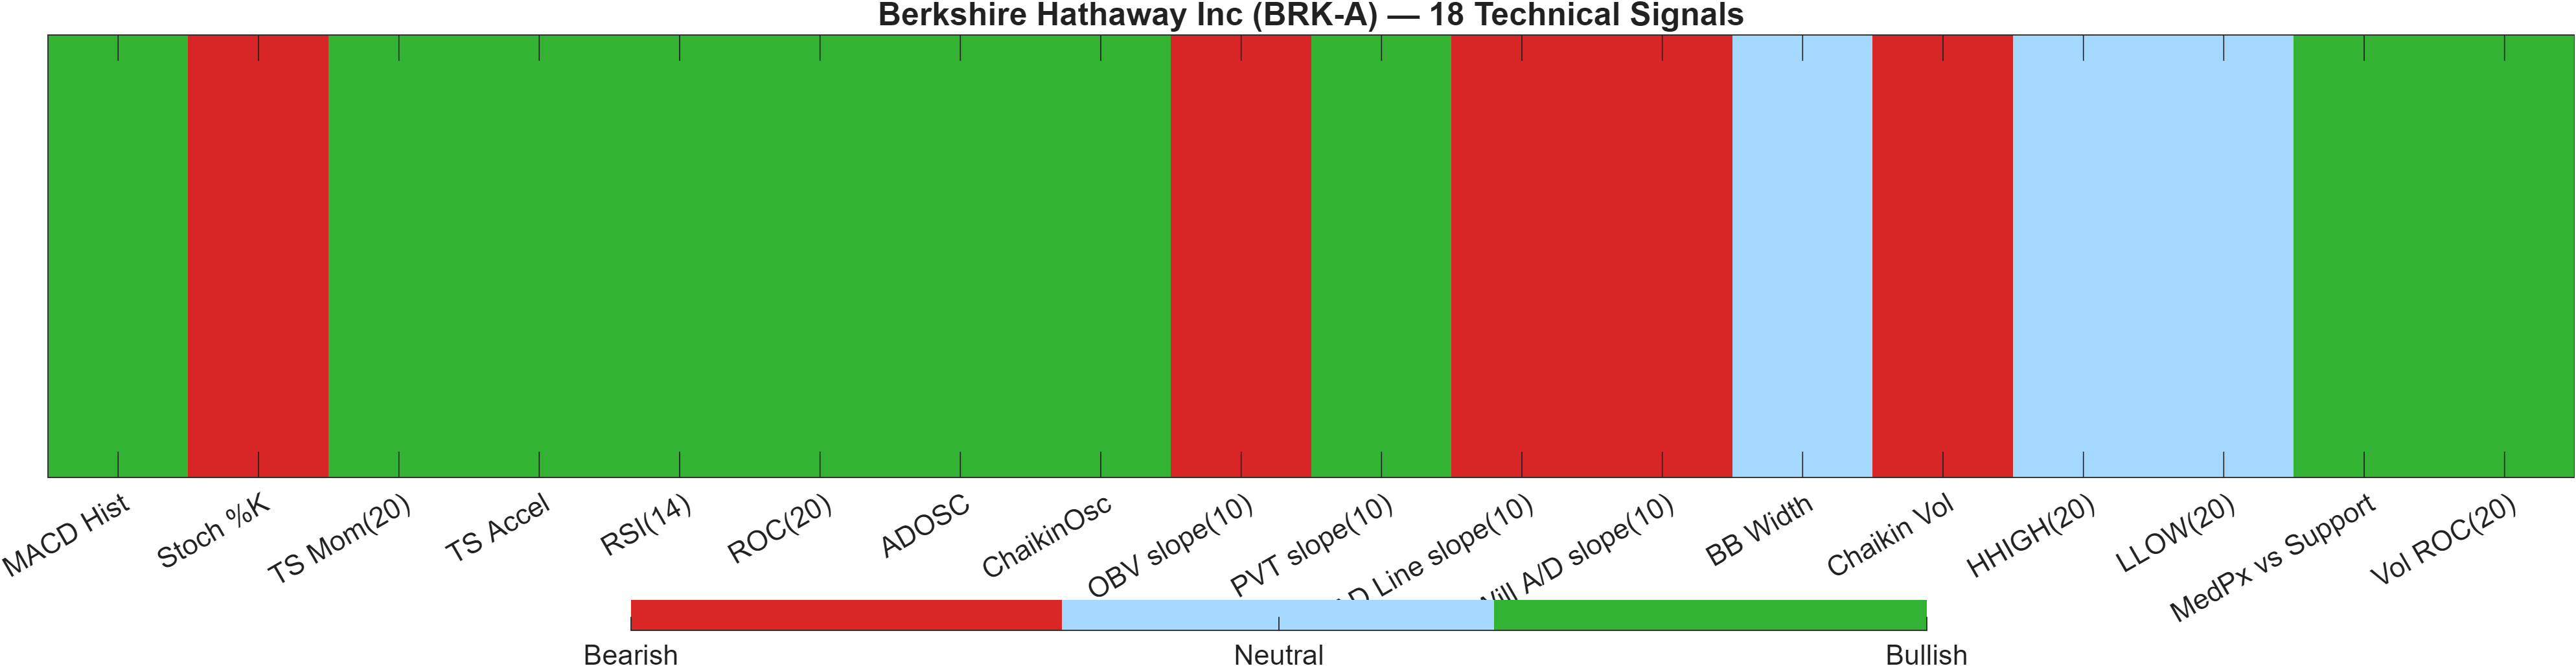
Signal blend: bullish tilt with internal disagreement
The dashboard is best understood as two layers: a discrete 18-signal confluence score and a separate AI technical ranking overlay. Here, the 18-signal confluence is 0.278 (Neutral), while the blended outcome rises to 0.387 (Bullish), supported by a DRL technical rank of #368 out of 2053 with a score of 0.642. That gap signals a mild divergence: the AI rank layer is more constructive than the raw indicator voting.
Where the bullish evidence is concentrated
The bullish side is carried primarily by momentum and rate-of-change style inputs: RSI(14) 62.31 (bullish), ROC(20) 1.115 (bullish), and the MACD histogram (bullish in the table and positive in the momentum panel at 1130.7991). These are consistent with an instrument that is maintaining upside bias and positive impulse, which aligns with the stronger medium-horizon ranks (#97, #78).
Where the caution is coming from
Bearish readings cluster in select flow and short-cycle measures: Stoch %K 84.88 is bearish, and the OBV slope(10) -632 plus AD Line slope(10) -186 reflect weaker participation/breadth characteristics in the recent window. The volatility sleeve is largely non-committal, with BB Width 0.02718 neutral—consistent with a compressed regime that may not reward aggressive directional assumptions until volatility expands.
Interpreting the blended outcome
The blended technical summary (Bull 10 / Bear 5 / Neutral 3) suggests BRK-A is not in a “clean sweep” trend state; it is in a state where continuation is plausible but must be earned through level confirmation and improved participation. That is consistent with the support/resistance framework (support 702017.8350, resistance 741084.3850) acting as the near-term arbiter for whether the bullish tilt strengthens or reverts back toward neutrality.
Signal table (Bull/Bear/Neutral)
| Indicator | Value | Signal |
|---|---|---|
| MACD Hist | 1131 | Bullish |
| Stoch %K | 84.88 | Bearish |
| TS Mom(20) | 7897 | Bullish |
| TS Accel | 1.768e+04 | Bullish |
| RSI(14) | 62.31 | Bullish |
| ROC(20) | 1.115 | Bullish |
| ADOSC | 81.69 | Bullish |
| ChaikinOsc | 7.935 | Bullish |
| OBV slope(10) | -632 | Bearish |
| PVT slope(10) | 2.622 | Bullish |
| AD Line slope(10) | -186 | Bearish |
| Will A/D slope(10) | -4.69e+04 | Bearish |
| BB Width | 0.02718 | Neutral |
| Chaikin Vol | 46.46 | Bearish |
| HHIGH(20) | 7.195e+05 | Neutral |
| LLOW(20) | 6.98e+05 | Neutral |
| MedPx vs Support | 1.105e+04 | Bullish |
| Vol ROC(20) | 39.52 | Bullish |
Interpretation: Indicator-level signals form the base confluence, which is then adjusted using a separate AI-driven technical ranking model. The final technical score summarizes this combined view.
6) News sentiment + extractive gist
Sentiment score (avg): 0.073 | Positive: 25% | Neutral: 67% | Negative: 8%
KGNAI AI News Sentiment Score (normalized -1 to +1): 0.26 (as of 2026-05-07) | Label: Bullish | Overall news score: 0.46
Positive Developments
Recent coverage across major financial outlets indicates a mildly constructive narrative around Berkshire’s operating performance and capital posture. The news signal is Bullish on a normalized basis (0.26 as of 2026-05-07), while the distribution skews heavily neutral but retains a meaningful positive slice (25% positive vs 8% negative). Reported commentary emphasizes the visibility created by the first full-quarter period under Greg Abel and highlights renewed capital actions such as buybacks alongside a continued focus on disciplined deployment. In sentiment terms, this is the kind of backdrop that can support a trend-following technical stance without necessarily forcing a near-term breakout—consistent with technicals that are bullish on blend (0.387) but neutral on pure confluence (0.278). The constructive angle is therefore best read as a contextual tailwind rather than a stand-alone driver.
Neutral / Mixed Developments
A large portion of the feed remains informational (67% neutral), reflecting corporate and subsidiary-level updates that carry ambiguous market implications. Items linked to operations and technology adoption themes can be directionally interesting but often require follow-through in measurable performance before influencing price behavior. This neutrality matches the current technical environment of contained volatility (Bandwidth near 0.0272): when markets are quiet, neutral coverage tends to reinforce range behavior rather than catalyze expansion. In that setting, the more actionable input remains the interaction with decision zones—support at 702017.8350 and resistance at 741084.3850—and whether momentum indicators (RSI bias bullish; MACD histogram positive at 1130.7991) maintain their current posture.
Negative / Risk Signals
The negative slice is comparatively small (8%), but the risk tone clusters around broader market caution and the interpretive question of what elevated cash posture implies. Even when fundamentals are framed positively in the news cycle, risk narratives can translate into shorter-term hesitation—an effect that can show up as weekly rank softness (Weekly #509) and short-cycle overextension signals such as Stoch %K 84.88 (bearish). From a positioning perspective, this is less a “bear case” than a reminder that the market may require clearer confirmation through price/volume behavior at resistance. If risk narratives intensify while price fails to sustain progress, the probability of consolidation rises even if the mid/long technical tilt remains intact.
- Whether news sentiment stays supportive (normalized score holding near 0.26) as price tests 741084.3850.
- Any improvement in participation proxies alongside trend (e.g., reversal of bearish OBV slope(10) at -632).
- Volatility expansion from the compressed regime (Bandwidth near 0.0272) coinciding with a directional break.
Sources referenced: Reuters, Bloomberg, Yahoo Finance, MarketWatch, Investing.com
Snapshot: AI Rank (Short–Mid–Long): Mixed (Bullish tilt) (Neutral–Bullish–Bullish) · Technical Confluence: Neutral · Key Levels: Support ~702017.83 | Resistance ~741084.39 · News Sentiment: Neutral
7) Sources
Not available in the provided data.
You may also like: How KGNAI AI ranks instruments across global markets
Disclaimer: KGNAI provides AI-generated analytics and educational market commentary only. This is not financial advice. Markets involve risk. Always do your own research.