
GLOB (Globant SA) — 10-May-2026 Technicals Bearish While KGNAI Ranks Stay Bullish
AI-Based Technical, Rank & Sentiment Analysis
Globant SA (GLOB) enters 10-May-2026 with a notable cross-signal split: KGNAI’s multi-horizon ranks remain Bullish across short-, mid-, and long-term windows, while the technical confluence framework is Bearish. The monthly rank sits at #4 (top-decile), but the blended technical read is pressured by weak momentum and trend structure—RSI(14) at 23.32 and MACD histogram at -0.1230 reflect downside momentum, alongside a Bearish moving-average configuration (close vs MA50 and MA50 vs MA200). Volatility conditions are not extreme but remain active, with Bollinger Bandwidth at 0.2672. Key decision levels are well-defined: support near 39.5885 and resistance near 50.8125. News sentiment is slightly positive on balance (avg 0.096; normalized score 0.97), adding a supportive bias—yet price structure still requires confirmation.
Key Takeaways
- Rank stance: Short Bullish | Mid Bullish | Long Bullish (monthly rank #4; daily #151 out of 2053)
- Technical confluence: Bearish (18-signal confluence -0.500; overall technical score -0.618)
- Key levels: Support 39.5885 | Resistance 50.8125
- News sentiment bias: Neutral overall framing with bullish skew in normalized score (0.97)
- Confirmation / invalidation: A sustained move above 50.8125 with volume supports continuation; a close below 39.5885 elevates deterioration risk.
What KGNAI Measures
KGNAI evaluates assets using large cross-sectional datasets built from millions of structured data points. Inputs incorporate fundamental metrics, technical structures, and systematically processed news sentiment. Statistical models, machine learning, and AI frameworks are used to assess relative positioning, signal alignment, and probabilistic behavior across broad universes.
How to Read This Report
- Ranks are comparative across the tracked universe, not absolute price targets.
- Confluence reflects alignment among independent signal groups.
- Support/resistance levels are probabilistic decision zones, not guarantees.
- Sentiment provides contextual bias within the broader analytical framework.
1) KGNAI AI Analysis
Region: USA
Total universe size: 2053 ranked instruments
- Daily rank: #151 out of 2053 — Bullish
- Weekly rank: #106 out of 2053 — Bullish
- Monthly rank: #4 out of 2053 — Bullish
- 3-Monthly rank: #21 out of 2053 — Bullish
- 6-Monthly rank: #43 out of 2053 — Bullish
- Yearly rank: #81 out of 2053 — Bullish
The rank curve is consistently constructive across timeframes, with the monthly rank at #4 placing GLOB in the top decile of the 2053-instrument universe. The 3-month and 6-month ranks (#21 and #43) reinforce that the broader regime classification remains favorable even as shorter windows show mild slippage (daily #151, weekly #106). This pattern is often associated with longer-horizon relative strength persisting while shorter-horizon price action digests volatility or recent drawdown.
The key analytical tension is that the rank system is designed to be cross-sectional and probabilistic, while the technical stack later in the report reflects current tape condition. When a top-decile monthly rank coexists with weak near-term momentum readings (e.g., MACD histogram -0.1230 and RSI(14) 23.32), it can indicate that the instrument is still positioned relatively well versus peers, but the timing layer is unfavorable. In practice, this tends to shift the focus from “directional conviction” to verification thresholds (levels, trend filters, and participation).
The stated term view remains Bullish across short-, mid-, and long-term horizons, but the more actionable question becomes whether the current pullback resolves into stabilization (support holds near 39.5885) or extends into a deeper technical reset. This is a rank/technical divergence worth monitoring rather than assuming immediate convergence.
Want the full universe and complete rank tables? Unlock full access on KGNAI: https://www.kgnai.com/pricing
2) Price & trend overview
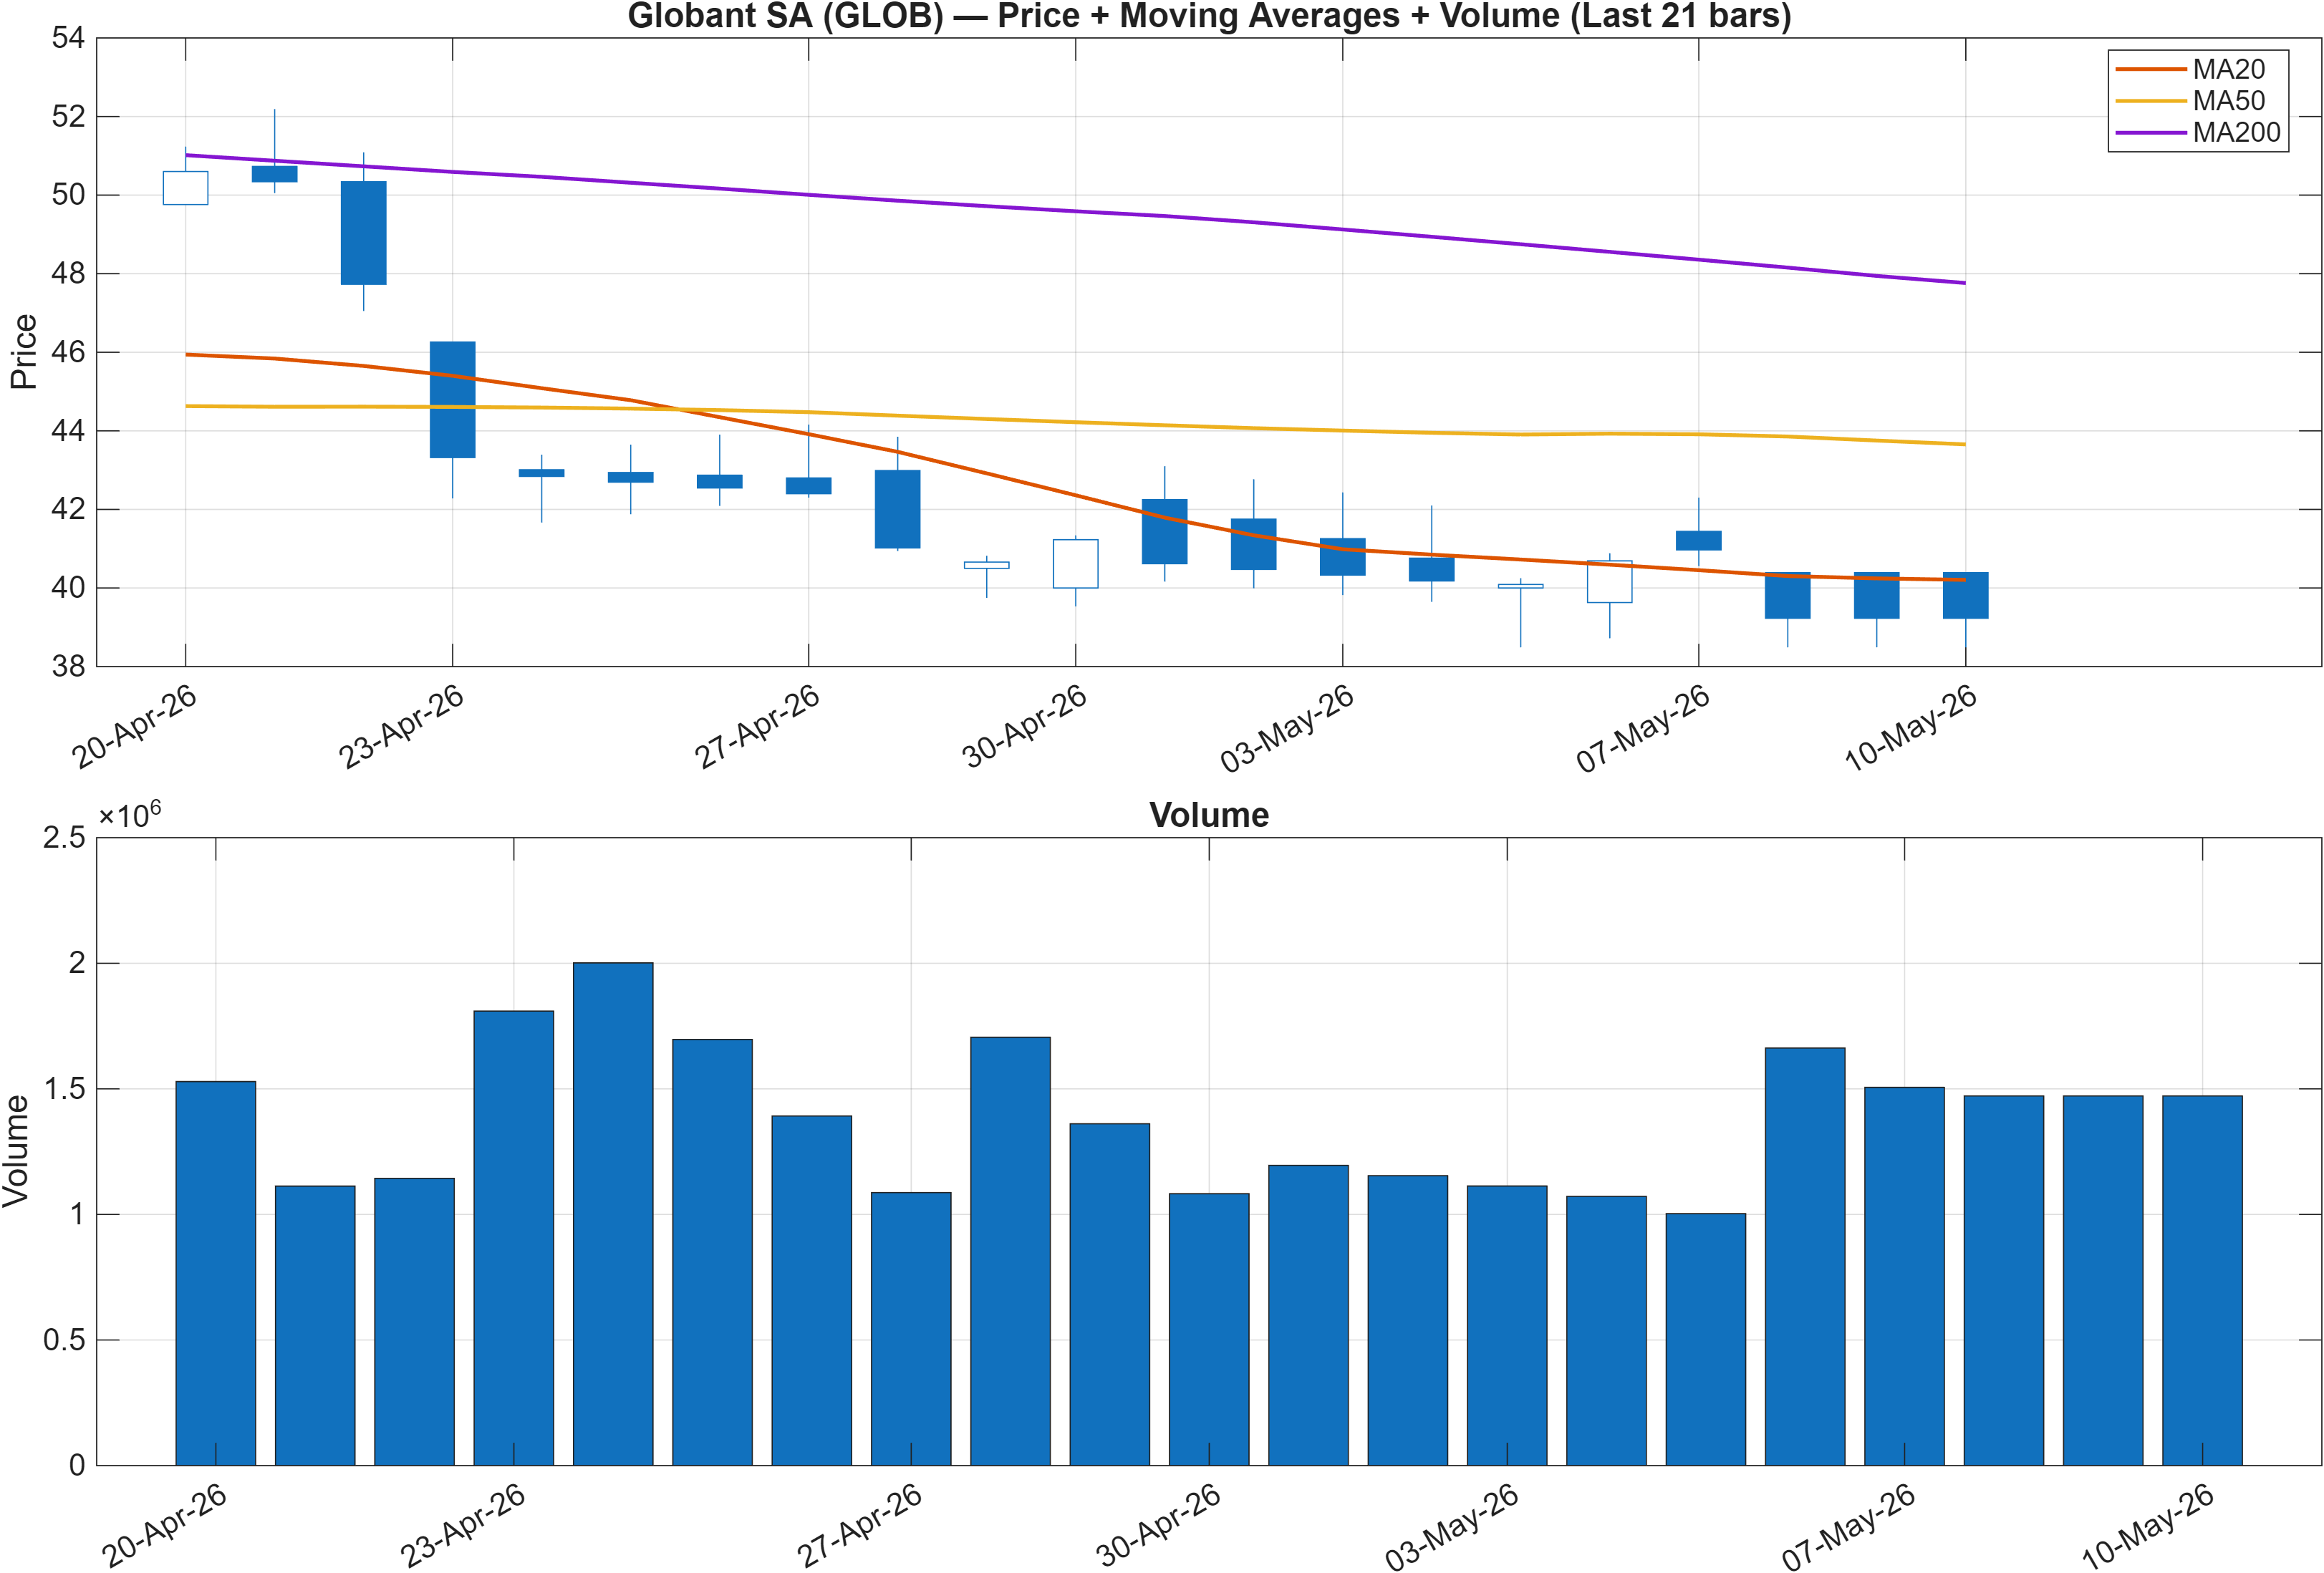
Trend structure is currently flagged as negative on two common filters: close vs MA50 = Bearish and MA50 vs MA200 = Bearish. That combination typically characterizes a market in a downtrend or late-stage correction, where rebounds can occur but require stronger confirmation before the trend label improves. In this context, the top-decile monthly rank (#4) is best read as a relative feature—GLOB may be behaving better than many peers even while its own trend filters remain weak.
The most important implication is path dependency: trend-following systems tend to respond slowly after a drawdown, and they often need evidence of stabilization (sideways base) or a higher-low sequence before moving-average relationships improve. The nearby support at 39.5885 matters because if price holds and compresses, it can shift the moving-average slope and reduce the “gap” between spot and MA50 over time. Conversely, continued weakness below that zone would likely keep the MA stack bearish and reinforce the negative bias already seen in momentum (MACD histogram -0.1230).
Participation also matters when reconciling rank strength with trend weakness. The signal set later includes a positive Vol ROC(20) = 32.26, which can be consistent with higher activity during an inflection window; however, volume expansion without trend repair can also reflect distribution. For the trend read to improve, the market generally needs to translate participation into price acceptance above resistance near 50.8125, rather than brief intraday spikes.
Interpretation: Close vs MA50 = Bearish, MA50 vs MA200 = Bearish.
3) Momentum & volatility dashboard
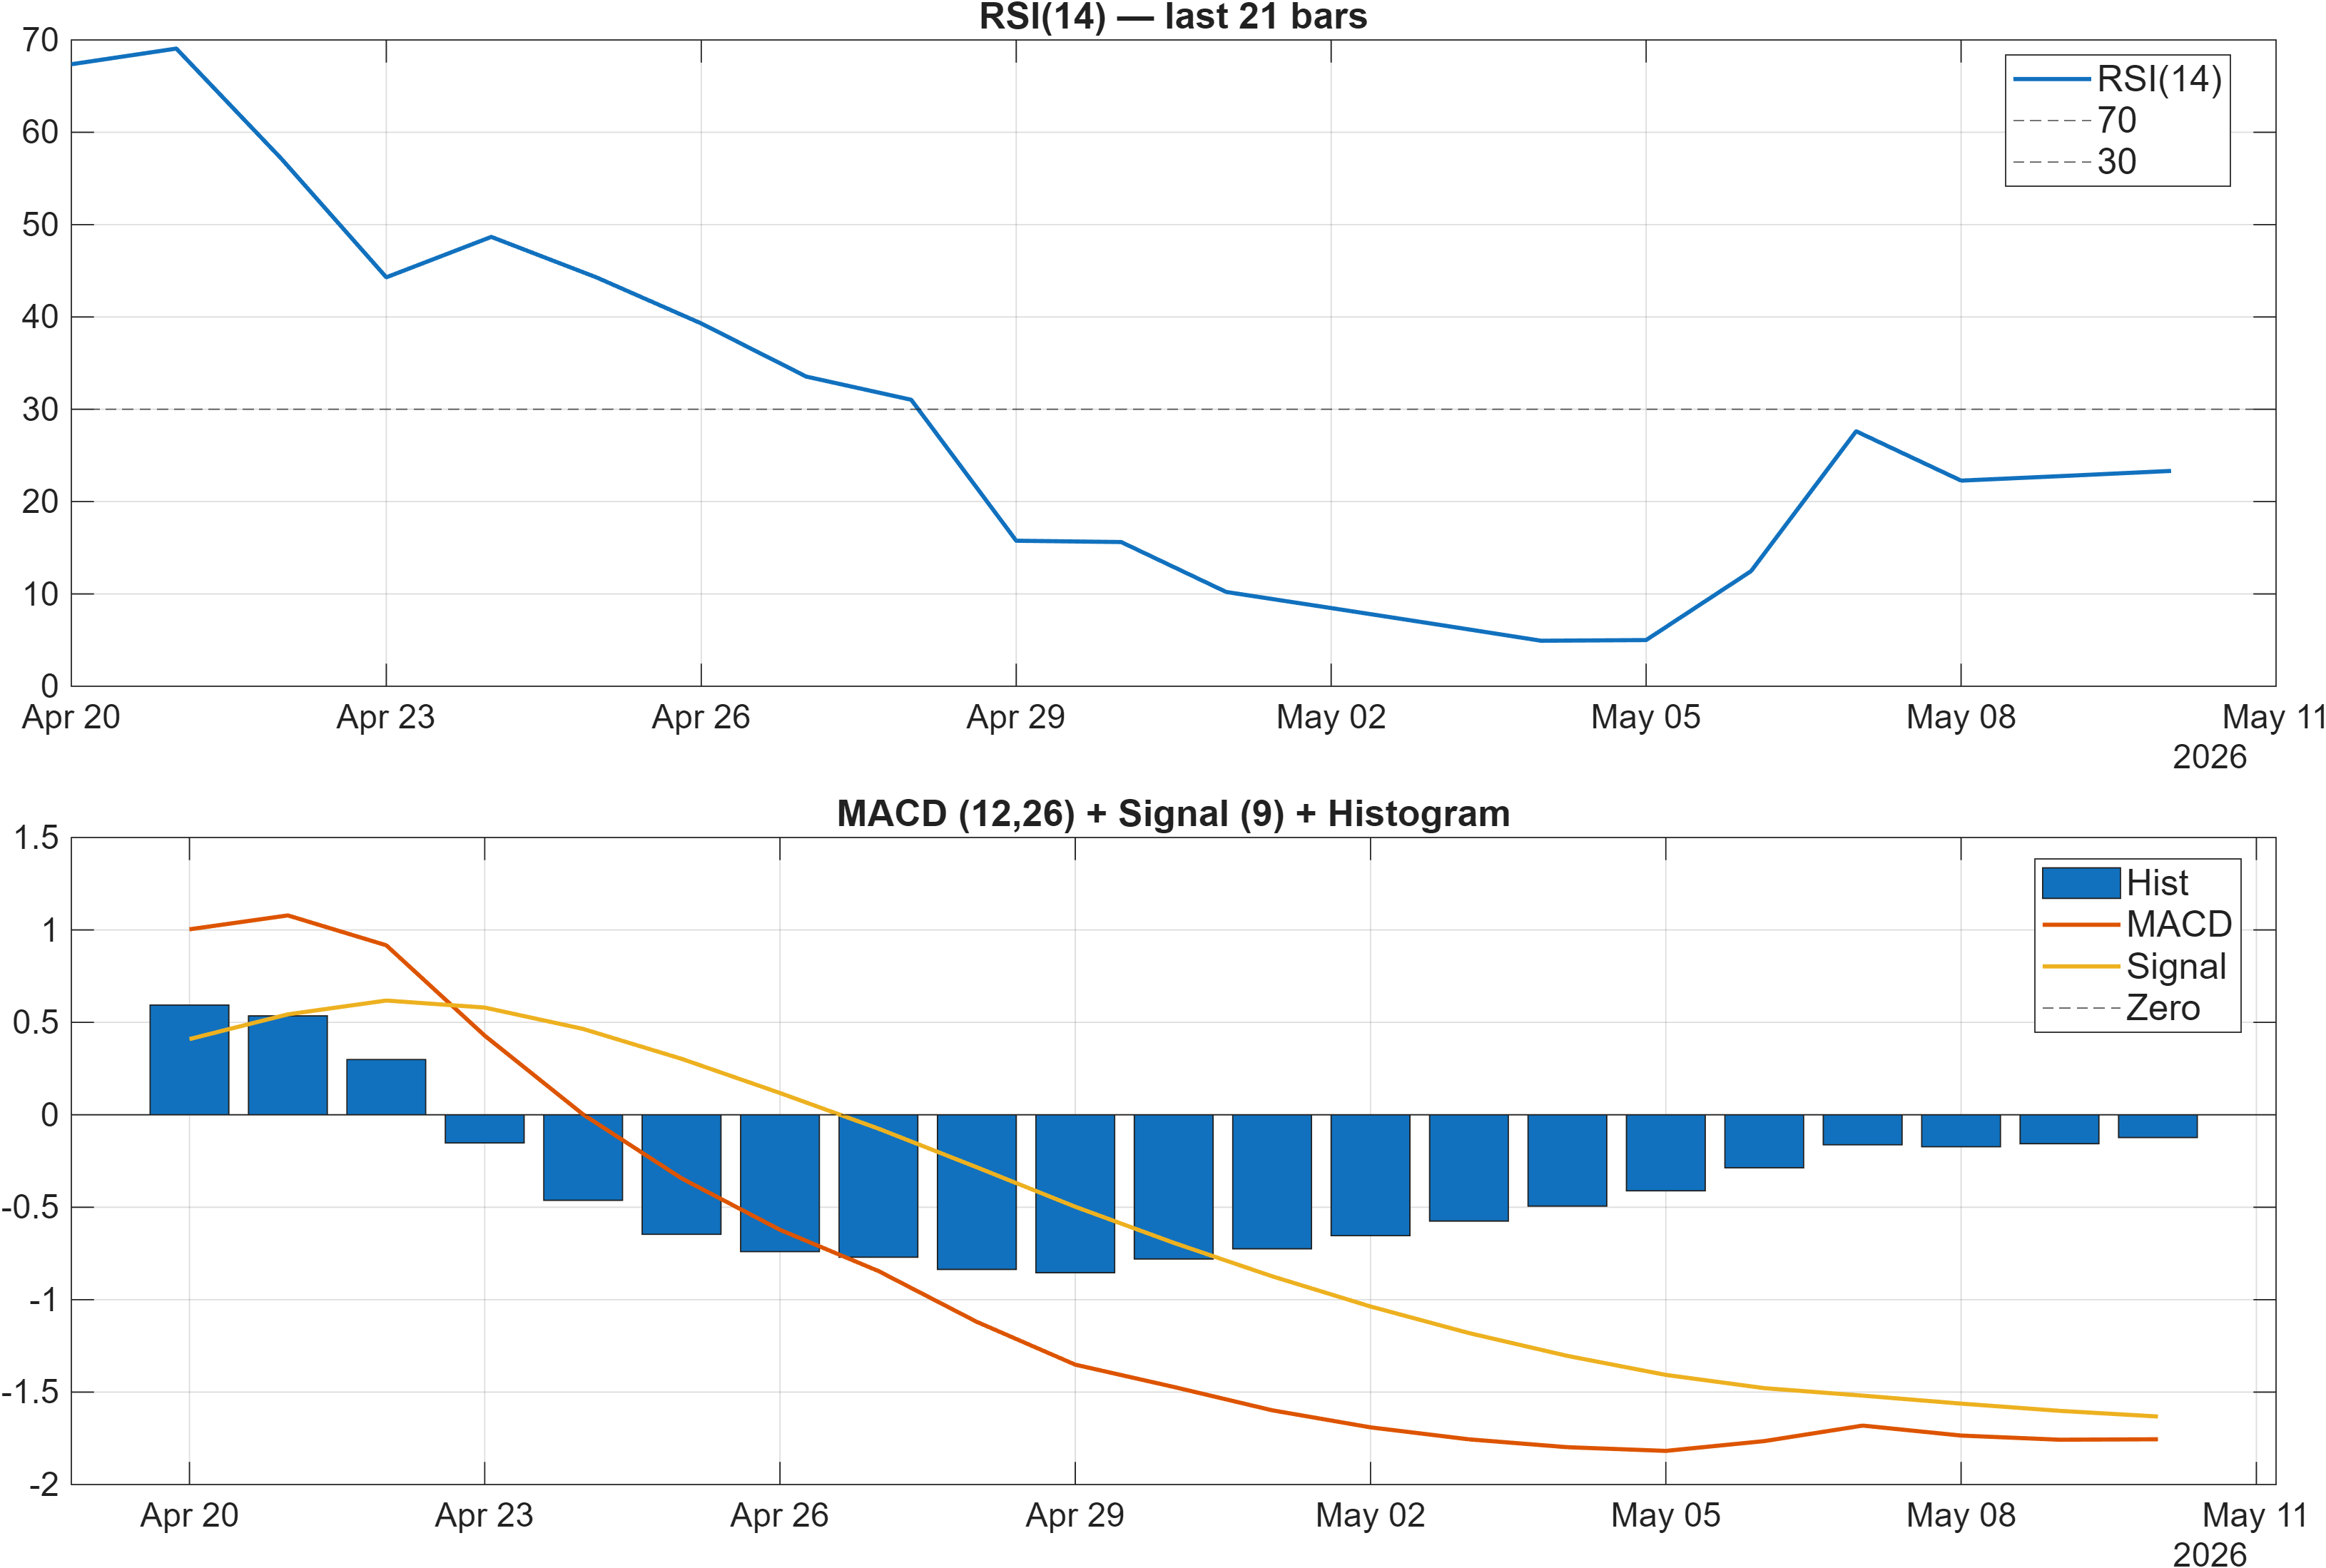
Momentum is decisively weak in the current snapshot. RSI(14) prints at 23.32 with a Bearish bias, a level typically associated with oversold conditions rather than trend health. Oversold readings can precede mean reversion, but by themselves they are not confirmation; they can persist during extended downtrends, especially when trend filters remain bearish (close vs MA50 and MA50 vs MA200 both Bearish).
MACD conditions are also negative, with the histogram at -0.1230. This reinforces that downside momentum remains present rather than merely “slowing.” In the 18-signal table, additional momentum measures agree with this stance: ROC(20) = -22.07 and TS Mom(20) = -11.11 are both bearish, indicating weakness across multiple momentum horizons. The one noteworthy offset is Stoch %K = 16.05, which is labeled bullish—often a sign of short-cycle rebound potential even as broader momentum remains pressured.
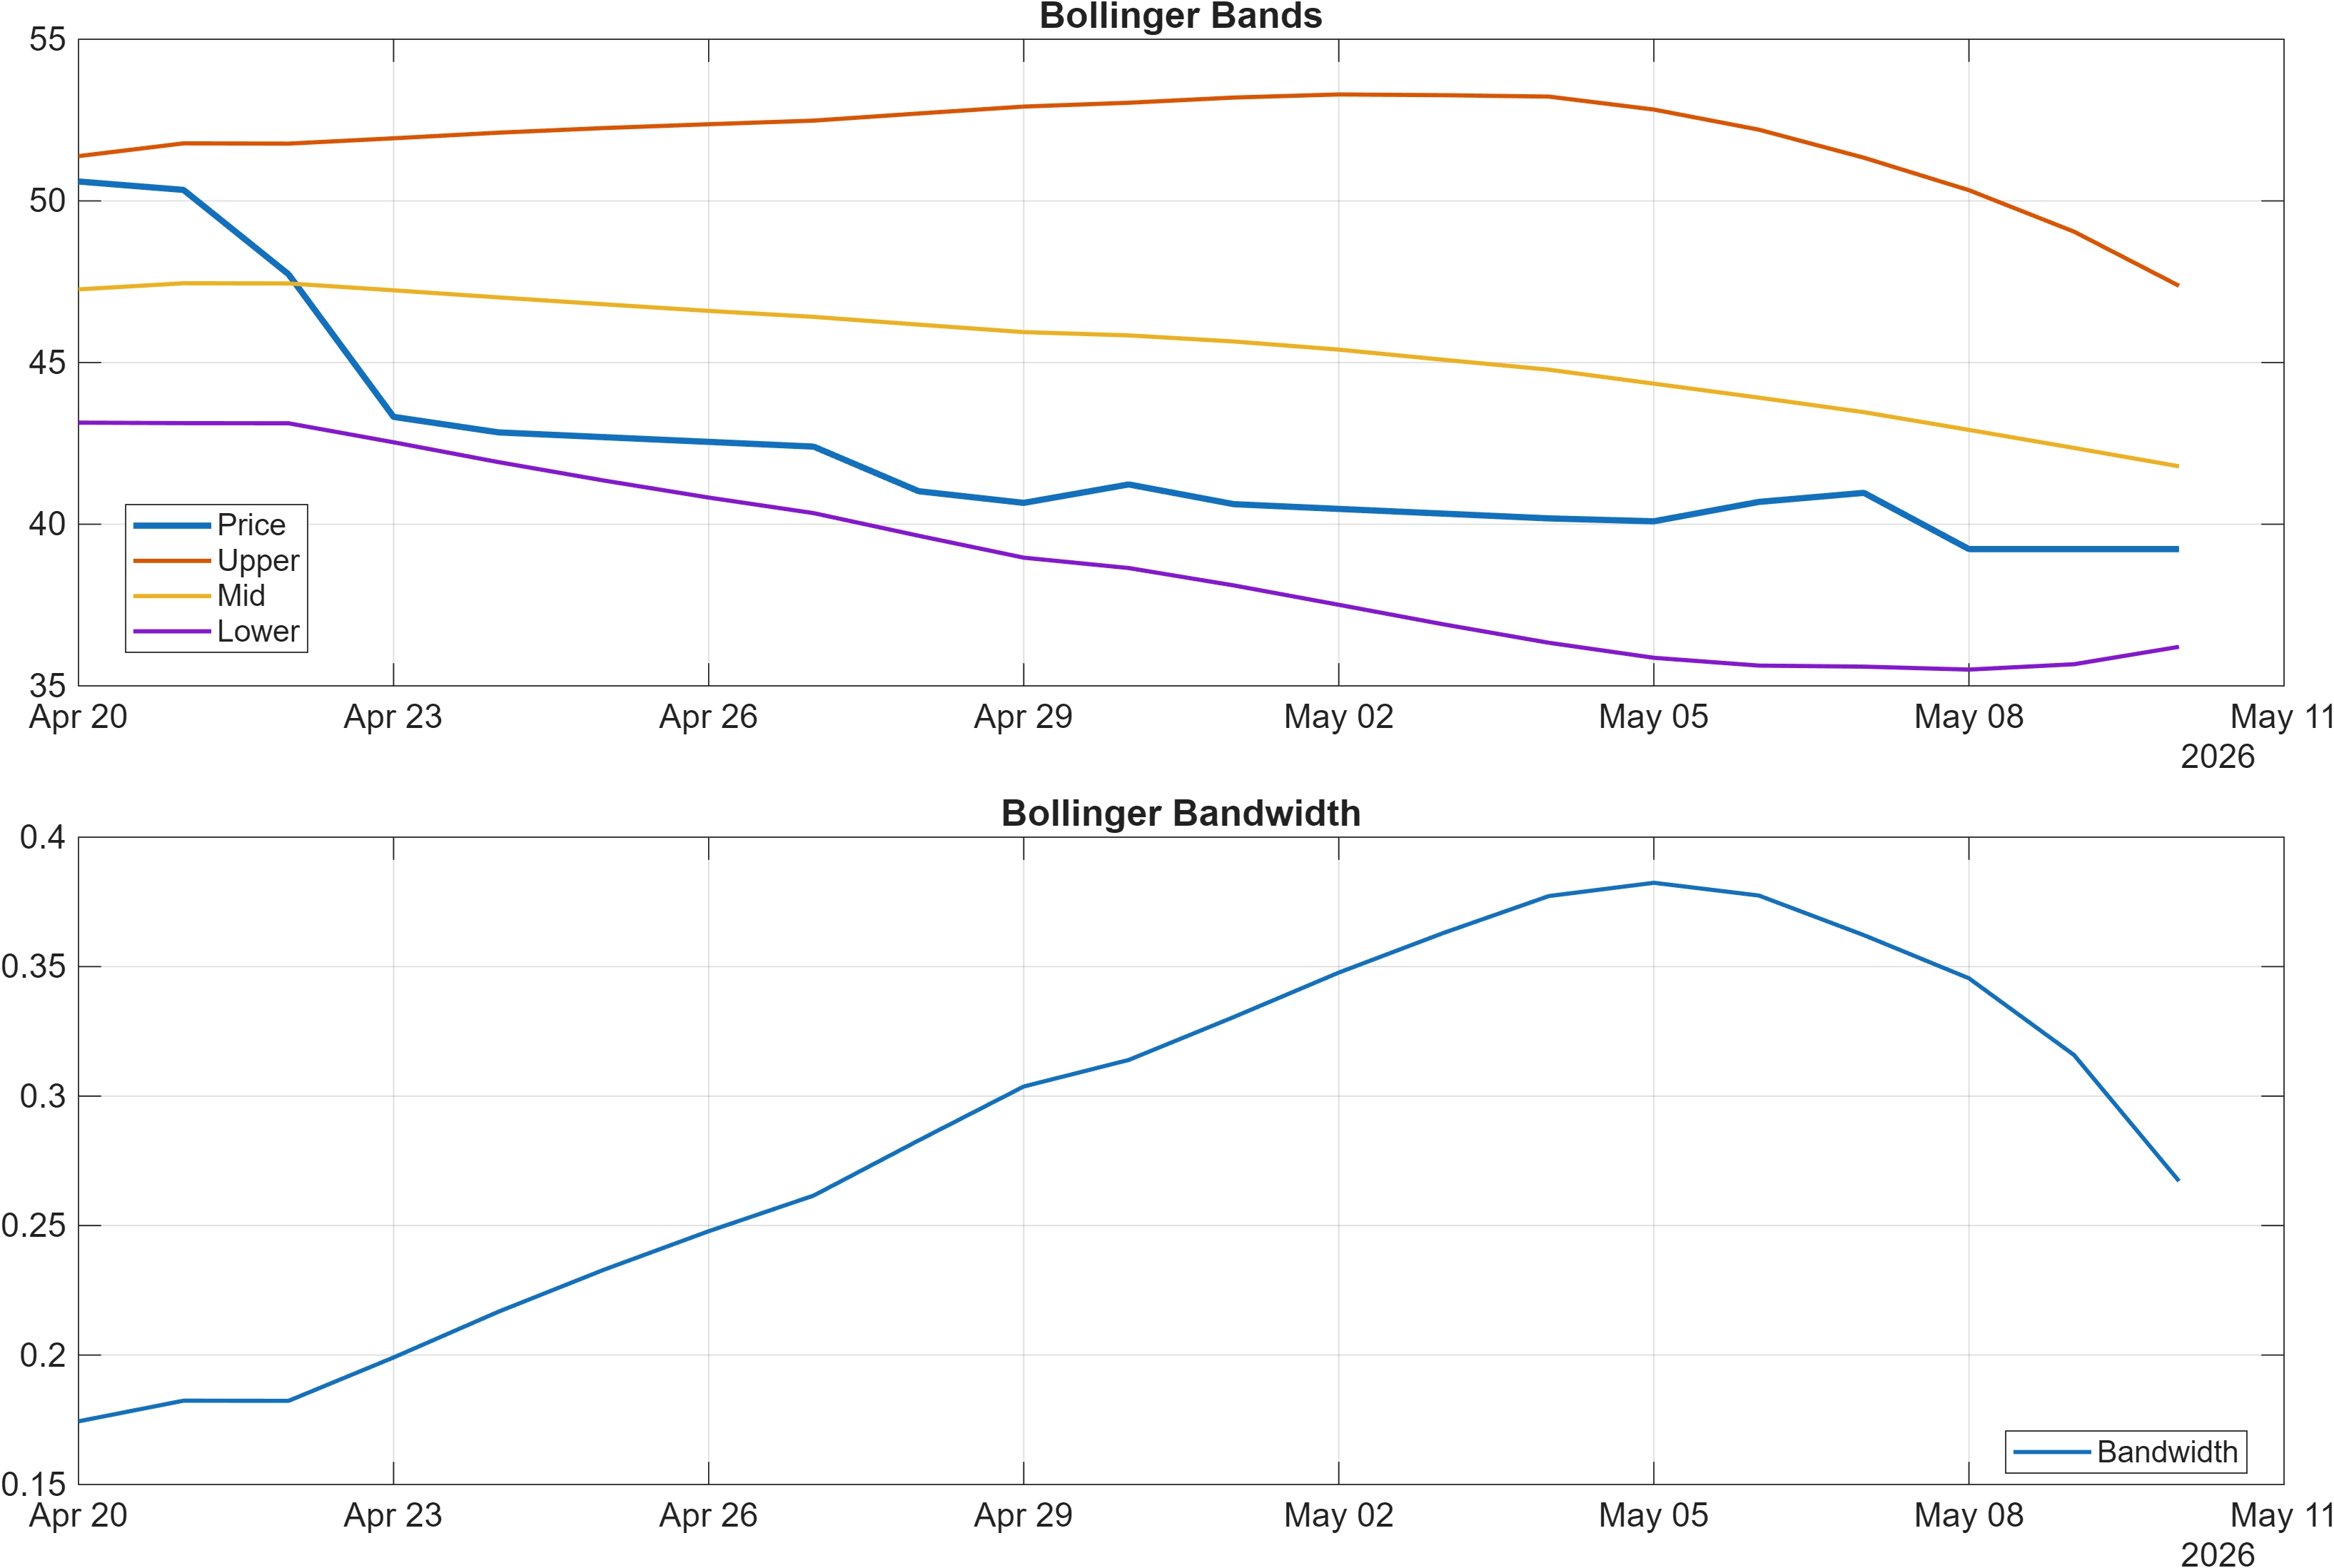
Volatility regime, via Bollinger Bandwidth, is 0.2672. That level suggests volatility is present and should be respected, but the signal is marked Neutral, implying no strong volatility breakout signal from bandwidth alone. In practical signal terms, this creates a setup where directional confirmation is more likely to come from level interaction (support/resistance) and momentum repair (MACD/RSI turning) than from a volatility expansion cue. This matters because rank strength can coexist with unstable short-term tape; volatility neutrality reduces the probability that a single volatility event resolves the conflict cleanly.
Interpretation: RSI bias = Bearish, MACD hist = -0.1230.
Interpretation: Bandwidth (volatility regime) latest = 0.2672.
4) Support / Resistance zones
Support ~ 39.5885 | Resistance ~ 50.8125
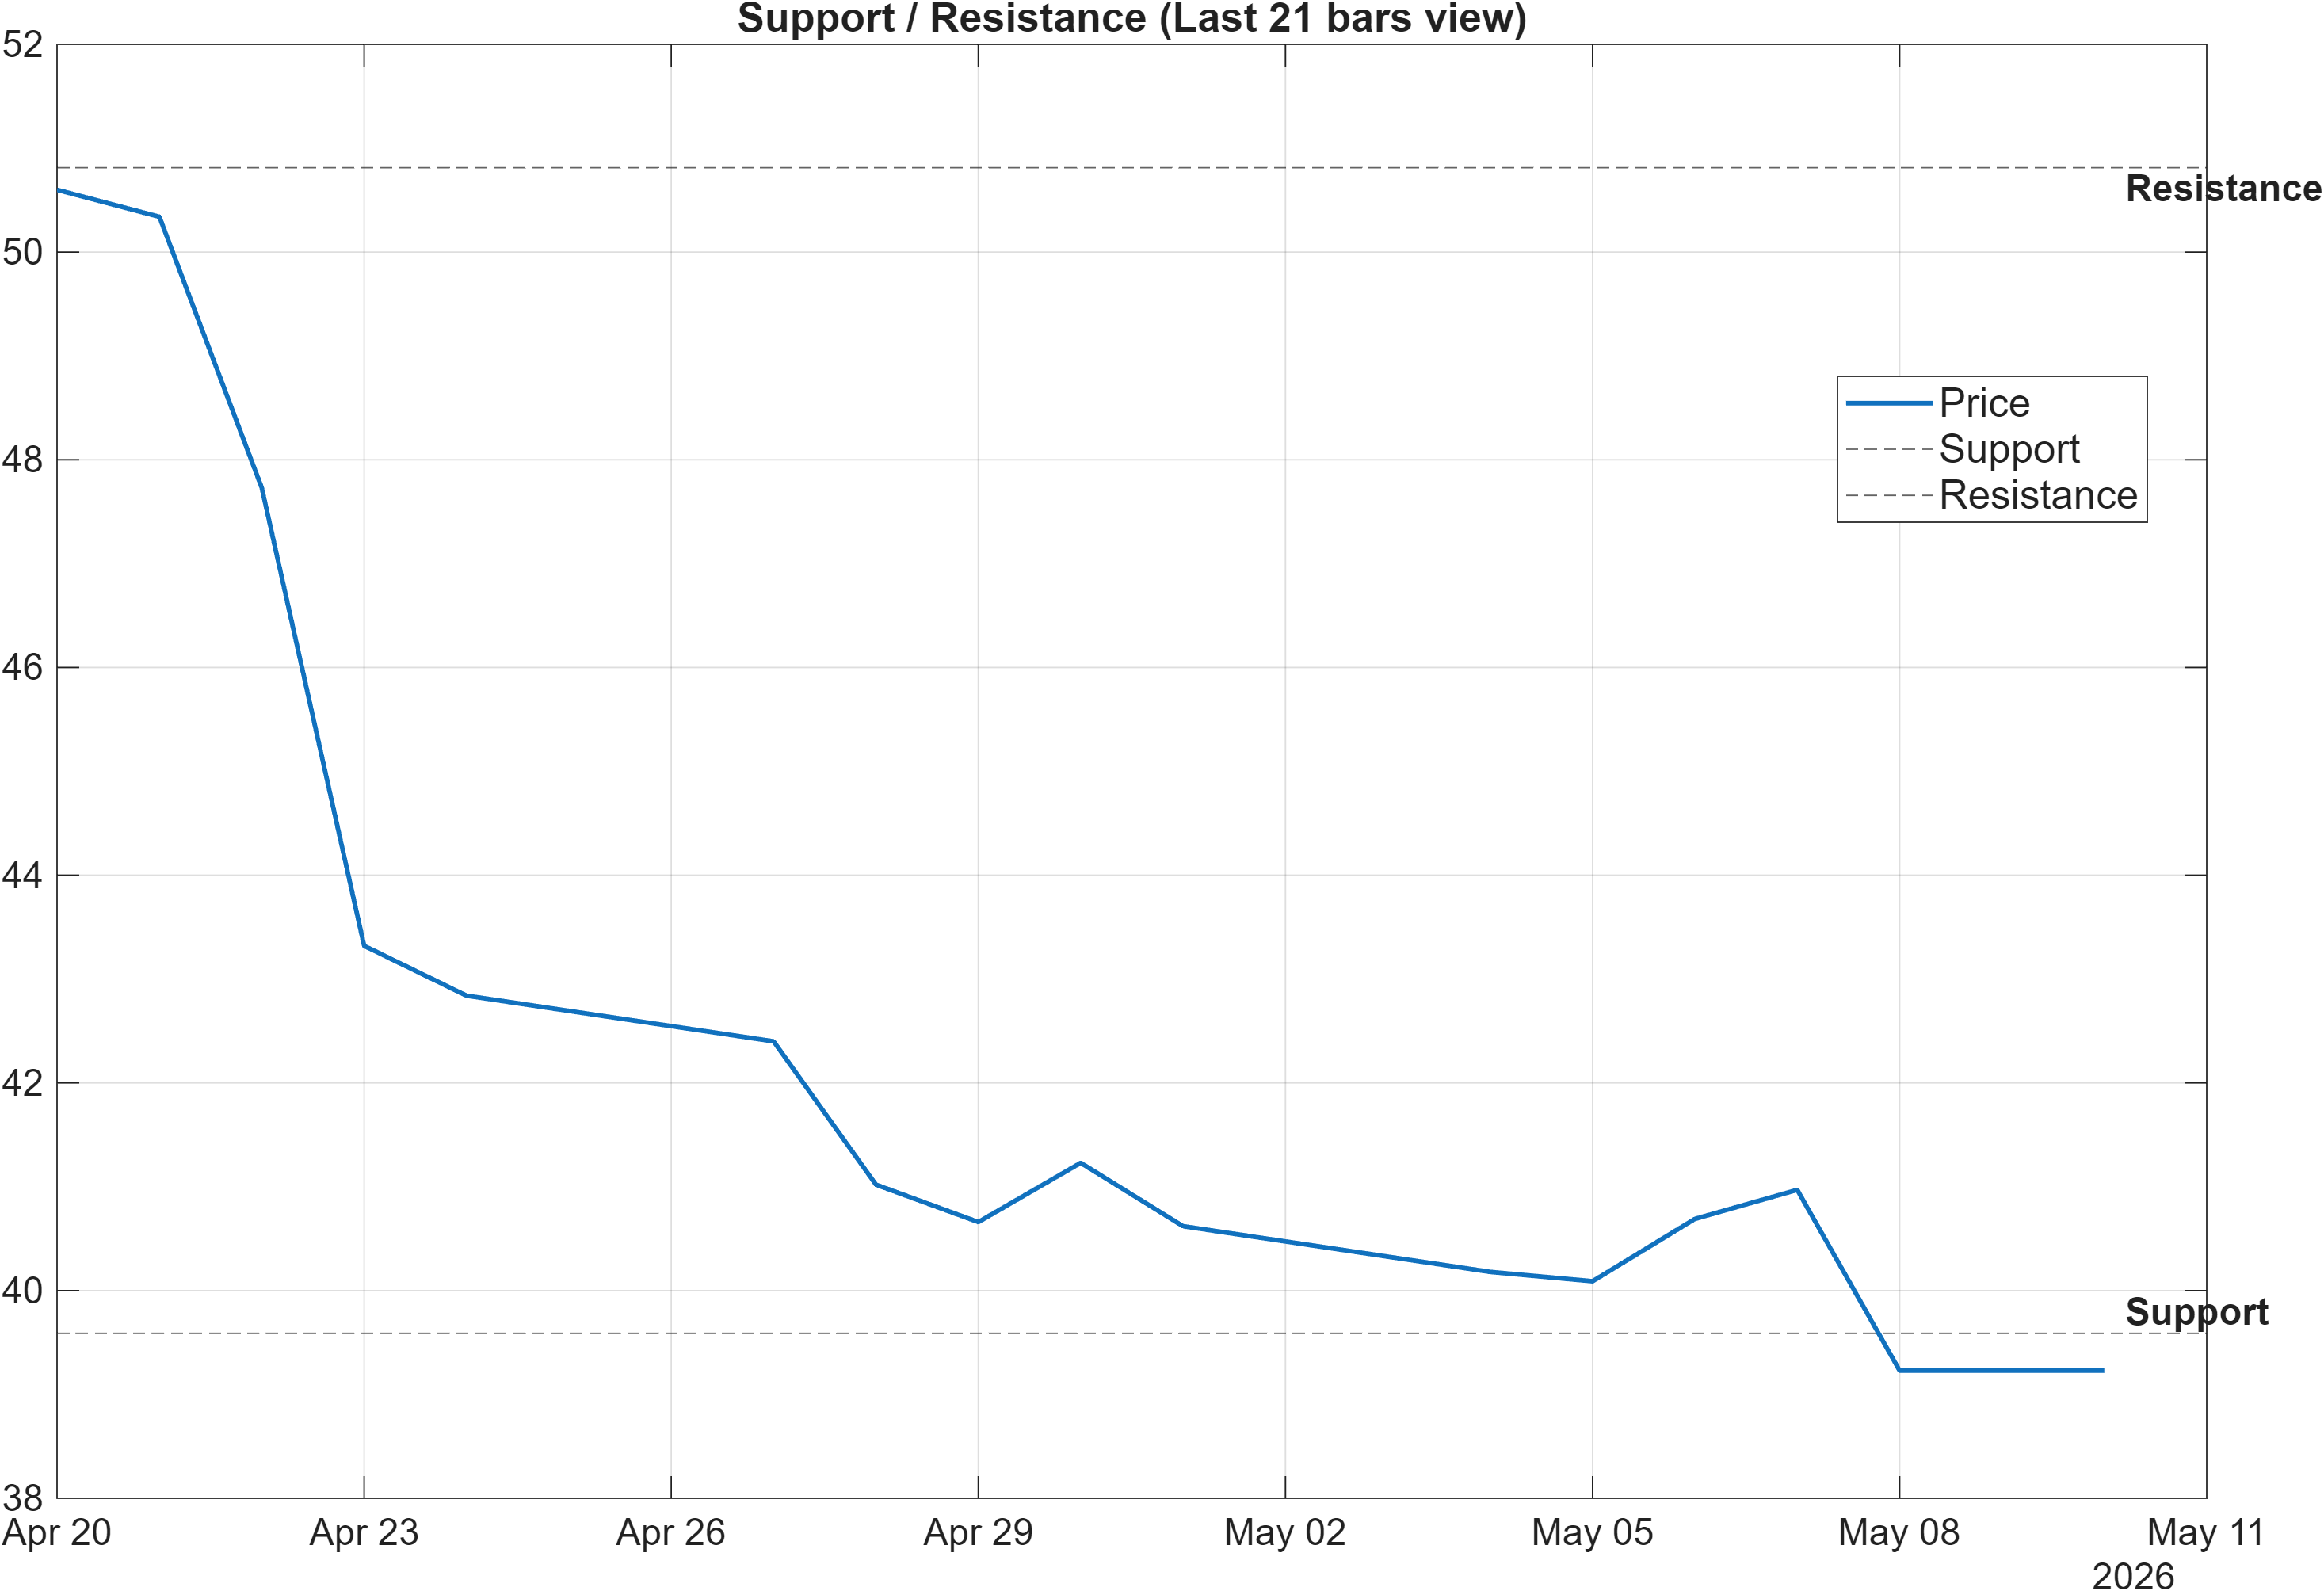
The current structure defines a clean two-sided map: support near 39.5885 and resistance near 50.8125. With momentum weak (RSI(14) 23.32; MACD histogram -0.1230) and moving averages bearish, the burden of proof sits with price to demonstrate acceptance above resistance rather than transient spikes. A break-and-hold above 50.8125 is therefore not just a level event; it would be a regime statement that the market can reclaim a higher price area despite negative trend filters.
The support zone plays a different role: it is the primary reference for whether weakness remains a controlled pullback or transitions into deeper deterioration. The signal table includes MedPx vs Support = -0.1485 labeled bearish, which aligns with price operating unfavorably relative to the support reference. That makes this zone particularly relevant for risk framing—if the market repeatedly fails to hold around support, it often keeps momentum oscillators pinned and delays trend repair.
Given Bollinger Bandwidth at 0.2672 (neutral), level interactions may occur without a volatility “tell,” increasing the importance of confirmation through participation. The scenario language in the snapshot is therefore the correct lens: break above resistance with volume → continuation; close below support → deterioration risk. This keeps the analysis consistent with the cross-sectional rank strength (monthly #4) while acknowledging that the immediate tape is still technically impaired.
Scenario view: Break above resistance with volume → continuation. Close below support → signal deterioration risk.
5) Quant Technical Dashboard (18 Signals)
KGNAI AI Technical Analysis Score (Deep Reinforcement Learning): Rank #1941 out of 2052 (Rank 1 represents the strongest technical positioning and a higher probability of favorable price behavior. As ranks increase toward the maximum, the probability of favorable outcomes weakens and bearish positioning becomes more dominant.) | Label: Bearish | Score: -0.892
18-Signal Technical Confluence Score: -0.500 (Bearish)
Overall Technical Score (18-signal confluence + DRL rank blend): -0.618 (Bearish)
Note: The blended score reflects signal strength weighted against broader AI technical ranking, which may temporarily diverge.
Blended technical score breakdown: -0.618 (Bearish | Bull 3 / Bear 12 / Neutral 3)
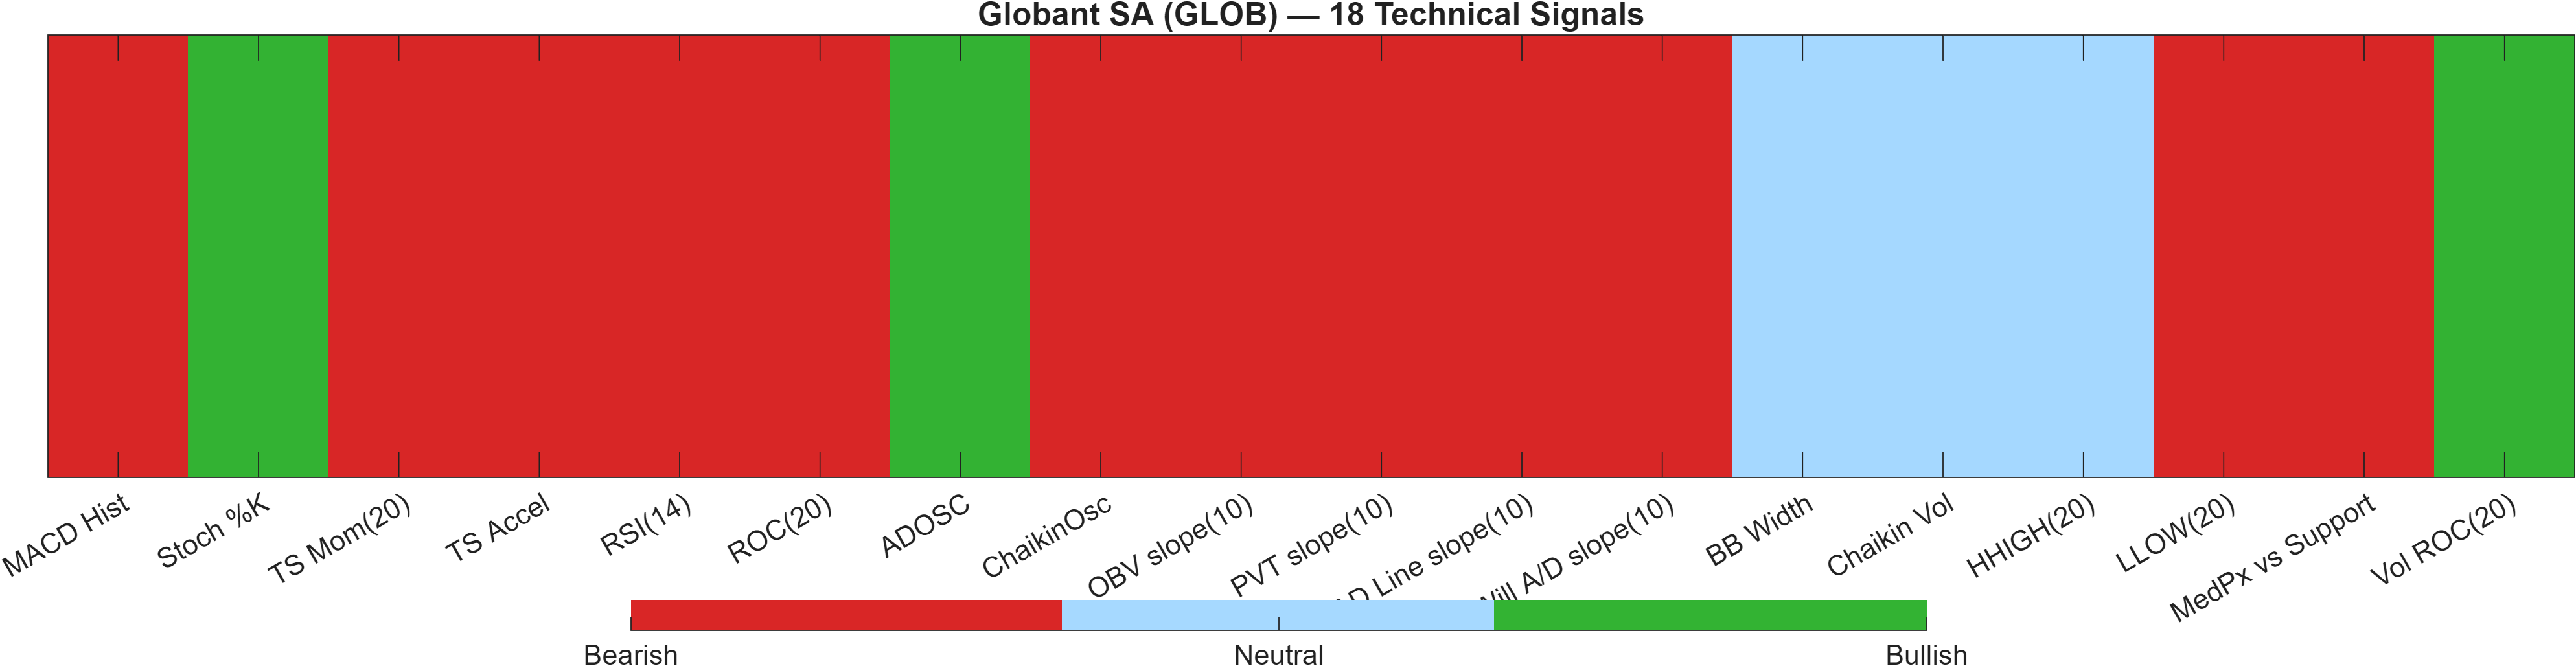
Signal table (Bull/Bear/Neutral)
| Indicator | Value | Signal |
|---|---|---|
| MACD Hist | -0.123 | Bearish |
| Stoch %K | 16.05 | Bullish |
| TS Mom(20) | -11.11 | Bearish |
| TS Accel | -13.6 | Bearish |
| RSI(14) | 23.32 | Bearish |
| ROC(20) | -22.07 | Bearish |
| ADOSC | 19.47 | Bullish |
| ChaikinOsc | -5.588e+05 | Bearish |
| OBV slope(10) | -3.841e+06 | Bearish |
| PVT slope(10) | -5.93e+04 | Bearish |
| AD Line slope(10) | -2.448e+06 | Bearish |
| Will A/D slope(10) | -8.315 | Bearish |
| BB Width | 0.2672 | Neutral |
| Chaikin Vol | -7.121 | Neutral |
| HHIGH(20) | 52.19 | Neutral |
| LLOW(20) | 38.49 | Bearish |
| MedPx vs Support | -0.1485 | Bearish |
| Vol ROC(20) | 32.26 | Bullish |
The technical dashboard is unambiguously risk-off in aggregate. The Deep Reinforcement Learning technical rank at #1941 out of 2052 and score -0.892 indicates weak technical positioning relative to the broader technical universe. This aligns with the blended view: the 18-signal confluence score is -0.500 and the overall blended technical score is -0.618, with a distribution of Bull 3 / Bear 12 / Neutral 3. In other words, bearish signals are not isolated; they are broad across momentum and participation.
The composition of bearish signals is instructive. Momentum and rate-of-change measures are negative (MACD histogram -0.123, ROC(20) -22.07, TS Mom(20) -11.11), and several volume/flow slopes are also bearish (e.g., OBV slope(10) -3.841e+06, AD Line slope(10) -2.448e+06). That combination often reflects not just price weakness but weak confirmation from accumulation metrics.
There are, however, limited offsets that can matter tactically. Stoch %K = 16.05 is bullish, consistent with a short-cycle oversold rebound risk, while Vol ROC(20) = 32.26 and ADOSC = 19.47 are also bullish, suggesting activity and some flow measures are not uniformly negative. The neutral signals (BB Width 0.2672, Chaikin Vol -7.121, HHIGH(20) 52.19) do not provide a clear volatility “escape,” reinforcing that any improvement likely needs to be earned via level recapture (resistance 50.8125) and momentum repair rather than expecting volatility to resolve the setup.
Interpretation: Indicator-level signals form the base confluence, which is then adjusted using a separate AI-driven technical ranking model. The final technical score summarizes this combined view.
6) News sentiment + extractive gist
Sentiment score (avg): 0.096 | Positive: 43% | Neutral: 52% | Negative: 5%
KGNAI AI News Sentiment Score (normalized -1 to +1): 0.97 (as of 2026-05-09) | Label: Bullish | Overall news score: 0.94
Positive Developments
Recent coverage across major financial outlets indicates a generally constructive tilt toward Globant’s positioning and visibility, reflected in the sentiment mix (Positive 43%, Negative 5%) and the elevated normalized news score of 0.97. The positive channel emphasizes analyst attention and broader thematic demand for IT services, which can support narrative stability even when price momentum is weak. In a tape where RSI(14) is 23.32 and trend filters are bearish, favorable coverage can matter most by improving the odds of a re-rating catalyst translating into a technical reversal—typically observed through resistance interaction near 50.8125. The current read does not override the bearish technical stack, but it can reduce the probability that negative technicals are accompanied by worsening sentiment, keeping the setup more “mean-reversion eligible” than purely risk-off.
Neutral / Mixed Developments
The neutral bucket (Neutral 52%) is consistent with a market that is watching for confirmation rather than reaching a consensus. Event framing and corporate updates contribute informational flow without uniformly shifting bias, which is consistent with the average sentiment score of 0.096—slightly positive but not decisive. For positioning, neutral news flow often increases the importance of technical levels as decision points: support near 39.5885 becomes the primary “risk boundary,” while any stabilization would need to show through momentum repair (MACD histogram currently -0.1230) rather than relying on sentiment alone. This mix supports a disciplined stance: treat news as context and let price acceptance determine whether the rank strength (monthly #4) can reassert itself on the chart.
Negative / Risk Signals
Risk-leaning items in recent coverage focus on factors that can raise uncertainty and widen outcome dispersion even when overall sentiment scores appear supportive (overall news score 0.94). With technicals already stressed—overall technical score -0.618 and DRL technical rank #1941—incremental risk narratives can have an outsized impact by limiting dip-buying and keeping rallies corrective. From a market-structure perspective, the key is whether risk signals translate into follow-through below support at 39.5885; a close below that zone would align sentiment risk with price weakness, increasing the probability that bearish momentum (RSI(14) 23.32) persists. Conversely, if the market absorbs negative flow without breaking support, it can be read as resilience—but it still requires technical confirmation to shift the primary bias.
What to monitor next
- Whether price holds above 39.5885 as momentum stabilizes (watch RSI and MACD histogram versus -0.1230).
- Evidence of acceptance above 50.8125 alongside participation (context: Vol ROC(20) = 32.26).
- Whether sentiment remains skewed constructive (normalized score 0.97) if technical weakness persists.
Snapshot: AI Rank (Short–Mid–Long): Bullish (Bullish–Bullish–Bullish) · Technical Confluence: Bearish · Key Levels: Support ~39.59 | Resistance ~50.81 · News Sentiment: Neutral
7) Sources
Sources referenced: Reuters, Bloomberg, Yahoo Finance, MarketWatch, Investing.com
You may also like: How KGNAI AI ranks instruments across global markets
Disclaimer: KGNAI provides AI-generated analytics and educational market commentary only. This is not financial advice. Markets involve risk. Always do your own research.