
Costco Wholesale Corp (COST) — 29-May-2026 Technical Confluence Remains Cautious Amid Mixed Confirmation
Costco Wholesale Corp (COST) enters 29-May-2026 with a notably mixed signal stack: cross-sectional ranks remain largely Neutral across short and mid horizons, while the technical layer leans Bearish despite pockets of supportive volume and oversold-adjacent momentum. The daily positioning (rank #1080 out of 2047) sits near the middle of the tracked universe, while the 3-month rank (#310) is comparatively stronger, creating a time-horizon divergence rather than a unified trend signal. On price structure, the close versus the MA50 is flagged Bearish even as MA50 versus MA200 is Bullish, a configuration often associated with late-cycle consolidation or corrective phases within a broader trend. Key decision zones remain well-defined: support ~ 983.7267 and resistance ~ 1061.1150, with momentum and news sentiment acting as competing influences around those levels.
- Rank stance (Short / Mid / Long): Neutral / Neutral / Neutral (daily #1080, weekly #988, yearly #1043 out of 2047), with a comparatively stronger 3-month pocket (#310).
- Technical confluence label: Bearish (18-signal confluence -0.333; overall blended technical score -0.420; DRL technical rank #1661).
- Key levels: Support ~ 983.7267 | Resistance ~ 1061.1150.
- News sentiment bias: Slight positive tilt in scoring (avg sentiment 0.113; normalized score 0.98), but price/technical signals are not fully confirming.
- Confirmation / invalidation condition: A break above 1061.1150 with volume supports continuation; a close below 983.7267 increases deterioration risk per the scenario view.
What KGNAI Measures
KGNAI evaluates assets using large cross-sectional datasets built from millions of structured data points. Inputs incorporate fundamental metrics, technical structures, and systematically processed news sentiment. Statistical models, machine learning, and AI frameworks are used to assess relative positioning, signal alignment, and probabilistic behavior across broad universes.
How to Read This Report
- Ranks are comparative across the tracked universe, not absolute price targets.
- Confluence reflects alignment among independent signal groups.
- Support/resistance levels are probabilistic decision zones, not guarantees.
- Sentiment provides contextual bias within the broader analytical framework.
1) KGNAI AI Analysis
Region: USA
Total universe size: 2047 ranked instruments
- Daily rank: #1080 out of 2047 — Neutral
- Weekly rank: #988 out of 2047 — Neutral
- Monthly rank: #458 out of 2047 — Neutral
- 3-Monthly rank: #310 out of 2047 — Bullish
- 6-Monthly rank: #831 out of 2047 — Neutral
- Yearly rank: #1043 out of 2047 — Neutral
COST’s rank profile is best described as range-bound positioning with a single intermediate-strength pocket. The daily rank (#1080) and weekly rank (#988) place the name around the middle of the 2047-instrument universe, consistent with a market that is not paying up for near-term momentum. By contrast, the 3-month rank (#310) sits in a stronger relative band, implying that Costco’s intermediate window has retained better comparative behavior than the shortest horizons. The monthly rank (#458) is also firmer than the daily/weekly readings, but it remains labeled Neutral, which matters: the model is not treating this as broad-based leadership.
This time-horizon split often coincides with a regime where mean reversion and headline-driven swings can dominate short windows even while longer moving baselines remain constructive. The 6-month rank (#831) and yearly rank (#1043) returning to neutral territory further supports a “pause” characterization: intermediate strength has not translated into persistent longer-horizon dominance. Under KGNAI’s framework, these ranks are treated as relative probability shifts rather than a directional promise; therefore, the most investable inference here is not direction, but uncertainty concentration—a setup where confirmation from independent technical signals becomes more important than rank alone.
Term view: Short-term: Neutral. Mid-term: Neutral. Long-term: Neutral.
Want the full universe and complete rank tables? Unlock full access on KGNAI: https://www.kgnai.com/pricing
2) Price & trend overview
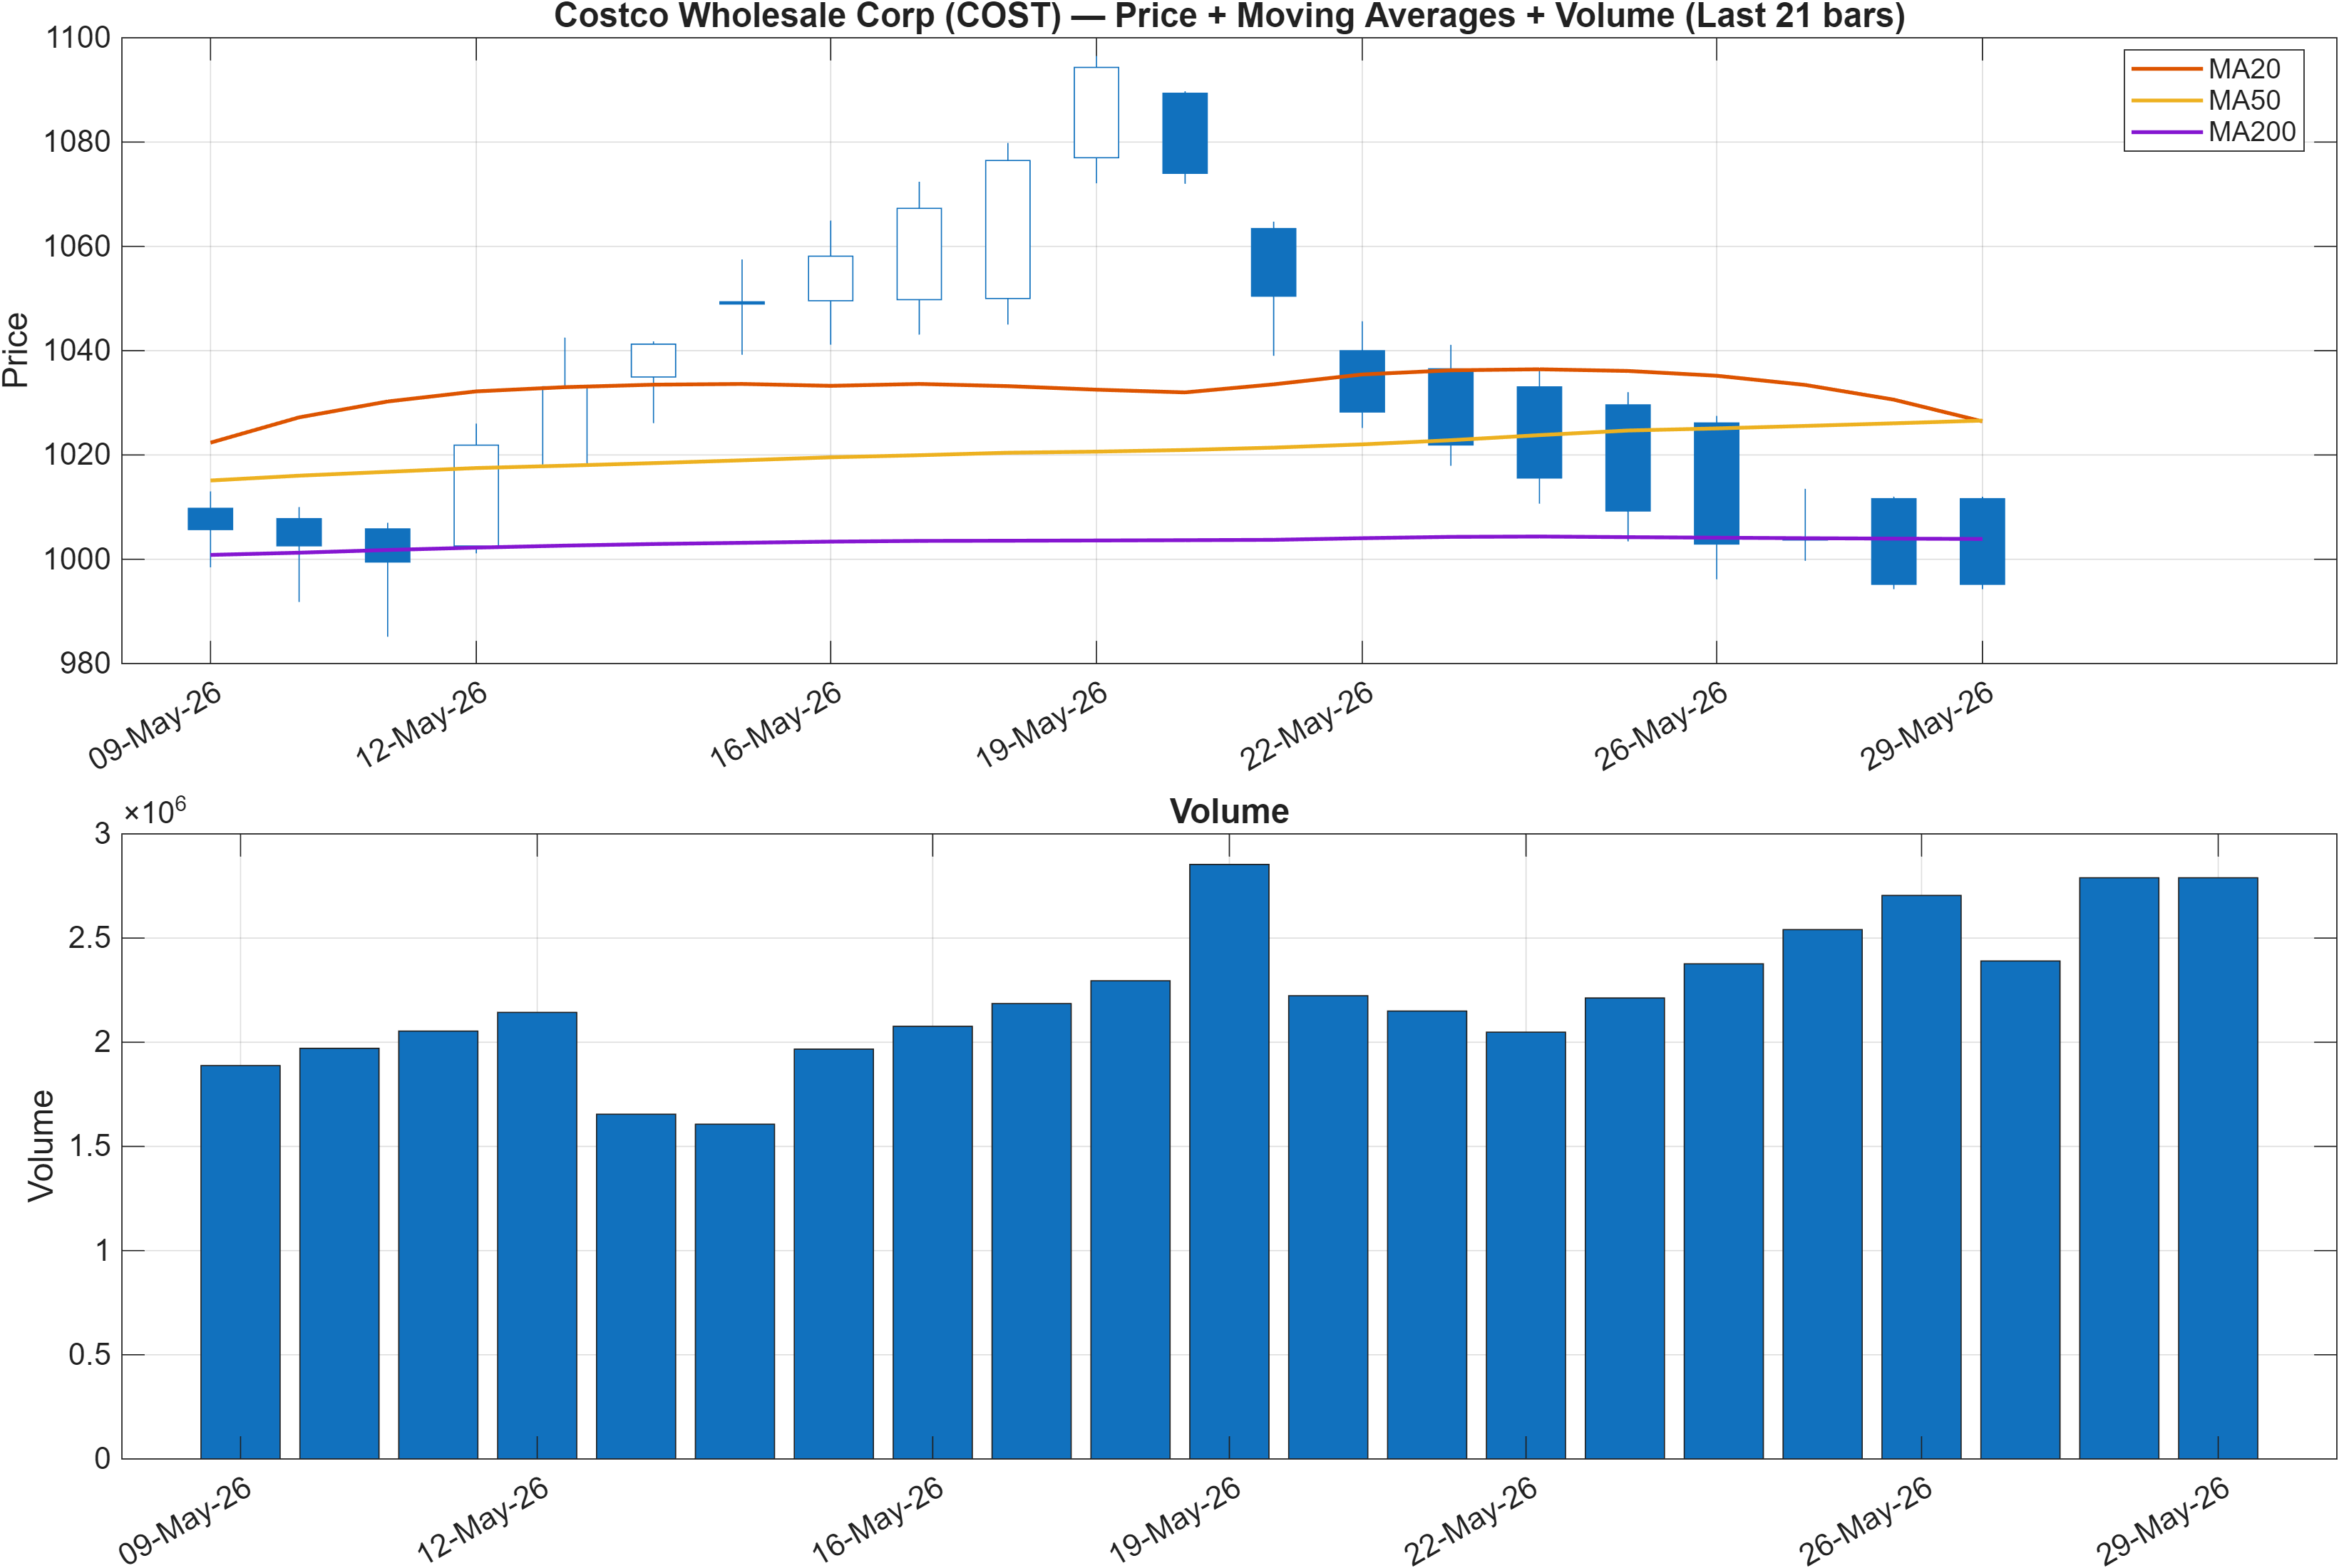
Interpretation: Close vs MA50 = Bearish, MA50 vs MA200 = Bullish.
Trend state: longer-term structure vs near-term damage
The moving-average configuration describes a two-speed tape. With MA50 vs MA200 flagged Bullish, the broader trend backbone still reflects constructive longer-horizon structure. However, the close vs MA50 reading is Bearish, which aligns with an active pullback or consolidation phase rather than a clean continuation.
This blend frequently produces choppy price discovery: trend-following participants see the longer baseline as intact, while shorter-horizon risk controls respond to the price being below the faster average. In such conditions, market sensitivity to incremental catalysts tends to rise, and the burden of proof shifts to whether price can regain and hold above the MA50. The rank stack supports this interpretation: the 3-month rank (#310) is stronger than the daily rank (#1080), consistent with a longer window that has not fully capitulated, even if near-term positioning has softened.
The tactical implication is that trend persistence is not the primary question; rather, the question is whether the current drawdown is a controlled reset or the start of a deeper regime change. That distinction will typically be reflected first in momentum (RSI/MACD behavior), then in how price behaves around the defined support/resistance bands (983.7267 and 1061.1150). Until those confirmations appear, this trend profile is better treated as “trend with friction” than as clean trend continuation.
3) Momentum & volatility dashboard
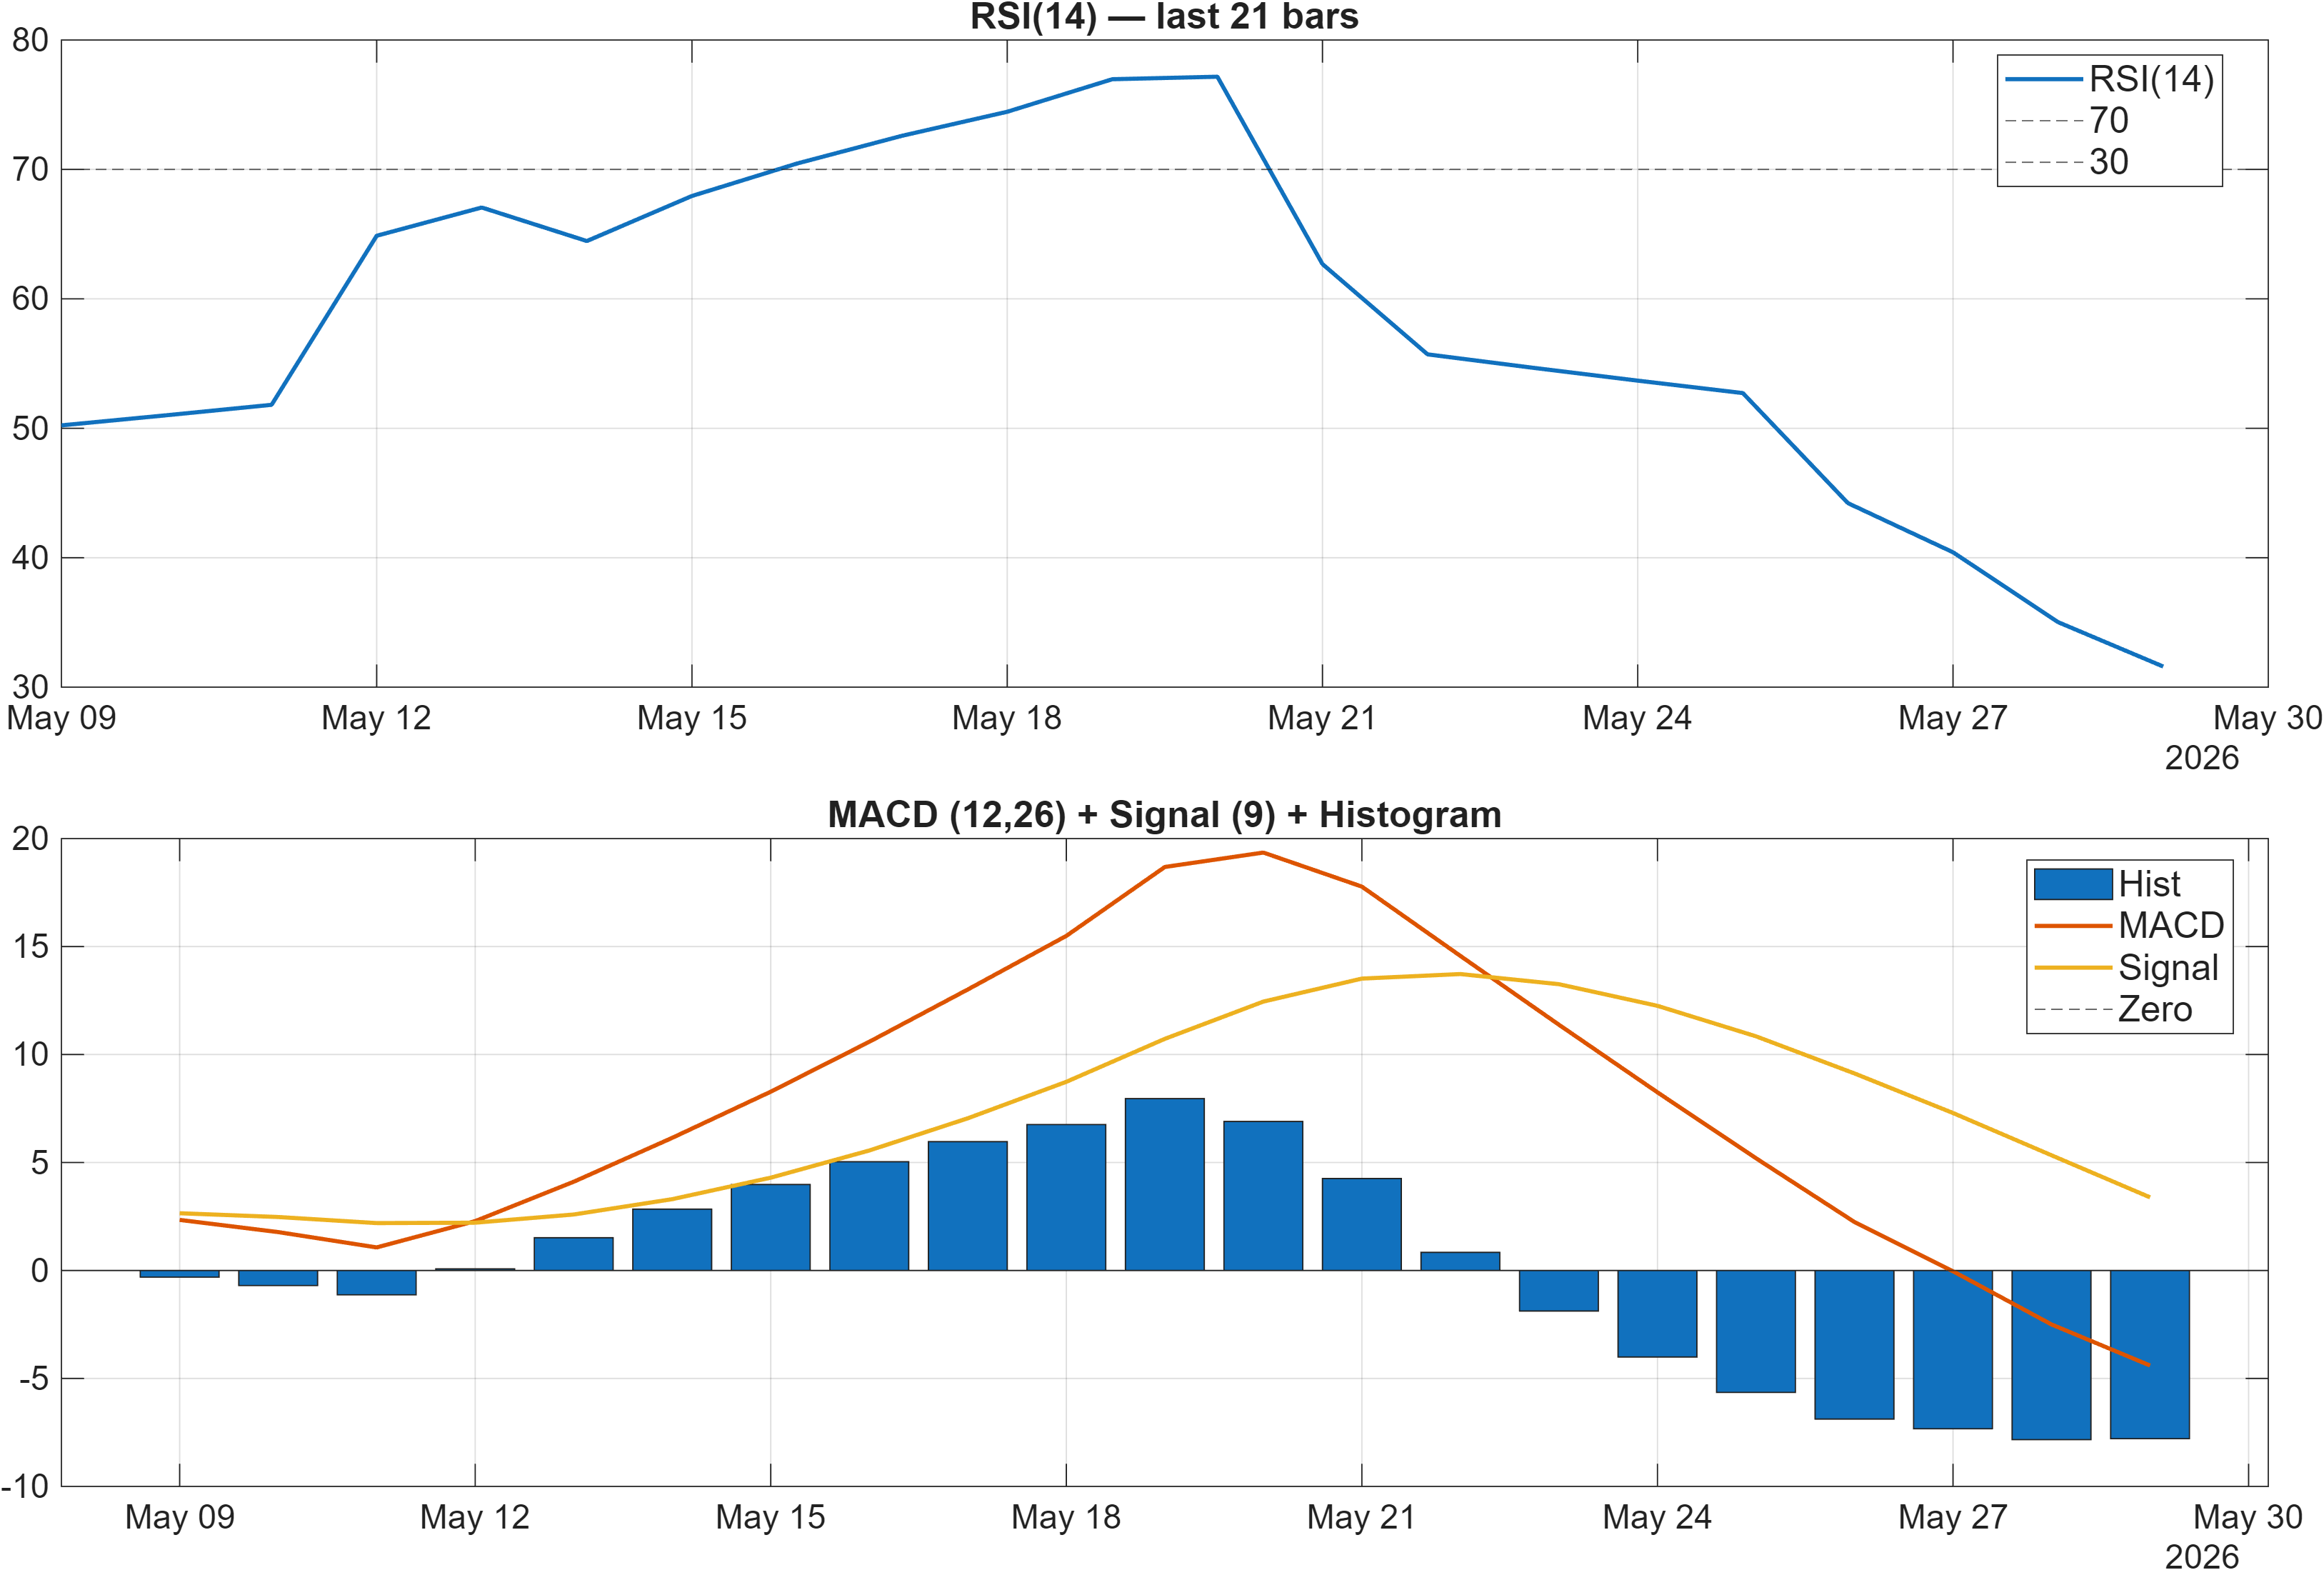
Interpretation: RSI bias = Bearish, MACD hist = -7.7874.
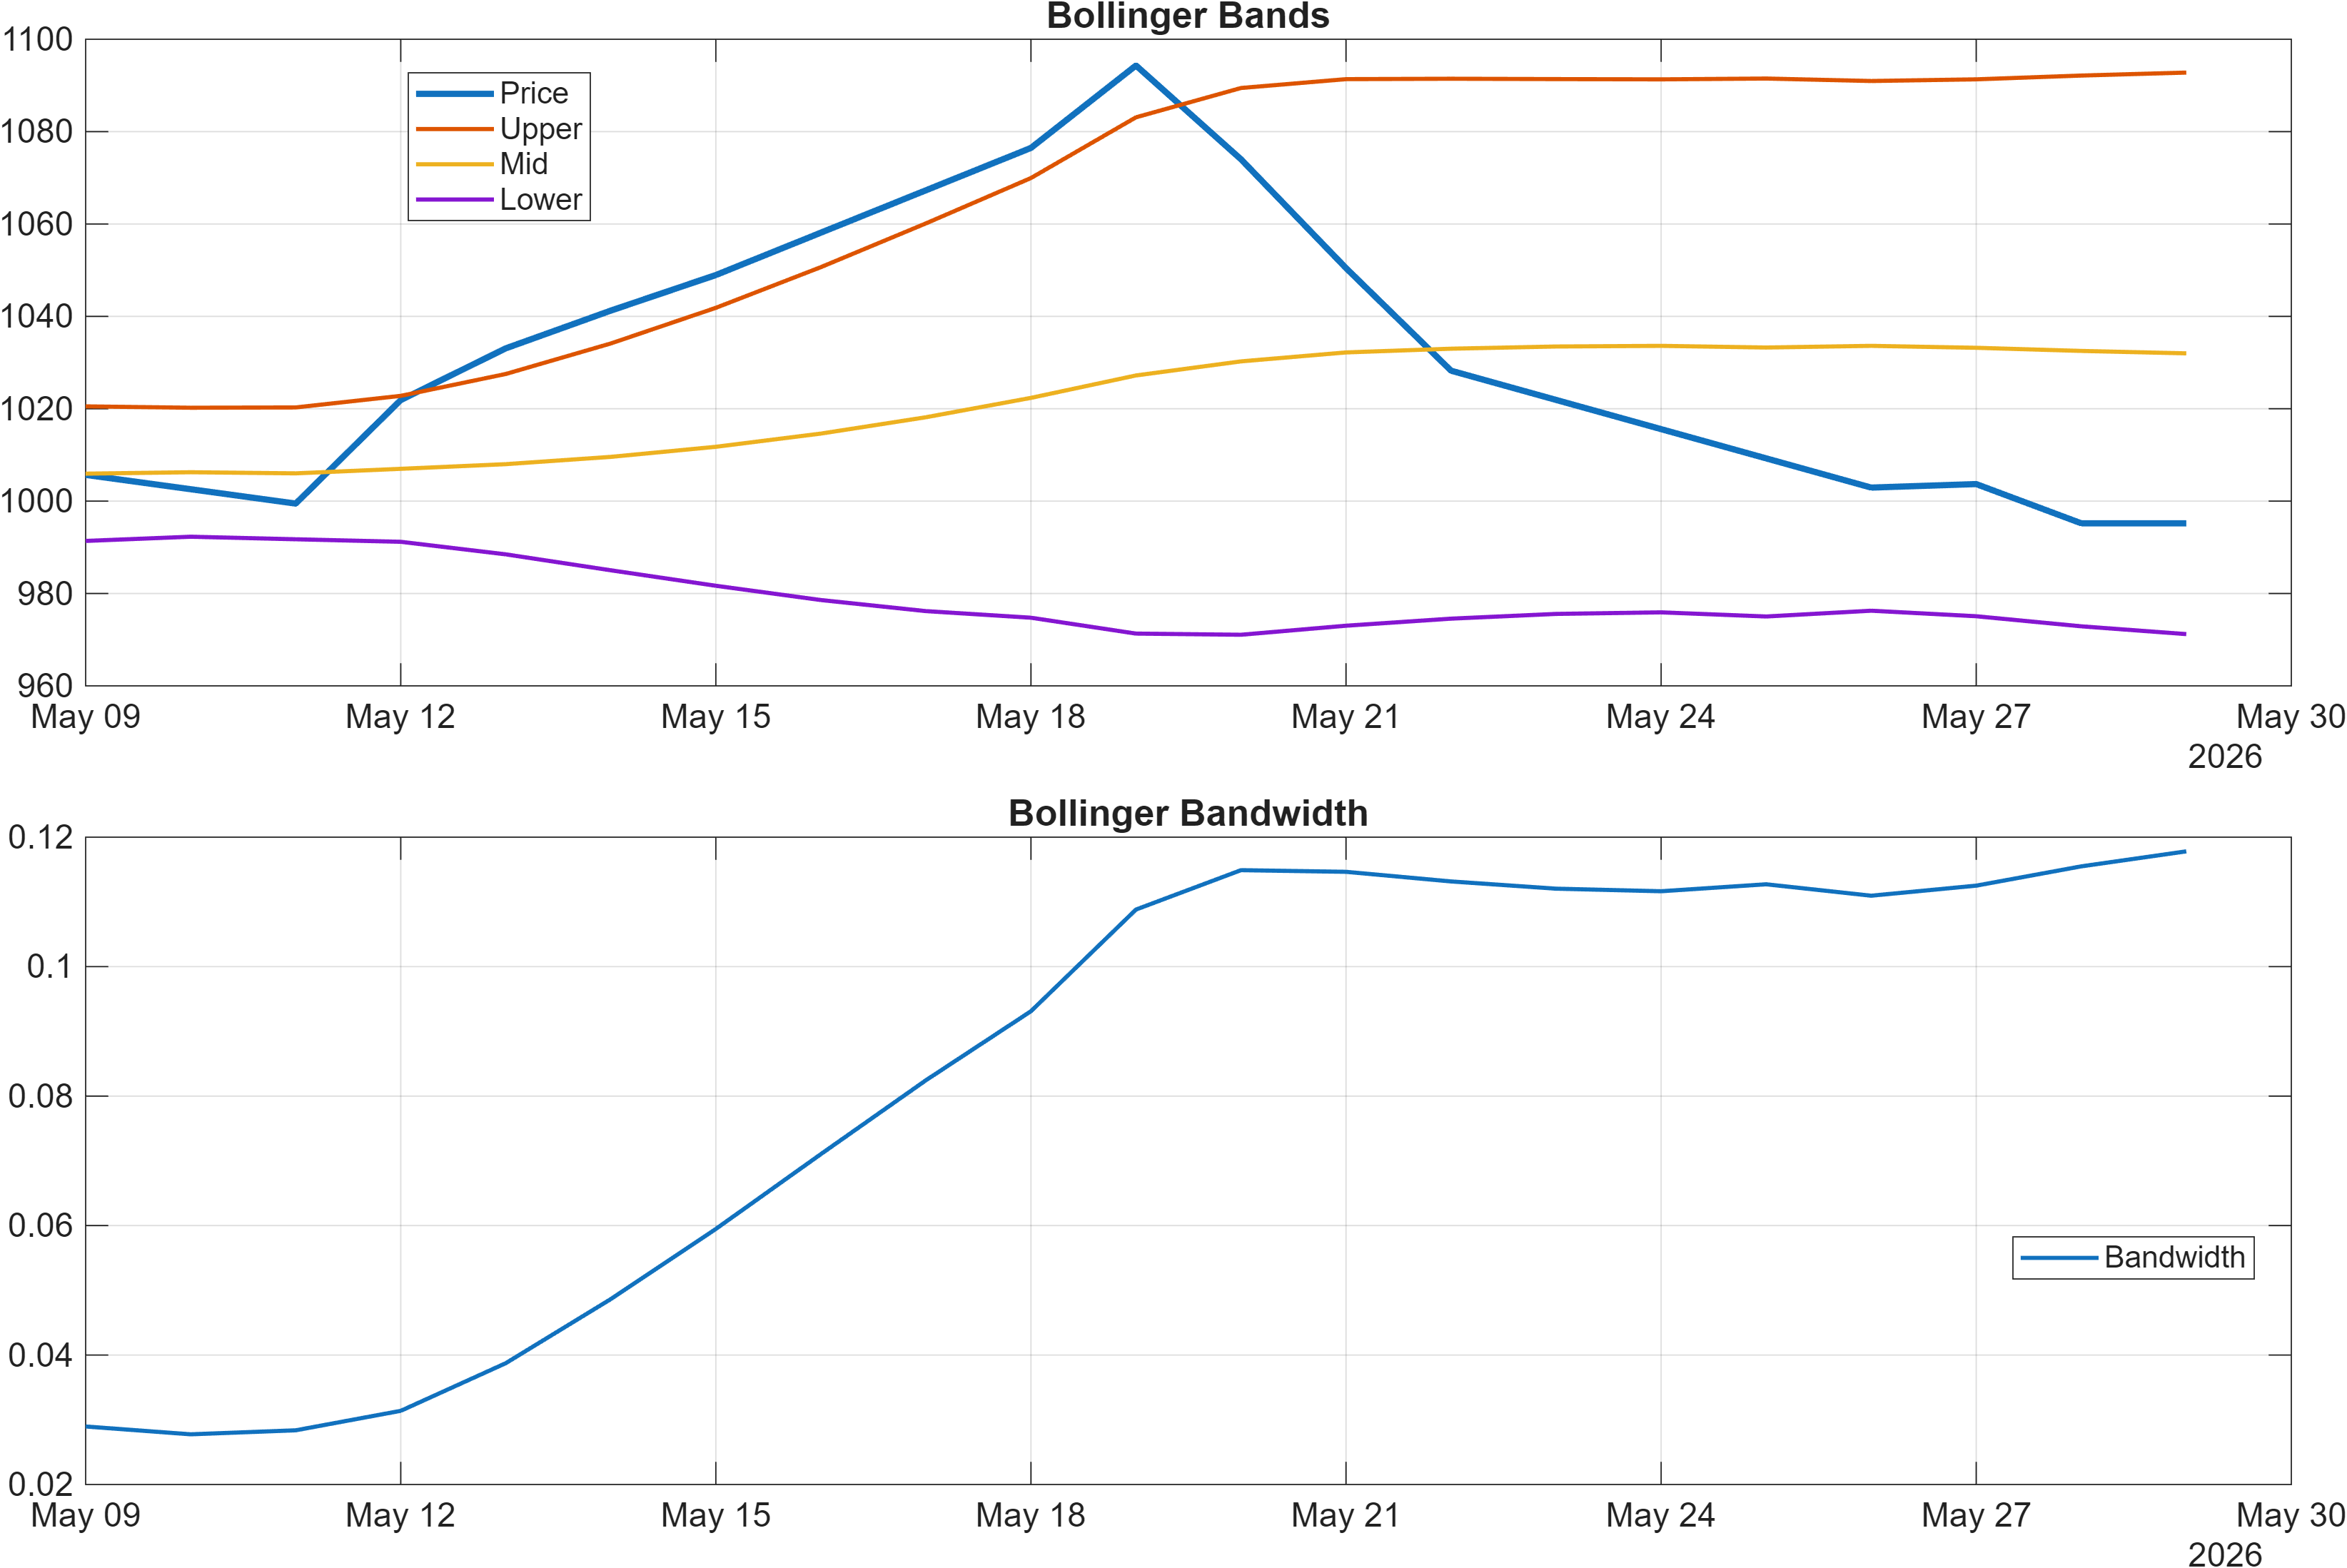
Interpretation: Bandwidth (volatility regime) latest = 0.1178.
Momentum: oversold pressure without a confirmed turn
Momentum signals are presently skewed to caution. RSI(14) prints 31.59, which is consistent with weak near-term momentum and aligns with the stated RSI bias as Bearish. At the same time, the MACD histogram at -7.7874 indicates downside momentum remains dominant rather than stabilizing—an important distinction, because depressed RSI levels can persist during downswings when MACD fails to improve.
Volatility regime: contained, not expanding
Bollinger bandwidth at 0.1178 suggests volatility is not in an acute expansion phase. That matters for process: when volatility is contained, breaks above resistance or below support tend to require clearer volume confirmation to be trusted, whereas volatility expansion can generate more frequent false positives. Here, the relatively moderate bandwidth points to a market that is compressing rather than cascading.
Cross-signal alignment: selective strength vs broad weakness
There are also early “counter-currents” worth noting from the broader dashboard: Stoch %K at 0.9741 is flagged Bullish, while trend-stat momentum TS Mom(20) at -7.377 remains Bearish. This combination is consistent with a short-lived bounce attempt inside a broader momentum drawdown. In practice, the cleaner confirmation would be MACD histogram improvement alongside price reclaiming the MA50; absent that, the momentum stack is better read as “pressure easing intermittently” rather than “trend reversal.”
4) Support / Resistance zones
Support ~ 983.7267 | Resistance ~ 1061.1150
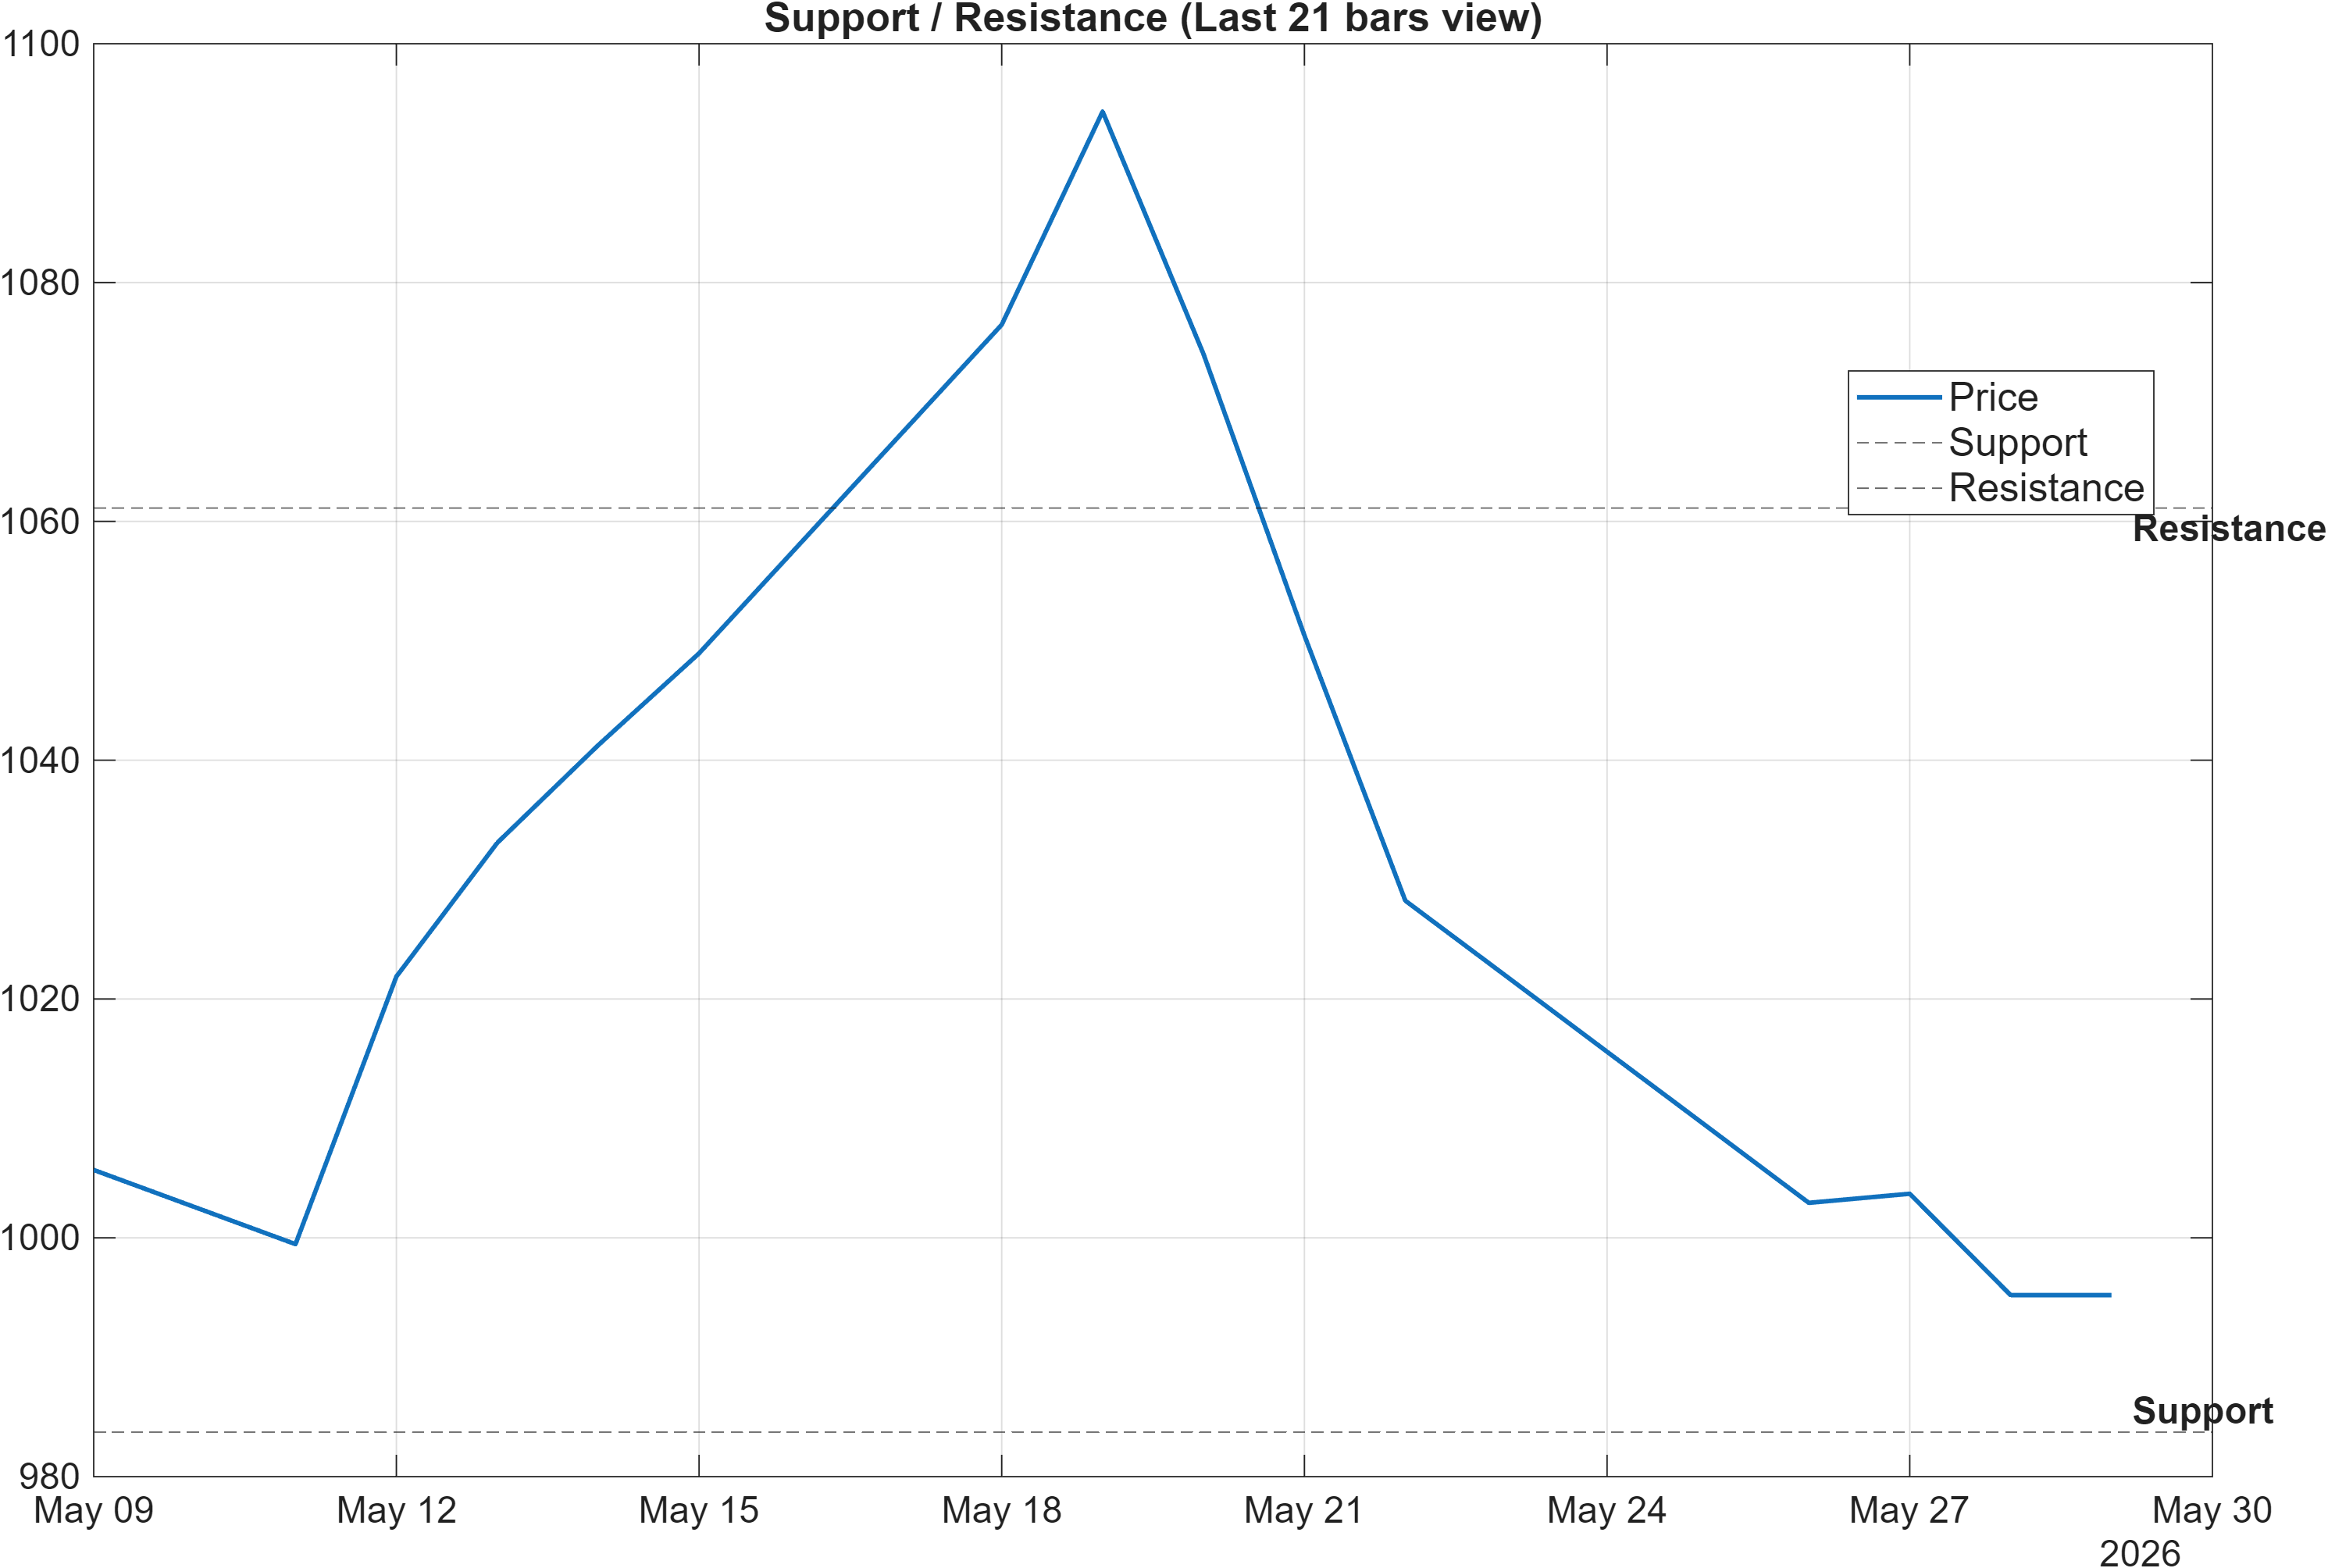
Scenario view: Break above resistance with volume → continuation. Close below support → signal deterioration risk.
Decision zones: where probability shifts are most likely
The current map is comparatively clean: 983.7267 defines the primary support region and 1061.1150 defines the key overhead resistance. With technical confluence skewed bearish (overall blended technical score -0.420), the support zone becomes the first area where “risk containment” is tested. A close below 983.7267 would be consistent with the model’s stated deterioration scenario and would align with currently negative momentum readings (RSI 31.59, MACD histogram -7.7874).
On the other side, the resistance zone is not just a level; it is a confirmation threshold. The framework explicitly requires a break above 1061.1150 with volume to support continuation. That condition is particularly relevant because volatility is not currently elevated (bandwidth 0.1178), which can make level breaks more vulnerable to rejection without participation.
How these levels interact with the signal stack
The support band also lines up with the 20-day low context (LLOW(20) 985.1) and is close enough that minor overshoots could occur without changing the broader structure—yet the scenario language indicates that a close below support is the meaningful trigger. Meanwhile, the 20-day high context (HHIGH(20) 1096) sits above resistance, suggesting that if 1061.1150 is reclaimed and sustained, there is room for the market to re-test higher reference points. In short: the levels are likely to act as filters for whether the current bearish technical pressure is resolving into stabilization or extending into trend deterioration.
5) Quant Technical Dashboard (18 Signals)
KGNAI AI Technical Analysis Score (Deep Reinforcement Learning): Rank #1661 out of 2047 (Rank 1 represents the strongest technical positioning and a higher probability of favorable price behavior. As ranks increase toward the maximum, the probability of favorable outcomes weakens and bearish positioning becomes more dominant.) | Label: Bearish | Score: -0.623
18-Signal Technical Confluence Score: -0.333 (Bearish)
Overall Technical Score (18-signal confluence + DRL rank blend): -0.420 (Bearish)
Note: The blended score reflects signal strength weighted against broader AI technical ranking, which may temporarily diverge.
Blended technical score breakdown: -0.420 (Bearish | Bull 4 / Bear 10 / Neutral 4)
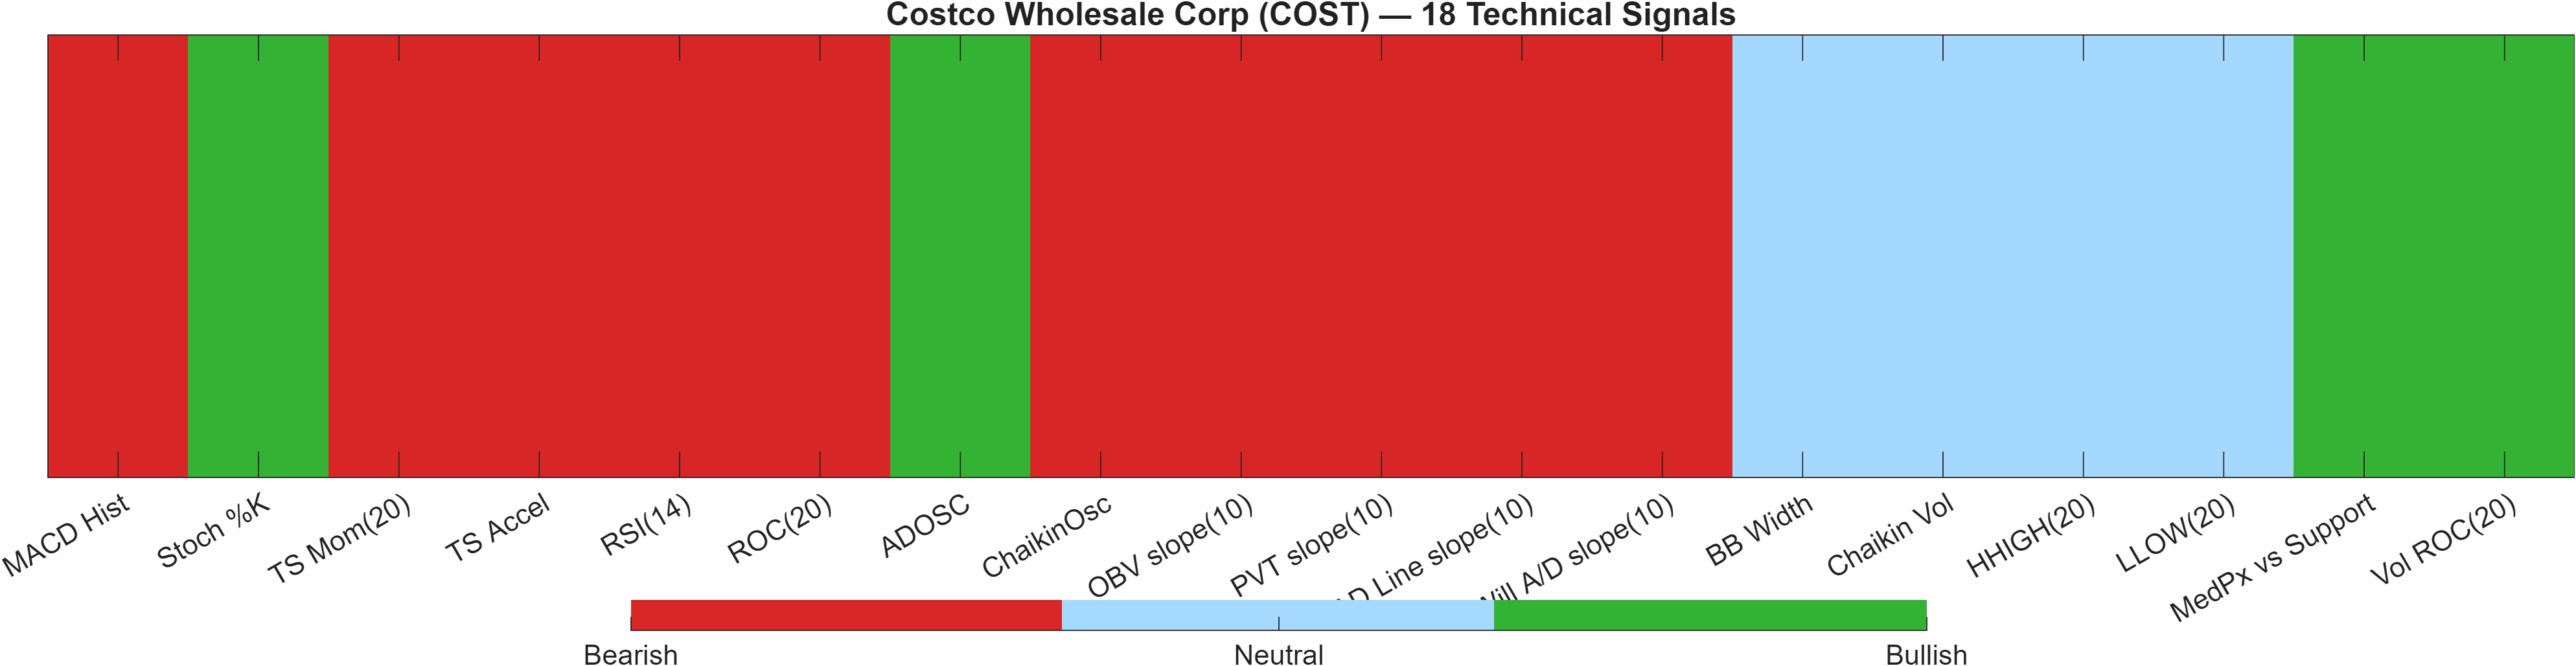
Confluence read: breadth of bearish signals outweighs isolated positives
The technical layer is decisively cautious in aggregate. The 18-signal confluence score of -0.333 is labeled Bearish, and the blended overall technical score of -0.420 remains bearish after integrating the separate deep reinforcement learning (DRL) model. Importantly, the DRL technical rank at #1661 out of 2047 sits in the weaker portion of the universe, reinforcing that the bearish view is not confined to one indicator family.
Breadth also matters: the blend reports Bull 4 / Bear 10 / Neutral 4. That distribution suggests the bearish reading is coming from multiple independent channels rather than a single outlier. Momentum and trend-stat components are a key driver (e.g., MACD histogram -7.787 and TS Mom(20) -7.377 both bearish), while several volume/flow measures also skew negative (e.g., OBV slope(10) -1.665e+07 and AD Line slope(10) -1.536e+07), implying that participation has not consistently supported upside attempts.
Where the dashboard shows resilience
The bullish signals are not absent; they are simply fewer and more specific. Stoch %K (0.9741) and ADOSC (3.723) are flagged bullish, and Vol ROC(20) at 41.55 also reads bullish—signals that can align with short-term rebounds or rotation-driven rallies. However, given the bearish composite and the weak DRL rank, these positives currently function more as counter-trend evidence than as a wholesale change in regime.
Signal table (Bull/Bear/Neutral)
| Indicator | Value | Signal |
|---|---|---|
| MACD Hist | -7.787 | Bearish |
| Stoch %K | 0.9741 | Bullish |
| TS Mom(20) | -7.377 | Bearish |
| TS Accel | -4.143 | Bearish |
| RSI(14) | 31.59 | Bearish |
| ROC(20) | -0.7358 | Bearish |
| ADOSC | 3.723 | Bullish |
| ChaikinOsc | -3.962e+06 | Bearish |
| OBV slope(10) | -1.665e+07 | Bearish |
| PVT slope(10) | -2.146e+05 | Bearish |
| AD Line slope(10) | -1.536e+07 | Bearish |
| Will A/D slope(10) | -166.4 | Bearish |
| BB Width | 0.1178 | Neutral |
| Chaikin Vol | -6.207 | Neutral |
| HHIGH(20) | 1096 | Neutral |
| LLOW(20) | 985.1 | Neutral |
| MedPx vs Support | 19.41 | Bullish |
| Vol ROC(20) | 41.55 | Bullish |
Interpretation: Indicator-level signals form the base confluence, which is then adjusted using a separate AI-driven technical ranking model. The final technical score summarizes this combined view.
6) News sentiment + extractive gist
Sentiment score (avg): 0.113 | Positive: 37% | Neutral: 54% | Negative: 8%
KGNAI AI News Sentiment Score (normalized -1 to +1): 0.98 (as of 2026-05-29) | Label: Bullish | Overall news score: 0.89
Positive Developments
Recent coverage across major financial outlets indicates a constructive narrative bias around Costco’s operating momentum and business mix. The news scoring supports that tilt: the normalized sentiment score is 0.98 with an overall news score of 0.89, and the distribution shows 37% positive items versus 8% negative. Qualitatively, the positive stream emphasizes continued demand resilience, membership-related strength, and ongoing traction in digital initiatives. This tone can matter tactically when the chart is working through a pullback, because supportive narrative flow can help stabilize risk appetite near defined levels such as 983.7267. Still, the most actionable use of the positive news signal is as a contextual tailwind—not a standalone trigger—given that the technical composite remains bearish (overall technical score -0.420).
Neutral / Mixed Developments
The dominant share of items is Neutral (54%), suggesting the information set is still being processed rather than fully repriced. That aligns with a market posture where commentary focuses on valuation framing, post-volatility positioning, and incremental updates that do not, on their own, change the probability regime. This “mixed but not alarmed” stream fits the cross-sectional rank picture as well: daily (#1080) and weekly (#988) positioning are neutral, while the 3-month window (#310) is stronger. The net effect is a bias toward waiting for confirmation—either technical improvement (e.g., MACD histogram moving off -7.7874) or price resolving away from the support/resistance boundaries.
Negative / Risk Signals
Negative coverage remains a minority at 8%, but it is directionally relevant because it overlaps with what the chart is already expressing: near-term pressure and uncertain follow-through. Risk-oriented commentary tends to cluster around expectations management and the possibility that outcomes are “good but not exceptional,” which can tighten the tolerance for elevated valuations and increase sensitivity to any additional momentum weakness. With RSI(14) at 31.59 and the technical breadth skewed bearish (Bear 10 signals versus Bull 4), even a small negative information impulse can have outsized price impact near support. In this setup, negative news functions less as a fundamental verdict and more as a catalyst for regime confirmation if price closes below 983.7267.
- What to monitor next: Whether price can reclaim resistance at 1061.1150 with confirming volume.
- What to monitor next: Any improvement in momentum structure, particularly MACD histogram moving up from -7.7874 alongside RSI stabilization from 31.59.
- What to monitor next: Whether the market treats 983.7267 as defended support or allows a close below it (deterioration risk).
Sources referenced: Reuters, Bloomberg, Yahoo Finance, MarketWatch, Investing.com
7) Sources
News source links are intentionally omitted in this format. Not available in the provided data.
Snapshot: AI Rank (Short–Mid–Long): Neutral (Neutral–Neutral–Neutral) · Technical Confluence: Bearish · Key Levels: Support ~983.73 | Resistance ~1061.12 · News Sentiment: Neutral
You may also like: How KGNAI AI ranks instruments across global markets
Disclaimer: KGNAI provides AI-generated analytics and educational market commentary only. This is not financial advice. Markets involve risk. Always do your own research.