
LendingClub Corp (LC) Technical & Rank Update — 27-May-2026 | Bearish Ranks vs Bullish Technical Blend
LendingClub Corp (LC) shows a notable cross-signal tension as of 27-May-2026: KGNAI’s cross-sectional ranks remain positioned in the weaker tail of a 2048-instrument universe, while parts of the technical stack lean constructive. The daily rank at #1882 and monthly rank at #2012 point to persistent relative weakness, yet the blended technical read is 0.375 (Bullish), supported by momentum/accumulation inputs such as RSI(14) = 65.78 and a positive MACD histogram = 0.05655. Volatility appears contained with Bollinger Bandwidth = 0.1069, suggesting price is not currently in an expanded, disorderly regime. Key decision zones are well-defined at support ~ 14.0900 and resistance ~ 17.8167, making validation/invalidation conditions clearer than in many setups.
- Rank stance: Short Bearish | Mid Bearish | Long Bearish (notably weak daily #1882 and monthly #2012 out of 2048)
- Technical confluence: Neutral at 0.278, but overall blended technical is Bullish at 0.375
- Key levels: Support ~ 14.0900 | Resistance ~ 17.8167
- News sentiment bias: Bullish (normalized 1.00; avg sentiment 0.132)
- Confirmation / invalidation: Strength is better supported on a break above 17.8167 with volume; a close below 14.0900 increases deterioration risk per the scenario framing.
KGNAI evaluates assets using large cross-sectional datasets built from millions of structured data points. Inputs incorporate fundamental metrics, technical structures, and systematically processed news sentiment. Statistical models, machine learning, and AI frameworks are used to assess relative positioning, signal alignment, and probabilistic behavior across broad universes.
- Ranks are comparative across the tracked universe, not absolute price targets.
- Confluence reflects alignment among independent signal groups.
- Support/resistance levels are probabilistic decision zones, not guarantees.
- Sentiment provides contextual bias within the broader analytical framework.
1) KGNAI AI Analysis
Region: USA
Total universe size: 2048 ranked instruments
- Daily rank: #1882 out of 2048 — Bearish
- Weekly rank: #1616 out of 2048 — Neutral
- Monthly rank: #2012 out of 2048 — Bearish
- 3-Monthly rank: #1884 out of 2048 — Bearish
- 6-Monthly rank: #1752 out of 2048 — Bearish
- Yearly rank: #1732 out of 2048 — Bearish
LC’s rank profile is broadly bearish across most horizons, with the monthly reading at #2012 placing it in the extreme weak tail of the 2048-name universe. That persistence—daily at #1882, 3-month at #1884, and yearly at #1732—suggests the current market behavior is not merely a short-lived anomaly, but a longer-running relative positioning issue.
The one partial offset is the weekly rank at #1616, labeled Neutral. In regime terms, that can be read as a shorter-horizon “stabilization attempt” inside a still-negative broader context: the weekly window is not as weak as the monthly tail, but it also does not indicate leadership. When a weekly neutral sits alongside bearish monthly and 3–6 month ranks, it commonly reflects a market that can bounce tactically while still struggling to hold improved relative standing.
KGNAI’s framing is probabilistic and comparative: higher rank numbers generally correspond to weaker probability of favorable behavior across the broader tracked universe. With LC’s ranks clustered toward the high end, the bar for technical confirmation becomes higher—especially around the clearly defined resistance at 17.8167 and the need to avoid structural damage below 14.0900.
Term view: Short-term: Bearish. Mid-term: Bearish. Long-term: Bearish.
2) Price & trend overview
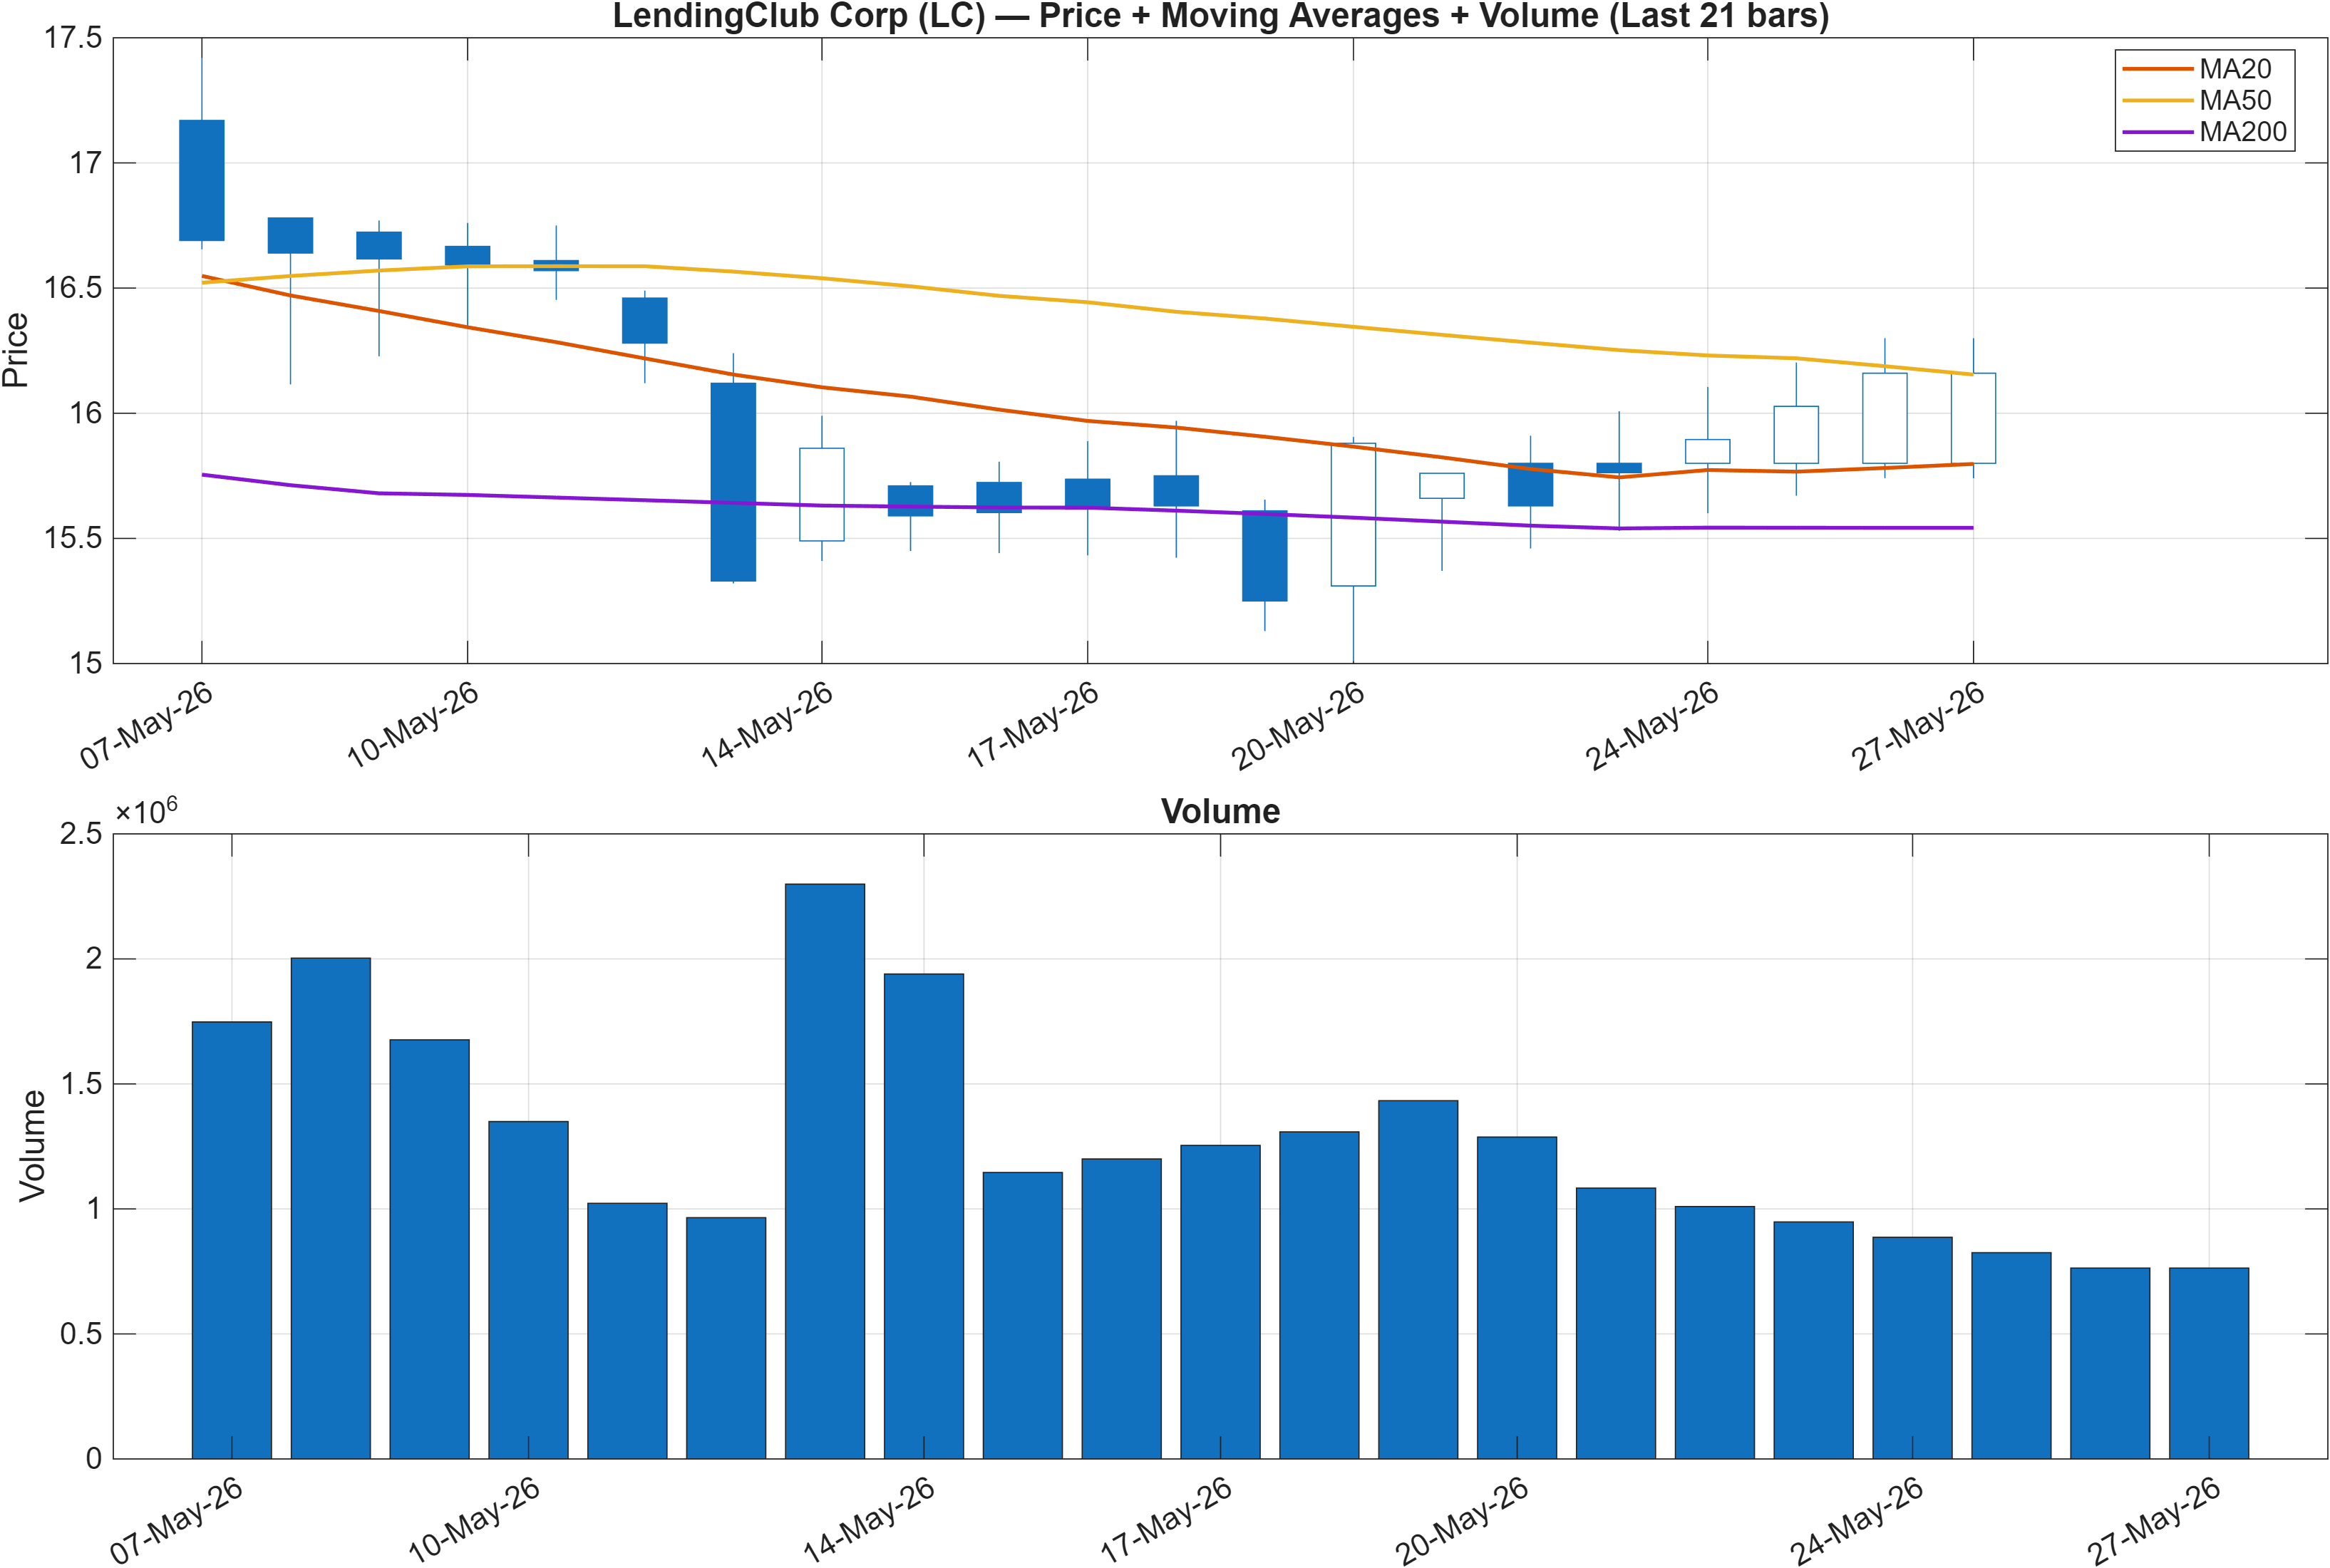
The moving-average configuration reads constructively: Close vs MA50 = Bullish and MA50 vs MA200 = Bullish. This combination typically characterizes an equity that has achieved at least a local trend repair, with price holding above its intermediate trend line and the intermediate trend line positioned above the longer baseline.
The analytical tension is that trend structure (via moving averages) looks healthier than the cross-sectional rank stance. When ranks remain deep in the weak tail (for example, #1882 daily and #2012 monthly) despite bullish MA relationships, it often indicates that the trend improvement has not translated into consistent relative leadership versus the broader universe—or that the move is vulnerable to mean reversion if participation fades.
The nearby probabilistic decision zones help anchor that ambiguity. With support ~ 14.0900 and resistance ~ 17.8167, the chart structure can be assessed as a bounded tape: above support, the MA structure can remain intact; near or above resistance, the market demands follow-through (ideally accompanied by volume) to validate continuation. Failure to do so can convert a “repaired trend” into a range that resolves downward, especially if the broader rank regime remains bearish across mid-to-long windows.
Practically, the MA configuration can be treated as a necessary but not sufficient condition: it reduces immediate trend downside pressure, but does not negate the persistent relative weakness implied by the multi-horizon ranks.
3) Momentum & volatility dashboard
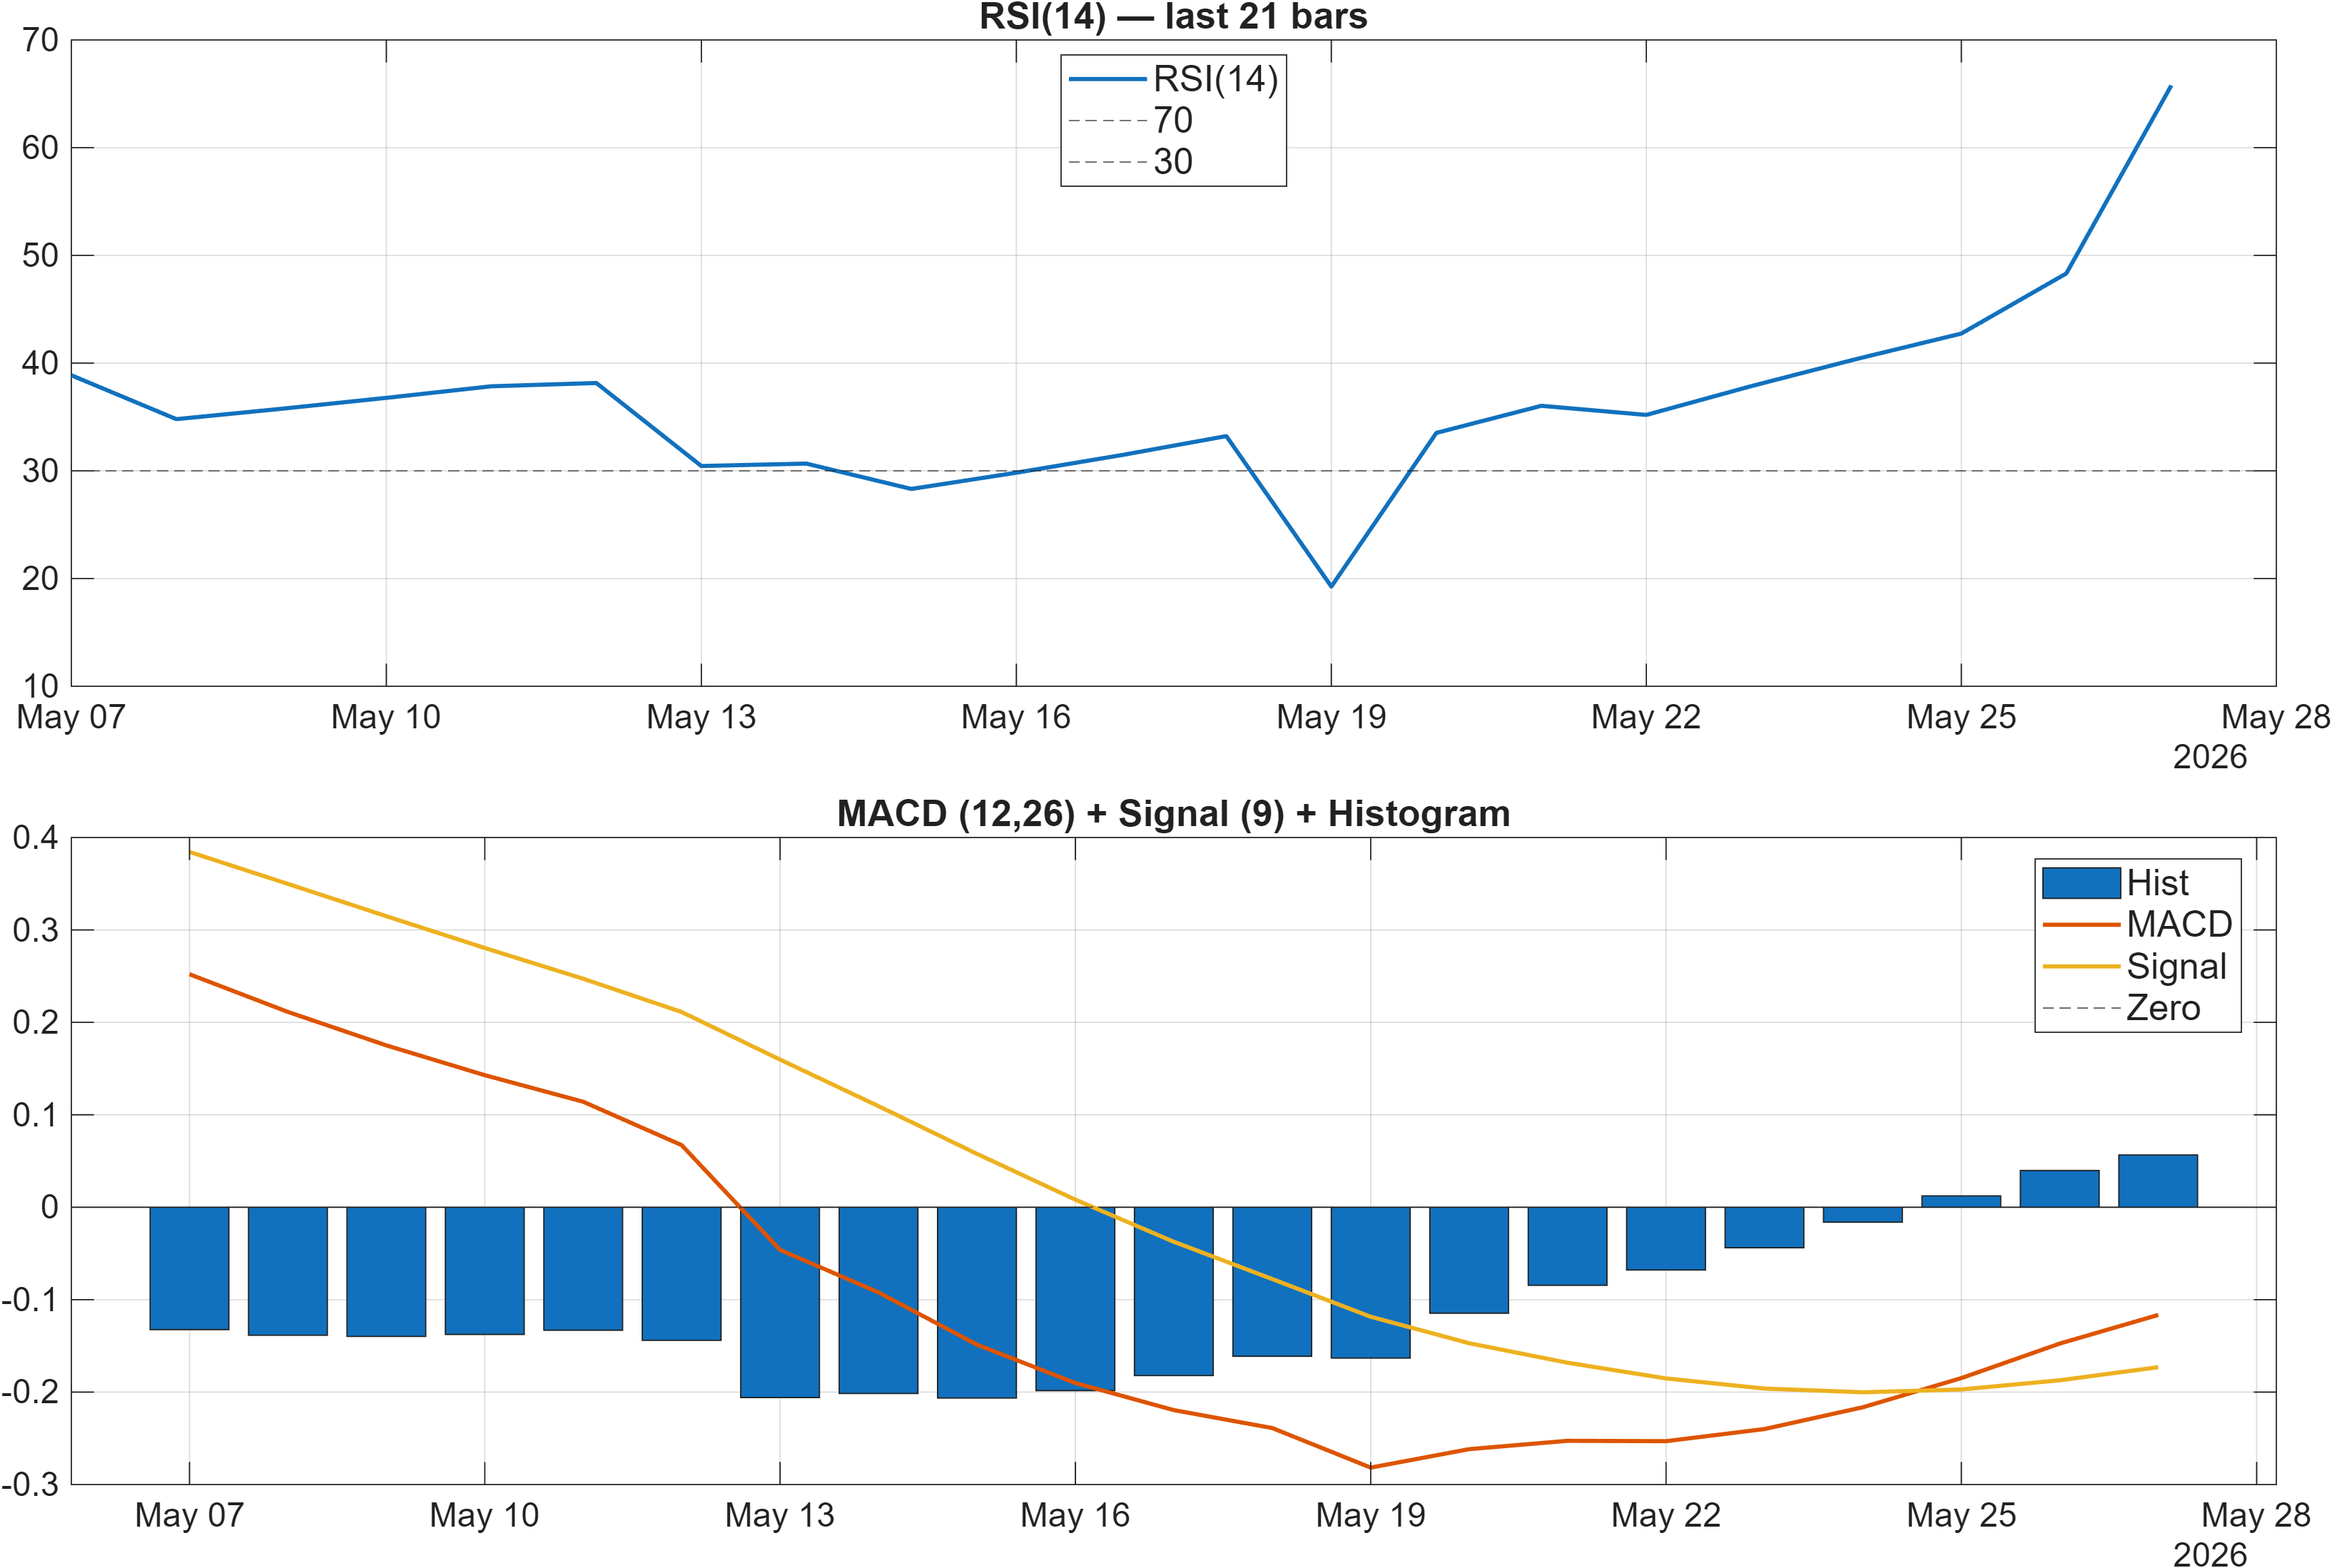
Momentum signals lean supportive on balance. The RSI bias is Bullish with RSI(14) = 65.78, placing the oscillator in a firm (though not extreme) zone that often coincides with trend-following behavior rather than capitulation dynamics. At the same time, the MACD histogram is positive at 0.0565, consistent with incremental upside momentum still present in the short-to-intermediate impulse.
The risk in this configuration is less about “no momentum” and more about late-cycle momentum. In the 18-signal table, Stoch %K = 89.15 is flagged Bearish—an internal warning that the market can be running hot on a fast oscillator even while RSI remains constructive. Add to that the mixed rate-of-change inputs (ROC(20) = -2.885 is Bearish) and it implies momentum may be uneven across lookbacks: a positive impulse can coexist with pockets of pullback pressure.
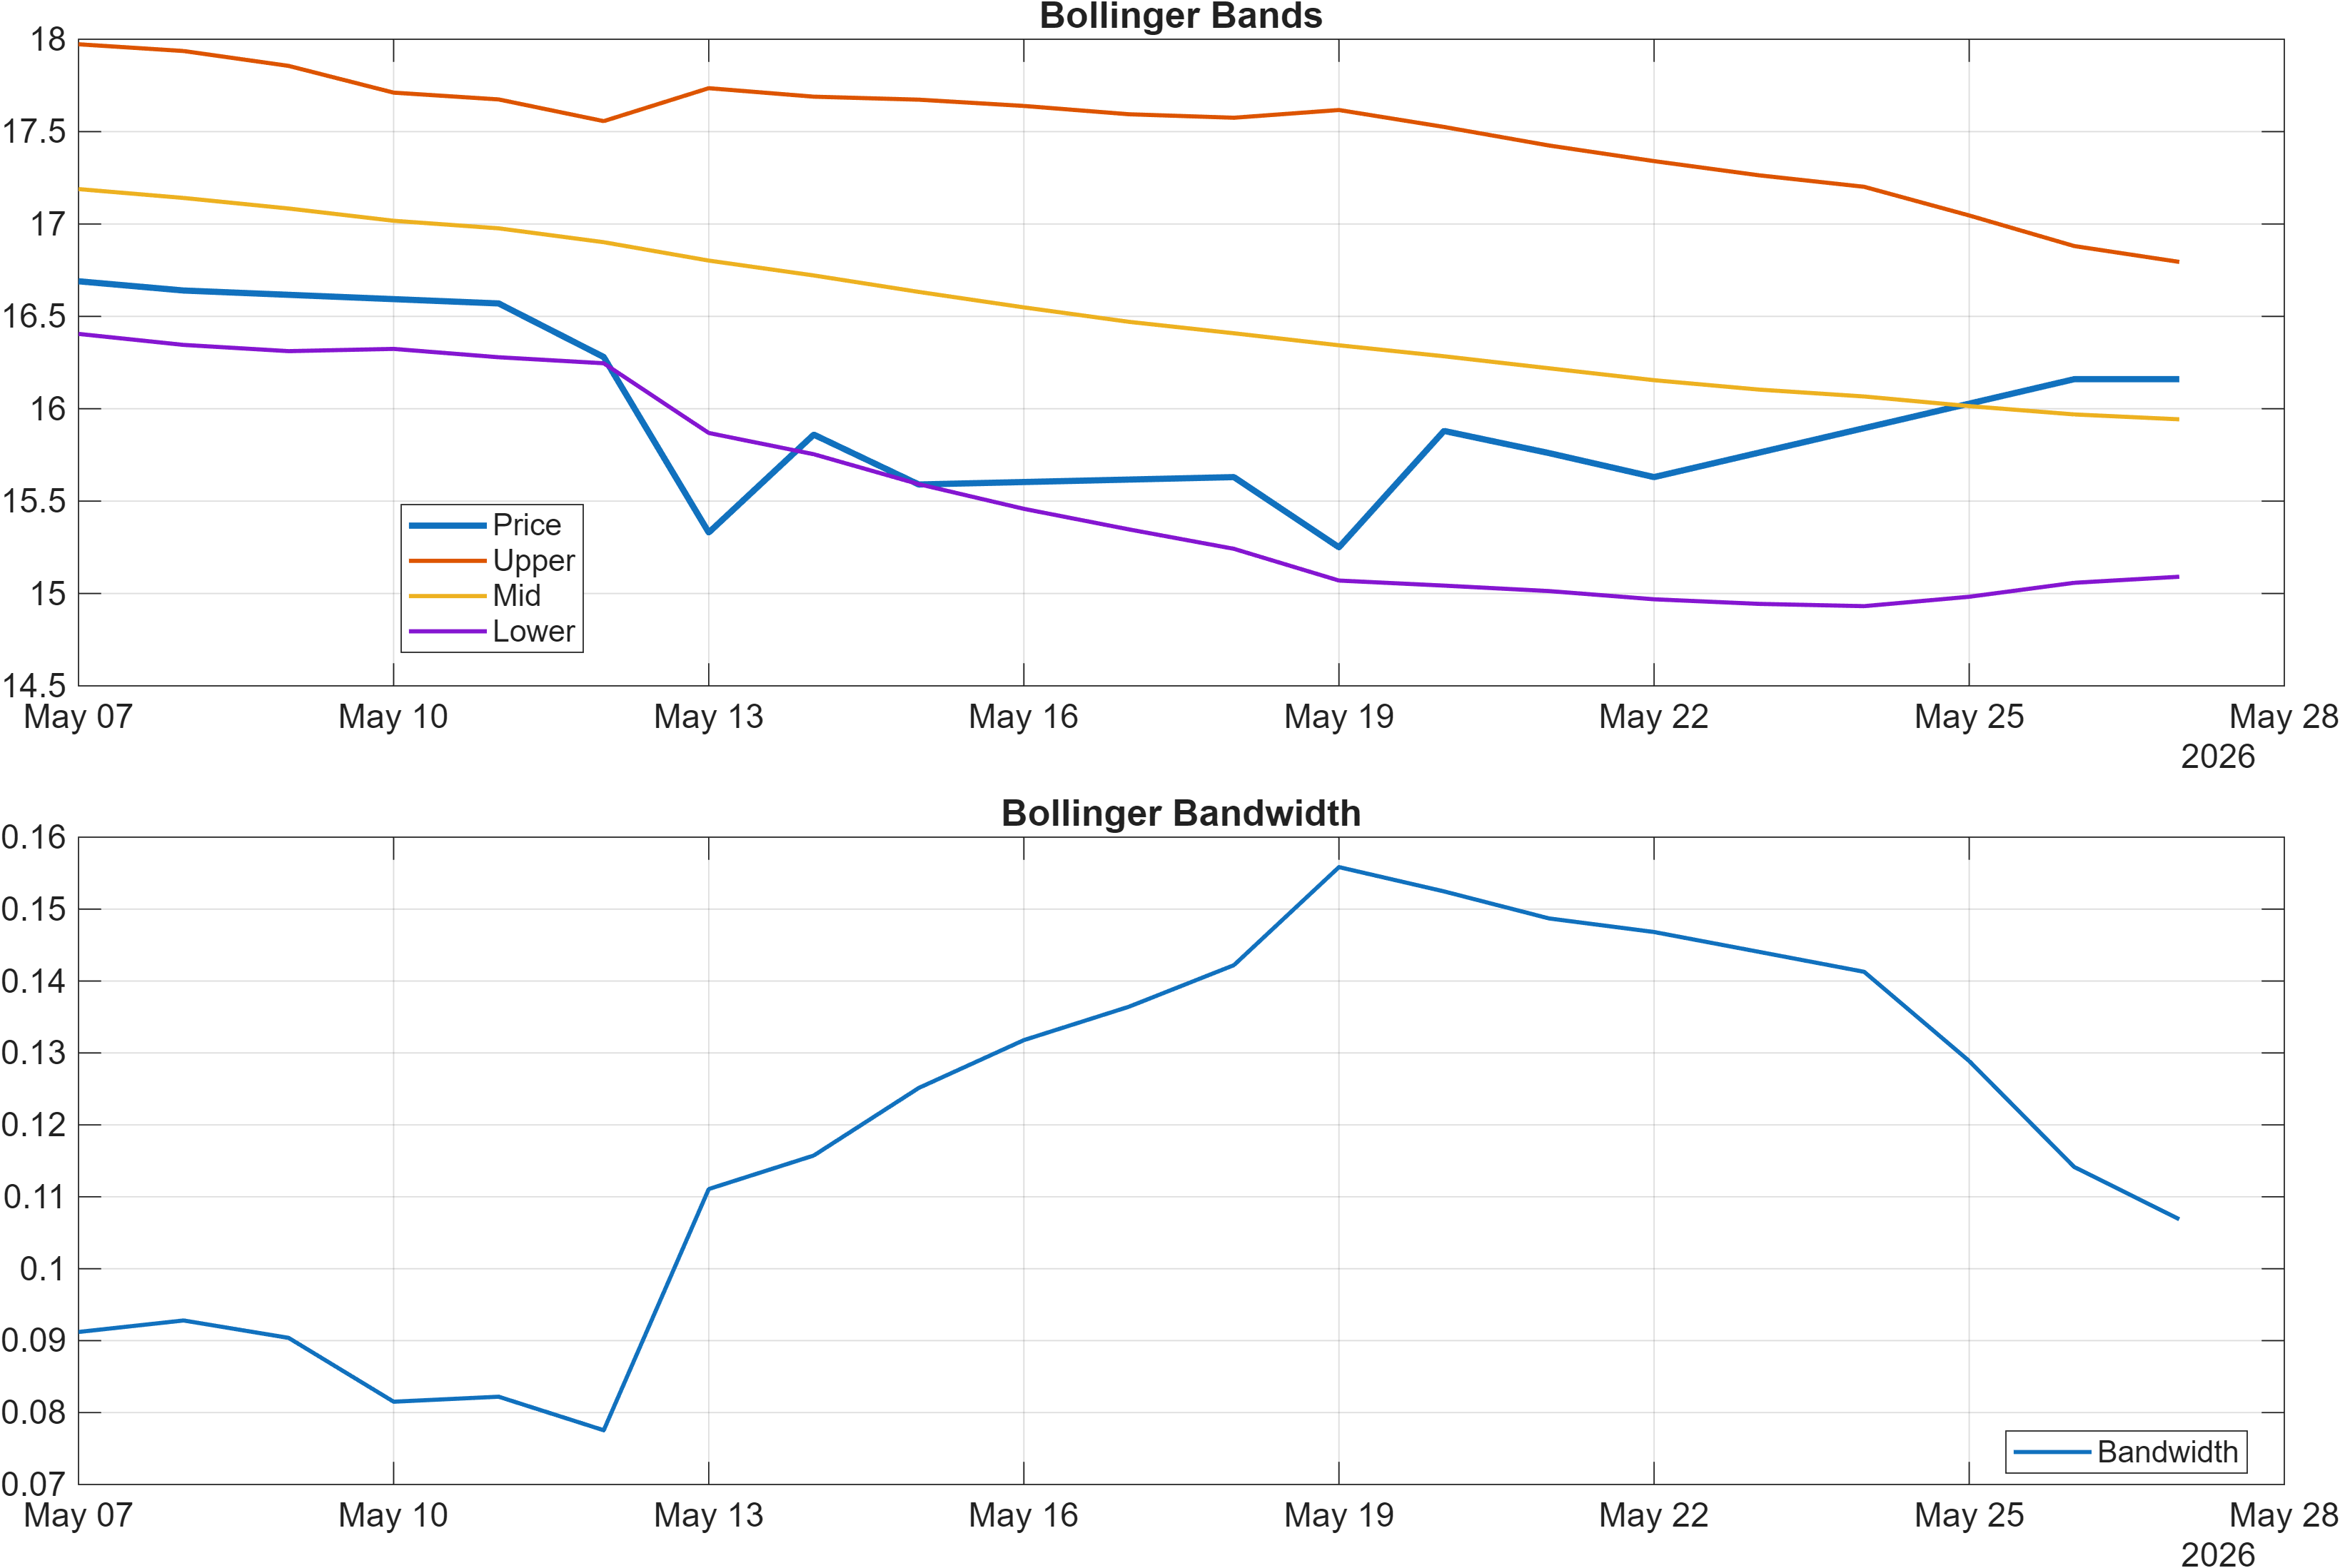
Volatility remains relatively contained with Bandwidth = 0.1069. A compressed-to-moderate bandwidth regime can support orderly trend continuation, but it also means breaks beyond well-defined levels (notably 17.8167 or 14.0900) can become more informative: in lower-volatility regimes, expansions often coincide with directional resolution. Here, momentum is constructive, but internal divergences argue for waiting for confirmation at key levels rather than extrapolating from oscillator strength alone.
4) Support / Resistance zones
Support ~ 14.0900 | Resistance ~ 17.8167
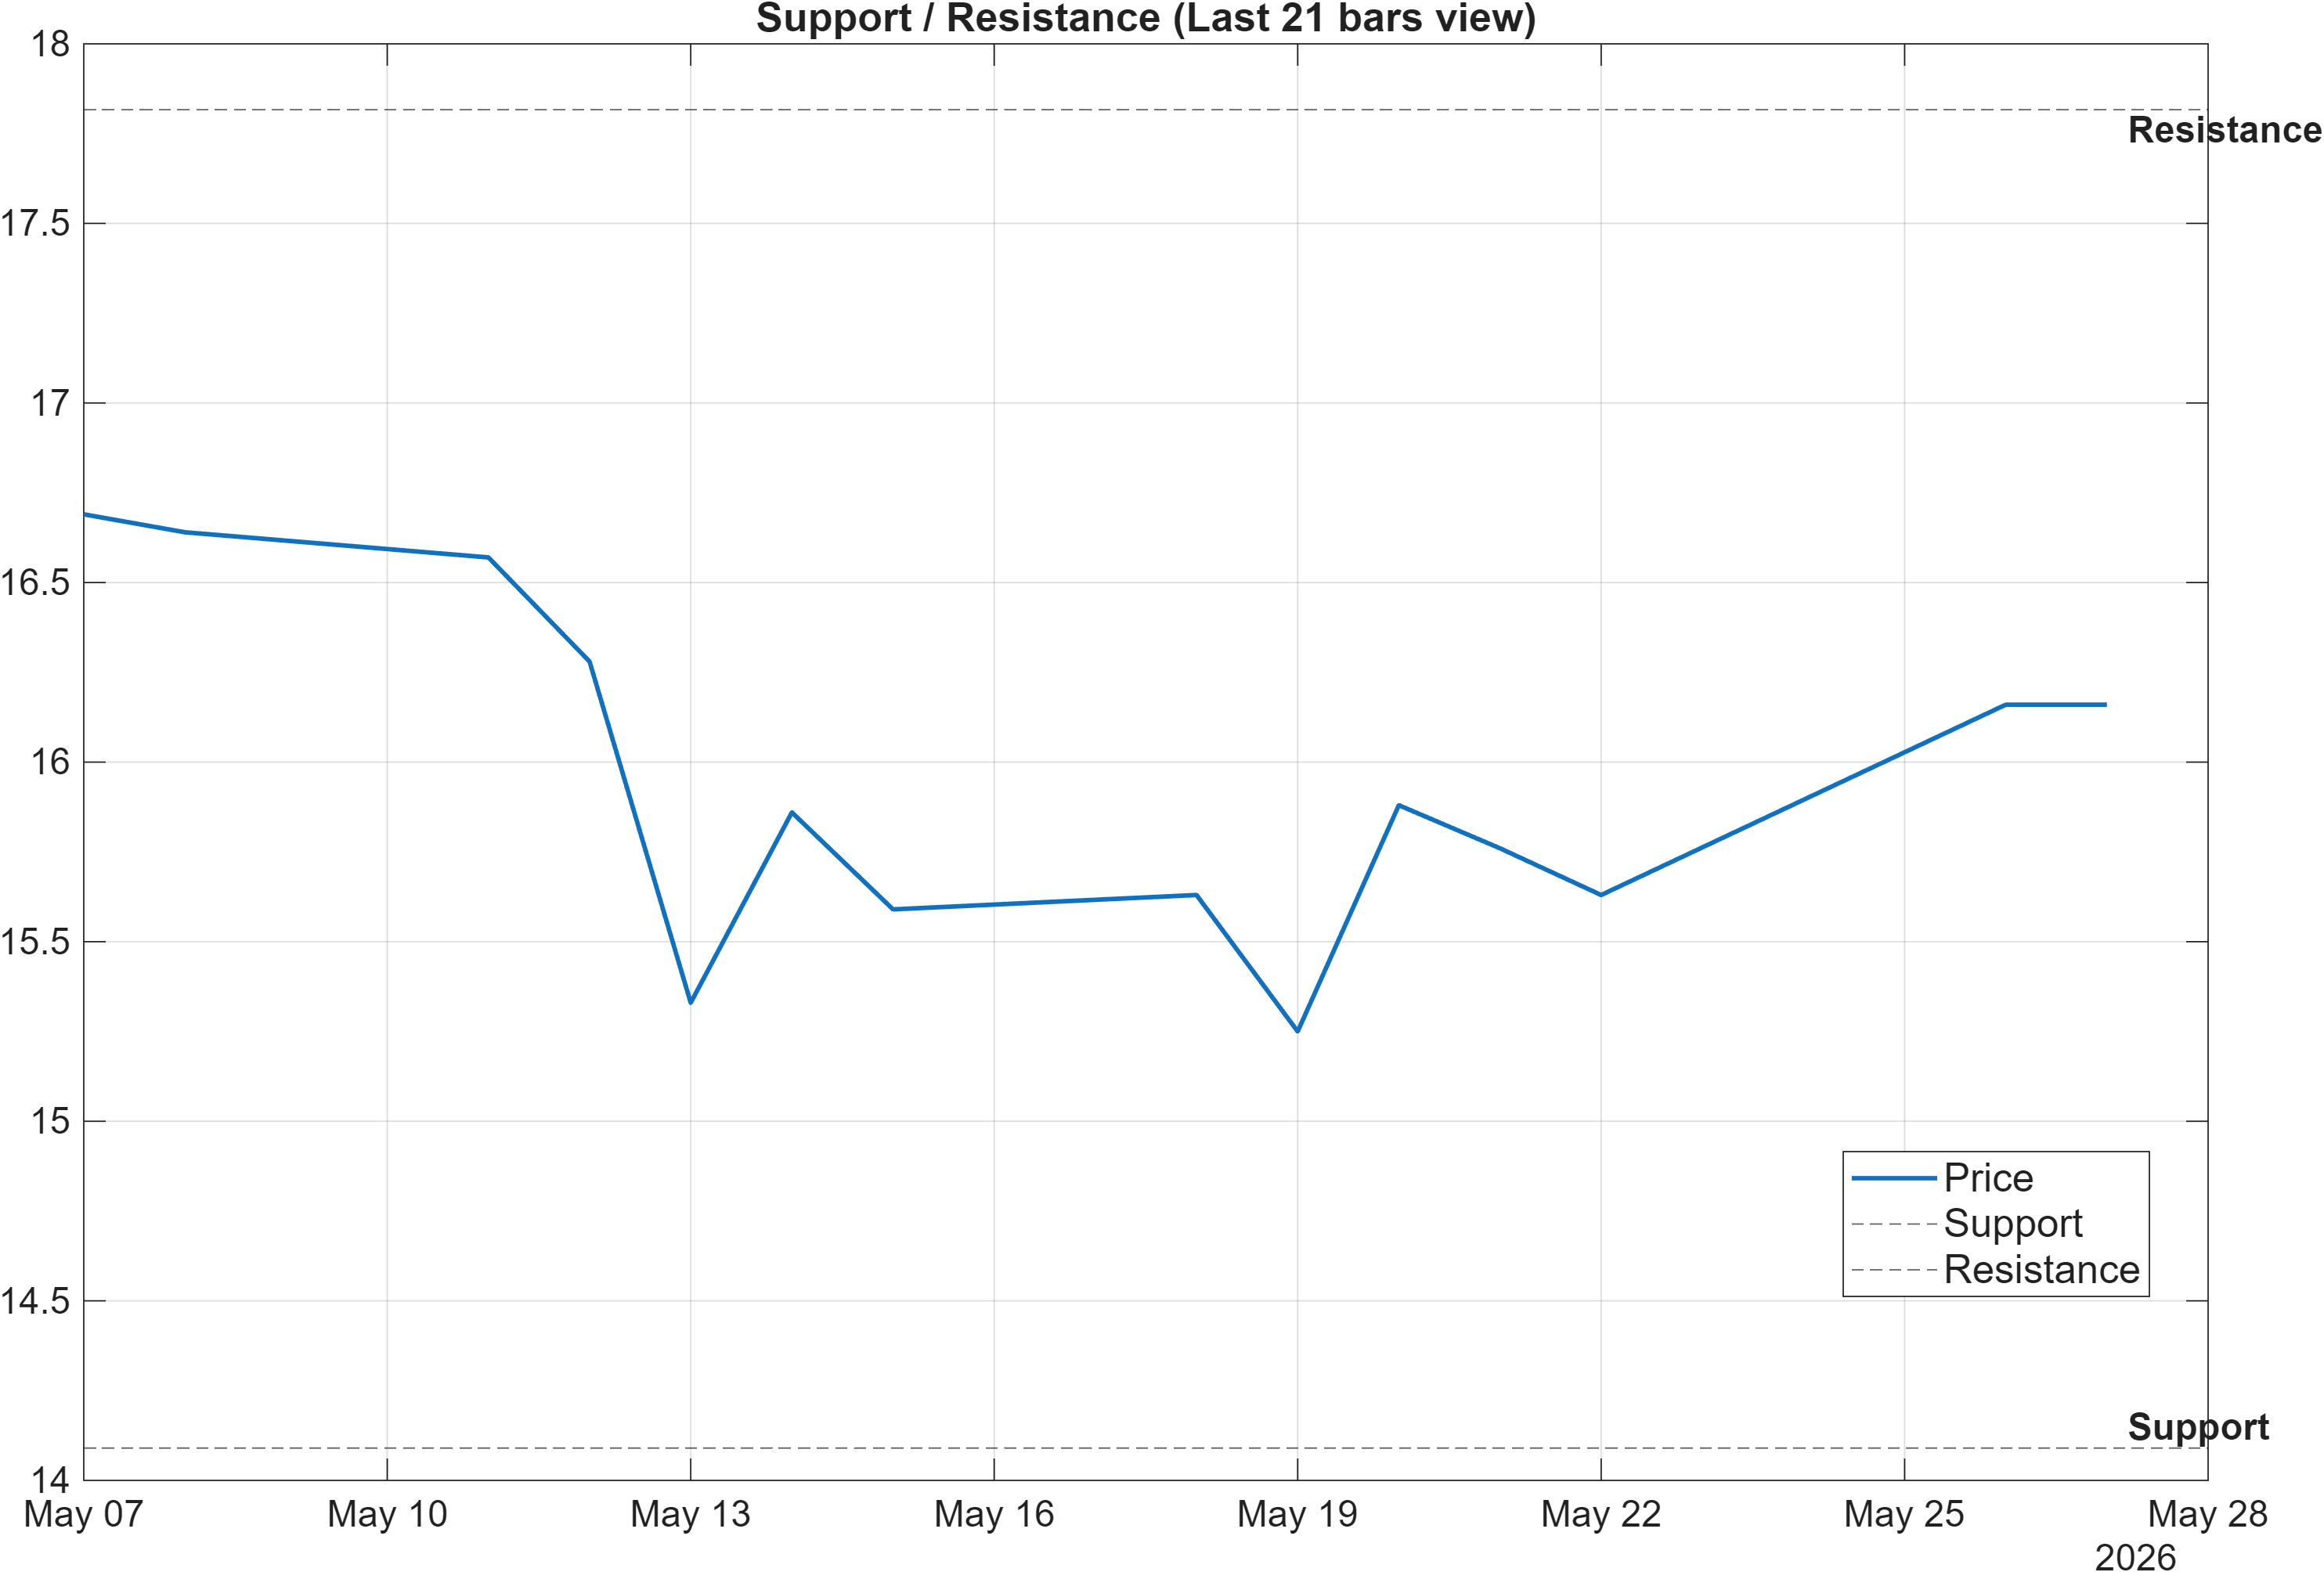
LC’s level map is clean: 14.0900 functions as the primary support zone, while 17.8167 defines the overhead decision ceiling. In a name with bearish cross-sectional ranks (daily #1882, monthly #2012), these levels become more than simple chart markers—they are practical checkpoints to determine whether constructive technical readings are translating into durable acceptance by market participants.
The scenario framing provided is asymmetric and disciplined: a break above resistance with volume signals continuation, while a close below support increases deterioration risk. Because volatility is not elevated (Bandwidth 0.1069), the market is more likely to respect these boundaries until a catalyst—technical or sentiment-driven—forces expansion.
From a market-structure perspective, the distance between support and resistance defines a tradable “decision corridor.” If price compresses within that corridor while momentum remains positive (e.g., MACD histogram 0.0565, RSI 65.78), a break attempt can occur—but the bearish rank backdrop raises the probability that upside attempts may require clearer proof (volume confirmation) to avoid becoming false breaks.
Conversely, loss of 14.0900 would not merely be a routine pullback; it would undercut the risk-defined floor that currently complements the bullish moving-average interpretation. That is the practical invalidation boundary for the “trend repair” narrative embedded in the MA signals.
5) Quant Technical Dashboard (18 Signals)
KGNAI AI Technical Analysis Score (Deep Reinforcement Learning): Rank #408 out of 2047 (Rank 1 represents the strongest technical positioning and a higher probability of favorable price behavior. As ranks increase toward the maximum, the probability of favorable outcomes weakens and bearish positioning becomes more dominant.) | Label: Bullish | Score: 0.601
18-Signal Technical Confluence Score: 0.278 (Neutral)
Overall Technical Score (18-signal confluence + DRL rank blend): 0.375 (Bullish)
Note: The blended score reflects signal strength weighted against broader AI technical ranking, which may temporarily diverge.
Blended technical score breakdown: 0.375 (Bullish | Bull 10 / Bear 5 / Neutral 3)
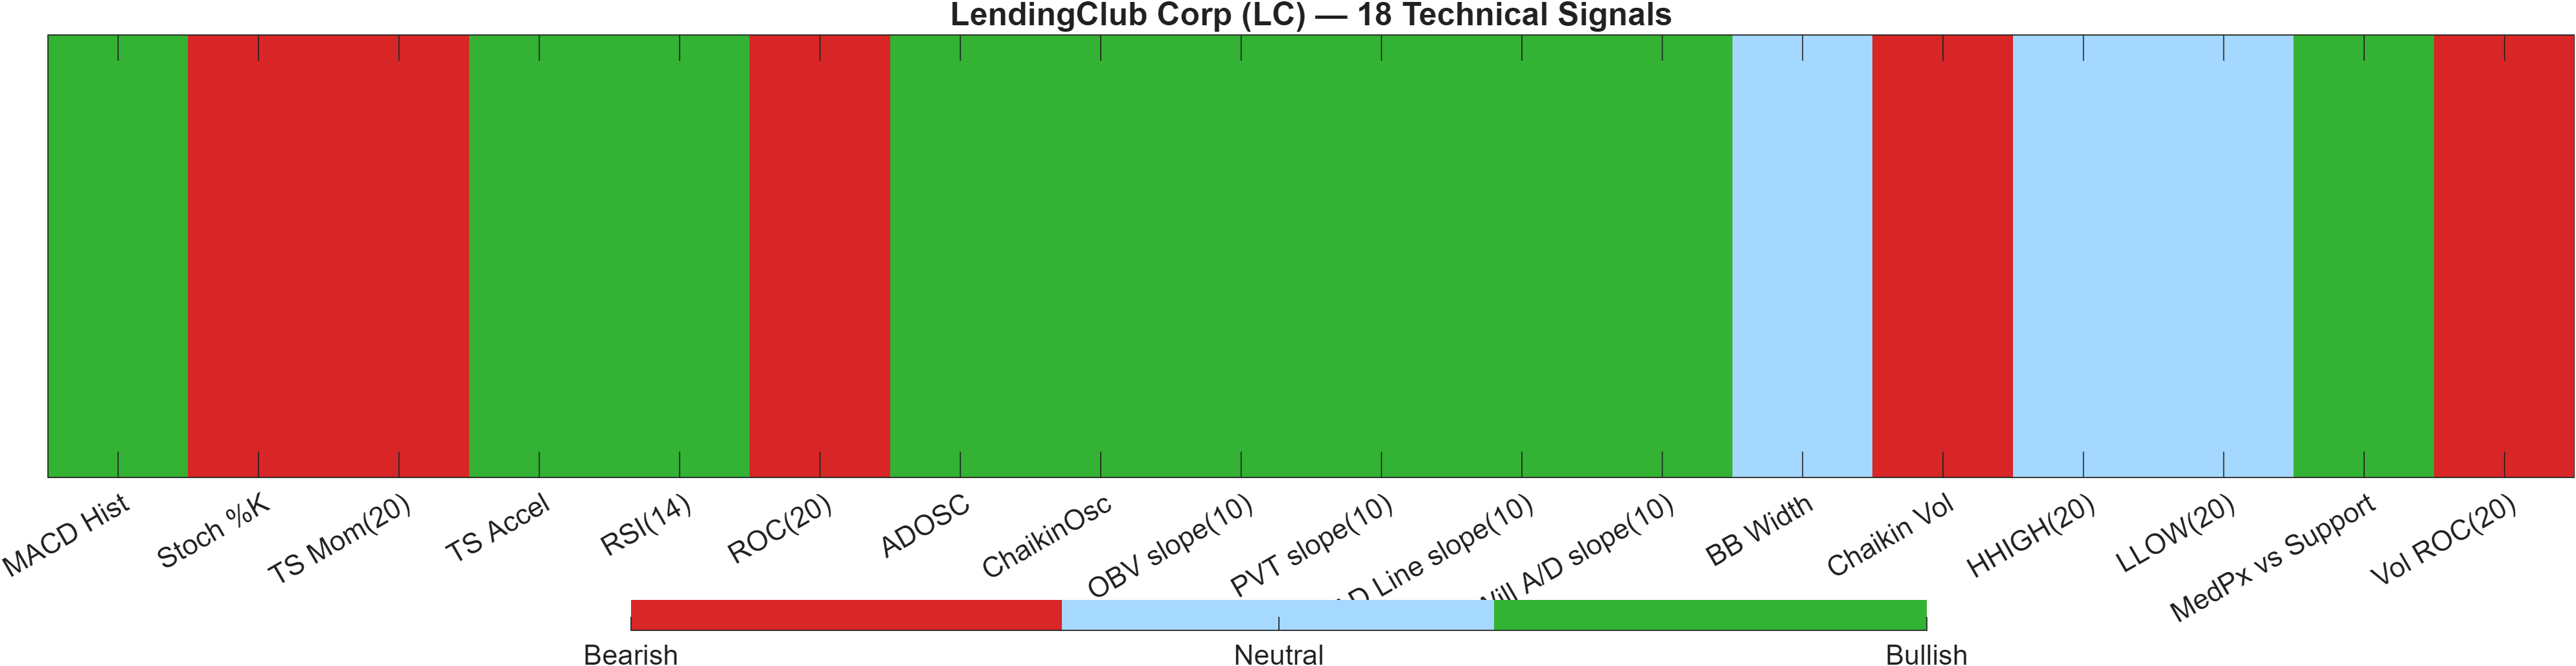
The technical dashboard shows a split stack: the 18-signal confluence is 0.278 (Neutral), yet the blended output is 0.375 (Bullish) because the DRL technical model is constructive at Rank #408 out of 2047 with a score of 0.601. Interpreting that combination, the higher-level model is effectively “giving more credit” to pattern/structure than the raw indicator basket alone.
Internally, bullish participation-style readings appear prominent. Examples include ADOSC = 82.18 (Bullish) and OBV slope(10) = 2.493e+06 (Bullish), which align with the idea that accumulation characteristics are supportive even while some momentum/rate-of-change components are mixed. On the other side, caution flags include Vol ROC(20) = -61.89 (Bearish), implying volume change is not reinforcing the move, and TS Mom(20) = -0.48 (Bearish), reflecting softer momentum over that specific window.
This is a classic alignment vs divergence setup: the blended model leans bullish, but the underlying confluence remains neutral because bears still occupy meaningful slots (Bear 5 vs Bull 10 with Neutral 3). In practice, this tends to reward patience around the binary levels (17.8167 / 14.0900): if price confirms with level acceptance, the blended score has room to “pull” the neutral confluence higher; if acceptance fails, the neutral reading can act as an early warning that the bullish blend was conditional rather than durable.
Signal table (Bull/Bear/Neutral)
| Indicator | Value | Signal |
|---|---|---|
| MACD Hist | 0.05655 | Bullish |
| Stoch %K | 89.15 | Bearish |
| TS Mom(20) | -0.48 | Bearish |
| TS Accel | 0.64 | Bullish |
| RSI(14) | 65.78 | Bullish |
| ROC(20) | -2.885 | Bearish |
| ADOSC | 82.18 | Bullish |
| ChaikinOsc | 5.827e+05 | Bullish |
| OBV slope(10) | 2.493e+06 | Bullish |
| PVT slope(10) | 3.163e+04 | Bullish |
| AD Line slope(10) | 2.125e+06 | Bullish |
| Will A/D slope(10) | 1.575 | Bullish |
| BB Width | 0.1069 | Neutral |
| Chaikin Vol | 5.079 | Bearish |
| HHIGH(20) | 16.78 | Neutral |
| LLOW(20) | 15.01 | Neutral |
| MedPx vs Support | 1.93 | Bullish |
| Vol ROC(20) | -61.89 | Bearish |
Interpretation: Indicator-level signals form the base confluence, which is then adjusted using a separate AI-driven technical ranking model. The final technical score summarizes this combined view.
6) News sentiment + extractive gist
Sentiment score (avg): 0.132 | Positive: 44% | Neutral: 56% | Negative: 0%
KGNAI AI News Sentiment Score (normalized -1 to +1): 1.00 (as of 2026-05-26) | Label: Bullish | Overall news score: 0.97
Positive Developments
Recent coverage across major financial outlets indicates that the prevailing tone around LendingClub has been broadly constructive, reflected in the 0% negative share and a bullish normalized sentiment reading of 1.00. The positive tilt appears tied to positioning narratives and strategic direction: commentary has highlighted favorable analyst-style framing and discussion of corporate positioning initiatives. Even where the articles are comparative or thematic, the net effect has been to keep LC within a “risk-on participation” bucket, consistent with the sentiment split (44% positive, 56% neutral). From a market-read perspective, bullish sentiment can act as a tailwind when technical levels are being tested—particularly if price action approaches the 17.8167 resistance zone—because it can improve the odds of follow-through if incremental buyers are present. The key analytical point is not that sentiment guarantees direction, but that the current bias is supportive rather than inhibitory.
Neutral / Mixed Developments
The bulk of items are categorized as neutral (56%), suggesting that much of the recent flow is informational or macro-linked rather than company-specific. Aggregated reporting has also connected LC’s tape to broader market drivers such as moves in yields and shifts in overall risk appetite. That matters because it implies a portion of LC’s short-term price behavior may be externally driven, which can dilute the informational value of single-day moves relative to the multi-horizon rank weakness (e.g., #1882 daily and #2012 monthly). In this context, neutral coverage often coincides with range-bound trading where technical thresholds—support 14.0900 and resistance 17.8167—do more explanatory work than narrative headlines. The sentiment average of 0.132 is consistent with a mild positive lean rather than a strongly one-sided discourse.
Negative / Risk Signals
Despite a reported 0% negative share in the sentiment split, risk signals still exist in the form of potential narrative-driven volatility and interpretation risk around strategic changes. Some coverage frames repositioning initiatives as a business-model pivot, which can introduce uncertainty around execution and market perception even when the immediate tone is not explicitly negative. Additionally, macro-linked “risk-on” explanations can reverse quickly; if external conditions shift, the same factor sensitivity that helped the stock participate can pressure it. From a technical-risk standpoint, this matters because LC’s cross-sectional ranks remain bearish across most horizons (including #1732 yearly), so sentiment support may not be sufficient if price fails to sustain above trend markers or if it approaches and rejects 17.8167. The cleanest risk marker remains price-based: a close below 14.0900 would align narrative uncertainty with structural deterioration risk.
- Whether sentiment remains supportive if price tests 17.8167, or whether flow turns more macro-sensitive.
- Any change in the sentiment mix (currently 44%/56%/0%) that coincides with volatility expansion from 0.1069 bandwidth.
- Price behavior around 14.0900 as an invalidation line if risk appetite deteriorates.
Sources referenced: Reuters, Bloomberg, Yahoo Finance, MarketWatch, Investing.com
7) Sources
Source links were provided in the base draft; per publication formatting, the news section above summarizes the aggregated coverage without reproducing headline lists or URLs.
Snapshot: AI Rank (Short–Mid–Long): Bearish (Bearish–Bearish–Bearish) · Technical Confluence: Neutral · Key Levels: Support ~14.09 | Resistance ~17.82 · News Sentiment: Neutral
You may also like: How KGNAI AI ranks instruments across global markets
Disclaimer: KGNAI provides AI-generated analytics and educational market commentary only. This is not financial advice. Markets involve risk. Always do your own research.