
CRM (Salesforce.com Inc) Technical & Rank Report — 20-Feb-2026 | Neutral near-term, bullish longer-horizon backdrop
Salesforce.com Inc (CRM) presents a split profile across horizons as of 20-Feb-2026: KGNAI ranks are Neutral on the Daily (#818), Weekly (#1111), and Monthly (#1150) windows, while the longer horizon remains Bullish with a 3-Month rank of #146, 6-Month rank of #19, and Yearly rank of #77 (out of a 2072-instrument universe). Technically, the setup is best described as neutral-to-fragile in the near term, with the trend read showing Close vs MA50 = Bearish and MA50 vs MA200 = Bearish. Momentum signals are mixed: RSI(14) at 39.12 is bearish, while MACD histogram at 1.2020 offers a constructive counter-signal. Volatility is moderate with Bollinger Bandwidth at 0.1626. Key decision levels are clearly defined at Support ~ 183.3413 and Resistance ~ 267.4675. News sentiment is supportive (avg 0.236, positive 67%), adding a favorable backdrop—but price must still confirm.
- Rank stance: Short Neutral (Daily #818) | Mid Neutral (Weekly #1111 / Monthly #1150) | Long Bullish (6-Month #19, Yearly #77)
- Technical confluence: Neutral (18-signal score -0.167; blended overall -0.264)
- Key levels: Support 183.3413 | Resistance 267.4675
- News sentiment bias: Bullish (avg 0.236; 67% positive; KGNAI news score 1.00)
- Confirmation / invalidation: A break above 267.4675 with volume supports continuation; a close below 183.3413 elevates deterioration risk.
What KGNAI Measures
KGNAI ranks instruments relative to large universes, emphasizing positioning and consistency across multiple statistical tests rather than single-indicator certainty. The goal is to identify signal alignment that has exhibited repeatable behavior across many instruments and time windows. Outputs are probabilistic and may diverge from headline narratives when confirmation is limited.
How to Read This Report
- Ranks are comparative (vs 2072 instruments), not absolute measures of “good” or “bad.”
- Confluence reflects agreement across 18 signals plus a separate AI technical rank model.
- Support/Resistance levels are decision zones where behavior often changes.
- Sentiment provides context and bias; price/volume still determines confirmation.
1) KGNAI AI Analysis
Region: USA
Total universe size: 2072 ranked instruments
- Daily rank: #818 out of 2072 — Neutral
- Weekly rank: #1111 out of 2072 — Neutral
- Monthly rank: #1150 out of 2072 — Neutral
- 3-Monthly rank: #146 out of 2072 — Bullish
- 6-Monthly rank: #19 out of 2072 — Bullish
- Yearly rank: #77 out of 2072 — Bullish
CRM’s rank term-structure shows near-term neutrality alongside a distinctly stronger longer-horizon profile. The Daily rank at #818 sits around the middle of the universe, while Weekly #1111 and Monthly #1150 drift into the lower half—consistent with a market that is not currently rewarding the tape. In contrast, the 3-Month rank of #146 places CRM in the upper decile, and the 6-Month rank of #19 signals elite long-horizon relative positioning. The Yearly rank at #77 further supports that CRM has, over broader windows, exhibited more favorable “behavioral probabilities” than most instruments in the 2072-name set.
This cross-horizon split typically aligns with a regime where longer-term sponsorship remains intact, but shorter-horizon conditions (trend, momentum, or positioning) have weakened enough to cap immediate follow-through. KGNAI’s stated term view is therefore coherent: Short-term Neutral, Mid-term Neutral, Long-term Bullish. For portfolio construction, that profile often implies CRM is more sensitive to confirmation signals (breakouts, trend re-alignment, volume validation) than to narrative alone, because the short and mid windows are not yet participating in the longer-term strength.
KGNAI ranks each instrument across large universes using multiple proprietary AI tests and statistical models (millions of data points). Lower ranks generally indicate stronger probability of favorable performance behavior, while higher ranks indicate weaker probability and more bearish positioning.
2) Price & trend overview
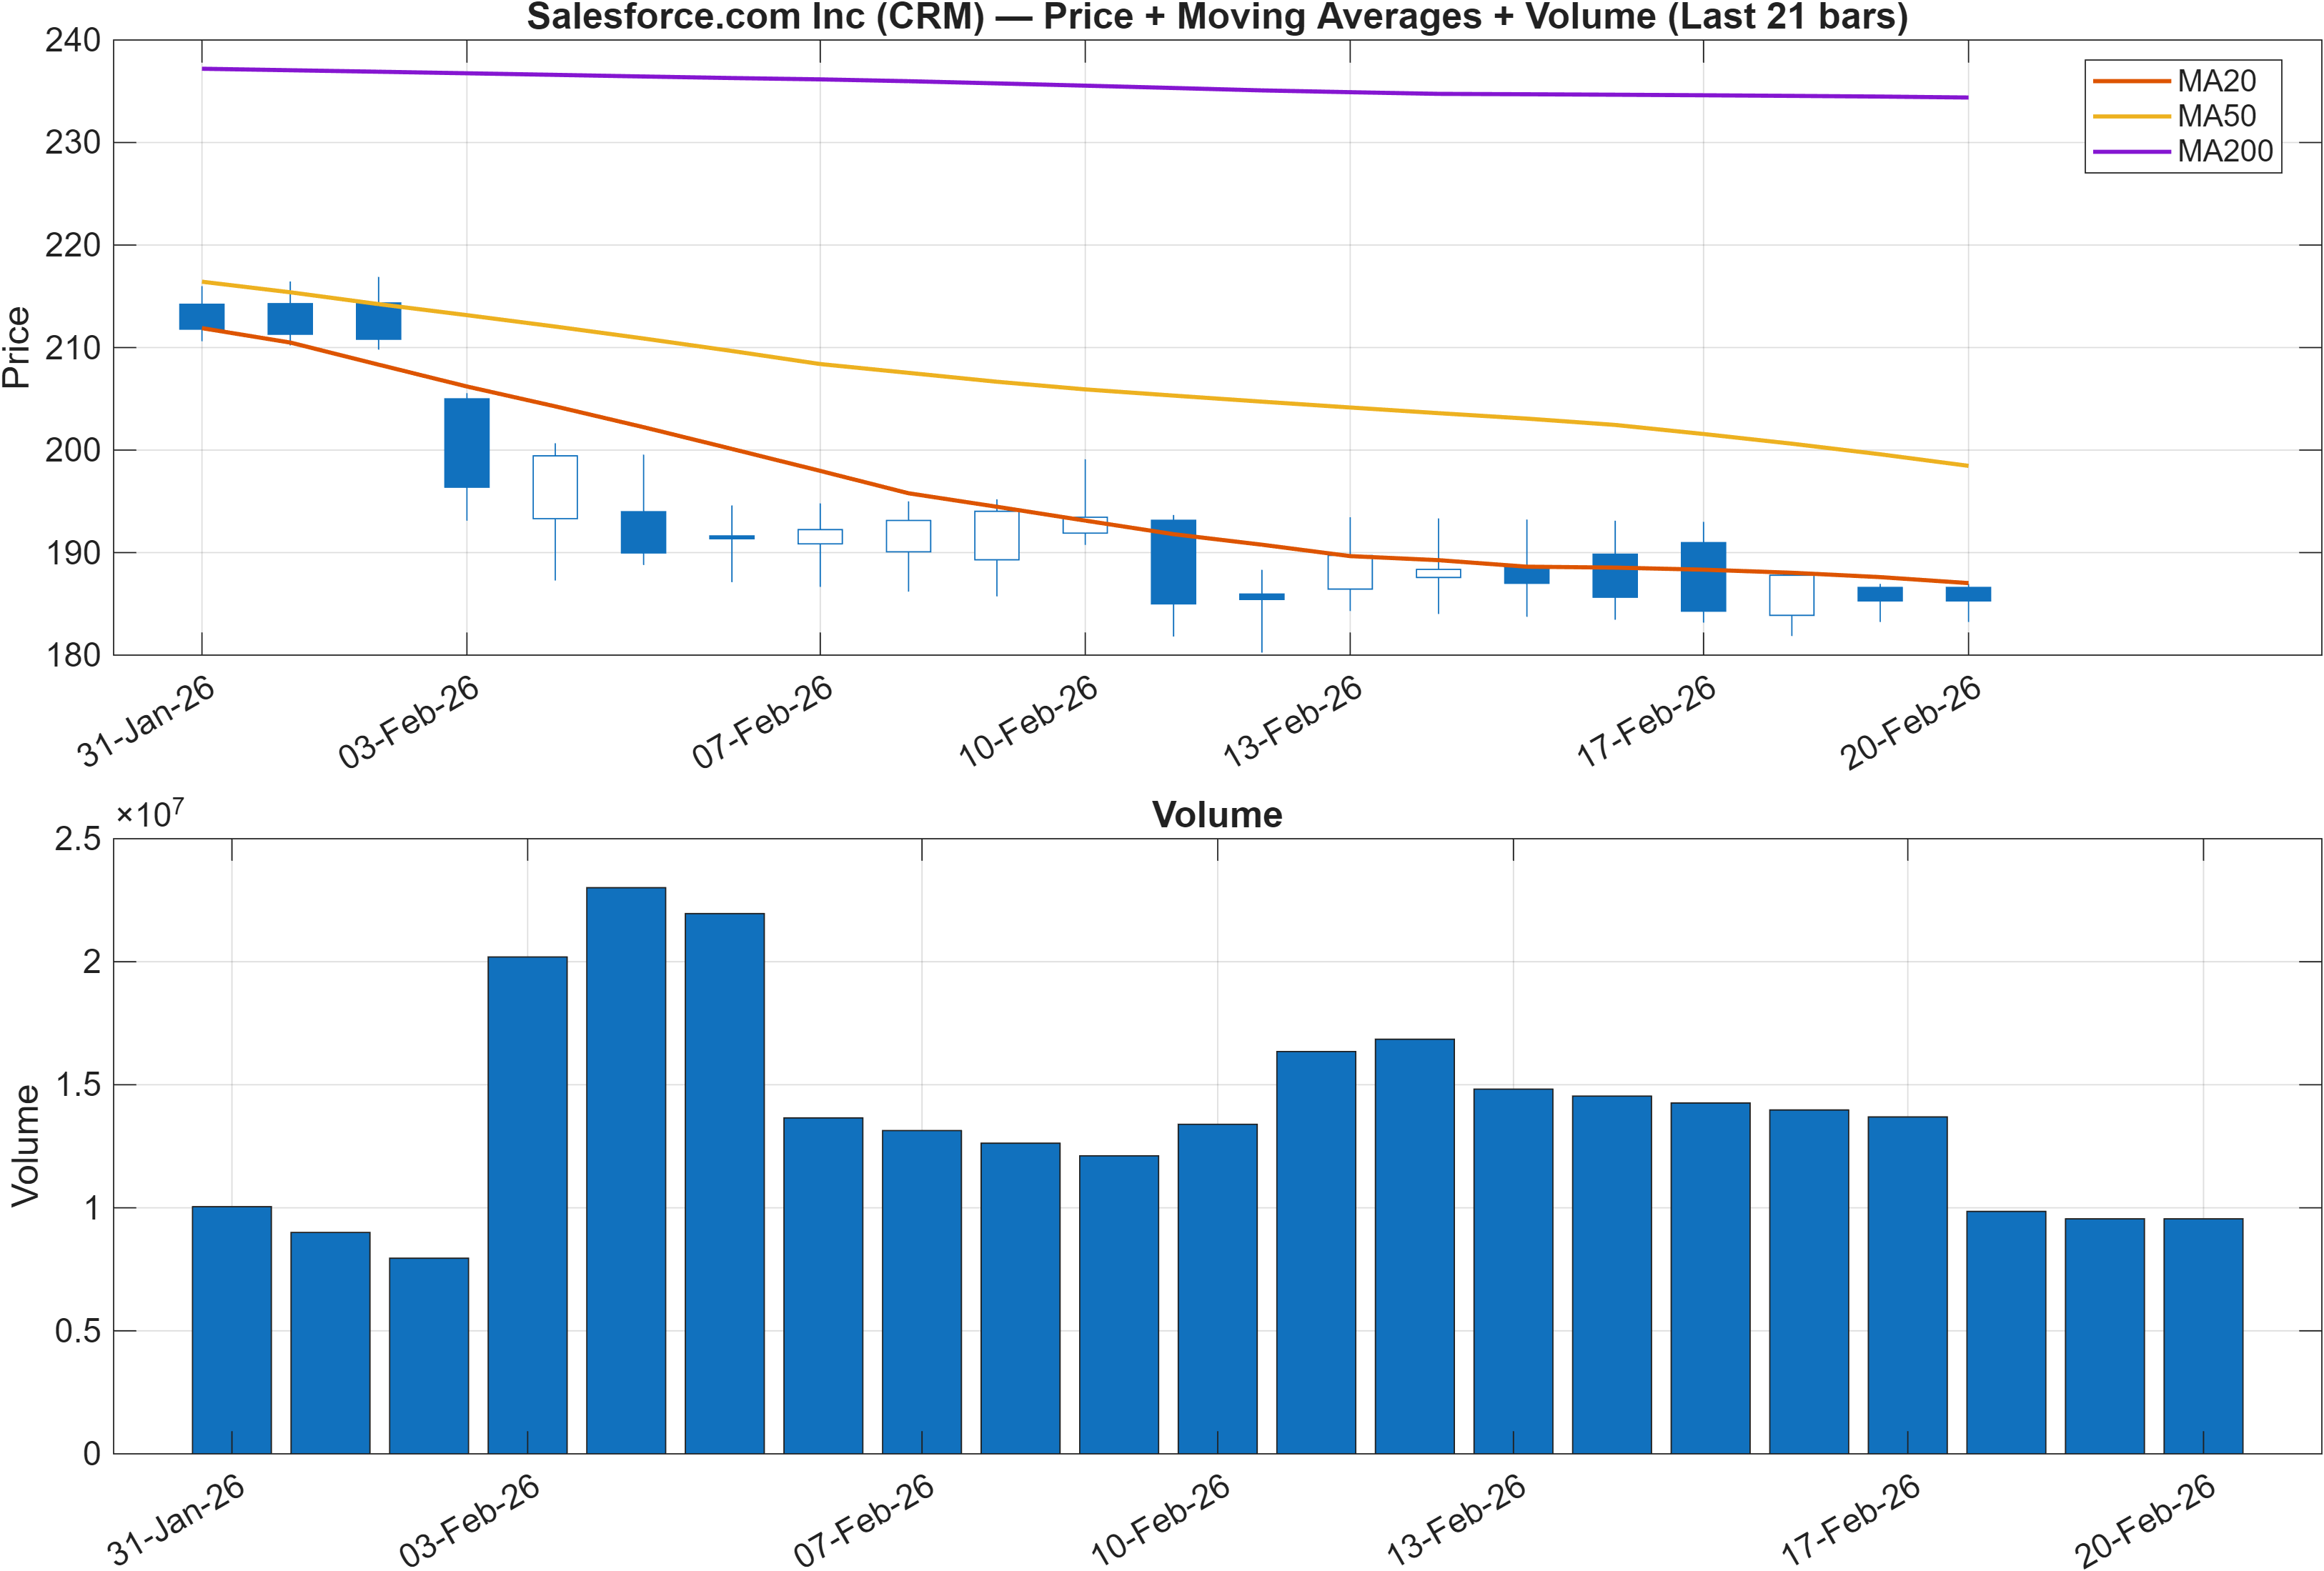
The trend read is currently defensive: Close vs MA50 = Bearish and MA50 vs MA200 = Bearish. When both conditions hold simultaneously, the market is typically signaling that the intermediate trend is below its reference mean and that the longer moving-average structure remains tilted lower. That helps explain why the KGNAI short- and mid-term ranks remain Neutral (Daily #818; Weekly #1111; Monthly #1150), even though longer windows are materially stronger (6-Month #19; Yearly #77).
From a market-structure perspective, this setup often leads to two-speed behavior: longer-horizon participants may defend the broader thesis, while shorter-horizon flows can continue to fade rallies until price proves it can reclaim key trend references. That is where the explicitly stated level framework becomes essential. With Support ~ 183.3413 and Resistance ~ 267.4675, CRM’s trading decisions compress into a clear range of “acceptance vs rejection” that can be validated by participation metrics (also reflected later in volume-flow indicators).
The trend signal does not, by itself, negate the longer-horizon bullish ranks; it indicates that the market is still requiring re-alignment before treating the longer-term strength as actionable in the near term. A sustained improvement in breadth/participation indicators alongside price reclaiming trend references would be more consistent with the upper-decile 3–12 month ranks.
3) Momentum & volatility dashboard
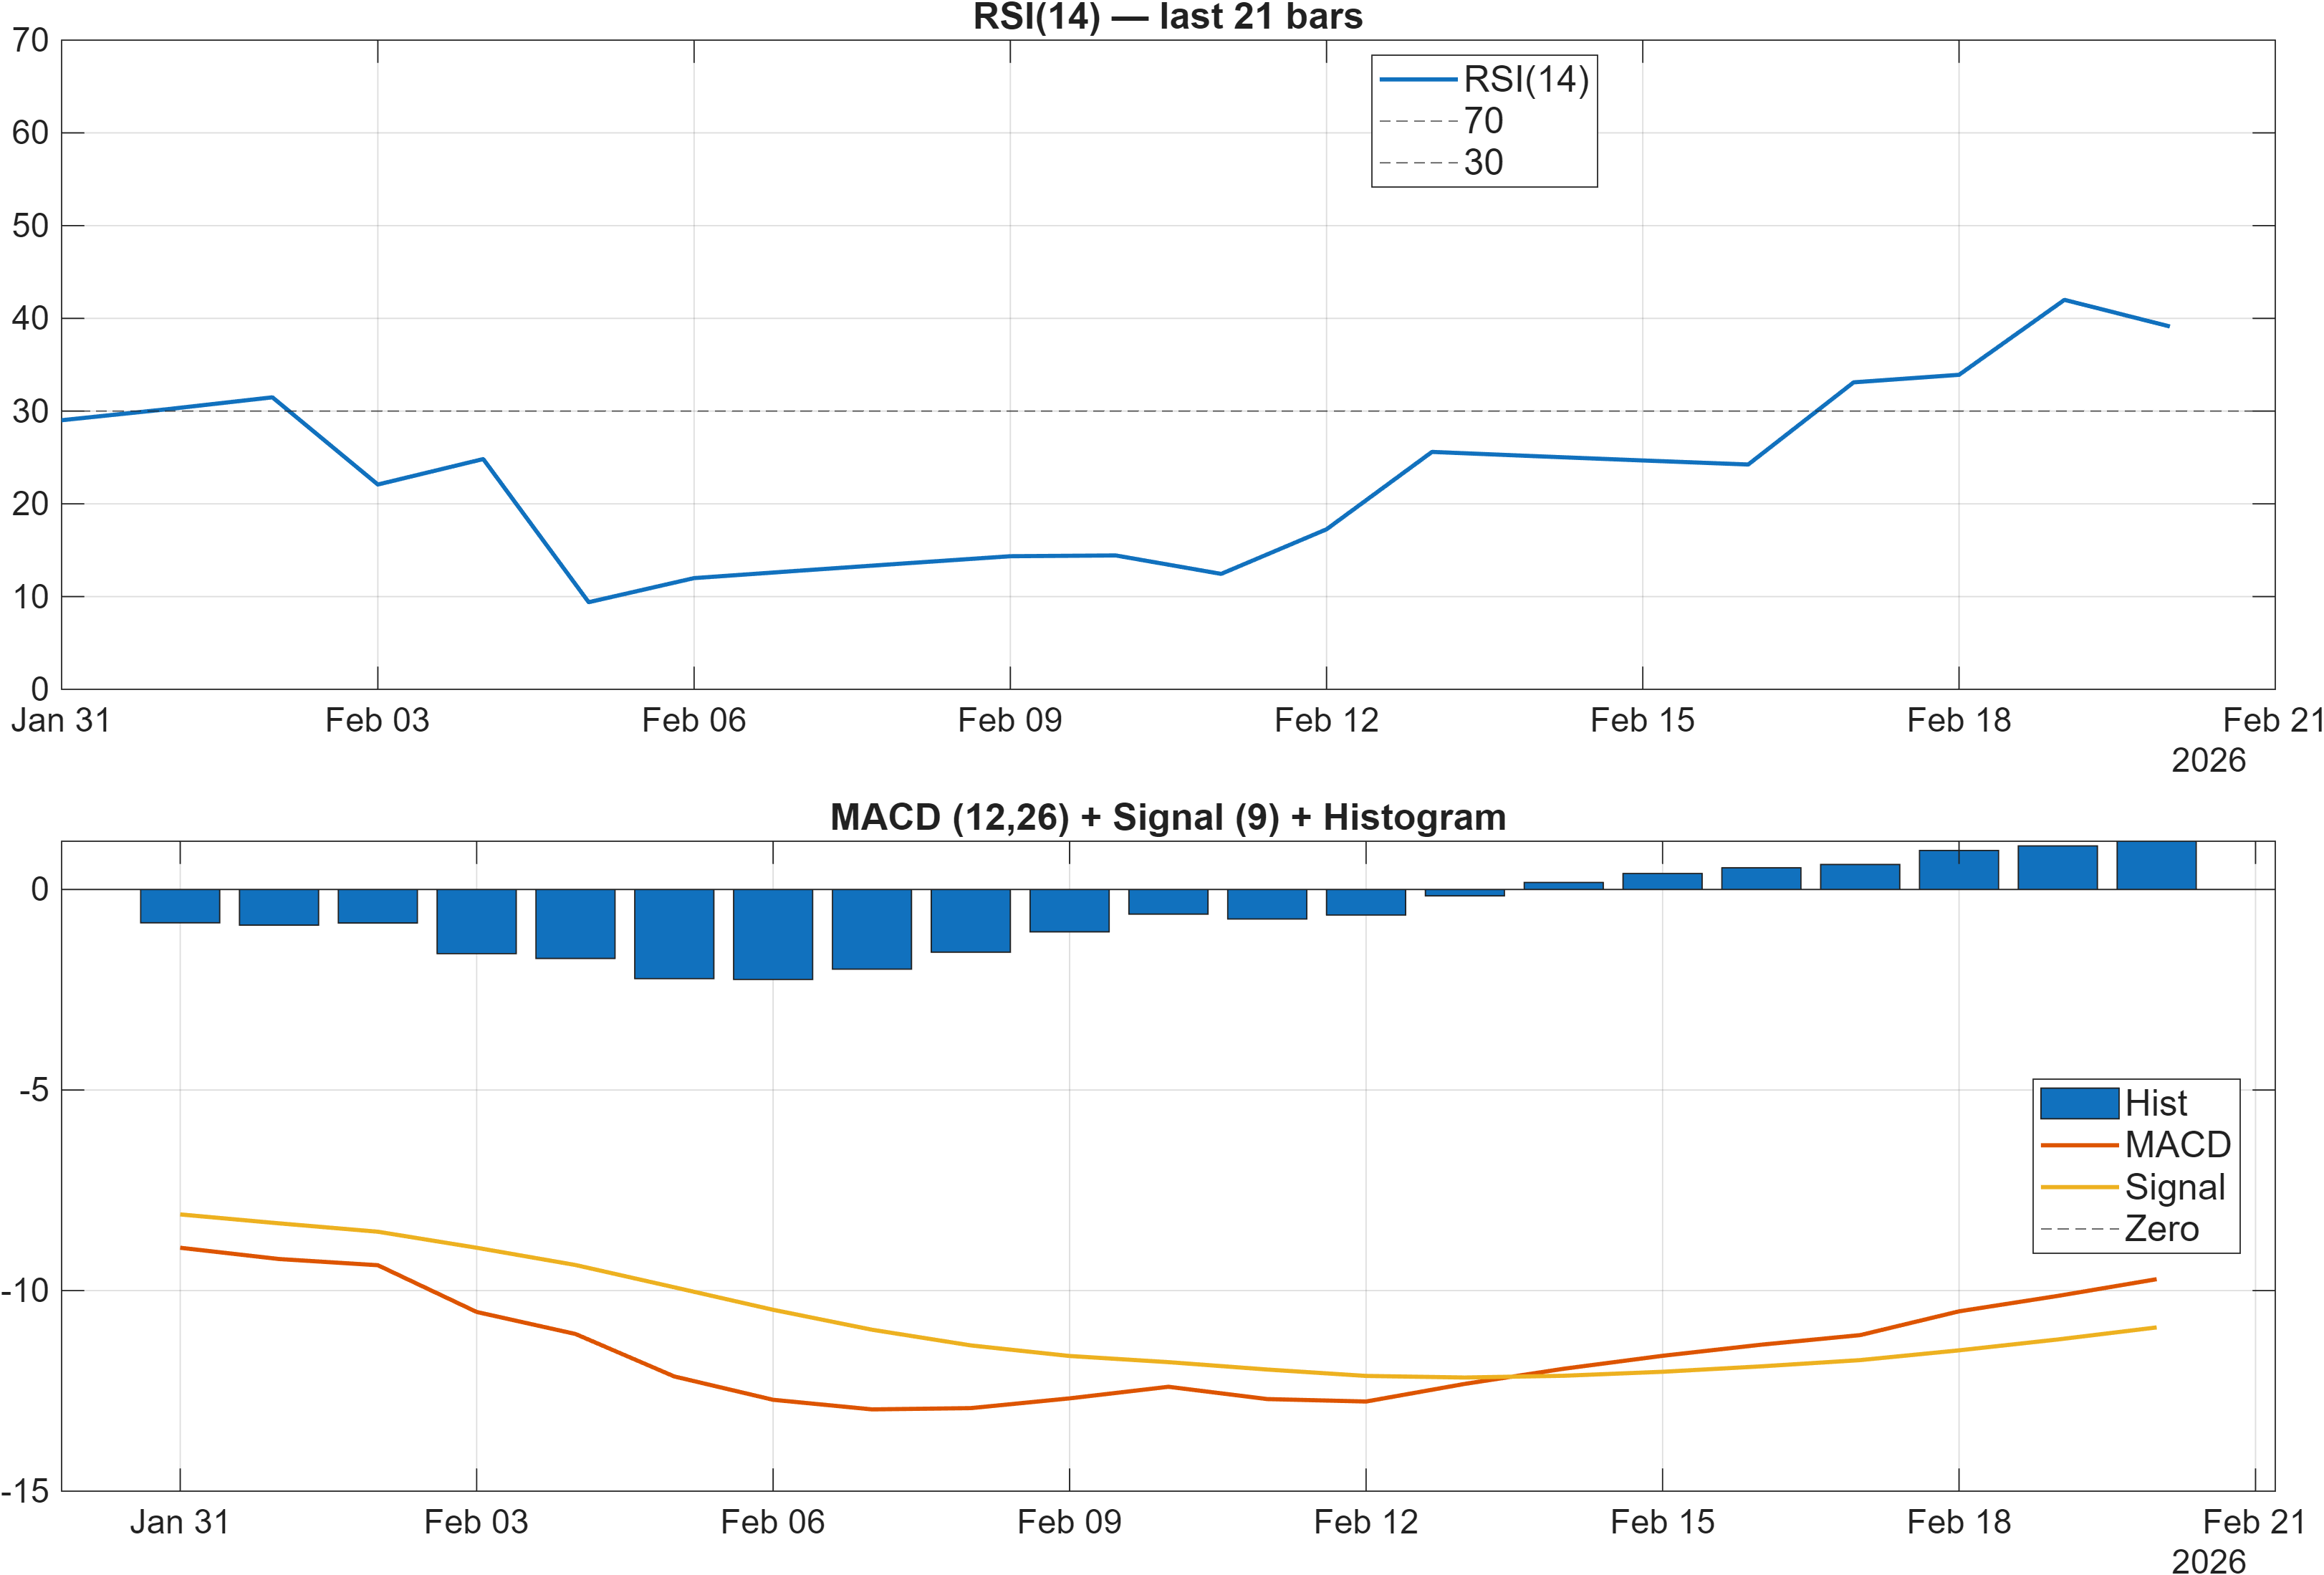
Momentum reads as mixed with a bearish tilt. The RSI bias is explicitly Bearish, and RSI(14) is 39.12, which generally aligns with weaker upside impulse and a market that has struggled to sustain rebounds. At the same time, the MACD histogram is 1.2020 (also listed as 1.202 in the signal table) and is marked Bullish. That divergence—weak RSI but constructive MACD histogram—often appears when downside momentum is cooling but the market has not yet rebuilt broad trend strength.
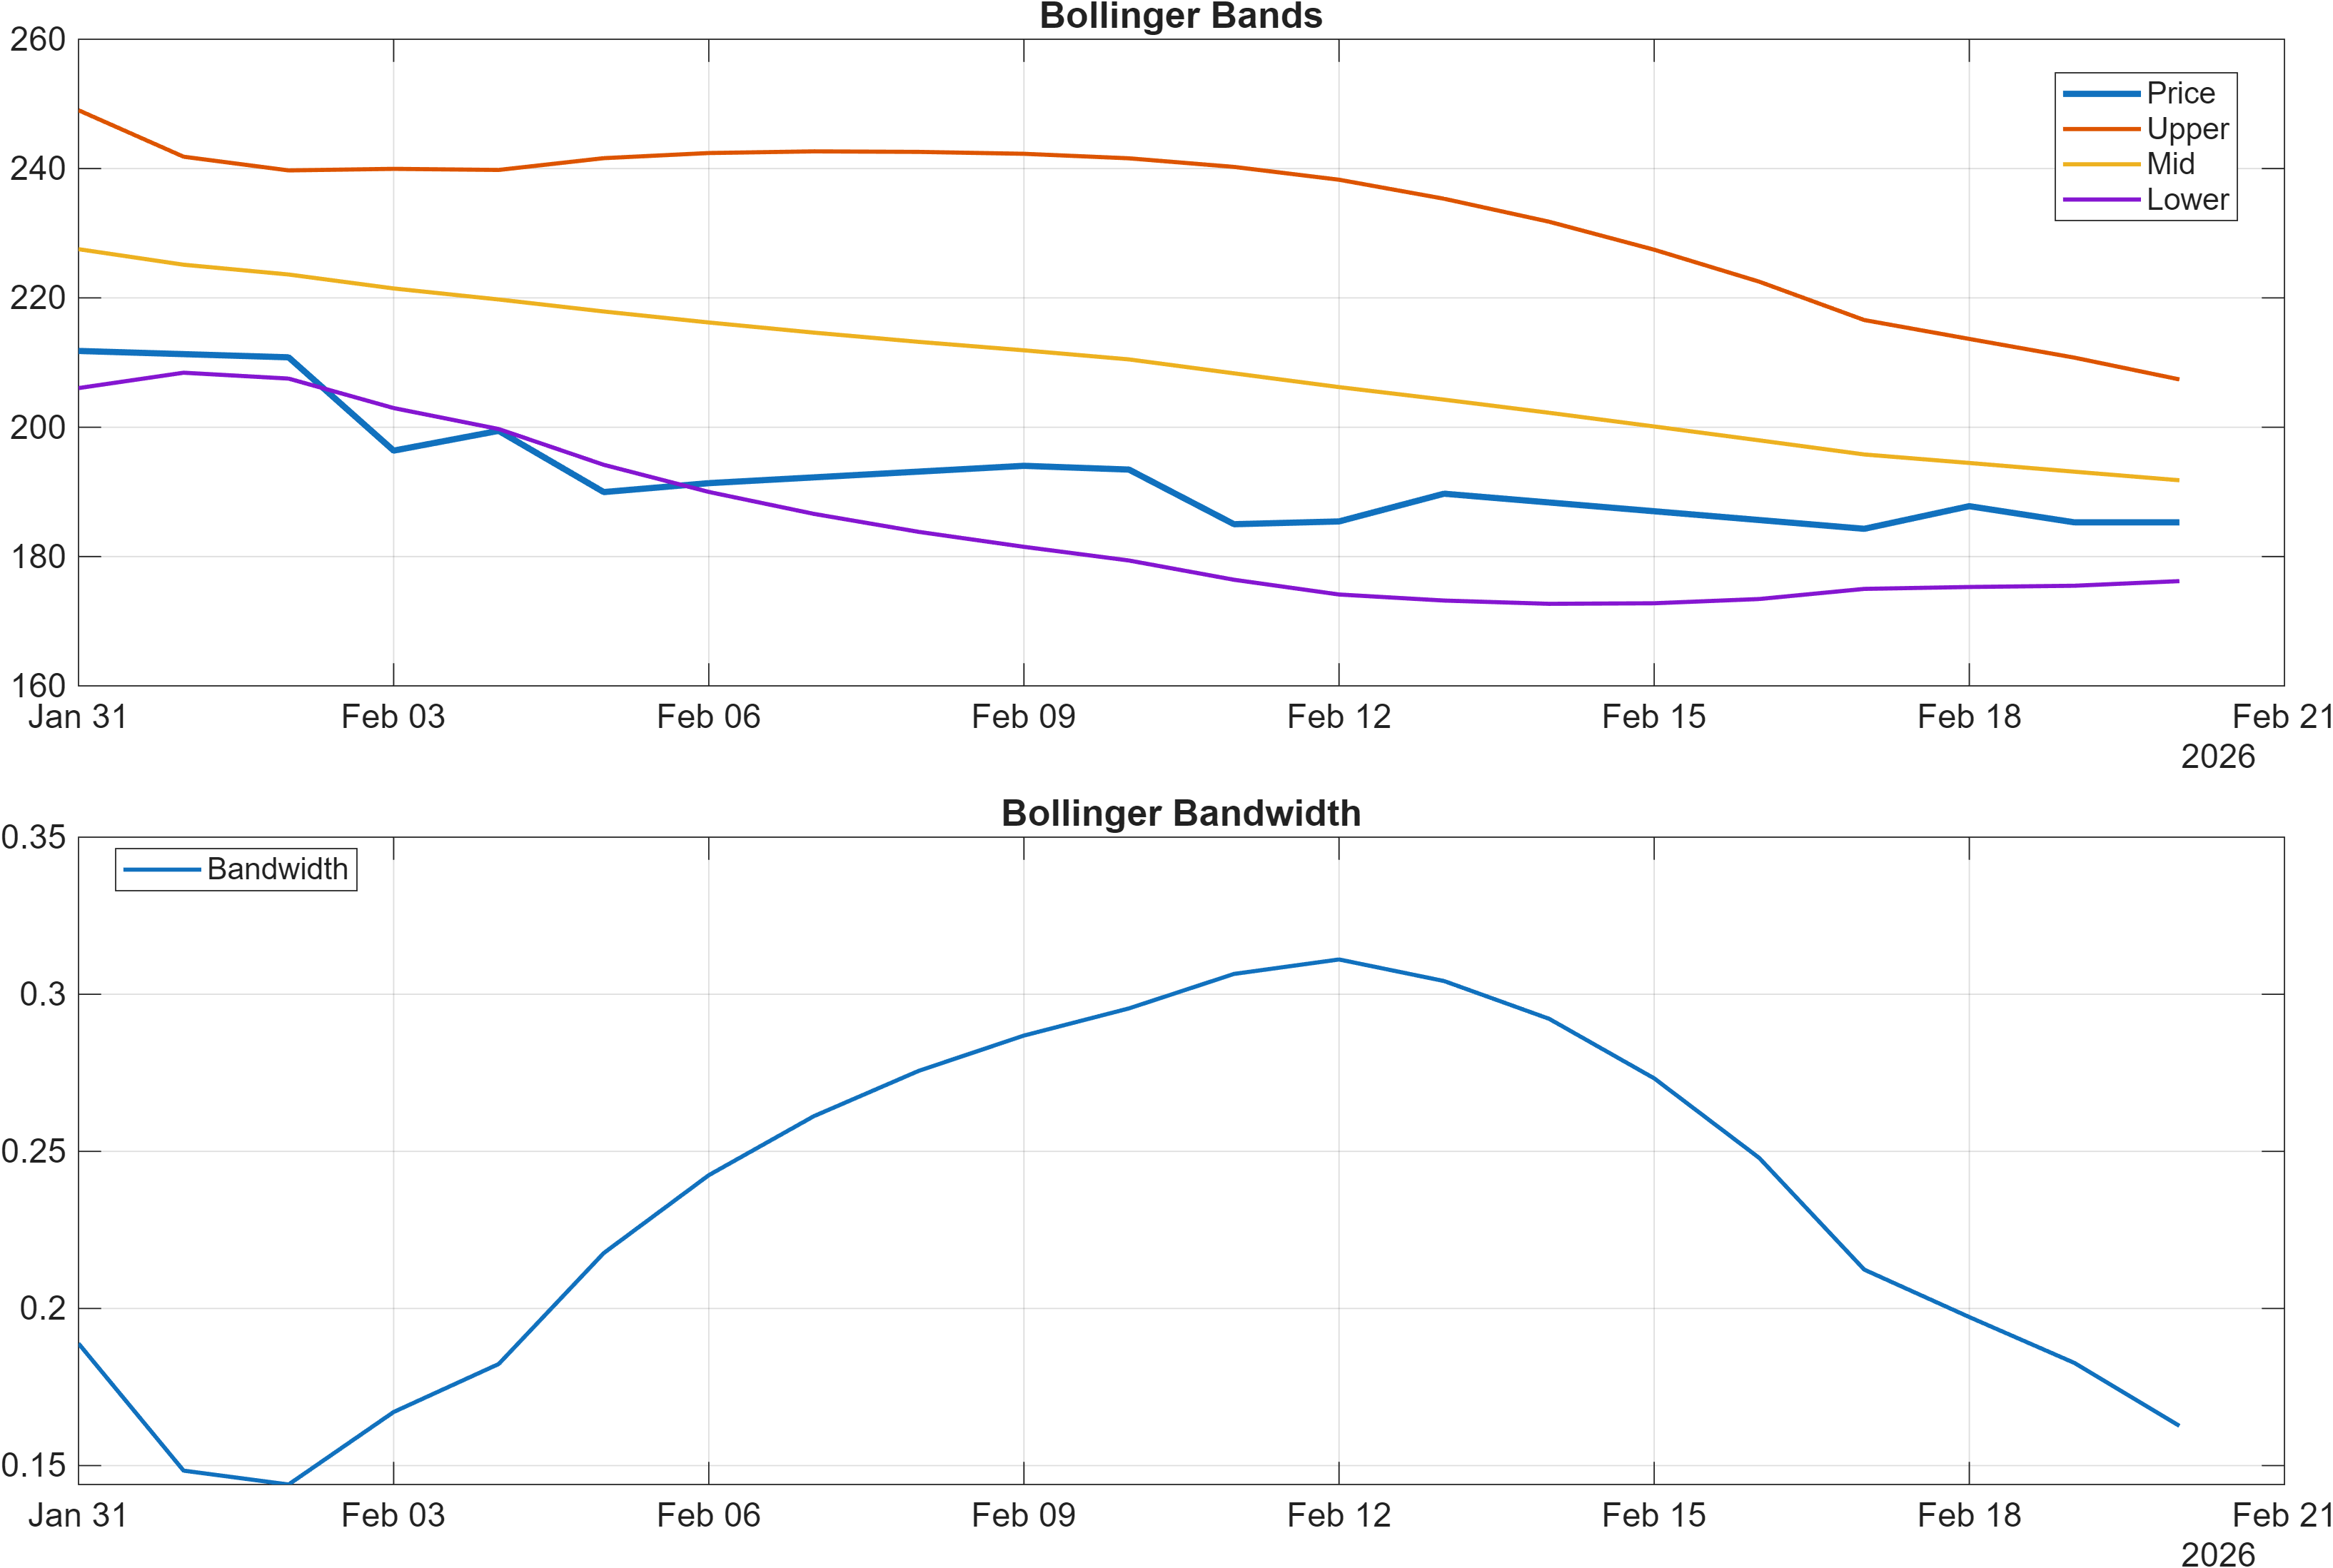
Volatility conditions are not extreme. Bollinger Bandwidth is 0.1626, which supports the view that price is trading in a relatively contained regime rather than a full volatility expansion. In practice, when bandwidth is moderate while trend signals are bearish (Close vs MA50 and MA50 vs MA200 both bearish), markets can become range-bound and sensitive to well-defined levels, particularly support at 183.3413 and resistance at 267.4675.
Momentum and volatility together imply that CRM is in a state where confirmation matters more than anticipation: a bullish MACD histogram alone is not sufficient to offset RSI weakness unless price begins to reclaim trend structure and participation metrics stabilize.
4) Support / Resistance zones
Support ~ 183.3413 | Resistance ~ 267.4675
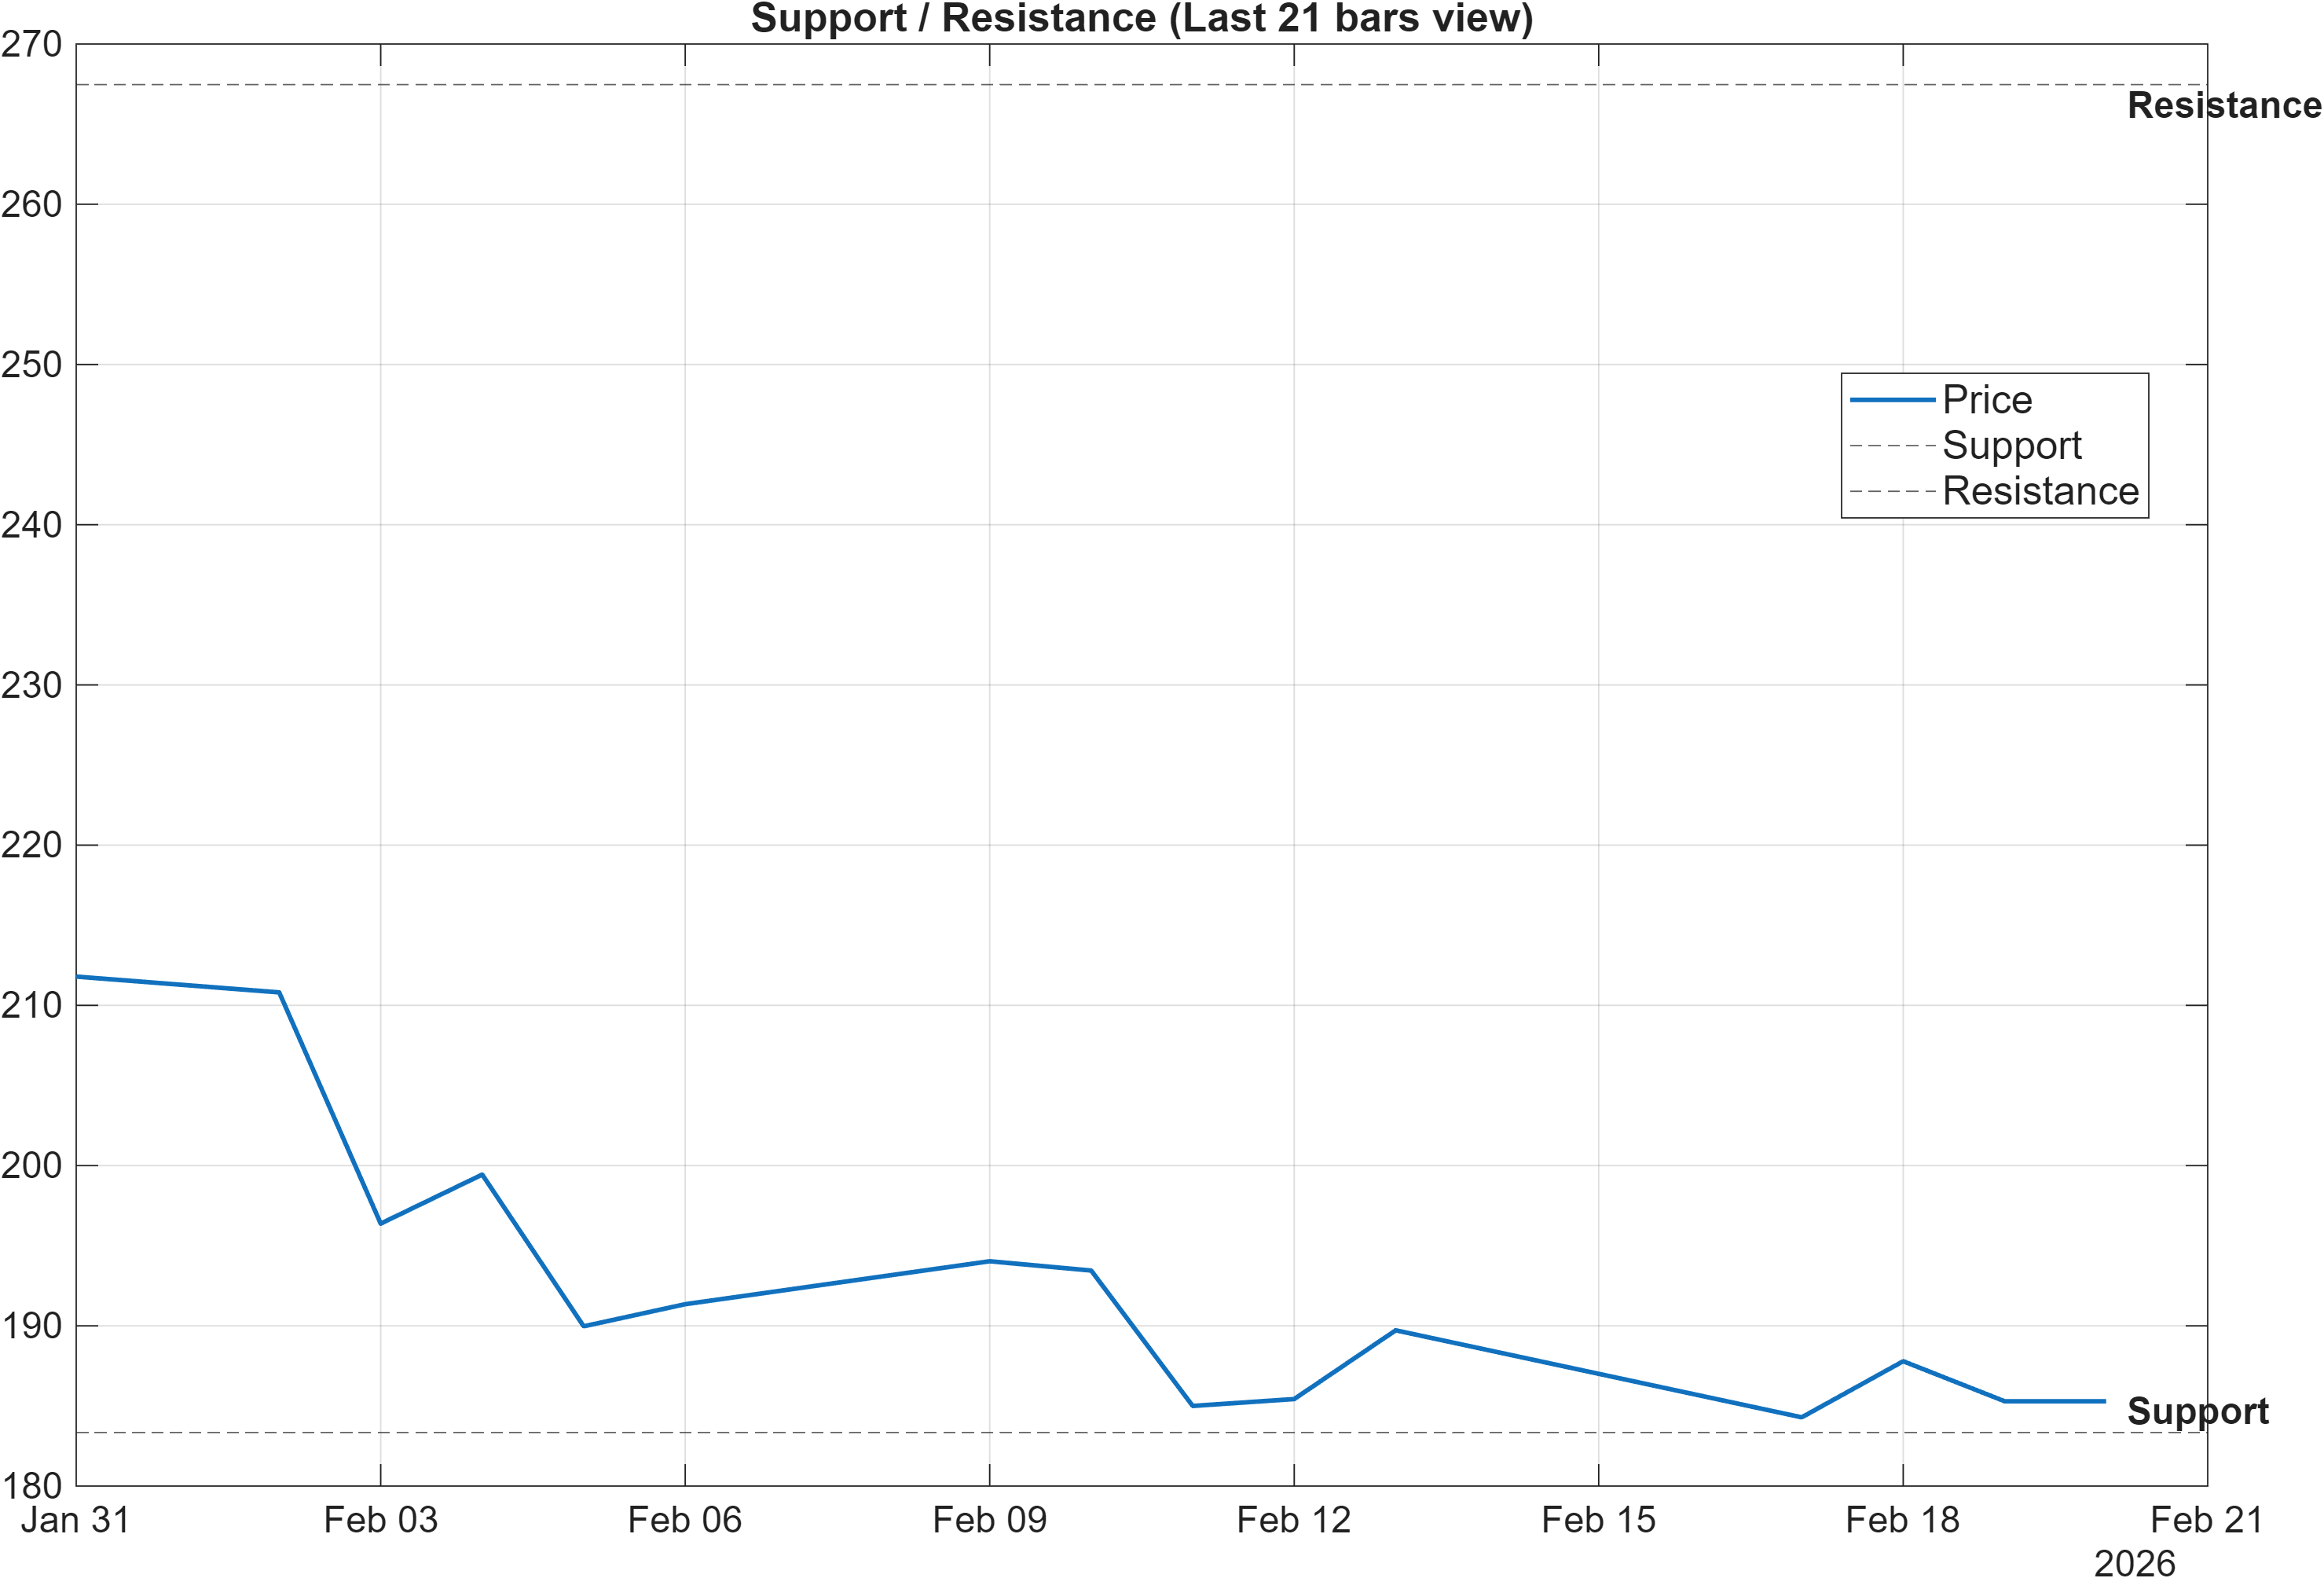
CRM’s structure is anchored by a wide but decisive bracket: 183.3413 as support and 267.4675 as resistance. With trend indicators currently bearish, these zones function less as “targets” and more as validation thresholds for whether the market is accepting higher prices or continuing to reject them.
The scenario framing is explicit: break above resistance with volume → continuation, while a close below support signals elevated deterioration risk. This matters because several indicators already suggest fragility: RSI(14) at 39.12 is bearish, and multiple volume-flow slopes later in the dashboard are also bearish (e.g., OBV slope(10) and AD Line slope(10)). In that context, a breach of 183.3413 would not be “just another dip”; it would align level behavior with the weaker participation profile.
Conversely, a successful transition above 267.4675 accompanied by stronger participation would better reconcile the long-horizon bullish ranks (3-Month #146; 6-Month #19; Yearly #77) with a market that is currently treating the intermediate trend as bearish. Until one side resolves, CRM remains best viewed as range-defined with asymmetric information concentrated around these two levels.
5) Quant Technical Dashboard (18 Signals)
KGNAI AI Technical Analysis Score (Deep Reinforcement Learning): Rank #1544 out of 2072 (Rank 1 represents the strongest technical positioning and a higher probability of favorable price behavior. As ranks increase toward the maximum, the probability of favorable outcomes weakens and bearish positioning becomes more dominant.) | Label: Neutral | Score: -0.490
18-Signal Technical Confluence Score: -0.167 (Neutral)
Overall Technical Score (18-signal confluence + DRL rank blend): -0.264 (Neutral)
Note: The blended score reflects signal strength weighted against broader AI technical ranking, which may temporarily diverge.
Blended technical score breakdown: -0.264 (Neutral | Bull 5 / Bear 8 / Neutral 5)
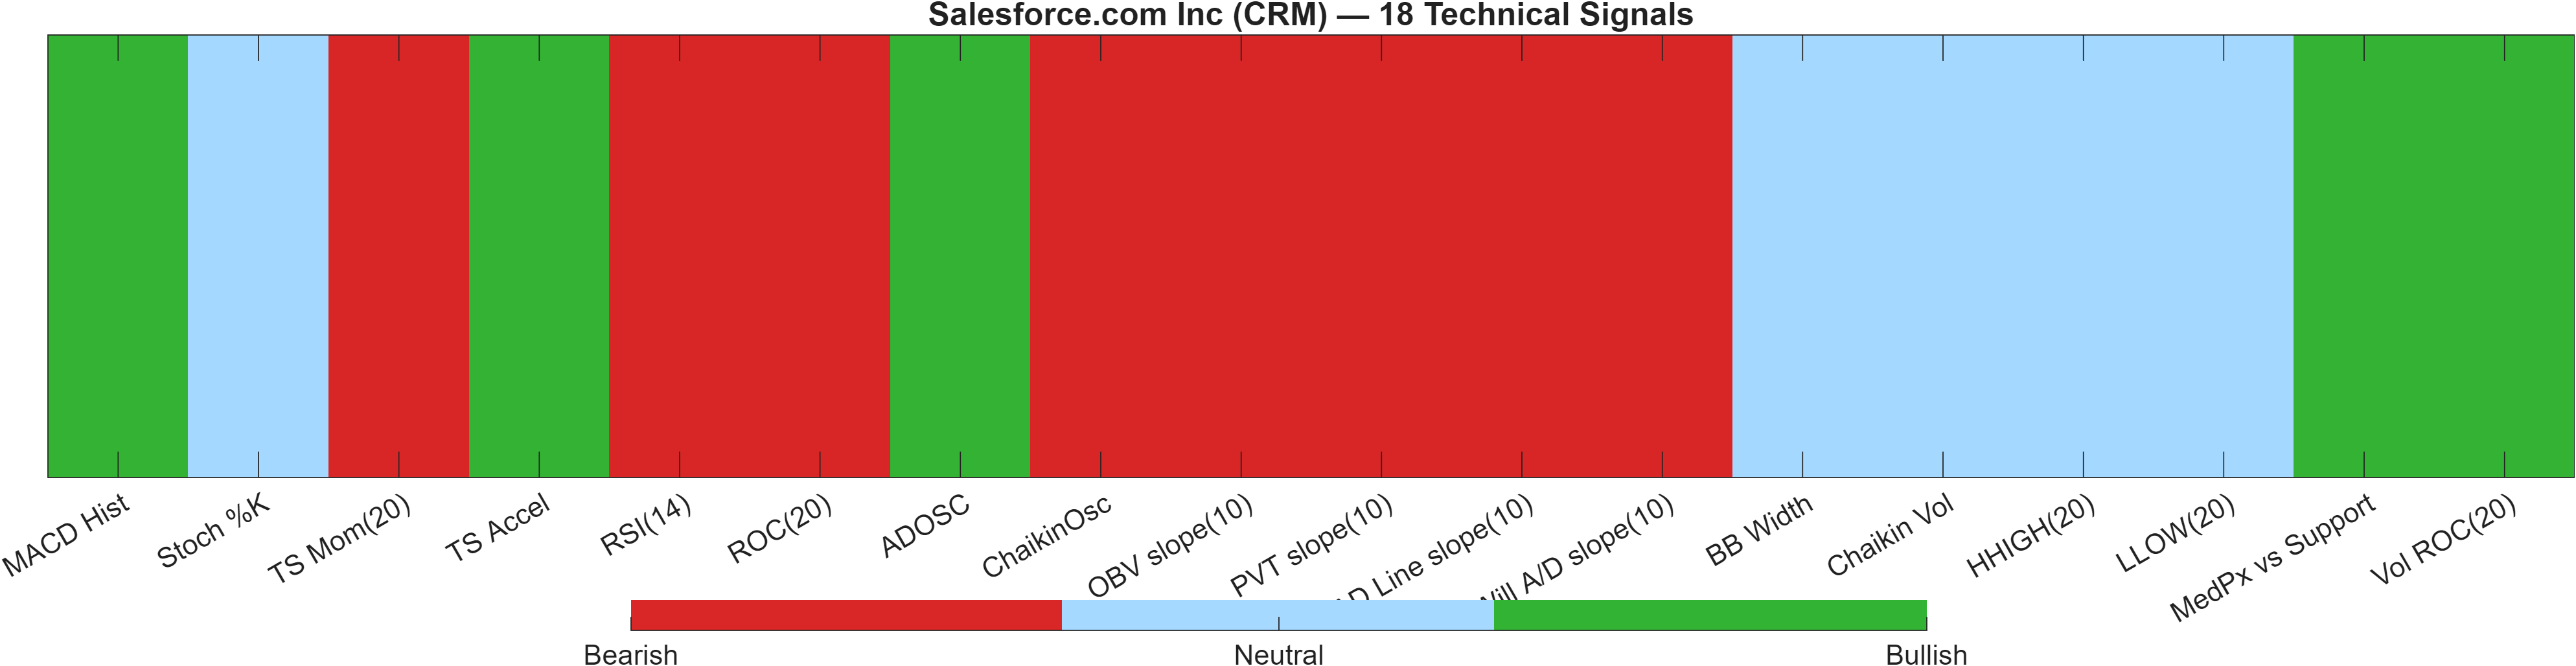
The technical stack is Neutral but with notable internal tension. The 18-signal confluence score is -0.167 and the overall blended technical score is -0.264, while the Deep Reinforcement Learning technical rank is #1544 out of 2072 with a score of -0.490. This combination suggests that, even if some classical indicators are stabilizing, the broader pattern-recognition model still reads the configuration as relatively weak versus the universe.
The breakdown (Bull 5 / Bear 8 / Neutral 5) helps explain the neutrality: bullish signals exist but are outnumbered by bearish ones. The constructive side includes MACD Hist 1.202 (bullish), ADOSC 32.39 (bullish), and Vol ROC(20) 6.154 (bullish), which can be consistent with episodic demand and improving short bursts of participation. Against that, several momentum and flow measures lean bearish—TS Mom(20) -26.01, ROC(20) -12.31, and a bearish RSI(14) 39.12—suggesting upside efforts have not been persistent.
The most actionable read is not any single indicator but whether the “bullish minority” begins to recruit neutral signals and reduce the bearish count. If participation-based measures (e.g., OBV slope(10) and AD Line slope(10)) remain negative while price is still below key trend references, the neutrality can resolve downward toward support at 183.3413. Conversely, if volume-flow turns supportive while price approaches 267.4675, the long-horizon bullish rank profile gains technical credibility.
Signal table (Bull/Bear/Neutral)
| Indicator | Value | Signal |
|---|---|---|
| MACD Hist | 1.202 | Bullish |
| Stoch %K | 37.6 | Neutral |
| TS Mom(20) | -26.01 | Bearish |
| TS Accel | 3.743 | Bullish |
| RSI(14) | 39.12 | Bearish |
| ROC(20) | -12.31 | Bearish |
| ADOSC | 32.39 | Bullish |
| ChaikinOsc | -2.956e+06 | Bearish |
| OBV slope(10) | -4.084e+07 | Bearish |
| PVT slope(10) | -6.805e+05 | Bearish |
| AD Line slope(10) | -1.282e+07 | Bearish |
| Will A/D slope(10) | -22 | Bearish |
| BB Width | 0.1626 | Neutral |
| Chaikin Vol | -22.87 | Neutral |
| HHIGH(20) | 216.9 | Neutral |
| LLOW(20) | 180.2 | Neutral |
| MedPx vs Support | 1.749 | Bullish |
| Vol ROC(20) | 6.154 | Bullish |
Interpretation: Indicator-level signals form the base confluence, which is then adjusted using a separate AI-driven technical ranking model. The final technical score summarizes this combined view.
6) News sentiment + extractive gist
Sentiment score (avg): 0.236 | Positive: 67% | Neutral: 22% | Negative: 11%
KGNAI AI News Sentiment Score (normalized -1 to +1): 1.00 (as of 2026-02-19) | Label: Bullish | Overall news score: 0.95
Positive Developments
Recent coverage across major financial outlets indicates a constructive narrative skew for Salesforce, consistent with the dashboard’s sentiment mix (avg 0.236, with 67% positive and only 11% negative). Themes center on CRM’s AI-oriented product direction and ecosystem expansion, which has helped keep longer-horizon positioning favorable (notably the 6-Month rank at #19 and Yearly rank at #77). Against a near-term technical profile that remains neutral-to-weak (overall technical score -0.264), this supportive sentiment can act as a stabilizer rather than a catalyst. In practice, positive coverage tends to matter most when it coincides with measurable improvement in participation—useful given mixed momentum signals such as a bearish RSI(14) at 39.12 alongside a bullish MACD histogram at 1.2020. The net effect is a favorable backdrop that still requires price confirmation near key levels.
Neutral / Mixed Developments
A secondary stream of commentary has been more exploratory than directional, focusing on strategic and corporate-finance framing rather than near-term price drivers. This aligns with the report’s cross-horizon split: short and mid windows remain Neutral (Daily #818; Weekly #1111; Monthly #1150), while longer horizons remain comparatively strong. In a mixed regime, narratives can coexist—optimism about longer-run positioning with caution around current tape conditions, especially given trend signals showing Close vs MA50 = Bearish and MA50 vs MA200 = Bearish. Neutral coverage tends to amplify the importance of objective decision zones, particularly 183.3413 (support) and 267.4675 (resistance), because price behavior at these levels often resolves debate faster than commentary does.
Negative / Risk Signals
Risk-oriented coverage highlights drawdown sensitivity and the possibility that the market is still digesting prior weakness, which is consistent with the technical internals showing more bearish than bullish signals (Bear 8 vs Bull 5). The bearish RSI(14) at 39.12, negative momentum readings such as ROC(20) at -12.31 and TS Mom(20) at -26.01, and multiple bearish volume-flow slopes reinforce that downside pressure has not fully cleared despite a bullish MACD histogram. From a risk-management standpoint, the most direct “line in the sand” remains the stated support at 183.3413; a close below that level would align negative narrative pressure with a deterioration signal. Conversely, the presence of a bullish normalized news score (1.00) argues against assuming risks are dominant without level-based confirmation.
- Whether price acceptance improves above 267.4675 alongside stronger participation (volume-flow confirmation).
- Whether the bearish trend structure (Close vs MA50 and MA50 vs MA200) begins to heal without breaking 183.3413.
- Whether momentum resolves its divergence (RSI(14) 39.12 vs MACD hist 1.2020) into broader signal agreement.
Sources referenced: Reuters, Bloomberg, Yahoo Finance, MarketWatch, Investing.com
7) Sources
Not available in the provided data.
Snapshot: AI Rank (Short–Mid–Long): Mixed (Neutral–Neutral–Bullish) · Technical Confluence: Neutral · Key Levels: Support ~183.34 | Resistance ~267.47 · News Sentiment: Positive
You may also like: How KGNAI AI ranks instruments across global markets
Disclaimer: KGNAI provides AI-generated analytics and educational market commentary only. This is not financial advice. Markets involve risk. Always do your own research.