
FAST (Fastenal Company) — 22-Feb-2026 Technical & Rank Review with a Constructively Bullish Stance
Fastenal Company (FAST) enters 22-Feb-2026 with a consistently bullish KGNAI ranking profile across multiple horizons, while the technical confluence remains neutral—a configuration that often appears when trend structure is intact but shorter-term momentum is still rebuilding. The rank distribution features a notably strong long-horizon signal (including a 6-Monthly rank of #27 out of 2069), while near-term ranks remain in the bullish range (e.g., Daily #182 and Weekly #357). On the indicator side, mixed momentum readings—such as MACD histogram at -0.1607 and RSI(14) at 42.19—sit alongside supportive volume/accumulation inputs that keep the dashboard balanced. Key decision zones are clearly defined at support ~40.2550 and resistance ~47.7750, with news tone mildly positive on aggregate (sentiment avg 0.085; normalized 0.94 as of 2026-02-20).
- Rank stance (Short/Mid/Long): Bullish / Bullish / Bullish (notably strong at 6-Monthly #27).
- Technical confluence: Neutral (18-signal score 0.000; overall technical score -0.060).
- Key levels: Support 40.2550 | Resistance 47.7750.
- News sentiment bias: Mildly constructive (avg 0.085; Positive 39%, Negative 7%; normalized score 0.94 labeled Bullish).
- Confirmation / invalidation: Continuation is better supported on a break above 47.7750 with volume; risk rises on a close below 40.2550.
KGNAI evaluates assets using large cross-sectional datasets built from millions of structured data points. Inputs incorporate fundamental metrics, technical structures, and systematically processed news sentiment. Statistical models, machine learning, and AI frameworks are used to assess relative positioning, signal alignment, and probabilistic behavior across broad universes.
- Ranks are comparative across the tracked universe, not absolute price targets.
- Confluence reflects alignment among independent signal groups.
- Support/resistance levels are probabilistic decision zones, not guarantees.
- Sentiment provides contextual bias within the broader analytical framework.
KGNAI Signal + Technical Snapshot + News Sentiment Digest
As of: 22-Feb-2026
Ticker: FAST
1) KGNAI AI Analysis
Region: USA
Total universe size: 2069 ranked instruments
- Daily rank: #182 out of 2069 — Bullish
- Weekly rank: #357 out of 2069 — Bullish
- Monthly rank: #286 out of 2069 — Bullish
- 3-Monthly rank: #107 out of 2069 — Bullish
- 6-Monthly rank: #27 out of 2069 — Bullish
- Yearly rank: #95 out of 2069 — Bullish
FAST’s cross-horizon ranks concentrate in the upper decile to upper quartile of the 2069-instrument universe, with the most notable strength appearing in the medium-to-long window. The 6-Monthly rank at #27 stands out as a high-conviction relative positioning signal, while the Yearly rank at #95 supports the idea that the broader regime is still constructive. At the same time, the shorter horizons are positive but not extreme—Daily #182 and Weekly #357—which can be consistent with a market that is supported structurally yet still working through localized consolidation or mean-reversion dynamics.
The internal coherence across horizons matters here: the 3-Monthly rank of #107 bridges the short-term and the longer-term strength, reducing the probability that the 6-month signal is purely a lagging artifact. In practical portfolio terms (without implying a forecast), this profile tends to be associated with a favorable backdrop for continuation setups provided that price-based confirmation is not contradicted by key levels or by a material deterioration in momentum.
The key analytical tension for FAST is therefore less about “direction” in the ranks (all bullish) and more about timing and validation: with technical confluence later in the report reading neutral (overall technical score -0.060), the rank tailwind may require cleaner price/volume confirmation before it expresses as a higher-confidence technical trend state.
KGNAI ranks each instrument across large universes using multiple proprietary AI tests and statistical models (millions of data points). Lower ranks generally indicate stronger probability of favorable performance behavior, while higher ranks indicate weaker probability and more bearish positioning.
Term view: Short-term: Bullish. Mid-term: Bullish. Long-term: Bullish.
Want the full universe and complete rank tables? Unlock full access on KGNAI: https://www.kgnai.com/pricing
2) Price & trend overview
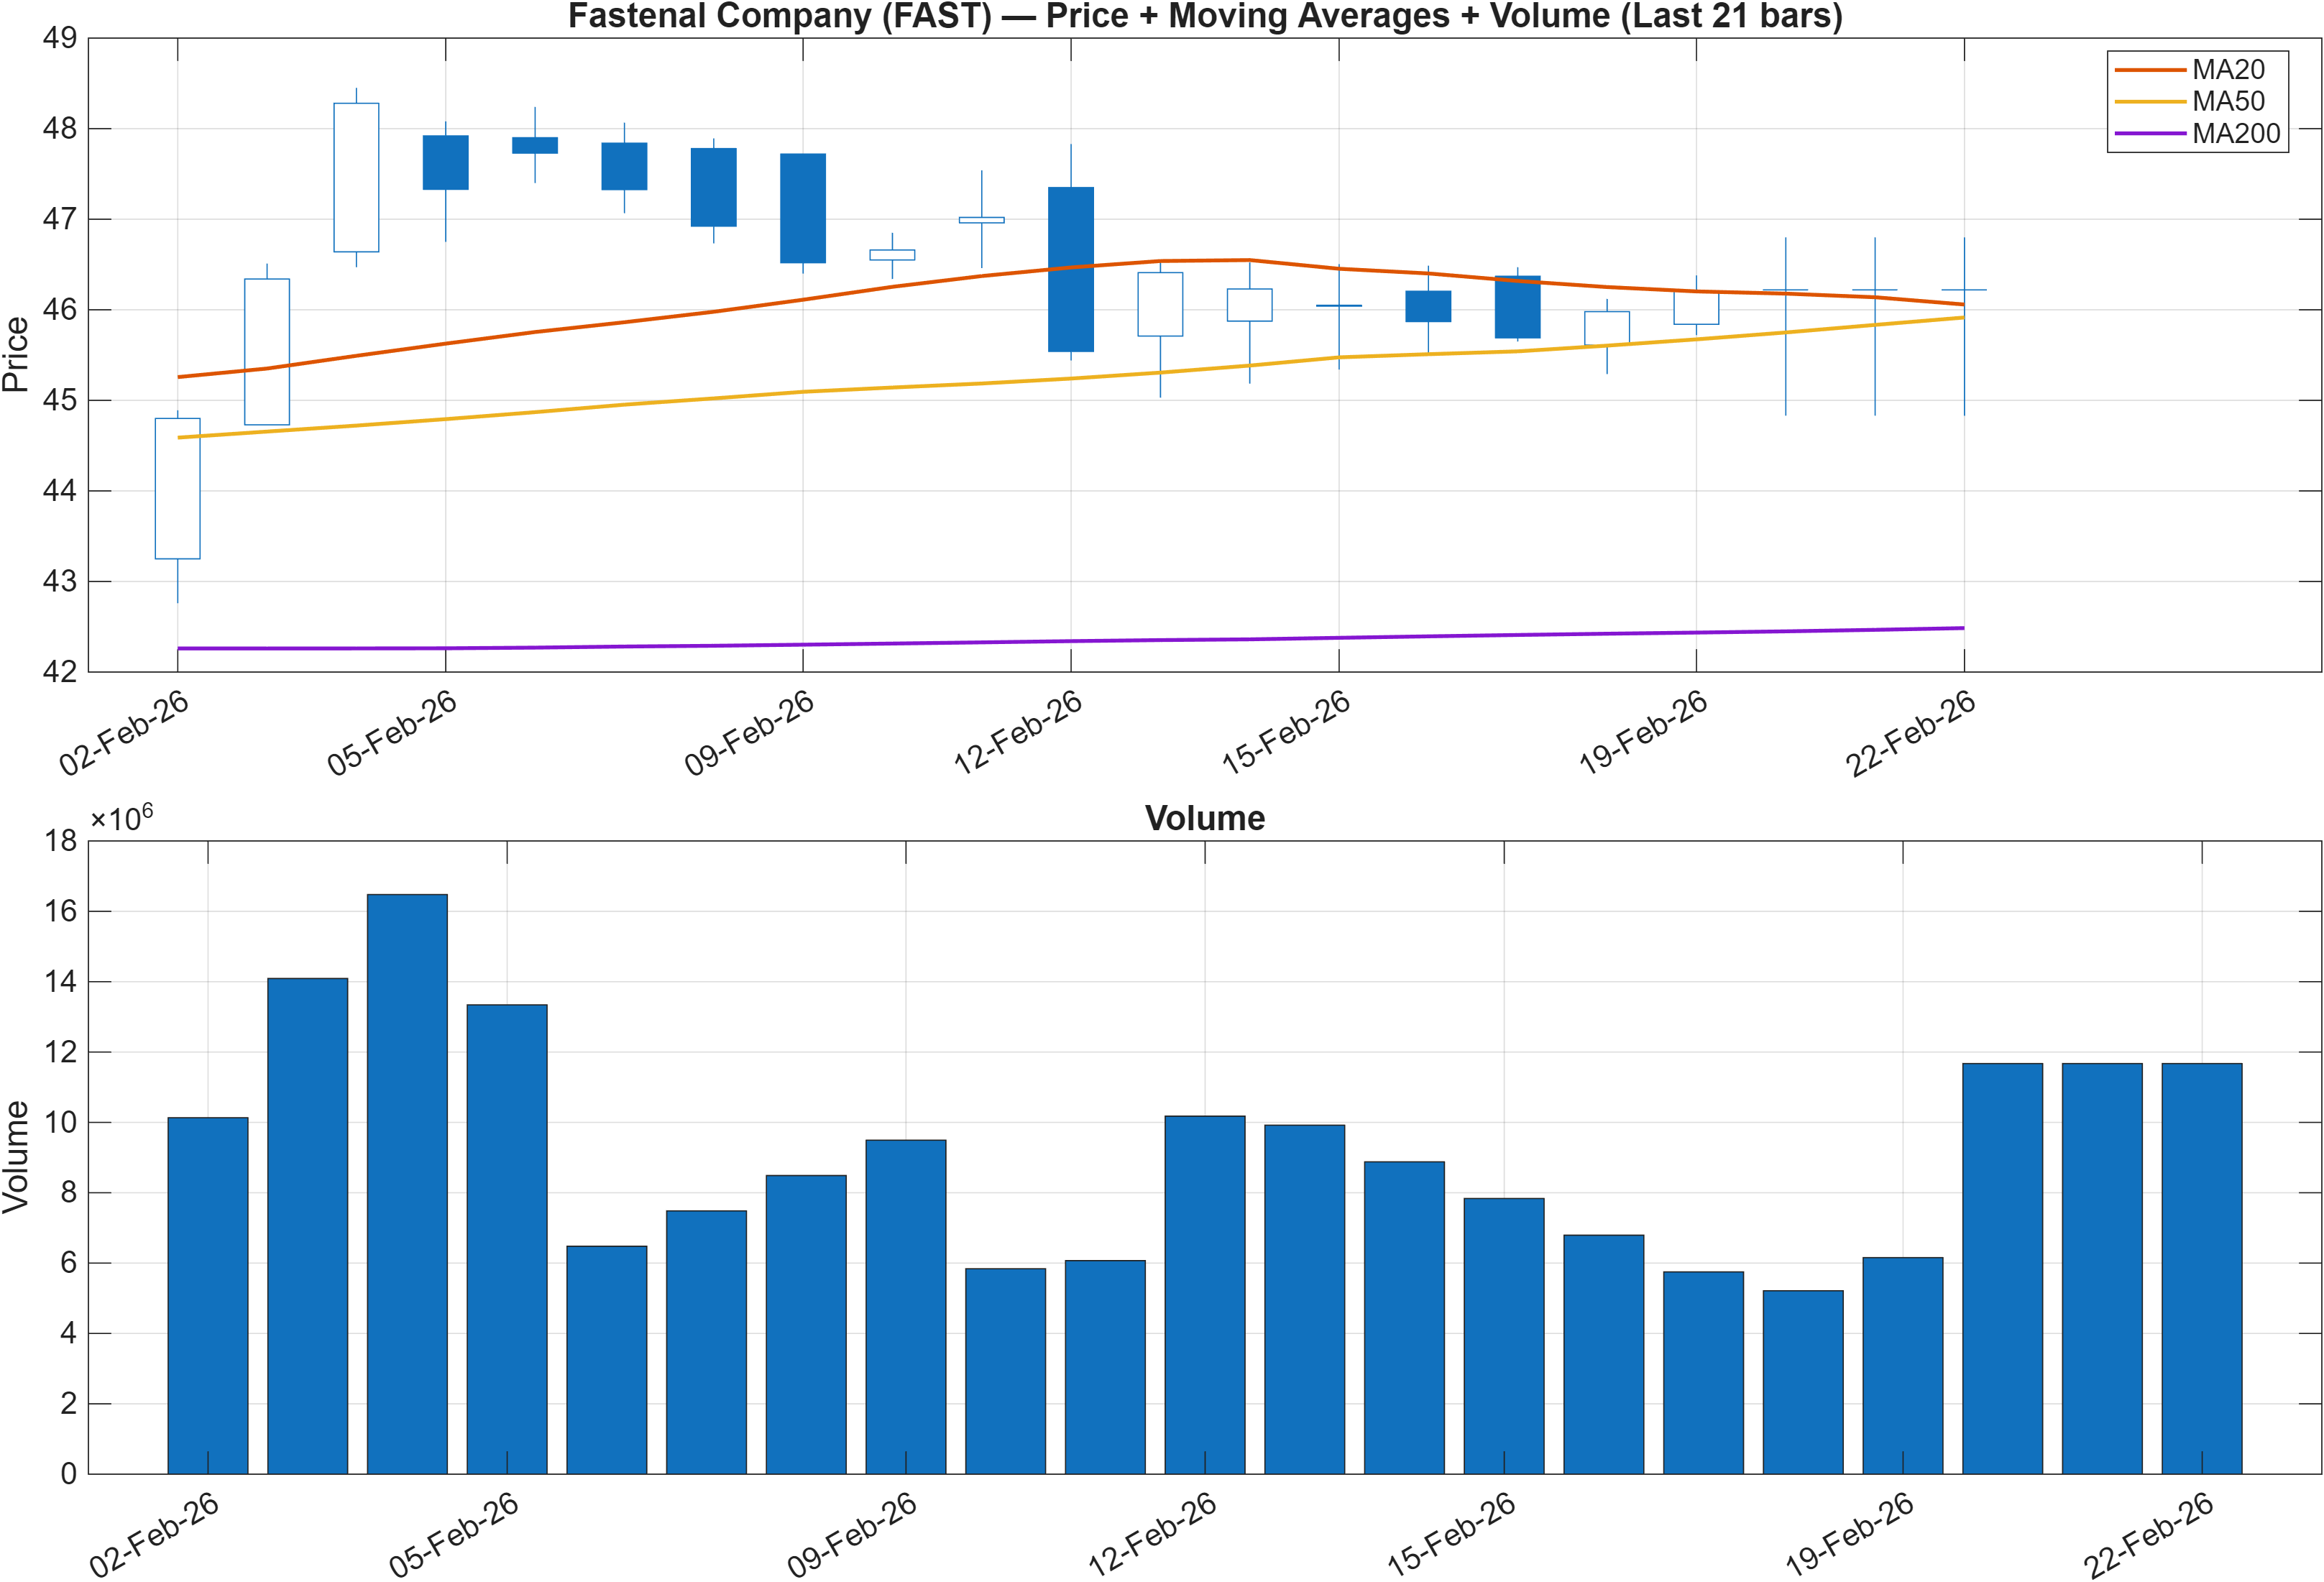
Interpretation: Close vs MA50 = Bullish, MA50 vs MA200 = Bullish.
The primary trend read is constructive: price closing above the MA50 while MA50 remains above MA200 is a classic two-layer confirmation of trend persistence. In market structure terms, this configuration generally signals that the intermediate trend is still aligned with the longer-term direction, and it tends to reduce the probability that short-lived pullbacks evolve into deeper regime breaks—unless price begins to violate key horizontal levels.
That said, a bullish moving-average stack does not automatically imply strong short-term momentum. The later momentum dashboard shows mixed readings (e.g., MACD histogram -0.1607 and RSI(14) 42.19), which can occur when a trend is holding but undergoing a digestion phase. The practical implication is that FAST’s structure can remain trend-supported while still requiring incremental demand (often observable through volume/accumulation proxies) to re-accelerate.
This is where the rank context becomes important: with a Daily rank of #182 and a much stronger 6-Monthly rank of #27, the data tilt suggests the longer-horizon bid is stronger than the near-term impulse. If price can maintain the moving-average posture while reestablishing positive momentum, the configuration becomes more consistent with a continuation regime rather than a topping pattern.
3) Momentum & volatility dashboard
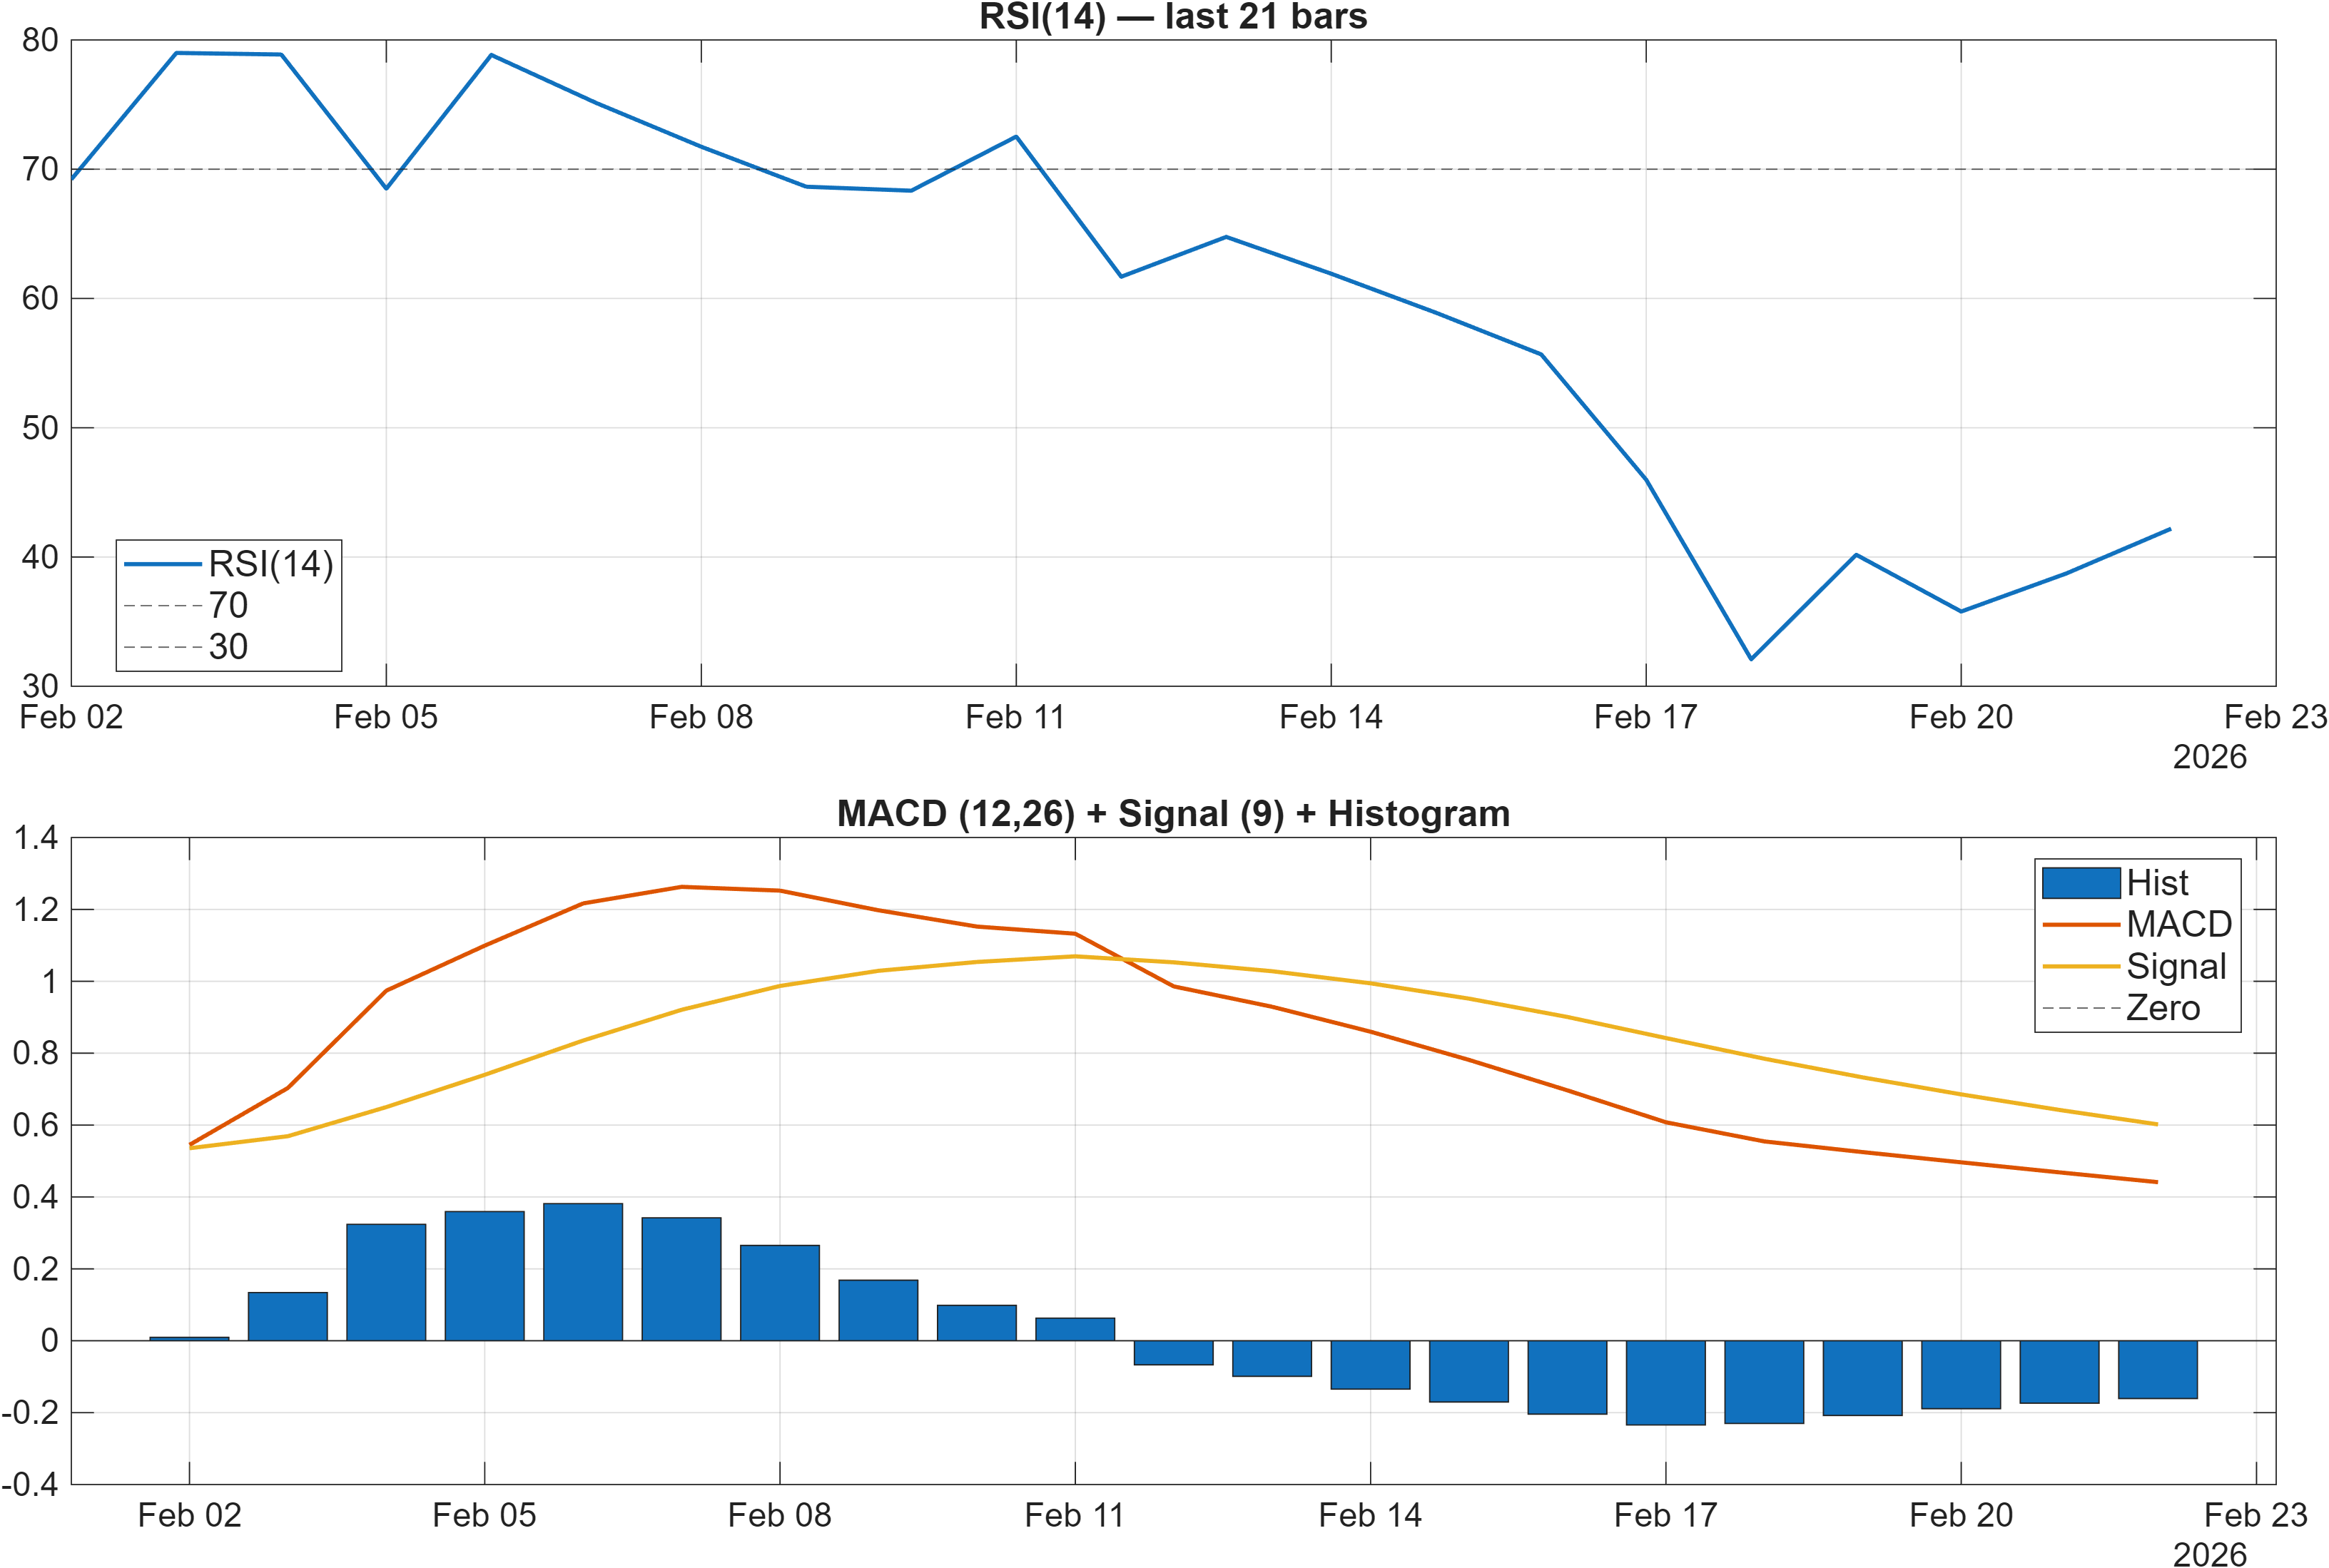
Interpretation: RSI bias = Neutral, MACD hist = -0.1607.
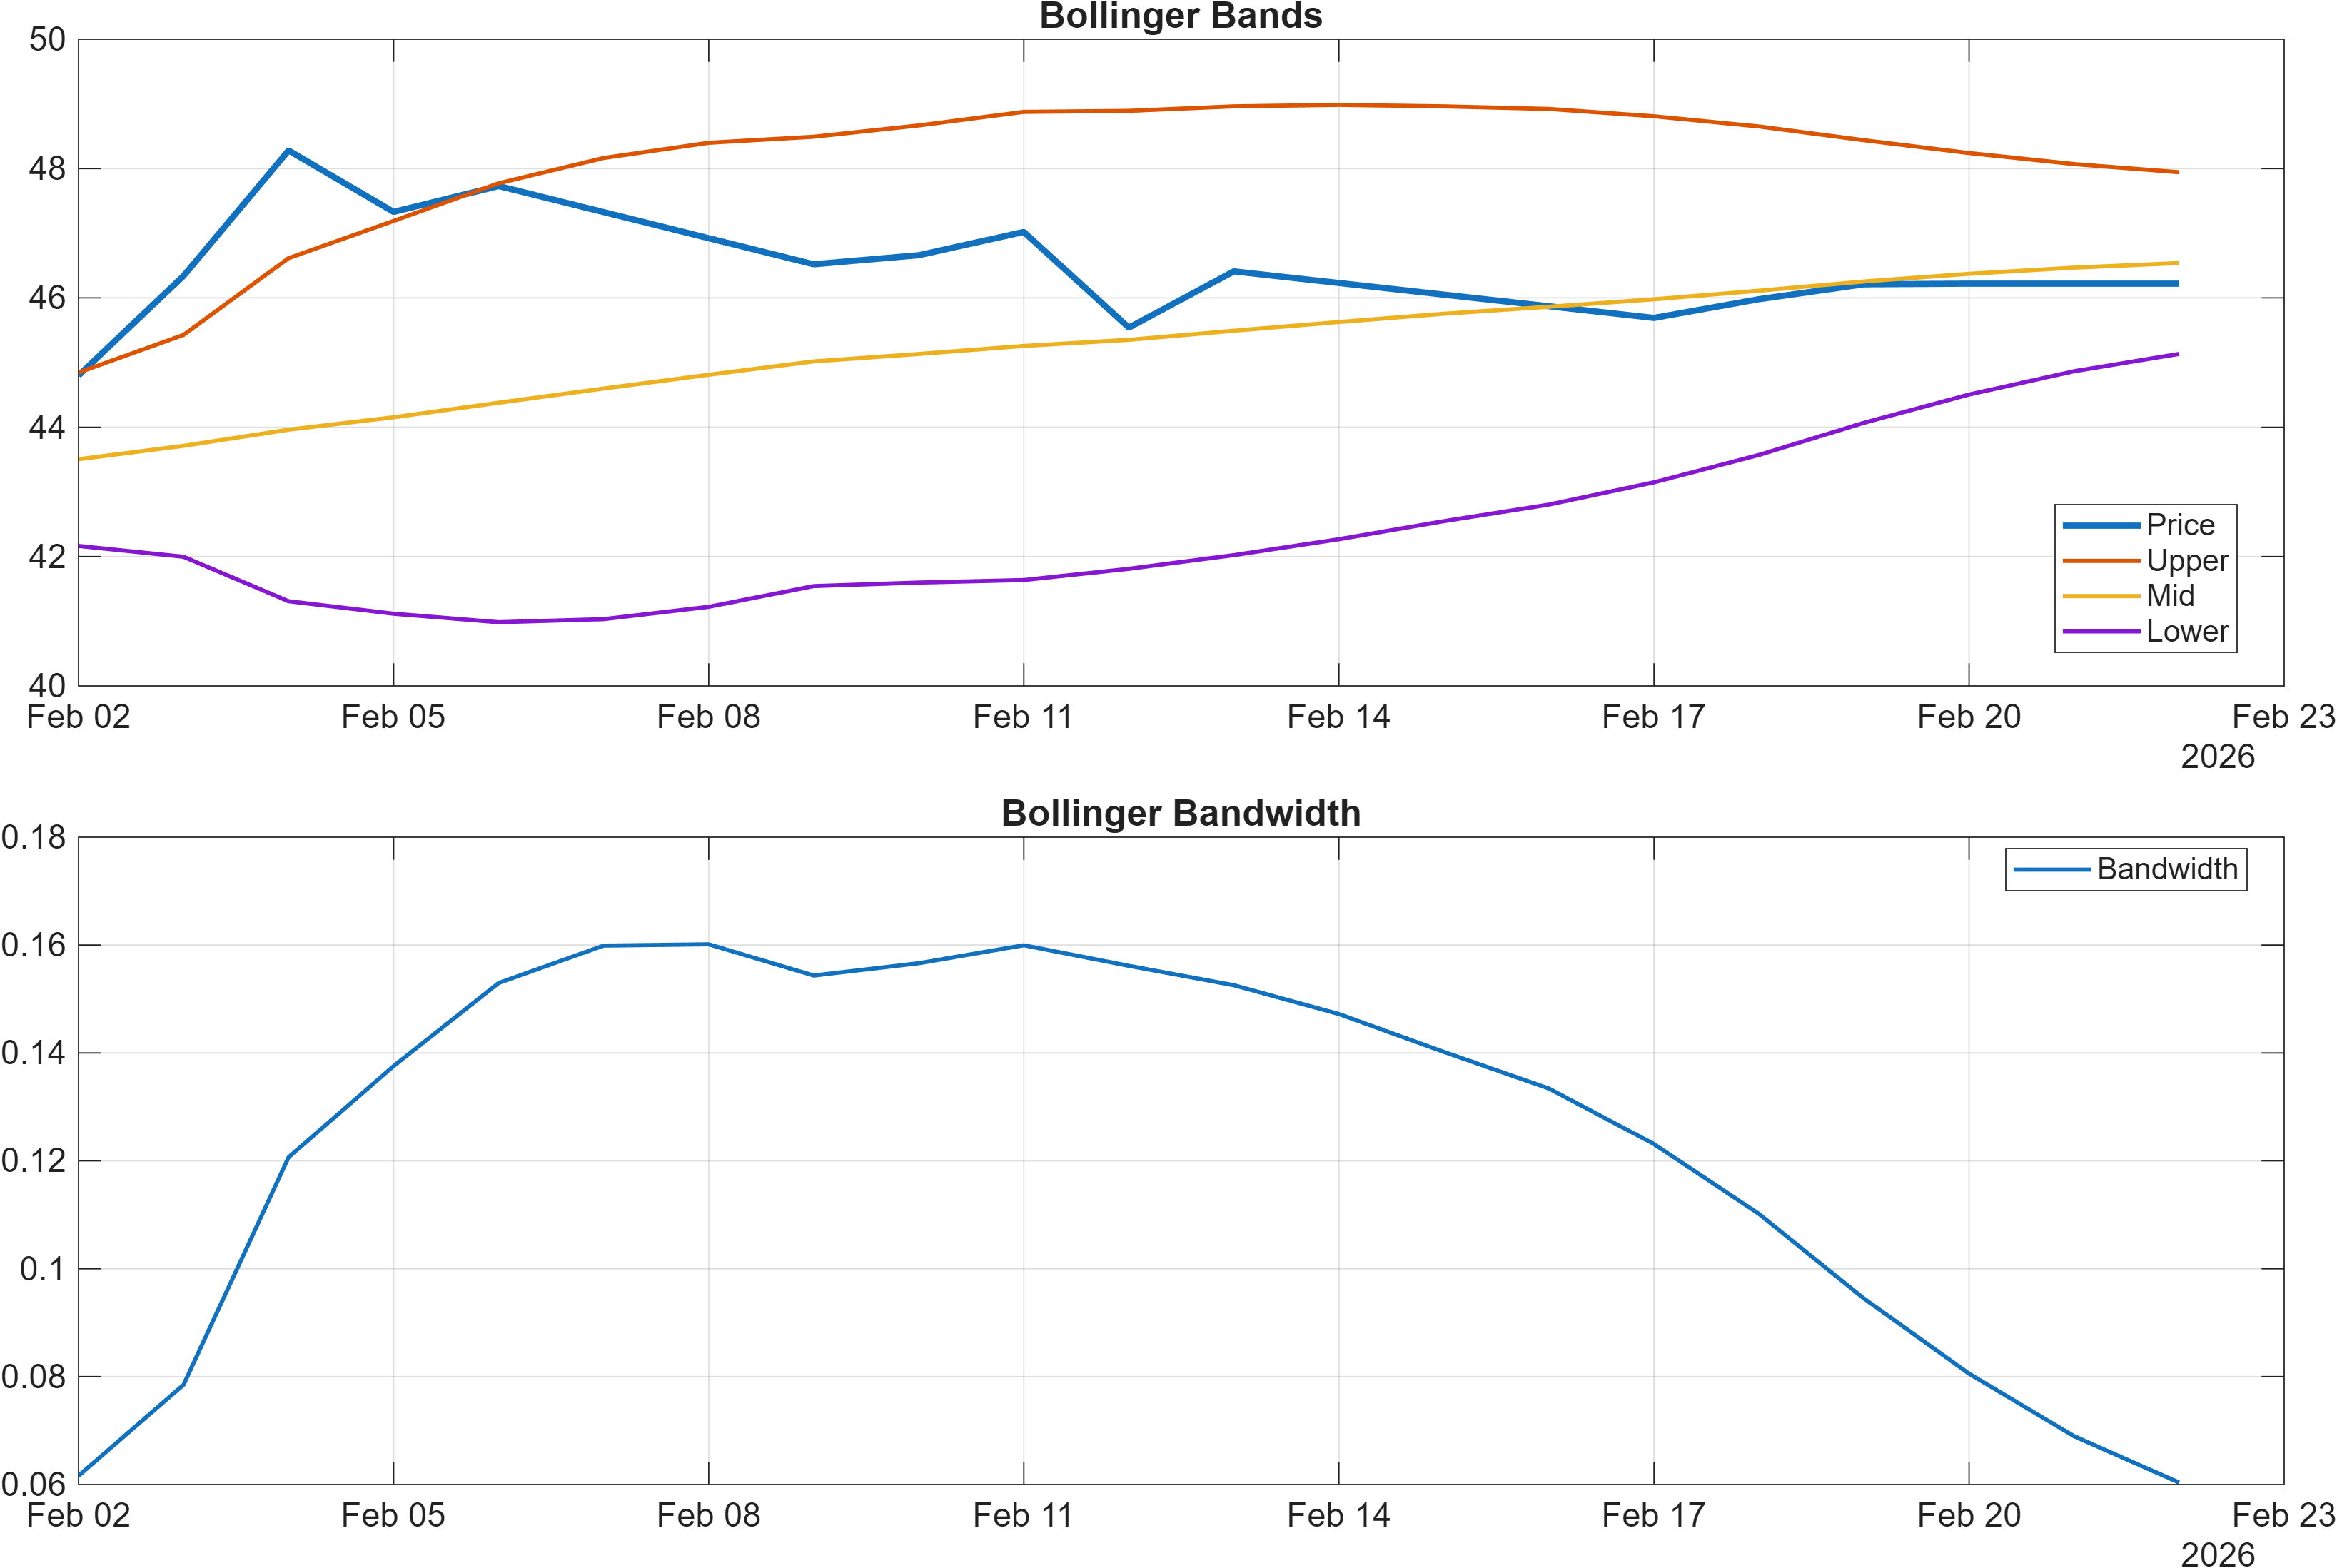
Interpretation: Bandwidth (volatility regime) latest = 0.0604.
Momentum and volatility are not fully synchronized for FAST. The MACD histogram at -0.1607 indicates negative momentum pressure remains present at the margin, while the dashboard flags RSI bias as Neutral—a combination that often appears when downside momentum is moderating but has not yet flipped into a clean bullish impulse. In the signal table, RSI(14) reads 42.19 (Bearish), reinforcing the idea that momentum has been soft enough to register as bearish at the indicator level even while the higher-level RSI bias is framed as neutral.
Volatility conditions add another layer. Bollinger Bandwidth at 0.0604 (with BB Width listed as 0.06037 in the dashboard) suggests a relatively contained volatility regime rather than a high-expansion trend burst. When volatility is compressed, price can remain range-bound longer than expected, and breakouts—if they occur—tend to require a clearer catalyst in flow (often visible through accumulation measures) or a decisive level break.
The cross-check with broader positioning is constructive but cautious: bullish ranks (e.g., Monthly #286 and 3-Monthly #107) can coexist with a momentary momentum dip, but the probability profile improves if negative momentum readings begin to revert. If the market is transitioning from compression to expansion, watch whether MACD histogram stabilizes and whether RSI recovers from the low-40s area without price breaking key structural support.
4) Support / Resistance zones
Support ~ 40.2550 | Resistance ~ 47.7750
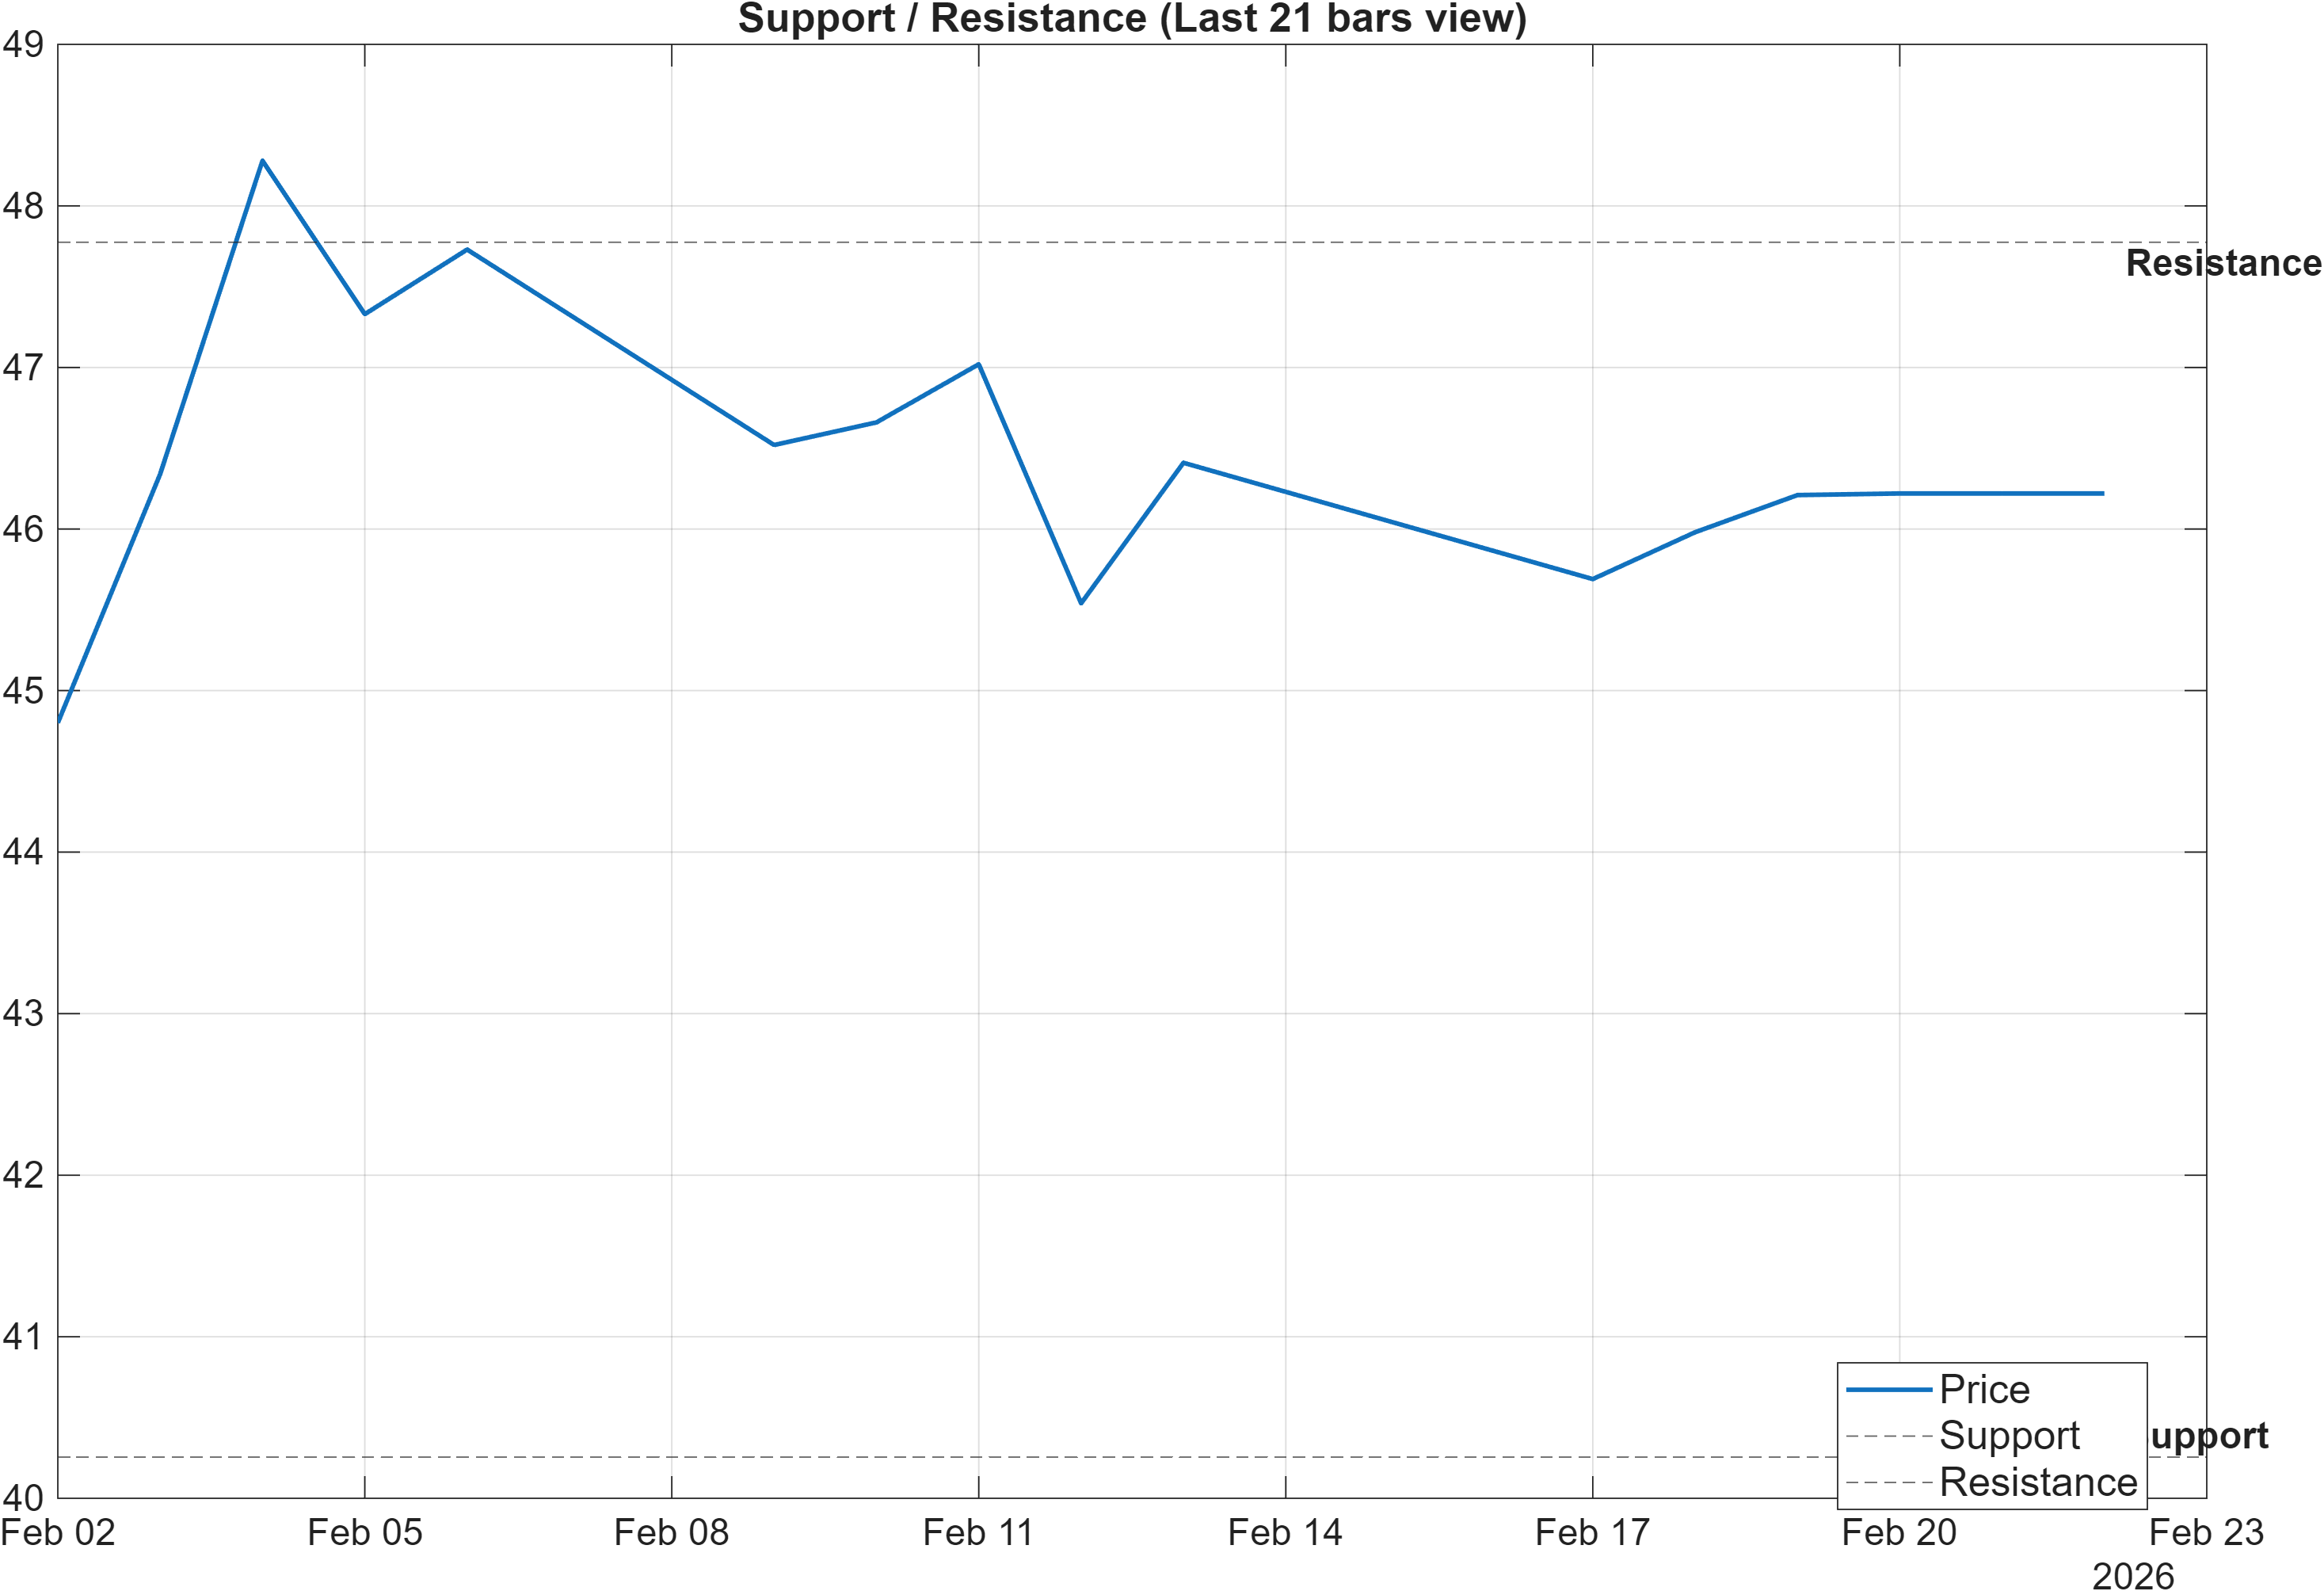
Scenario view: Break above resistance with volume → continuation. Close below support → signal deterioration risk.
FAST’s near-term decision framework is well-defined by the horizontal zones at 40.2550 (support) and 47.7750 (resistance). With trend filters reading bullish (close above MA50; MA50 above MA200), these levels function less as abstract markers and more as risk boundaries that determine whether the existing bullish regime remains intact.
The resistance area at 47.7750 matters because several dashboard components point to a market that may still be rebuilding momentum: MACD histogram -0.1607 and a neutral-to-soft RSI posture mean that a mere drift higher may not be sufficient to confirm continuation. A decisive move through resistance is more analytically meaningful when it is accompanied by stronger participation signals, particularly given the mixed volume note in the signal table (Vol ROC(20) -17.16 is bearish).
Conversely, the support at 40.2550 is a key invalidation area for the bullish rank thesis. Even with strong longer-horizon ranks (notably 6-Monthly #27), a close below support would increase the probability that the current regime is transitioning from trend persistence into deterioration. The technical dashboard also contains a stabilizing element—MedPx vs Support 5.56 (Bullish)—which implies price is not sitting directly on the edge; however, that buffer should be treated as a condition that can change quickly if volatility expands.
5) Quant Technical Dashboard (18 Signals)
KGNAI AI Technical Analysis Score (Deep Reinforcement Learning): Rank #1243 out of 2069 (Rank 1 represents the strongest technical positioning and a higher probability of favorable price behavior. As ranks increase toward the maximum, the probability of favorable outcomes weakens and bearish positioning becomes more dominant.) | Label: Neutral | Score: -0.202
18-Signal Technical Confluence Score: 0.000 (Neutral)
Overall Technical Score (18-signal confluence + DRL rank blend): -0.060 (Neutral)
Note: The blended score reflects signal strength weighted against broader AI technical ranking, which may temporarily diverge.
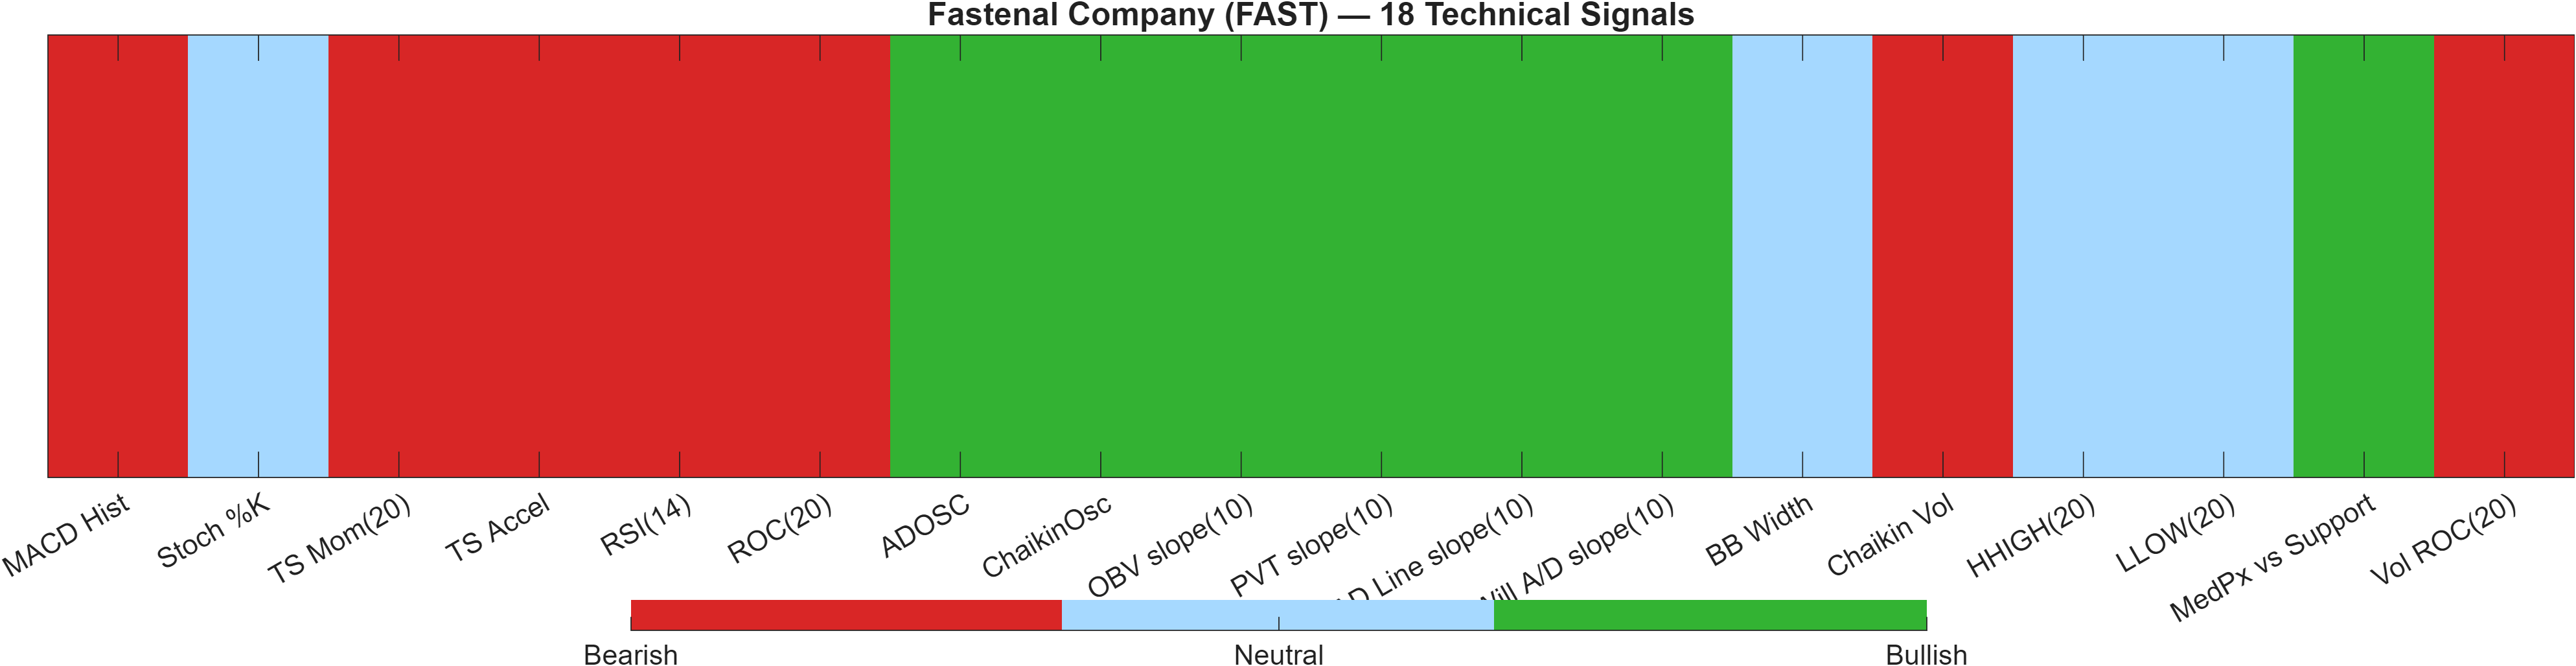
Blended technical score breakdown: -0.060 (Neutral | Bull 7 / Bear 7 / Neutral 4)
Signal alignment: balanced internals with momentum/volume tension
FAST’s technical layer is best described as internally balanced, with the confluence score at 0.000 (Neutral) and the blended overall technical score at -0.060 (Neutral). The split—Bull 7 / Bear 7 / Neutral 4—is not just “mixed”; it indicates that independent subsystems are expressing different states. In these regimes, markets often respond more to level breaks (support/resistance) and volatility shifts than to any single oscillator reading.
The DRL technical rank provides an additional lens: #1243 out of 2069 with a score of -0.202 (Neutral) suggests that, relative to the broader universe, FAST’s technical positioning is not currently in the strongest cohort—even though the KGNAI multi-horizon ranks remain bullish. That divergence is analytically meaningful: it frames the setup as one where relative regime strength (ranks) may be ahead of near-term technical expression (dashboard).
Under the hood, momentum signals lean soft—MACD Hist -0.1607, TS Mom(20) -0.12, TS Accel -2.93, and ROC(20) -0.259 are all bearish—while several accumulation/flow metrics are supportive (e.g., ADOSC 50 and positive slopes in OBV/PVT/AD Line). This combination can be consistent with accumulation during consolidation, but it can also persist without resolution if volume remains weak (Vol ROC(20) -17.16). The practical read is conditional: improved momentum alongside a move toward 47.7750 would better align the dashboard with the bullish rank profile.
Signal table (Bull/Bear/Neutral)
| Indicator | Value | Signal |
|---|---|---|
| MACD Hist | -0.1607 | Bearish |
| Stoch %K | 70.56 | Neutral |
| TS Mom(20) | -0.12 | Bearish |
| TS Accel | -2.93 | Bearish |
| RSI(14) | 42.19 | Bearish |
| ROC(20) | -0.259 | Bearish |
| ADOSC | 50 | Bullish |
| ChaikinOsc | 7.262e+06 | Bullish |
| OBV slope(10) | 3.706e+06 | Bullish |
| PVT slope(10) | 1.419e+05 | Bullish |
| AD Line slope(10) | 2.891e+07 | Bullish |
| Will A/D slope(10) | 1.805 | Bullish |
| BB Width | 0.06037 | Neutral |
| Chaikin Vol | 5.948 | Bearish |
| HHIGH(20) | 48.45 | Neutral |
| LLOW(20) | 44.73 | Neutral |
| MedPx vs Support | 5.56 | Bullish |
| Vol ROC(20) | -17.16 | Bearish |
Interpretation: Indicator-level signals form the base confluence, which is then adjusted using a separate AI-driven technical ranking model. The final technical score summarizes this combined view.
6) News sentiment + extractive gist
Sentiment score (avg): 0.085 | Positive: 39% | Neutral: 54% | Negative: 7%
KGNAI AI News Sentiment Score (normalized -1 to +1): 0.94 (as of 2026-02-20) | Label: Bullish | Overall news score: 0.91
Positive Developments
Recent coverage across major financial outlets indicates a modestly constructive tone around Fastenal, consistent with the 39% positive and 7% negative distribution and an average sentiment of 0.085. The commentary mix leans toward operational execution themes—particularly ongoing channel and transaction mix dynamics—rather than purely macro narratives. This aligns with the platform’s normalized news signal reading 0.94 (Bullish) as of 2026-02-20, suggesting that, in aggregate, the language environment has been supportive. Importantly, constructive sentiment does not negate the neutral technical confluence (0.000), but it can help explain why longer-horizon ranks remain strong (e.g., 6-Monthly #27) even as shorter-term indicators such as MACD histogram -0.1607 remain soft. As a contextual input, the news flow appears more consistent with stabilization and incremental demand framing than with a deteriorating narrative.
Neutral / Mixed Developments
A meaningful portion of the coverage remains informational, matching the 54% neutral share in the dataset. The dominant neutral thread is interpretive rather than event-driven—market participants weighing industrial conditions, pricing context, and broader policy discussions without a single decisive implication for near-term price behavior. This neutrality is consistent with FAST’s current “wait for confirmation” posture: ranks are broadly bullish (e.g., Daily #182, Monthly #286), while the blended technical score is still -0.060 (Neutral). In other words, the news backdrop provides context but not a strong standalone catalyst signal within the provided data, leaving key technical zones—40.2550 and 47.7750—as the primary decision boundaries.
Negative / Risk Signals
The negative slice is small at 7%, yet the risk framing is still relevant because it can amplify volatility if market expectations shift. In the current setup, the most material risk signal is not extreme sentiment, but the potential for valuation/expectations sensitivity to collide with a technically mixed tape. With momentum indicators registering bearish reads (e.g., RSI(14) 42.19 and ROC(20) -0.259), even modestly negative narratives can have an outsized effect if price is simultaneously testing structural zones. This is especially important given the range-defined market structure: a failure to reclaim upside momentum near resistance (47.7750) can keep FAST in a compression regime (bandwidth 0.0604), while a breakdown below 40.2550 would more directly challenge the bullish multi-horizon rank profile. Within the provided data, risks are present but not dominant; they function more as conditional accelerants than as a primary regime driver.
- Whether price can clear 47.7750 with confirming participation while volatility remains contained (bandwidth 0.0604).
- Whether bearish momentum metrics (e.g., MACD hist -0.1607, RSI(14) 42.19) begin to recover without violating 40.2550.
- Whether news tone remains supportive (normalized 0.94) as the technical blend stays near -0.060 (Neutral).
Sources referenced: Reuters, Bloomberg, Yahoo Finance, MarketWatch, Investing.com
7) Sources
Not available in the provided data.
You may also like: How KGNAI AI ranks instruments across global markets
Disclaimer: KGNAI provides AI-generated analytics and educational market commentary only. This is not financial advice. Markets involve risk. Always do your own research.