
TLRY (Tilray Inc) Technical & Rank Review — 18-Feb-2026 | Bearish Ranks, Neutral Technical Confluence
Tilray Inc (TLRY) enters 18-Feb-2026 with consistently bearish cross-horizon KGNAI ranks inside a 2073-instrument U.S. universe, while the shorter-cycle technical stack reads more balanced. The daily and weekly placements sit near the bottom of the distribution (e.g., #2017 and #2038), reinforcing a weak relative posture even as the 18-signal confluence and blended technical score remain Neutral (0.167 and 0.157). Momentum signals show mild improvement—MACD histogram is positive (0.0488) and RSI bias is Neutral (RSI(14) 47.34)—but trend alignment remains unfavorable with Close vs MA50 and MA50 vs MA200 both Bearish. Volatility is relatively compressed (bandwidth 0.0844), making the next directional resolution more dependent on how price behaves around support ~7.3173 and resistance ~10.1240. News tone is modestly constructive at the scoring level (avg 0.130; normalized 0.99), but positioning signals still argue for caution.
Key Takeaways
- Rank stance: Short Bearish | Mid Bearish | Long Bearish (ranks remain in the weakest slice of the 2073-name universe).
- Technical confluence: Neutral (18-signal confluence 0.167; overall blended score 0.157; DRL technical rank #898).
- Key levels: Support ~ 7.3173 | Resistance ~ 10.1240.
- News sentiment bias: Neutral distribution (39% positive / 54% neutral / 7% negative) with a Bullish normalized score (0.99 as of 2026-02-15).
- Confirmation / invalidation: Strength typically requires a break above 10.1240 with volume; deterioration risk increases on a close below 7.3173.
What KGNAI Measures
KGNAI evaluates instruments by relative positioning across large universes, focusing on how signals align across multiple horizons rather than any single indicator. Outputs are designed to reflect probabilistic behavior observed across many instruments under comparable market conditions.
How to Read This Report
- Ranks are comparative, not absolute.
- Confluence reflects agreement across signals (momentum, trend, volatility, and volume-flow).
- Support/resistance levels are decision zones, not precise turning points.
- Sentiment provides contextual bias that may diverge from price behavior.
1) KGNAI AI Analysis
Region: USA
Total universe size: 2073 ranked instruments
- Daily rank: #2017 out of 2073 — Bearish
- Weekly rank: #2038 out of 2073 — Bearish
- Monthly rank: #1894 out of 2073 — Bearish
- 3-Monthly rank: #1853 out of 2073 — Bearish
- 6-Monthly rank: #1793 out of 2073 — Bearish
- Yearly rank: #1777 out of 2073 — Bearish
The rank stack is uniformly Bearish across daily through yearly horizons, placing TLRY in the weakest tail of the 2073-instrument universe. The daily rank of #2017 and weekly rank of #2038 highlight poor short-cycle relative behavior, while the monthly (#1894) through yearly (#1777) readings suggest the longer window has not yet repaired enough to lift relative standing.
A key analytical nuance is the persistence of these ranks: when multiple horizons sit in the same low-quality regime, the probability of sustained leadership is typically reduced, and reversals often need confirmation from price structure and participation. In this context, the report’s later sections become essential: trend structure is flagged as bearish versus major moving averages, yet momentum and confluence are not outright bearish. That combination frequently indicates stabilization attempts that have not translated into durable relative strength.
Term view: Short-term: Bearish. Mid-term: Bearish. Long-term: Bearish. With ranks clustered near the bottom, the burden of proof shifts toward signals that can demonstrate either (a) sustained improvement in trend alignment or (b) decisive level breaks supported by volume.
Badge view: Bearish Comparative rank regime
2) Price & trend overview
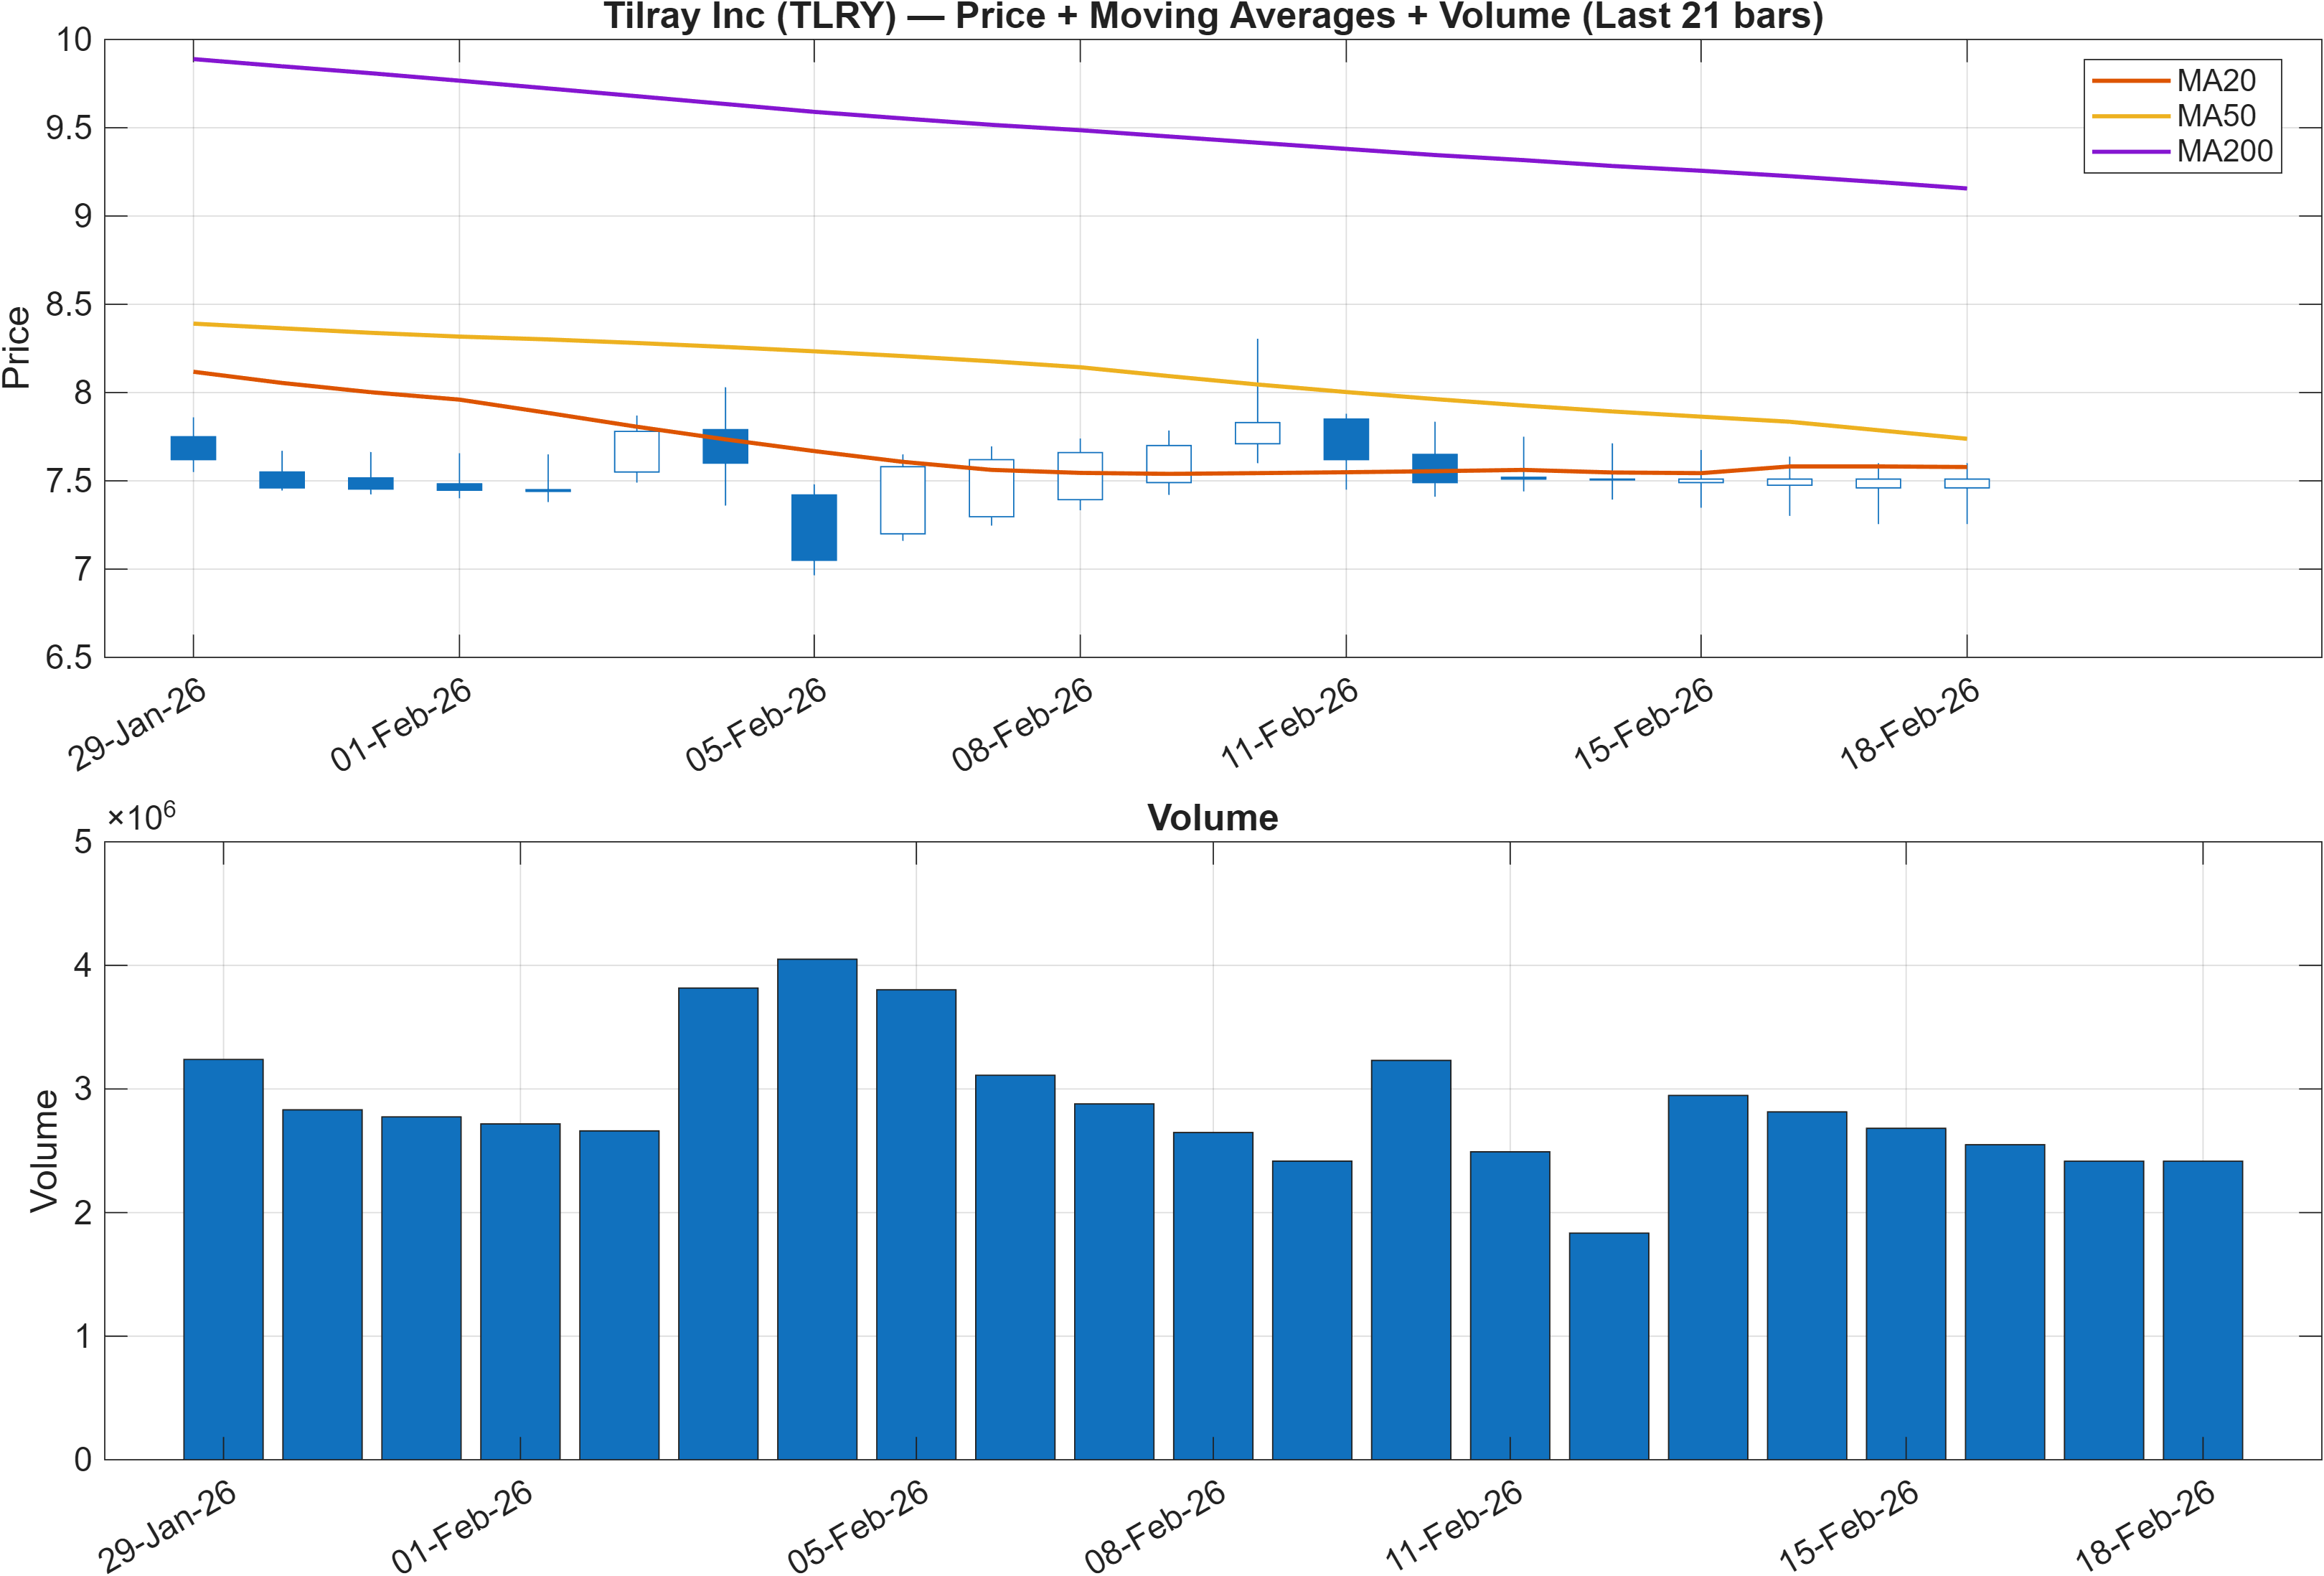
Interpretation: Close vs MA50 = Bearish, MA50 vs MA200 = Bearish.
Trend structure remains the primary headwind. With Close below MA50 and MA50 below MA200, the setup reflects a market still trading in a downtrend alignment rather than a confirmed basing transition. This matters because the broader rank profile (daily #2017, weekly #2038) typically improves only after price begins reclaiming key trend references and holding them.
The more constructive element is that the report does not show an outright momentum collapse in parallel: later indicators (MACD histogram 0.0488 and RSI(14) 47.34) sit closer to a “repair” zone than a capitulation zone. When trend is bearish but momentum stops deteriorating, price often shifts into range behavior where levels become more influential than averages.
The near-term map is therefore level-driven: support ~7.3173 anchors the downside decision area, while resistance ~10.1240 defines the threshold where trend repair would start to look credible. Until price can reclaim and hold strength consistent with breaking resistance, trend signals alone remain consistent with the bearish rank regime.
Badge view: Bearish Moving-average alignment
3) Momentum & volatility dashboard
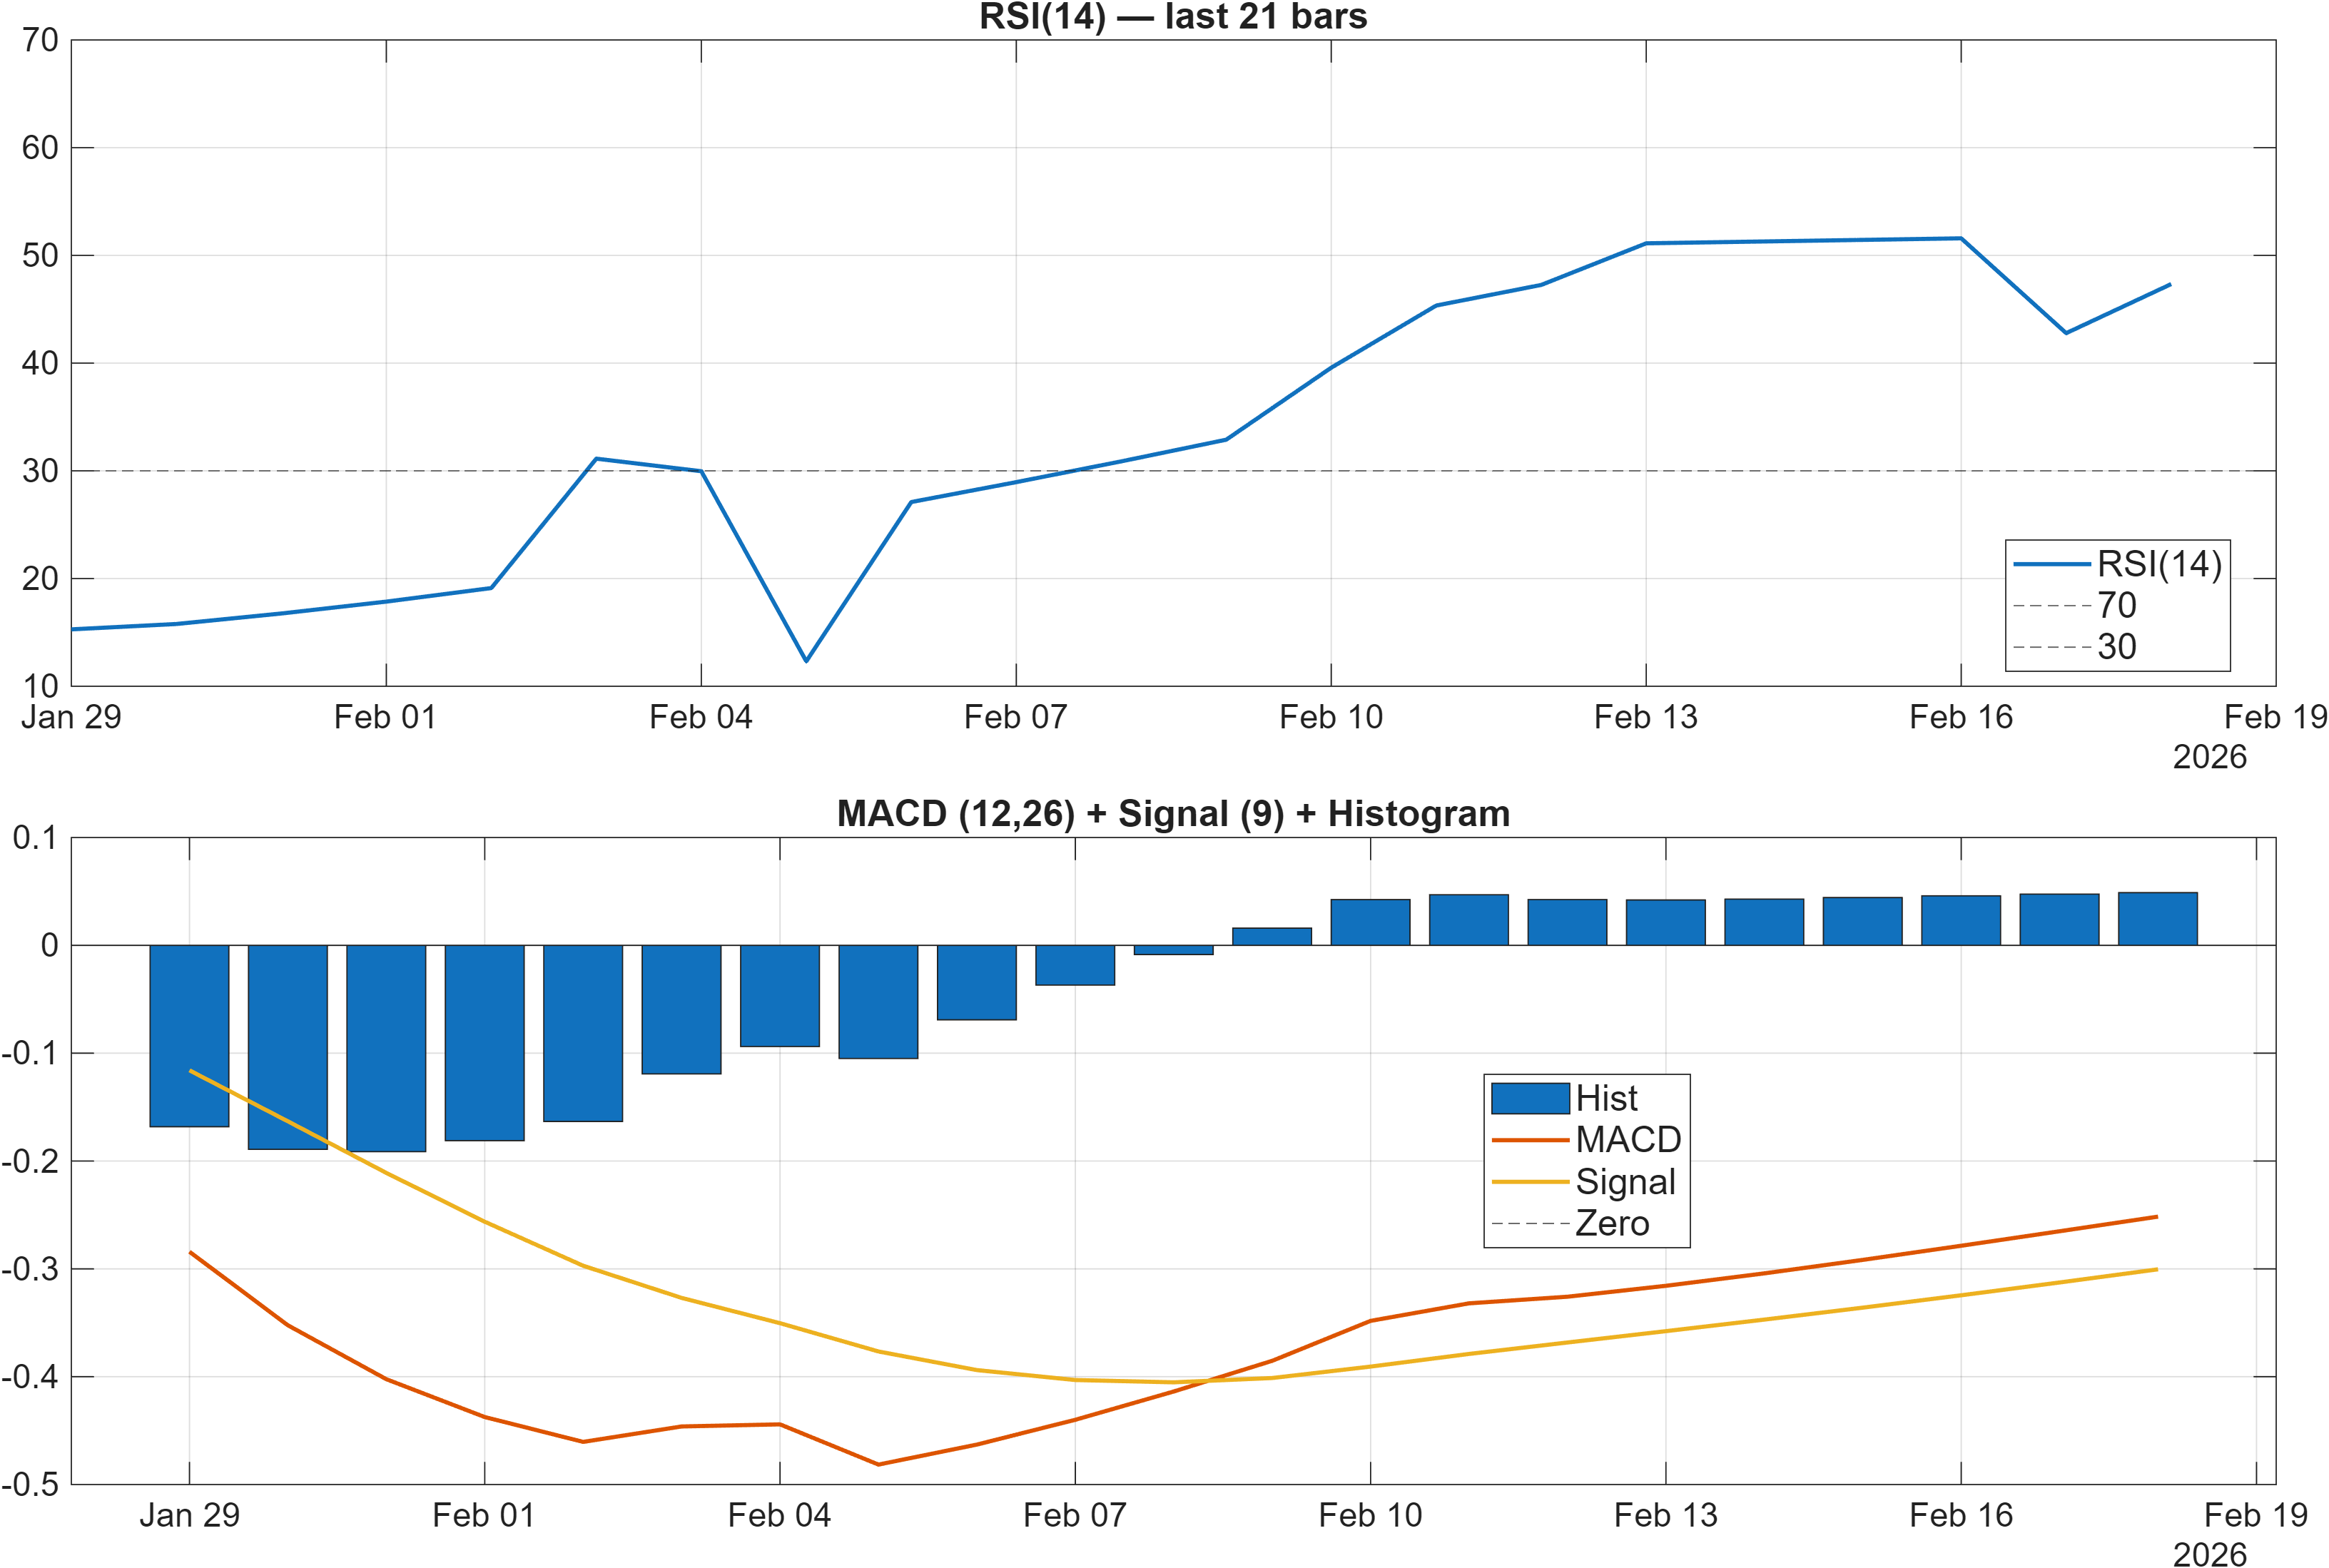
Interpretation: RSI bias = Neutral, MACD hist = 0.0488.
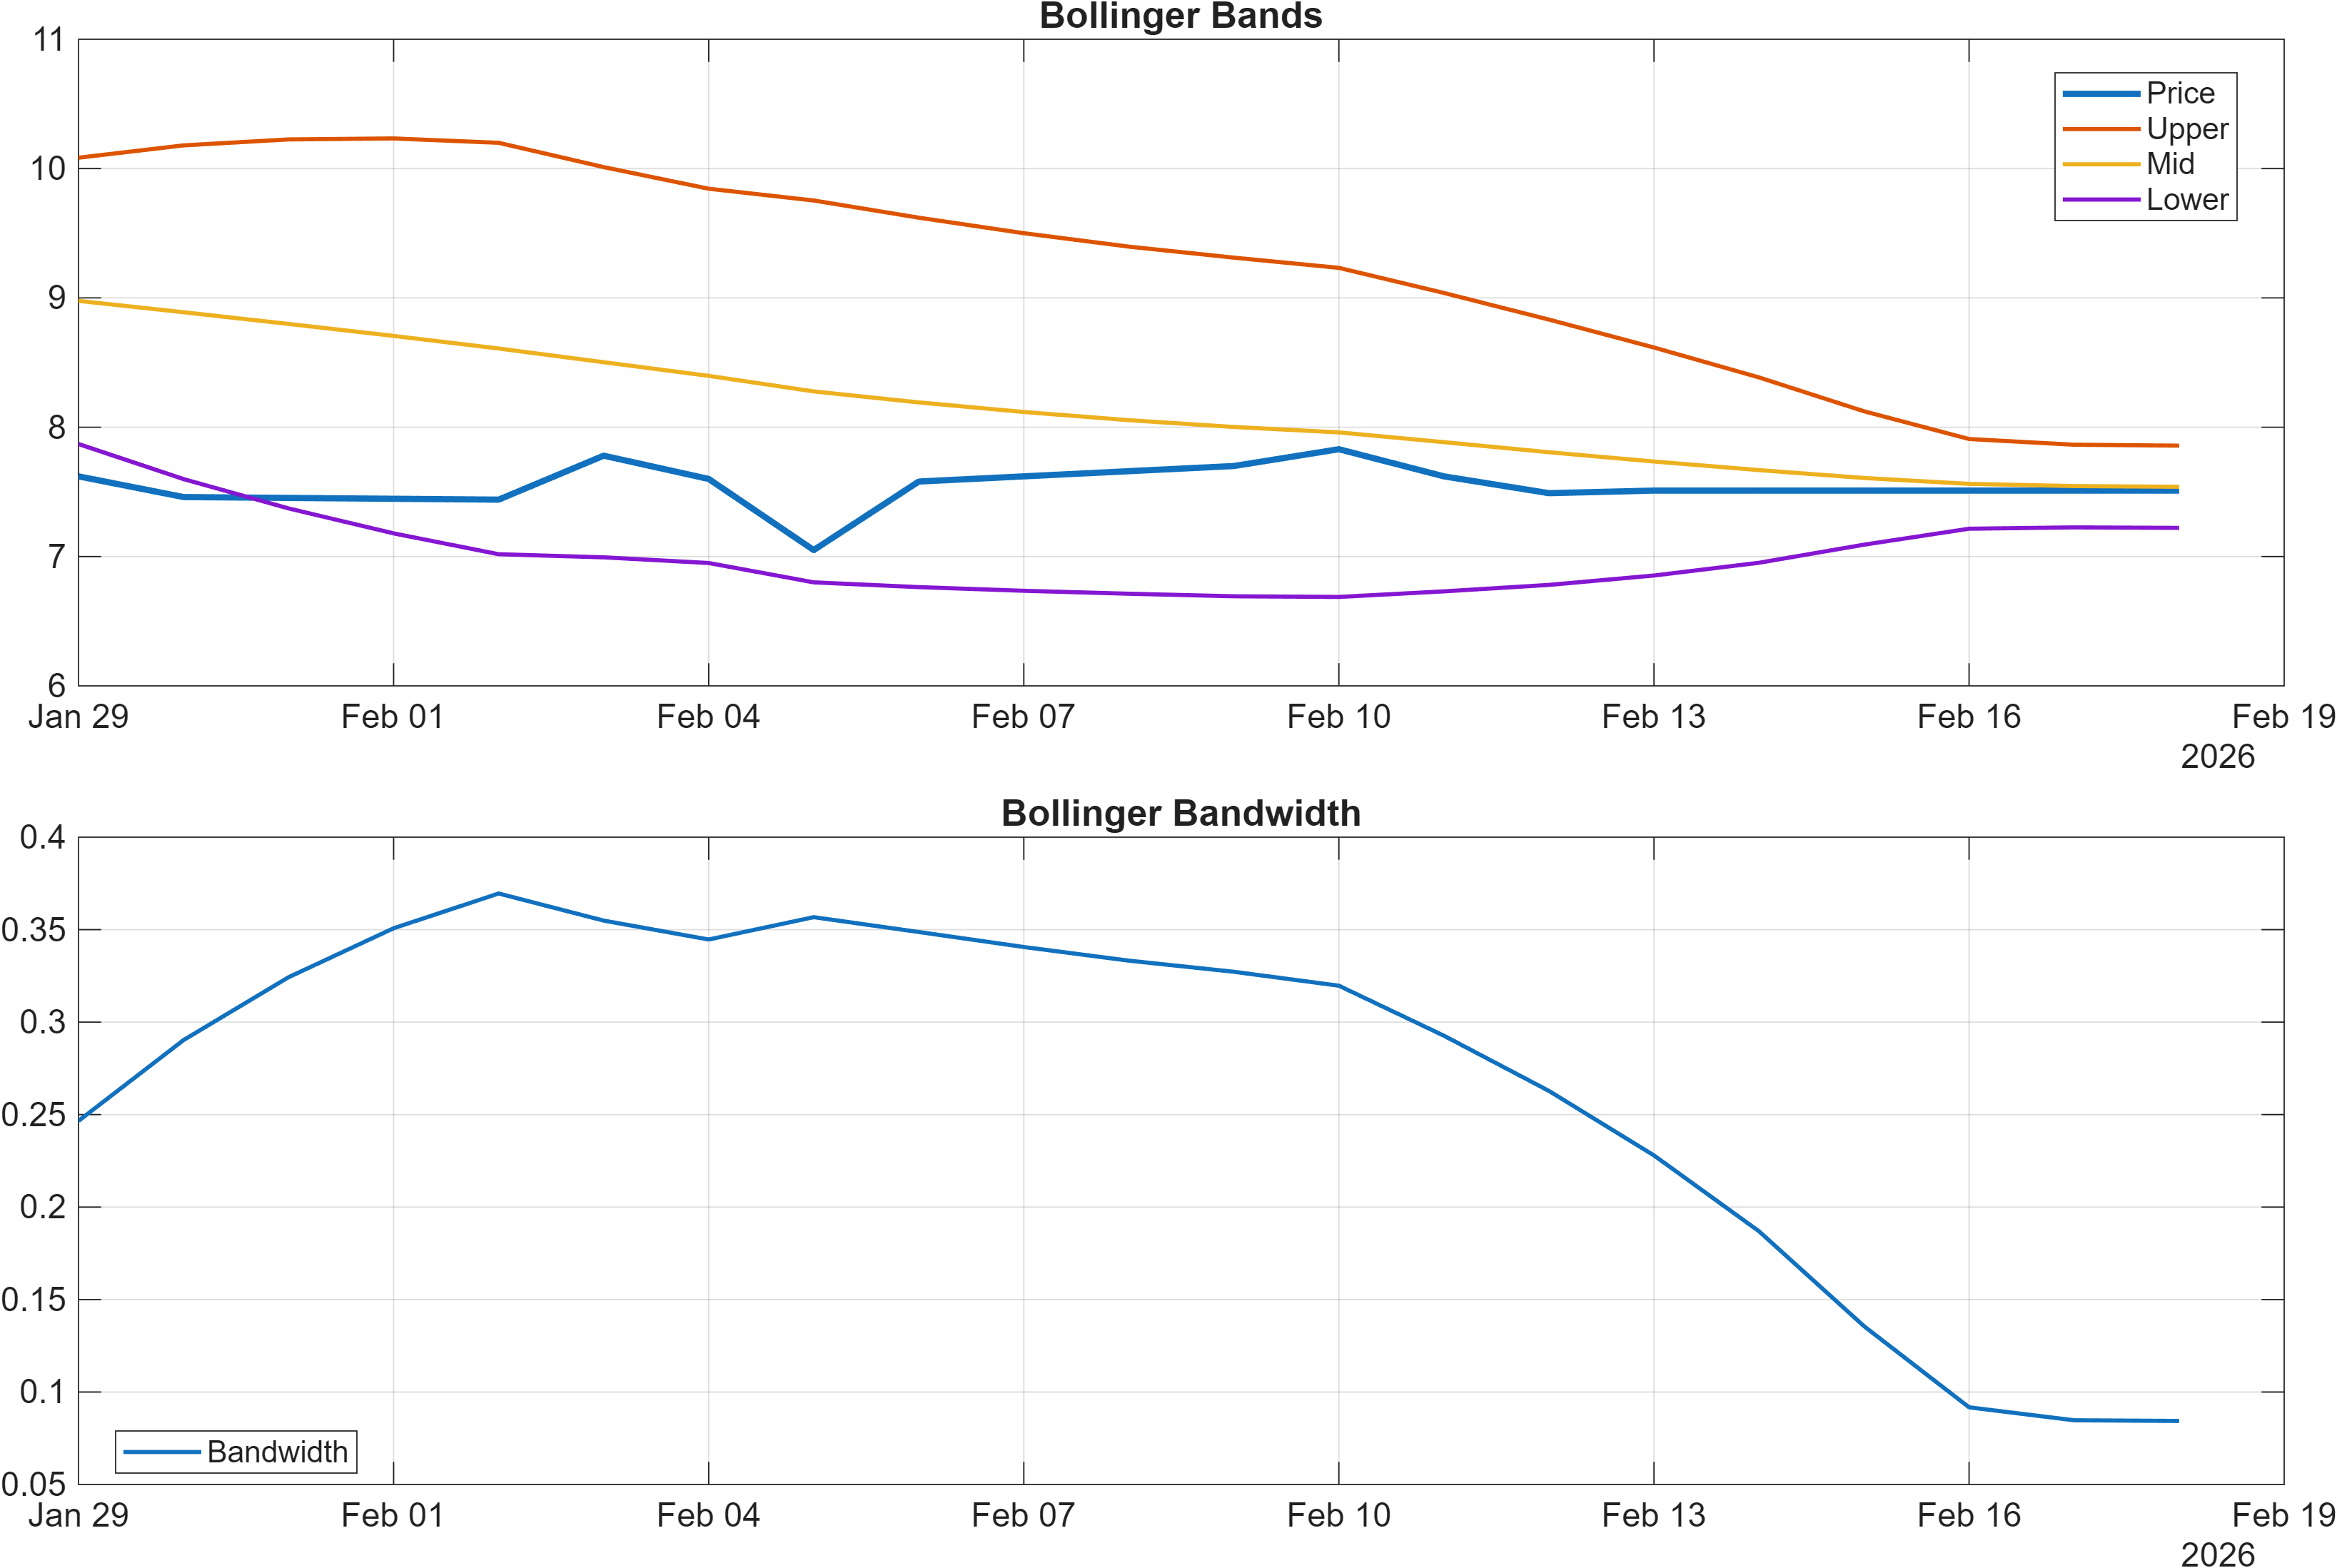
Interpretation: Bandwidth (volatility regime) latest = 0.0844.
Momentum reads more balanced than the rank and trend posture implies. RSI sits at 47.34 with a Neutral bias—neither stretched nor showing a strong upside impulse—while MACD histogram is modestly positive at 0.0488. This combination often signals that downside momentum has cooled, but buyers have not yet demonstrated enough follow-through to flip the intermediate trend structure.
Volatility is also relatively contained: Bollinger Bandwidth at 0.0844 indicates a compressed regime compared with higher-volatility phases. Compression can persist, but it also raises the importance of clean breaks around defined levels. In practice, an expansion phase that occurs above key resistance tends to reinforce trend repair, while an expansion that occurs below support more often confirms renewed deterioration risk.
The message across these dashboards is divergence rather than agreement: momentum is attempting to stabilize while ranks remain in the weakest slice (daily #2017, weekly #2038). Divergence does not invalidate the bearish rank signal; it simply frames the next question as whether stabilization matures into a measurable trend transition. That transition typically requires both (a) volatility expansion and (b) sustained closes that improve moving-average posture.
Badge view: Neutral RSI/MACD + volatility regime
4) Support / Resistance zones
Support ~ 7.3173 | Resistance ~ 10.1240
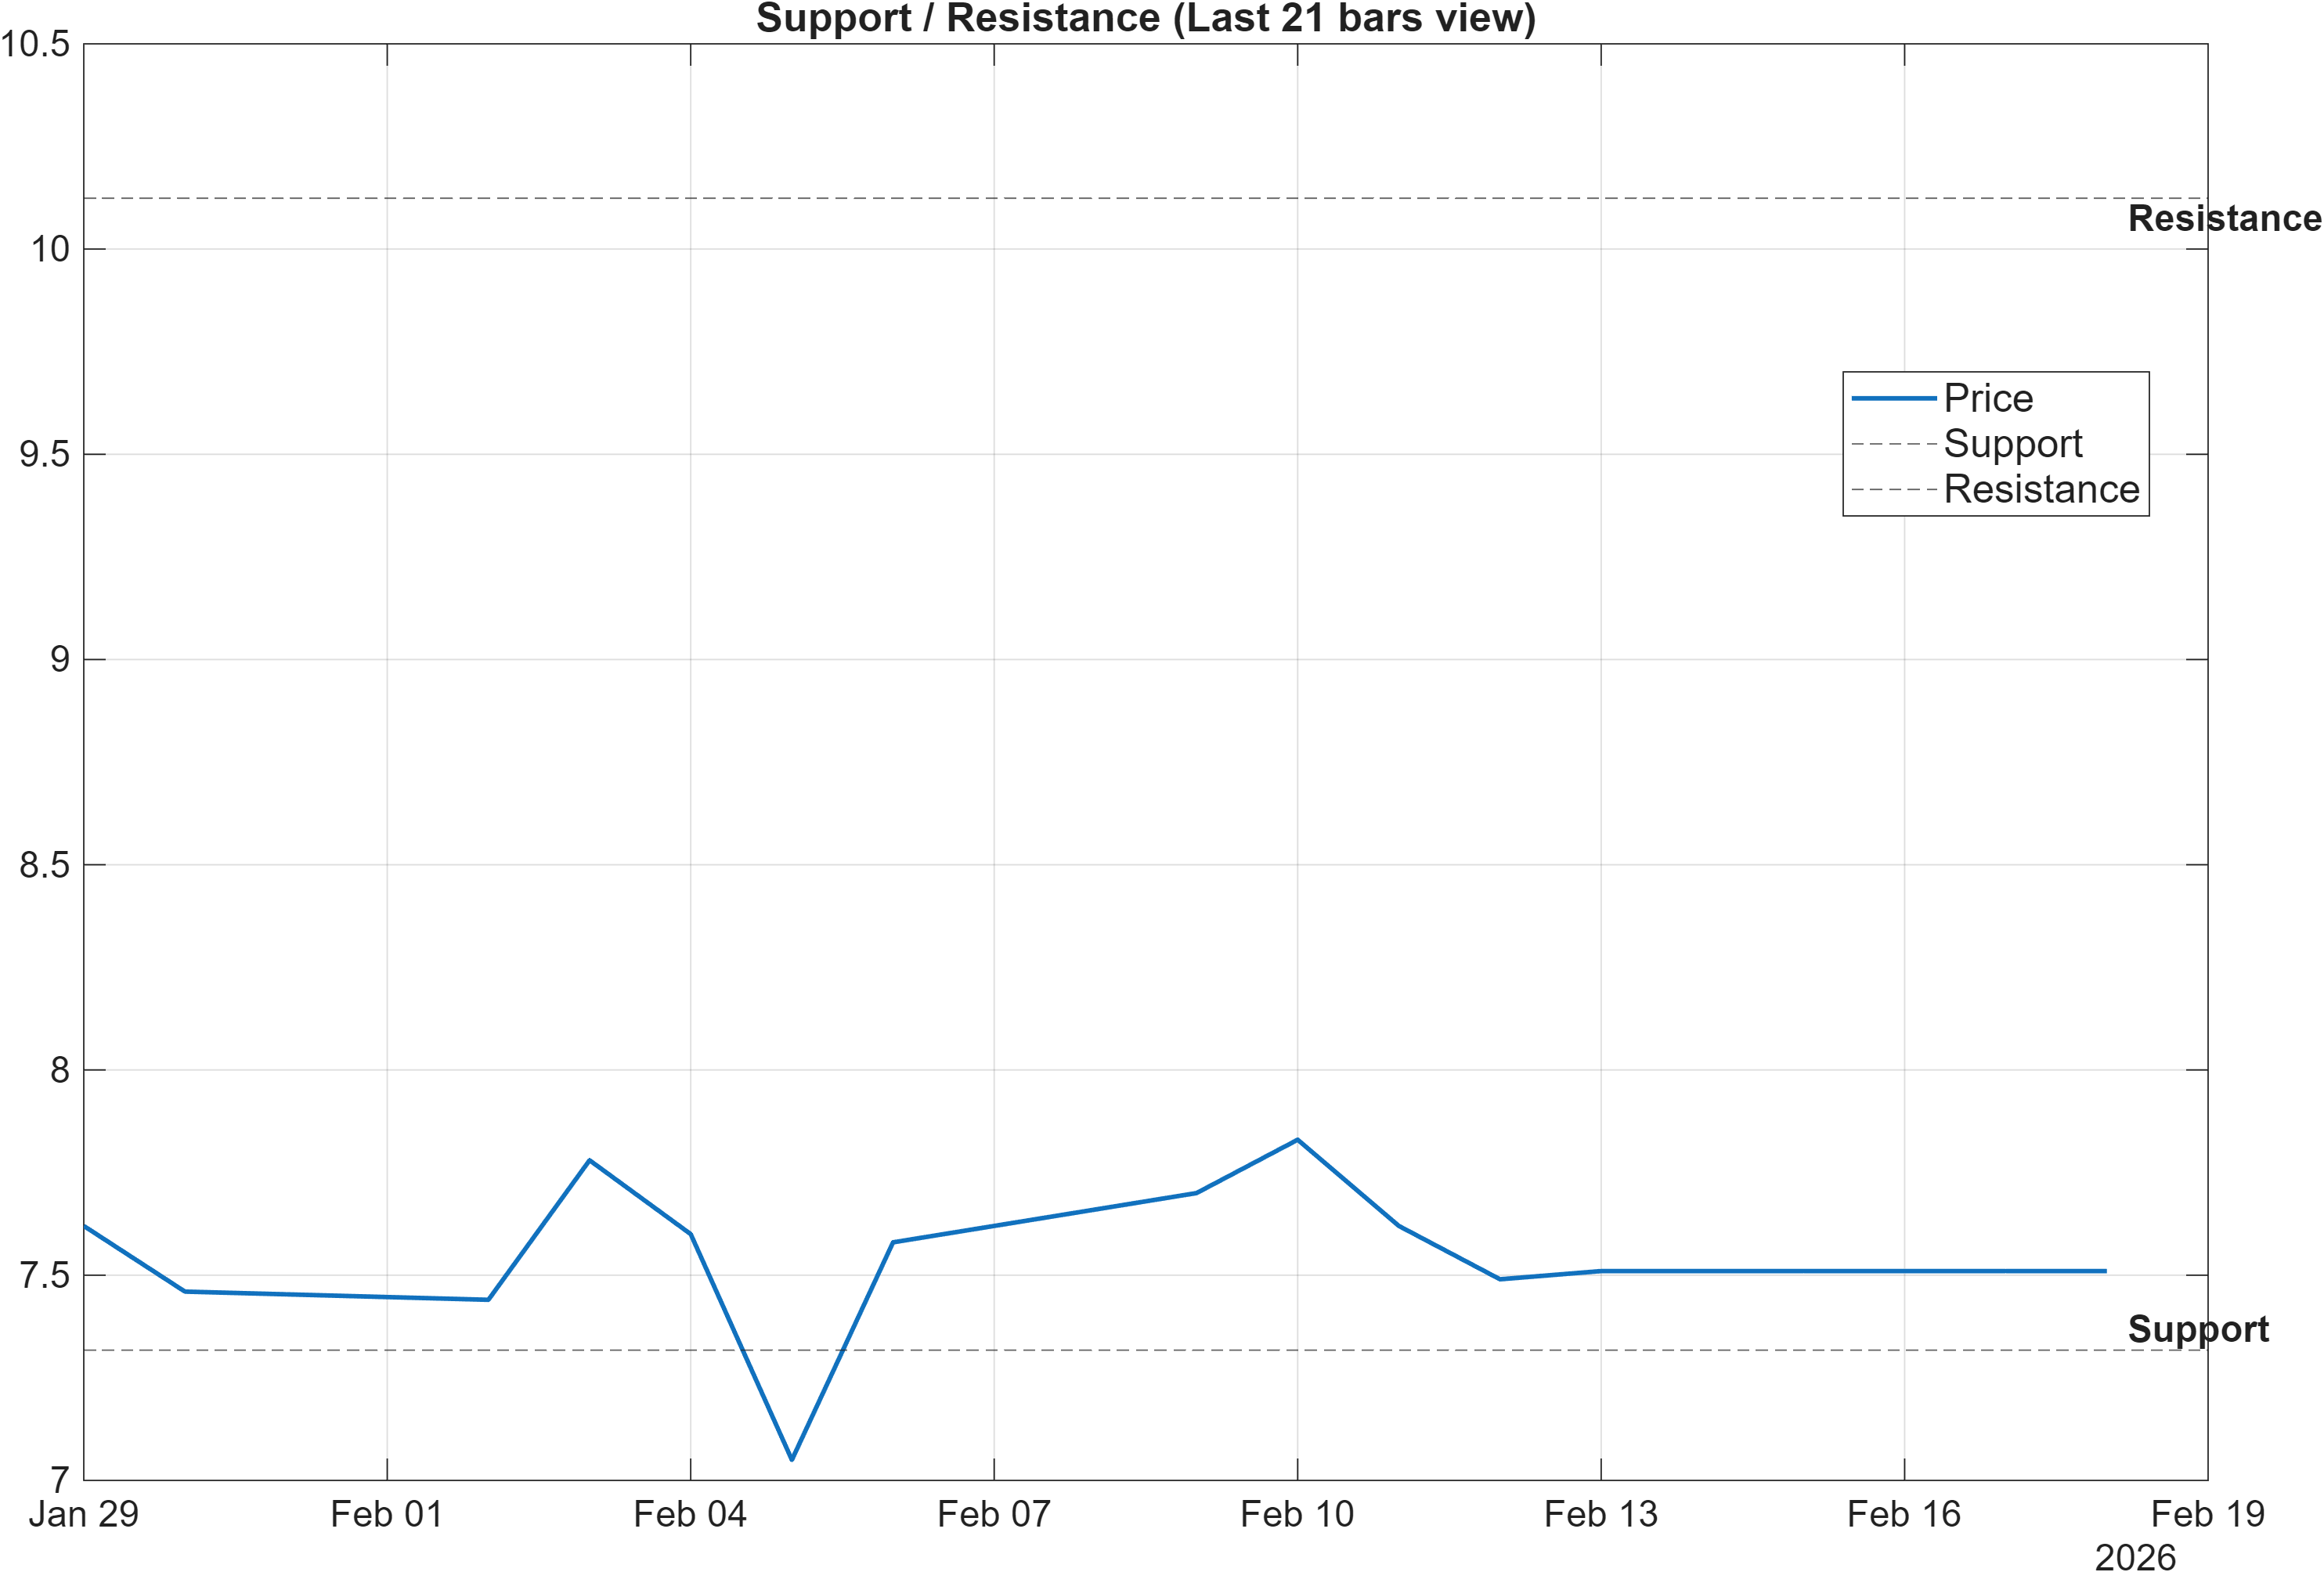
Scenario view: Break above resistance with volume → continuation. Close below support → signal deterioration risk.
With moving-average structure bearish and volatility compressed (bandwidth 0.0844), the support/resistance framework becomes the most actionable map for separating stabilization from renewed weakness. The defined floor at 7.3173 is the key downside decision zone: a close below this level would align with the existing bearish rank regime (daily #2017; weekly #2038) and would be consistent with the report’s stated “signal deterioration risk.”
On the upside, 10.1240 is more than a simple upside waypoint—it is the threshold that would begin to challenge the bearish trend narrative. Because the report calls for a break above resistance with volume, the emphasis is on participation rather than price alone. This is consistent with the broader framework used elsewhere in the dashboard, where volume-flow indicators are treated as validators of price movement.
Between these two levels, the most realistic reading is a range regime where signals can churn: neutral RSI (47.34) and a modestly positive MACD histogram (0.0488) can coexist with bearish longer-horizon ranks until price proves otherwise. That makes reactions around these zones more informative than mid-range noise, especially if volatility begins to expand from the current compressed state.
Badge view: Neutral Level-defined decision zone
5) Quant Technical Dashboard (18 Signals)
KGNAI AI Technical Analysis Score (Deep Reinforcement Learning): Rank #898 out of 2073 (Rank 1 represents the strongest technical positioning and a higher probability of favorable price behavior. As ranks increase toward the maximum, the probability of favorable outcomes weakens and bearish positioning becomes more dominant.) | Label: Neutral | Score: 0.134
18-Signal Technical Confluence Score: 0.167 (Neutral)
Overall Technical Score (18-signal confluence + DRL rank blend): 0.157 (Neutral)
Note: The blended score reflects signal strength weighted against broader AI technical ranking, which may temporarily diverge.
Blended technical score breakdown: 0.157 (Neutral | Bull 8 / Bear 5 / Neutral 5)
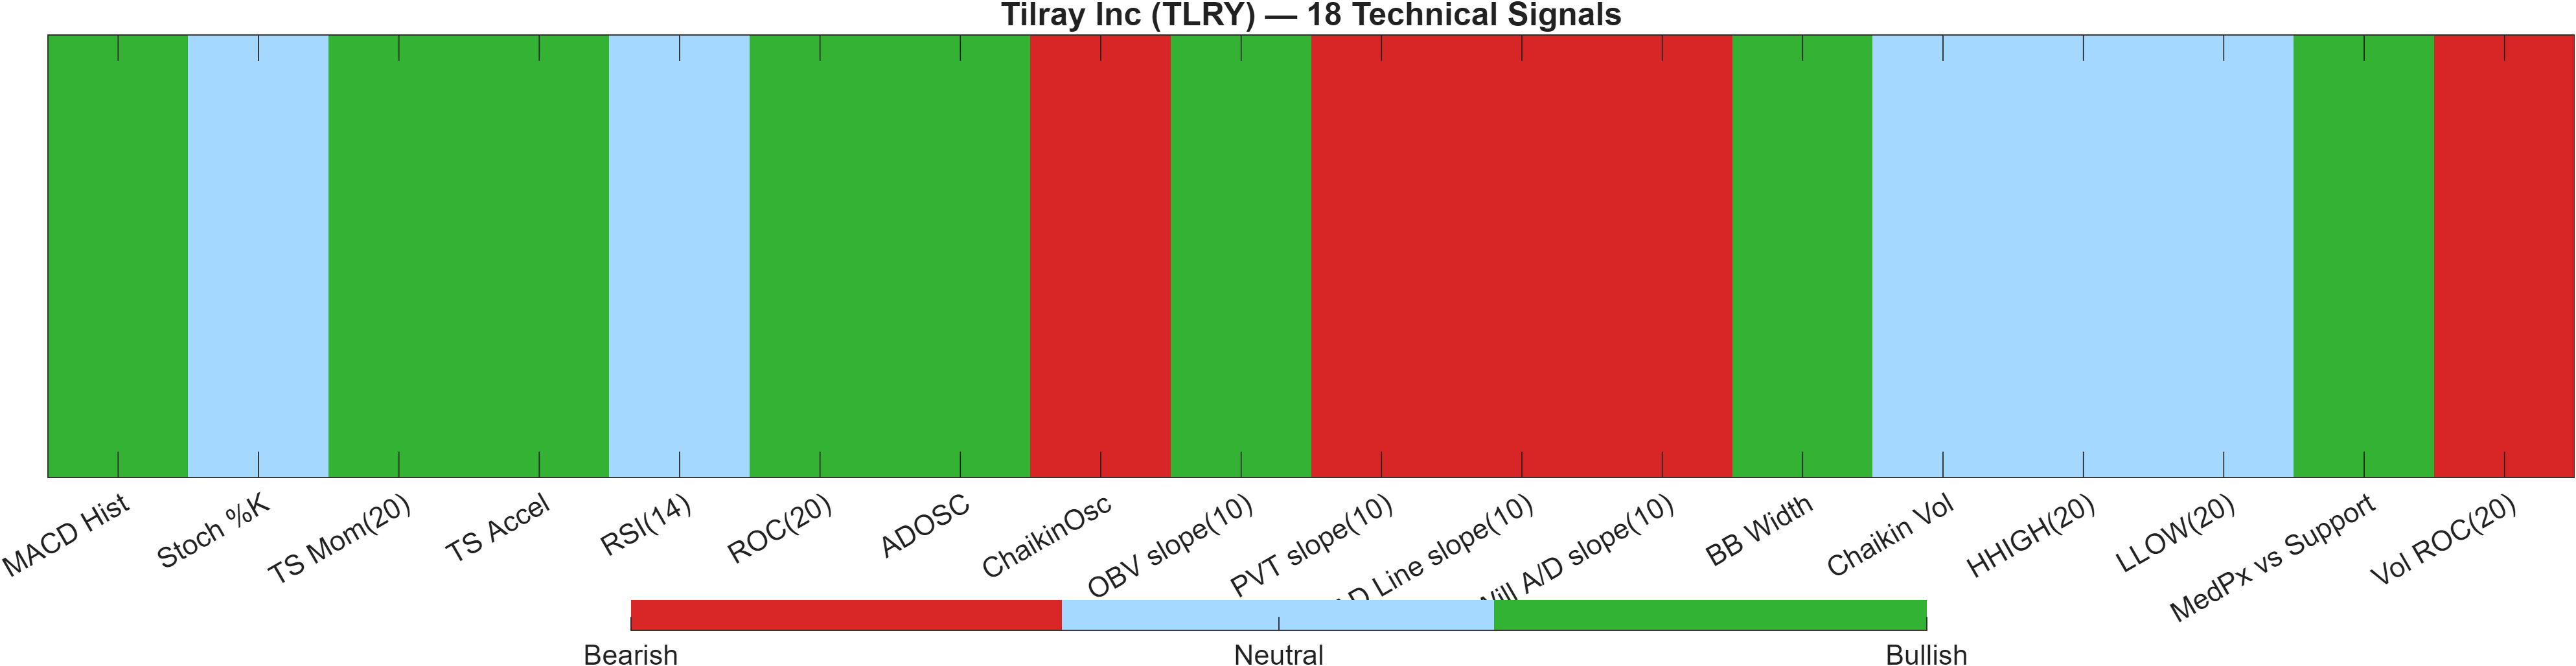
Signal table (Bull/Bear/Neutral)
| Indicator | Value | Signal |
|---|---|---|
| MACD Hist | 0.04885 | Bullish |
| Stoch %K | 24.29 | Neutral |
| TS Mom(20) | 0.05 | Bullish |
| TS Accel | 1.85 | Bullish |
| RSI(14) | 47.34 | Neutral |
| ROC(20) | 0.6702 | Bullish |
| ADOSC | 57.25 | Bullish |
| ChaikinOsc | -3251 | Bearish |
| OBV slope(10) | 4.27e+06 | Bullish |
| PVT slope(10) | -2.306e+04 | Bearish |
| AD Line slope(10) | -9.654e+05 | Bearish |
| Will A/D slope(10) | -0.025 | Bearish |
| BB Width | 0.08435 | Bullish |
| Chaikin Vol | -11.33 | Neutral |
| HHIGH(20) | 8.305 | Neutral |
| LLOW(20) | 6.965 | Neutral |
| MedPx vs Support | 0.1102 | Bullish |
| Vol ROC(20) | -14.67 | Bearish |
Interpretation: Indicator-level signals form the base confluence, which is then adjusted using a separate AI-driven technical ranking model. The final technical score summarizes this combined view.
The dashboard shows a Neutral aggregate despite bearish longer-horizon ranks, which is a classic “mixed-regime” signature. The 18-signal confluence score at 0.167 and the overall technical score at 0.157 both hold at Neutral, while the DRL technical rank sits at #898 out of 2073 (also Neutral). In other words, TLRY is not presenting as a strong technical leader, but it also is not flashing uniform breakdown signals across the 18-indicator stack.
Internally, the blend (Bull 8 / Bear 5 / Neutral 5) supports a “stabilization with friction” view: momentum and select price/volatility measures lean constructive (e.g., MACD histogram 0.04885 and BB Width 0.08435 marked Bullish), while several volume-flow and participation-related slopes are still negative (e.g., ChaikinOsc -3251, AD Line slope(10) -9.654e+05, Vol ROC(20) -14.67). That combination often implies rallies can occur, but they may struggle to sustain unless participation improves.
The key analytical tension is therefore signal alignment: a neutral technical blend can coexist with bearish ranks, but for ranks to meaningfully improve, the indicators that currently read bearish—especially those tied to volume-flow—typically need to stop contradicting price advances.
Badge view: Neutral 18-signal + DRL blend
6) News sentiment + extractive gist
Sentiment score (avg): 0.130 | Positive: 39% | Neutral: 54% | Negative: 7%
KGNAI AI News Sentiment Score (normalized -1 to +1): 0.99 (as of 2026-02-15) | Label: Bullish | Overall news score: 0.94
Positive Developments
Recent coverage across major financial outlets indicates a generally constructive tone around sector positioning and corporate initiatives, which is consistent with the 0.99 normalized news sentiment score (as of 2026-02-15). The underlying distribution remains mostly non-committal (39% positive, 54% neutral), but the positive slice emphasizes operational and strategic narratives rather than near-term price action. In that sense, the news layer can act as a contextual tailwind for short-term stabilization, particularly while momentum signals are not overtly bearish (MACD histogram 0.0488, RSI bias Neutral). Still, sentiment alone does not resolve the core technical constraint: trend alignment remains bearish versus MA50 and MA200, so constructive headlines tend to matter most when paired with level-based confirmation above 10.1240.
Neutral / Mixed Developments
The neutral majority (54%) reflects commentary that frames TLRY through valuation and volatility lenses rather than clear directional catalysts. This aligns with the report’s broader “range-and-verify” setup: volatility is relatively compressed (bandwidth 0.0844), while technical confluence stays Neutral (0.167) even as ranks are Bearish across horizons. Mixed narratives can keep attention elevated without providing a decisive impulse, which often translates into choppier trading around support/resistance. In this environment, the most informative updates are those that coincide with measurable changes in participation, since several volume-flow slopes inside the 18-signal stack still read bearish (e.g., ChaikinOsc -3251).
Negative / Risk Signals
Risk-oriented coverage highlights setbacks and ongoing uncertainty, which helps explain why the rank stack remains deeply bearish (daily #2017, weekly #2038) despite the bullishly labeled normalized sentiment score. The negative share (7%) is small, but it can have outsized impact when the chart is already trend-bearish (Close vs MA50 = Bearish; MA50 vs MA200 = Bearish). In addition, bearish participation readings inside the signal dashboard—such as PVT slope(10) -2.306e+04 and Vol ROC(20) -14.67—underscore the main technical risk: price may struggle to sustain upside attempts without stronger confirmation from volume. A close below 7.3173 would fit the report’s deterioration scenario and would likely amplify that risk framing.
- Whether sentiment remains elevated while price either approaches or rejects 10.1240.
- Any improvement in participation proxies that are currently bearish (e.g., Vol ROC(20) -14.67, PVT slope(10) -2.306e+04).
- Volatility shift away from compression (bandwidth 0.0844) during the next level test.
Sources referenced: Reuters, Bloomberg, Yahoo Finance, MarketWatch, Investing.com
Snapshot: AI Rank (Short–Mid–Long): Bearish (Bearish–Bearish–Bearish) · Technical Confluence: Neutral · Key Levels: Support ~7.32 | Resistance ~10.12 · News Sentiment: Neutral
7) Sources
Not available in the provided data.
You may also like: How KGNAI AI ranks instruments across global markets
Disclaimer: KGNAI provides AI-generated analytics and educational market commentary only. This is not financial advice. Markets involve risk. Always do your own research.