
XP Inc (XP) — 25-Feb-2026 Technical Strength vs Bearish Cross-Horizon Ranks (Cautionary Stance)
KGNAI Signal + Technical Snapshot + News Sentiment Digest
As of: 25-Feb-2026
Ticker: XP
XP Inc (XP) presents a split profile: technical indicators skew constructive, while the multi-horizon KGNAI rank structure remains predominantly bearish across most timeframes. In the current read, that divergence is the central risk-management feature—tactical momentum signals (RSI and MACD) can stay supportive even as broader cross-sectional positioning stays weak. The immediate technical narrative is helped by moving-average alignment and a positive MACD histogram, but the rank picture implies the setup may be less robust when compared against the broader universe of 2067 instruments. Volatility context is also relevant: Bollinger Bandwidth is not signaling an extreme squeeze, so price may have room to move, but without a clear probabilistic edge from ranks. News sentiment is mildly positive on the surface and heavily neutral in composition, which can reinforce drift higher while offering limited shock-absorption if price loses key levels.
- Rank stance: Short Bearish | Mid Bearish | Long Bearish
- Technical confluence: Bullish (overall blended technical score 0.530; 12 bull / 3 bear / 3 neutral)
- Key levels: Support ~ 16.2750 | Resistance ~ 22.0275
- News sentiment bias: Bullish score 0.99, but distribution is 74% neutral (avg sentiment 0.125)
- Confirmation / invalidation: A volume-backed break above 22.0275 supports continuation bias; a close below 16.2750 increases deterioration risk.
KGNAI evaluates assets using large cross-sectional datasets built from millions of structured data points. Inputs incorporate fundamental metrics, technical structures, and systematically processed news sentiment. Statistical models, machine learning, and AI frameworks are used to assess relative positioning, signal alignment, and probabilistic behavior across broad universes.
- Ranks are comparative across the tracked universe, not absolute price targets.
- Confluence reflects alignment among independent signal groups.
- Support/resistance levels are probabilistic decision zones, not guarantees.
- Sentiment provides contextual bias within the broader analytical framework.
1) KGNAI AI Analysis
Region: USA
Total universe size: 2067 ranked instruments
- Daily rank: #1698 out of 2067 — Bearish
- Weekly rank: #384 out of 2067 — Bullish
- Monthly rank: #1834 out of 2067 — Bearish
- 3-Monthly rank: #1877 out of 2067 — Bearish
- 6-Monthly rank: #1785 out of 2067 — Bearish
- Yearly rank: Not available for this horizon — Not available
Cross-horizon alignment: a mostly bearish structure with a weekly exception
XP’s rank stack is not uniformly aligned. The weekly rank (#384) sits in a stronger relative bucket versus the rest of the curve, while the daily (#1698) and the medium-to-long horizons (#1834, #1877, #1785) indicate weaker cross-sectional positioning. In practical terms, the data is consistent with a market that can trade constructively in bursts (weekly improvement) but struggles to maintain favorable relative behavior when evaluated across longer windows.
That shape matters because it often corresponds to a tactical rebound occurring inside a broader weak regime. When the daily rank is high (weaker) while the weekly rank is relatively strong, the setup can become sensitive to near-term flow and headline drift—price can hold up if momentum persists, but the probability-weighted base case does not fully “reset” unless the monthly and 3–6 month ranks improve.
KGNAI’s stated term view remains Bearish across short-, mid-, and long-term, which should be treated as a portfolio-construction constraint rather than a timing tool. Also note: the Yearly rank is not available in the provided data, which limits inference about full-cycle persistence beyond the 6-month window.
2) Price & trend overview
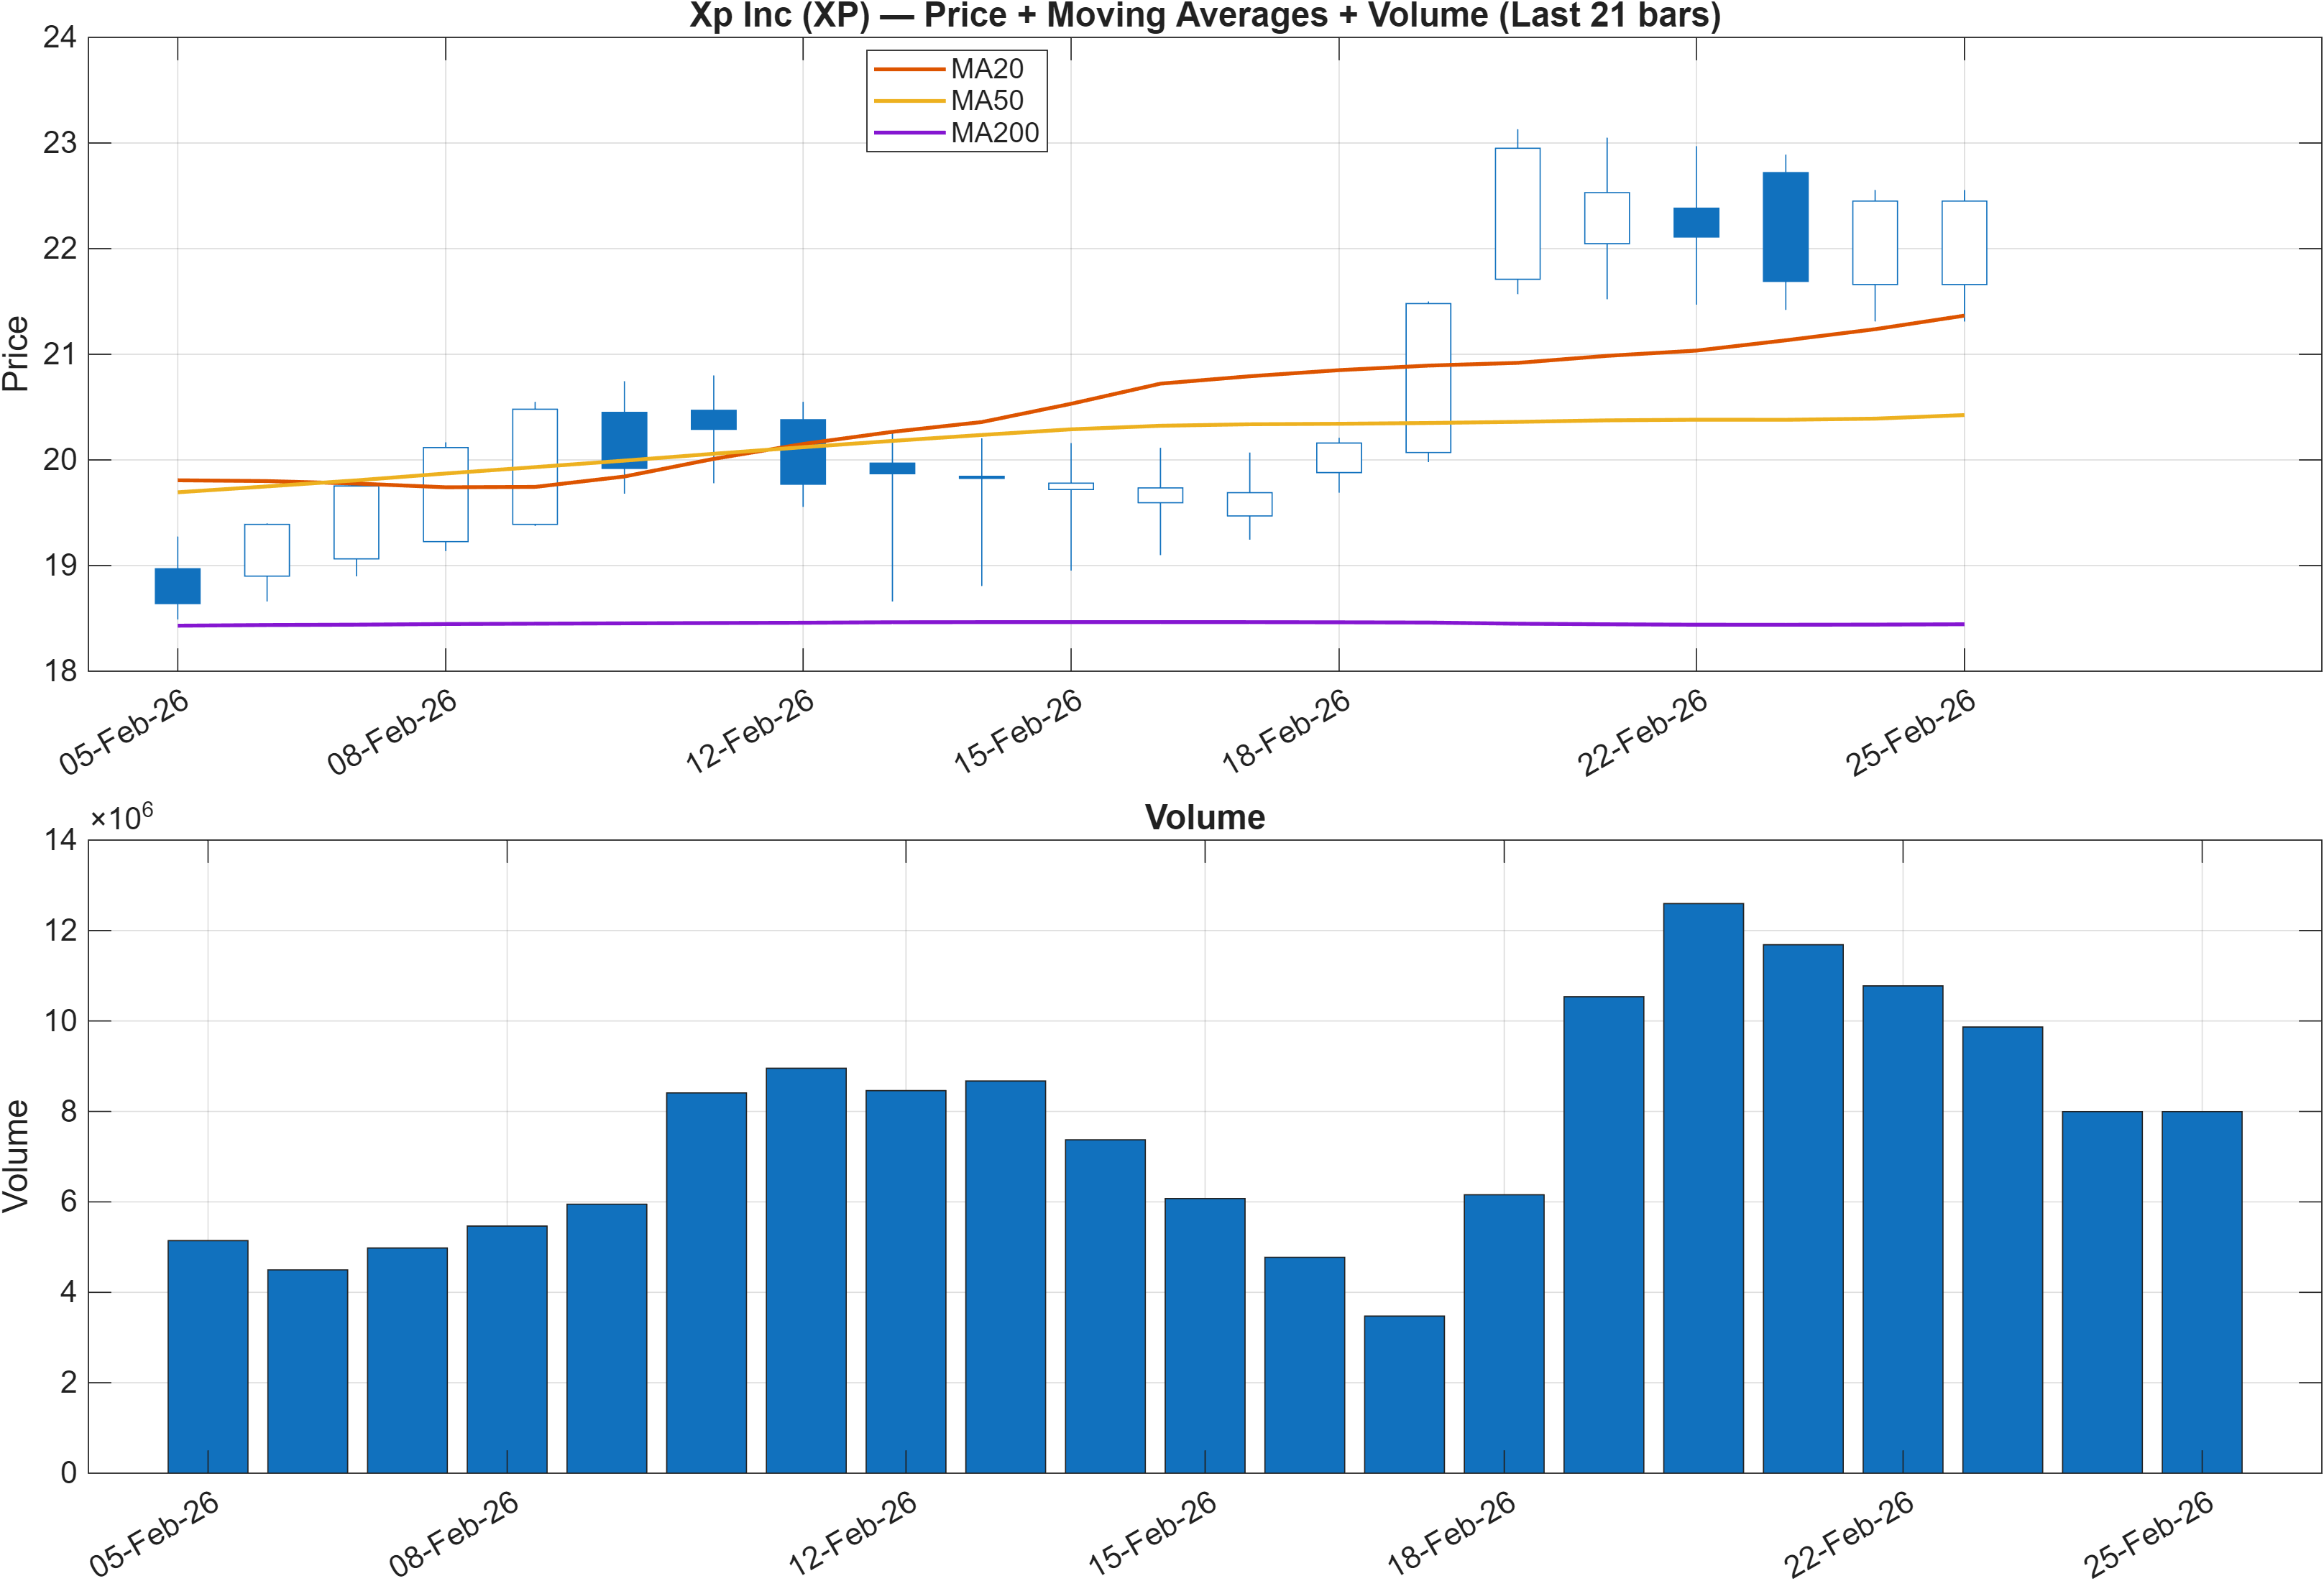
Interpretation: Close vs MA50 = Bullish, MA50 vs MA200 = Bullish.
Trend posture: constructive moving-average geometry, but rank regime remains a headwind
The trend overlay flags a constructive structure: price is above the MA50 and the MA50 is above the MA200. That combination typically reflects a trend that has already transitioned from repair into a more stable uptrend phase. It also supports why several momentum and rate-of-change signals in the technical dashboard read bullish.
The tension is that trend geometry can remain positive while cross-sectional ranks stay weak. Here, the daily and monthly ranks (e.g., #1698 and #1834) imply XP’s trend may be less efficient versus peers—meaning the same “bullish” chart pattern can carry higher reversal sensitivity if participation fades.
Volume is the main arbiter for whether the moving-average setup is self-reinforcing. This is consistent with the broader framework emphasis on participation-backed moves: the scenario language later in the report explicitly conditions continuation on breaks with volume. If the trend remains intact but fails to attract follow-through, price can remain above moving averages while the relative-rank profile continues to lag.
3) Momentum & volatility dashboard
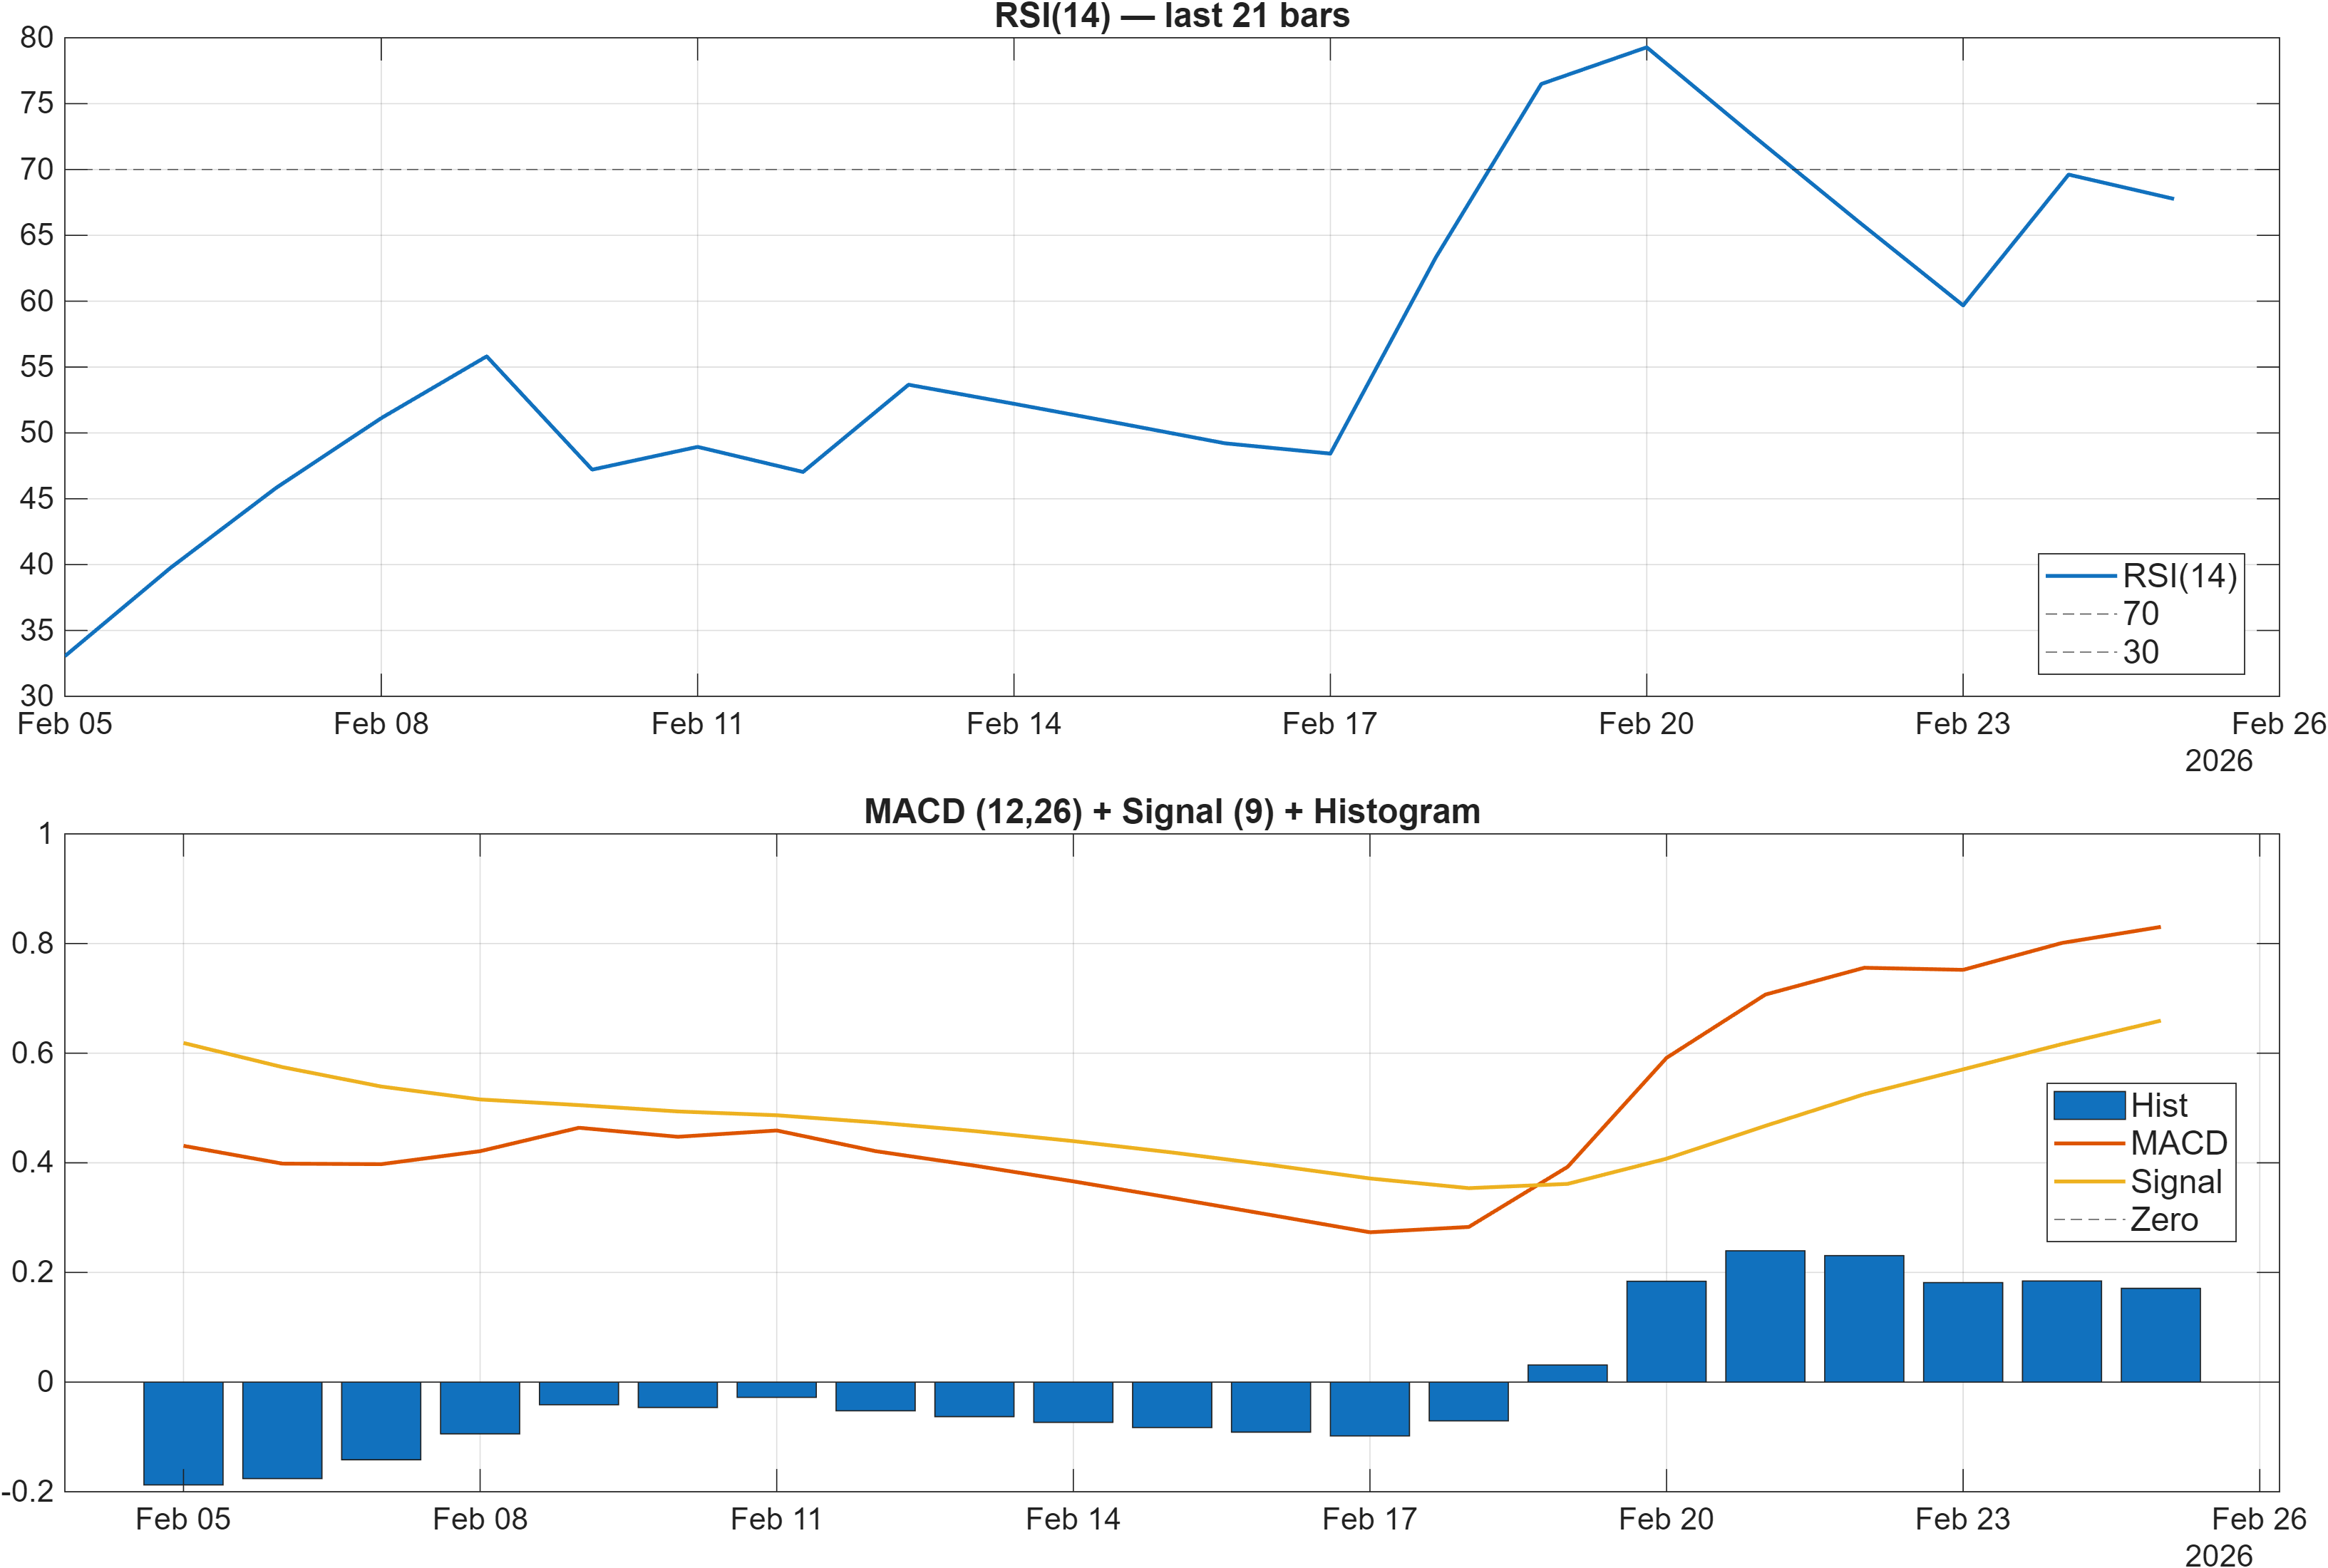
Interpretation: RSI bias = Bullish, MACD hist = 0.1710.
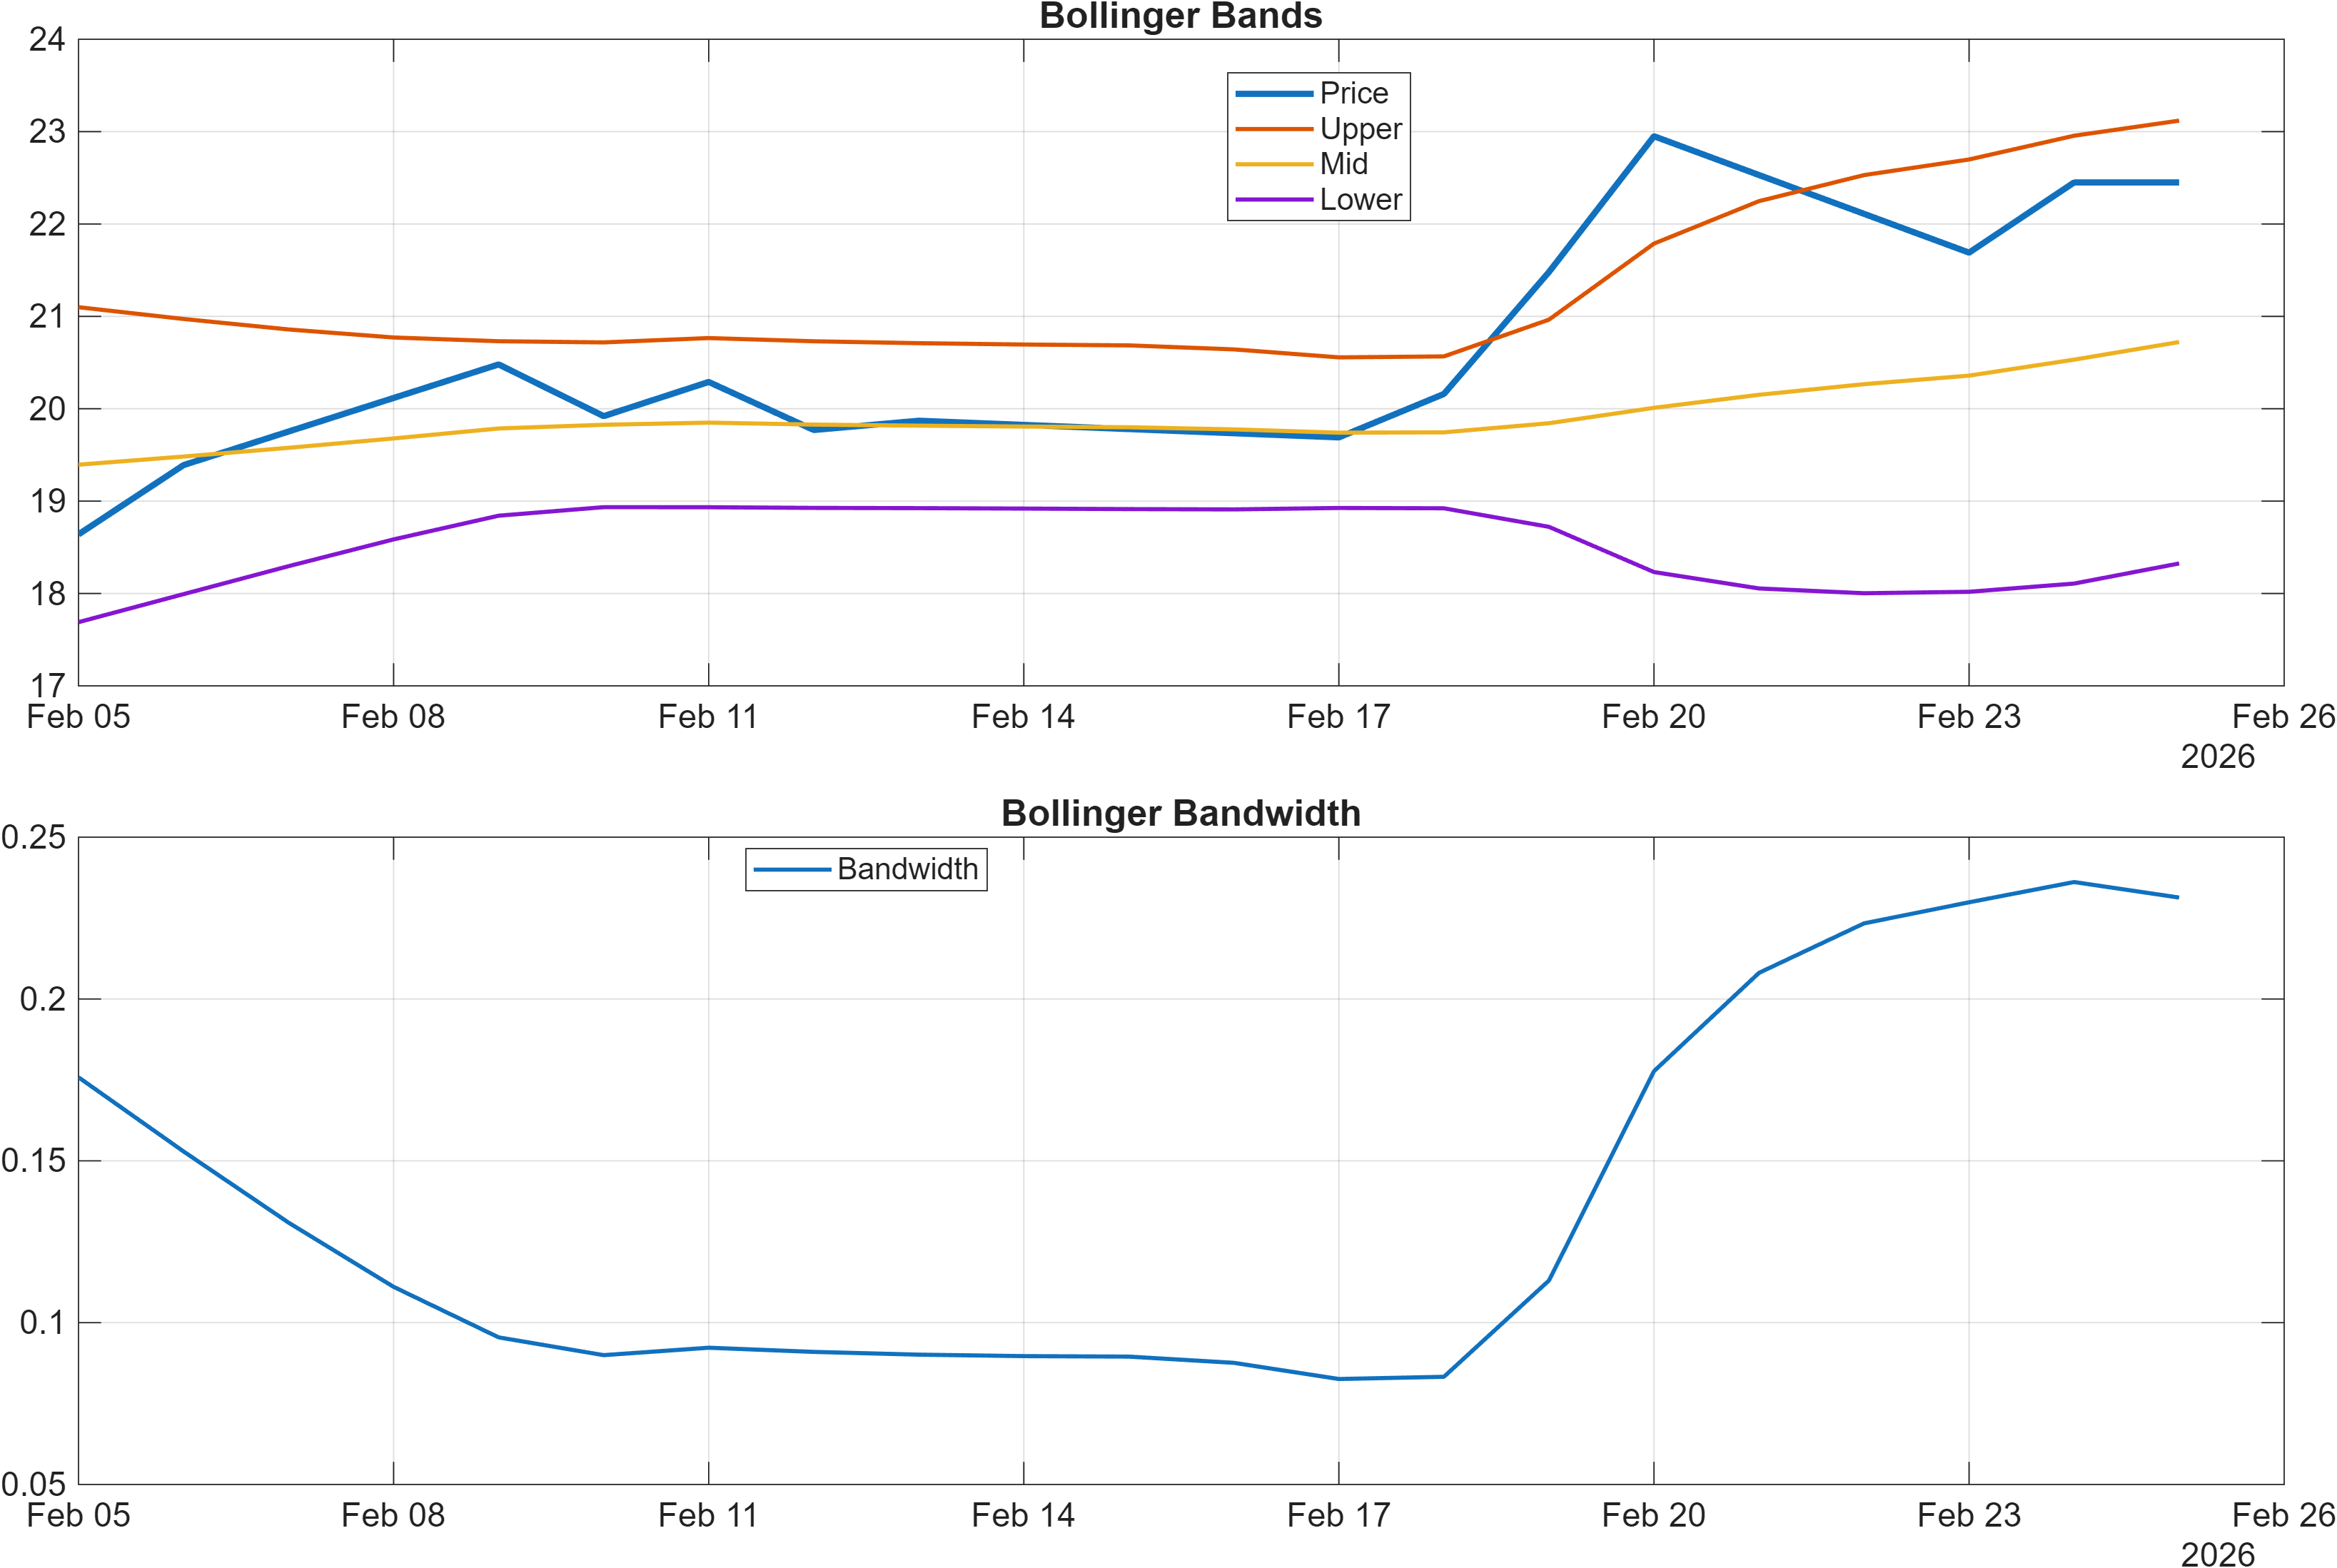
Interpretation: Bandwidth (volatility regime) latest = 0.2313.
Momentum vs exhaustion: bullish impulse with localized overbought pressure
Momentum reads supportive overall. The MACD histogram at 0.1710 indicates positive impulse remains in place, aligning with the broader “RSI bias = Bullish” designation. In the signal table, RSI(14) at 67.76 reinforces that price strength is still dominant rather than mean-reverting.
The more cautionary nuance is in oscillator heat: Stoch %K at 83.13 is flagged bearish, a typical sign of late-stage acceleration where incremental upside can become harder to sustain without fresh catalysts. This is not inherently a reversal call; it is a timing friction indicator—often showing that upside continuation may require consolidation rather than immediate extension.
Volatility regime: bandwidth suggests neither extreme compression nor blow-off
With Bollinger Bandwidth at 0.2313, volatility does not appear in a hyper-compressed squeeze state, nor does it signal an extreme expansion event by itself. That middle regime often allows trends to persist, but it also means breaks of key zones (support/resistance) can occur without the “pressure release” dynamics that sometimes add follow-through. For XP, this supports a framework where level behavior (near 16.2750 and 22.0275) matters more than expecting volatility alone to do the work.
4) Support / Resistance zones
Support ~ 16.2750 | Resistance ~ 22.0275
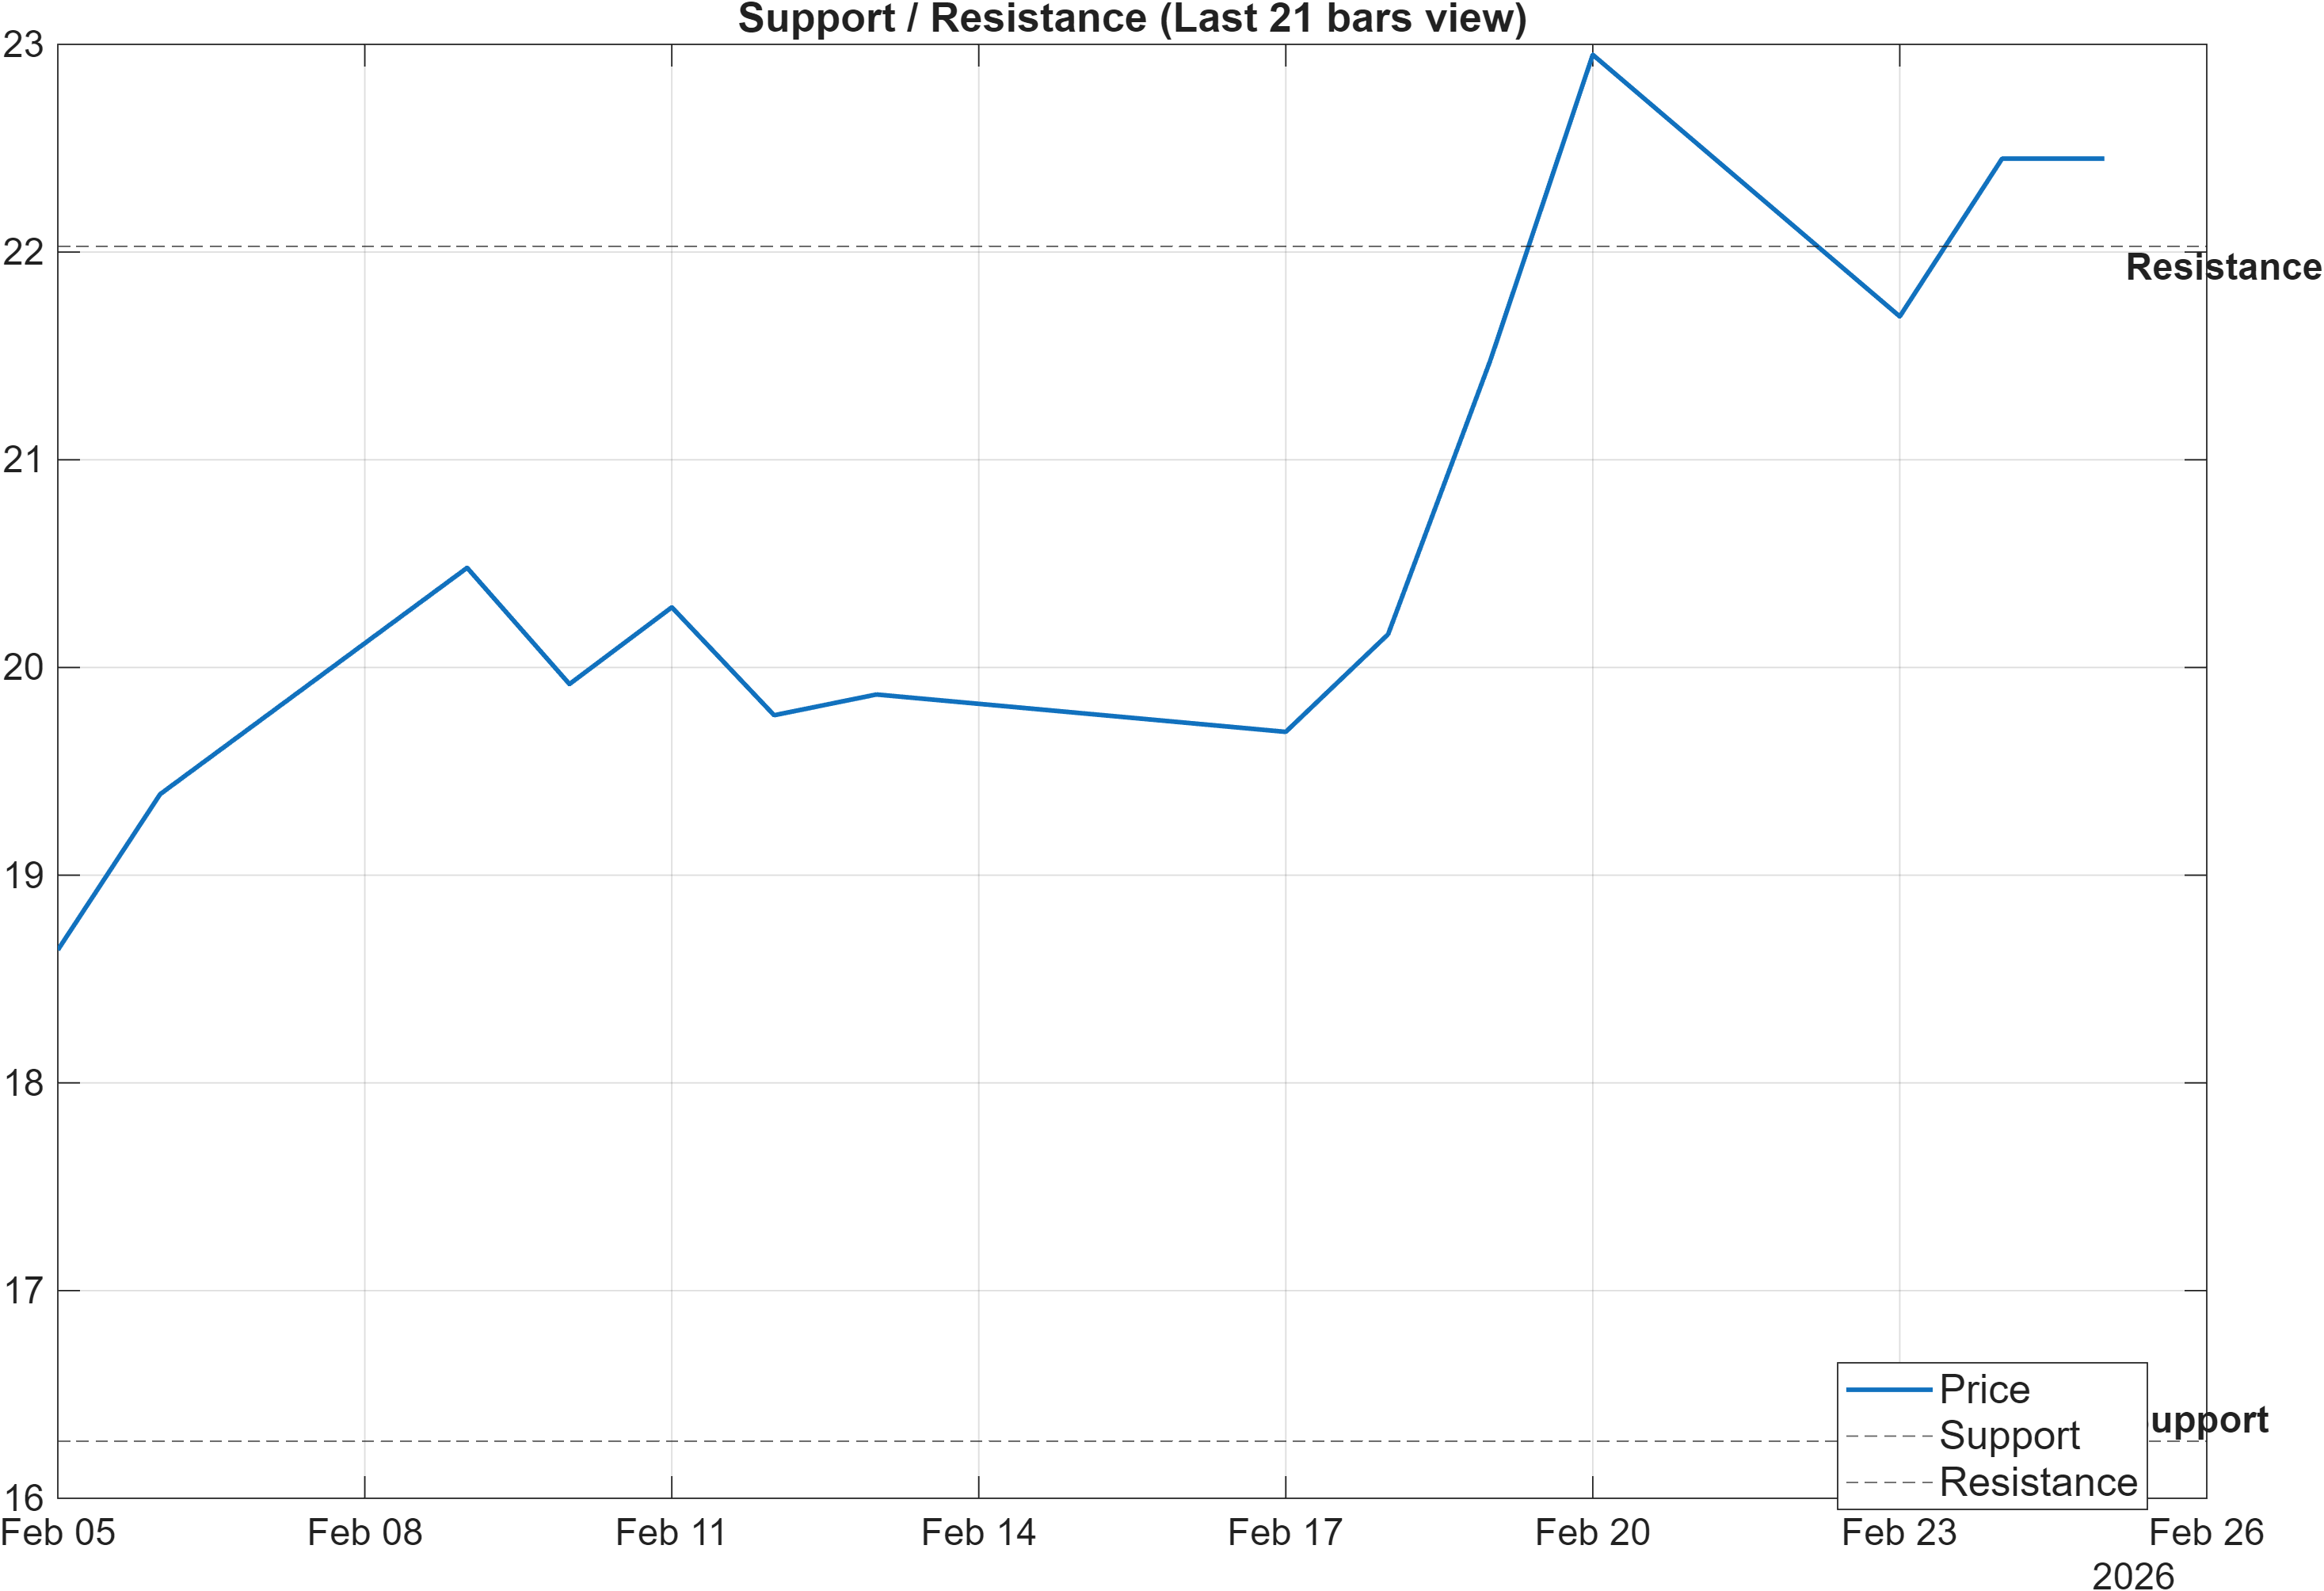
Scenario view: Break above resistance with volume → continuation. Close below support → signal deterioration risk.
Decision zones: mapping continuation vs deterioration without overfitting
The support and resistance pair—16.2750 and 22.0275—frames the risk boundary for the current trend/momentum configuration. With moving averages bullish and MACD positive, the market’s default behavior can remain constructive, but the rank curve suggests that failed breakouts should be treated seriously because they can revert quickly into relative weakness.
The scenario guidance is explicit: a break above 22.0275 with volume is the continuation condition. That phrasing places emphasis on participation, consistent with the dashboard’s mix of volume/flow signals. Conversely, a close below 16.2750 is framed as deterioration risk—an important distinction from an intraday breach. In practice, closing behavior matters because it reduces the probability that the move is simply a volatility probe.
A useful way to reconcile the technical bullishness with bearish ranks is to treat resistance as the validation level for trend durability and support as the invalidation level for the tactical bullish thesis. Given the neutral-to-moderate volatility regime (bandwidth 0.2313), level reactions may be cleaner than expecting large, single-session dislocations.
5) Quant Technical Dashboard (18 Signals)
KGNAI AI Technical Analysis Score (Deep Reinforcement Learning): Rank #415 out of 2067 (Rank 1 represents the strongest technical positioning and a higher probability of favorable price behavior. As ranks increase toward the maximum, the probability of favorable outcomes weakens and bearish positioning becomes more dominant.) | Label: Neutral | Score: 0.598
18-Signal Technical Confluence Score: 0.500 (Bullish)
Overall Technical Score (18-signal confluence + DRL rank blend): 0.530 (Bullish)
Note: The blended score reflects signal strength weighted against broader AI technical ranking, which may temporarily diverge.
Blended technical score breakdown: 0.530 (Bullish | Bull 12 / Bear 3 / Neutral 3)
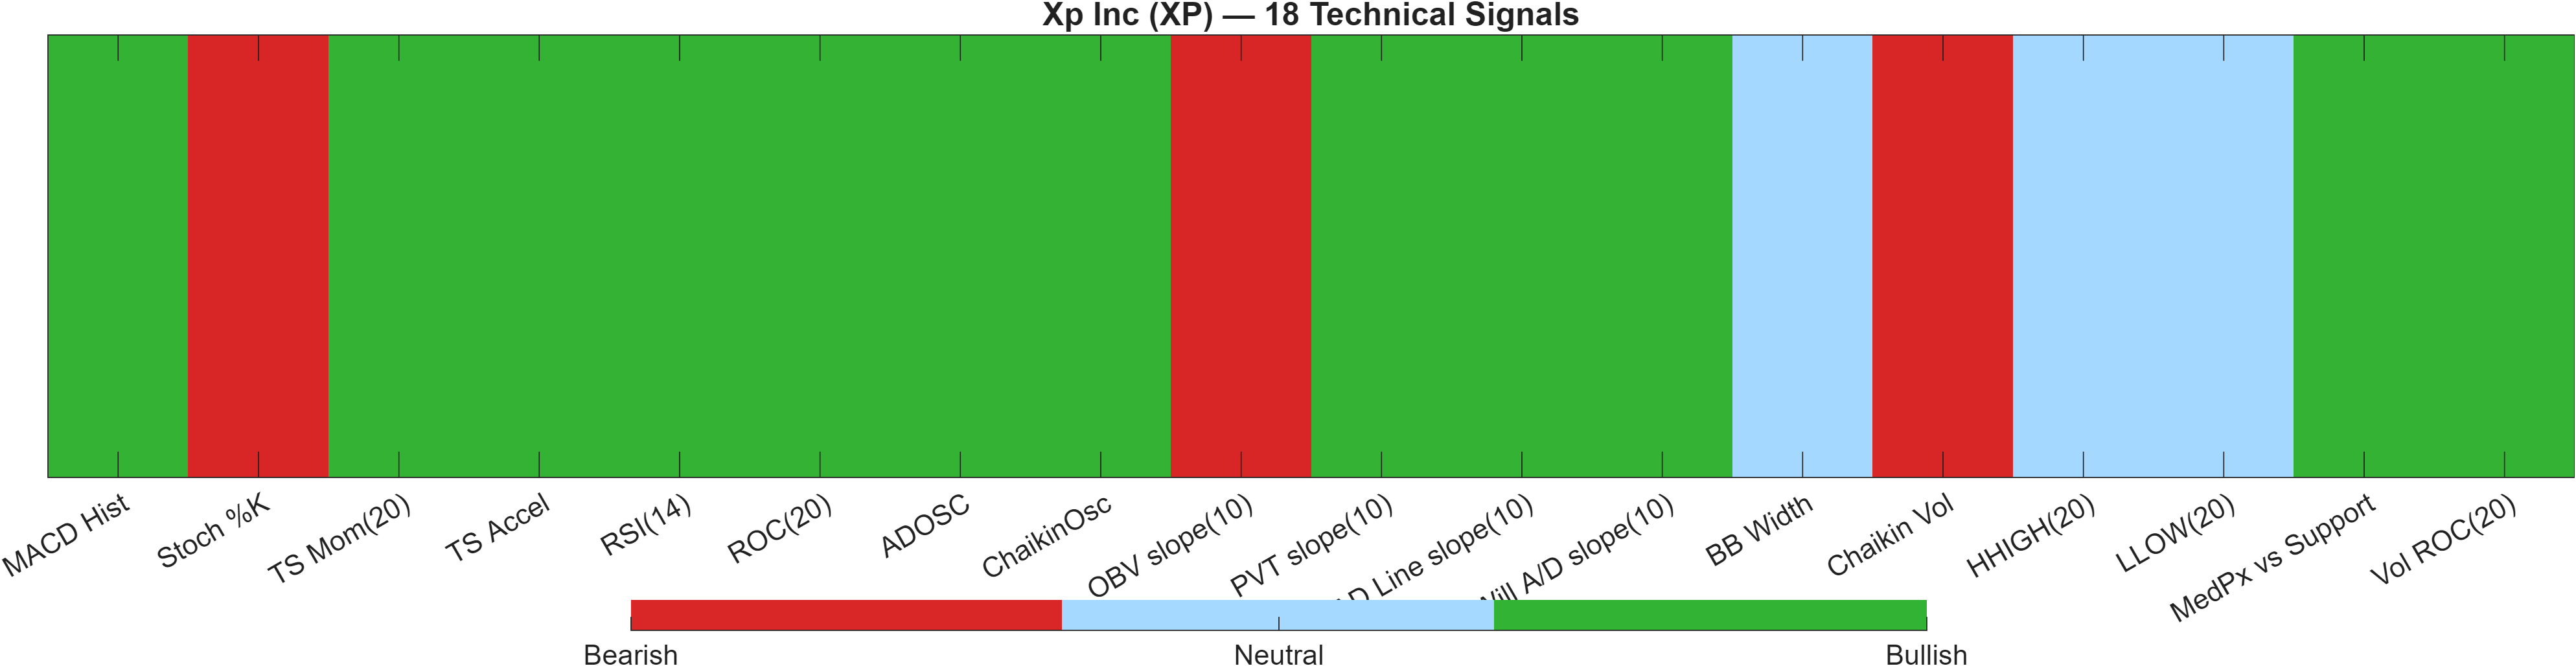
Confluence vs model rank: why a bullish score can coexist with a neutral DRL label
XP’s technical picture is favorable on the surface: the 18-signal confluence score is 0.500 (Bullish) and the overall blended technical score is 0.530 (Bullish), supported by a 12/3/3 Bull/Bear/Neutral split. However, the Deep Reinforcement Learning model assigns a Neutral label despite a score of 0.598 and a rank of #415 out of 2067. This is a classic “signal agreement with model restraint” configuration.
The most actionable interpretation is that the indicator stack is currently supportive, but the AI rank layer is not confirming an unusually strong technical edge relative to the universe. That can happen when momentum is present but partially mature, or when participation/volatility metrics introduce uncertainty around follow-through.
Internal signal frictions: oscillator heat vs participation mix
The bullish impulse is evident in MACD Hist (0.171) and in price-strength measures like ROC(20) at 15.78. At the same time, the dashboard flags localized friction: Stoch %K (83.13) is bearish and OBV slope(10) is negative (-3.293e+06). That combination can reflect a market that is rising, but where the “quality” of accumulation is uneven across volume-derived lenses. With BB Width (0.2313) neutral, the setup is not being forced by volatility; it is more dependent on sustained participation and clean level breaks.
Signal table (Bull/Bear/Neutral)
| Indicator | Value | Signal |
|---|---|---|
| MACD Hist | 0.171 | Bullish |
| Stoch %K | 83.13 | Bearish |
| TS Mom(20) | 3.06 | Bullish |
| TS Accel | 1.53 | Bullish |
| RSI(14) | 67.76 | Bullish |
| ROC(20) | 15.78 | Bullish |
| ADOSC | 81.73 | Bullish |
| ChaikinOsc | 1.005e+07 | Bullish |
| OBV slope(10) | -3.293e+06 | Bearish |
| PVT slope(10) | 1.358e+06 | Bullish |
| AD Line slope(10) | 3.561e+07 | Bullish |
| Will A/D slope(10) | 1.24 | Bullish |
| BB Width | 0.2313 | Neutral |
| Chaikin Vol | 13.78 | Bearish |
| HHIGH(20) | 23.13 | Neutral |
| LLOW(20) | 18.66 | Neutral |
| MedPx vs Support | 5.657 | Bullish |
| Vol ROC(20) | 77.84 | Bullish |
Interpretation: Indicator-level signals form the base confluence, which is then adjusted using a separate AI-driven technical ranking model. The final technical score summarizes this combined view.
6) News sentiment + extractive gist
Sentiment score (avg): 0.125 | Positive: 26% | Neutral: 74% | Negative: 0%
KGNAI AI News Sentiment Score (normalized -1 to +1): 0.99 (as of 2026-02-24) | Label: Bullish | Overall news score: 0.98
Positive Developments
Recent coverage across major financial outlets indicates a generally constructive tone around XP, with attention on analyst positioning and valuation framing. The sentiment mix shows 26% positive and 0% negative items, which helps explain why the normalized score prints as 0.99 despite the average sentiment being only 0.125. In other words, the information flow skews more “not negative” than decisively upbeat, which can still be supportive when price is already trending above key moving averages. The market implication is incremental: positive commentary can provide short bursts of interest that help maintain momentum (consistent with a bullish RSI bias and positive MACD histogram), but it may not be sufficient by itself to overcome a weak cross-horizon rank structure unless it translates into measurable participation and clean technical follow-through.
Neutral / Mixed Developments
The dominant feature of the news distribution is neutrality: 74% neutral items. That typically corresponds to recap-style coverage, valuation discussion, and “watch list” type narratives rather than catalyst-driven repricing. This aligns with the idea of a market in a trend continuation attempt rather than a step-change regime. Neutral-heavy flows can still support price stability by reducing headline-driven volatility, which is consistent with a Bollinger Bandwidth reading that does not suggest an extreme regime. The trade-off is that neutrality can also limit urgency; without a strong catalyst, price often becomes more sensitive to technical levels (support/resistance) and to whether momentum indicators begin to roll over from elevated states.
Negative / Risk Signals
Although the dataset reports 0% negative items, “risk” in this context is better captured as signal fragility rather than overtly adverse headlines. When the news feed is largely neutral and the short- and medium-horizon ranks remain weak (e.g., daily #1698, monthly #1834), the market can be vulnerable to disappointment from routine disclosures, commentary, or shifts in investor positioning—even if the tone is not explicitly negative. From a risk-control standpoint, the more relevant trigger is technical: a loss of key support (16.2750) would matter more than the absence of negative headlines, because it would indicate the current momentum-driven bid is no longer defending the prevailing structure.
- Whether price can sustain acceptance above 22.0275 with participation consistent with continuation.
- Any shift in the neutral-heavy mix (74%) toward more directional sentiment that could expand volatility.
- Momentum cooling signals (e.g., elevated oscillator conditions) while ranks remain weak on monthly/3–6 month horizons.
Sources referenced: Reuters, Bloomberg, Yahoo Finance, MarketWatch, Investing.com
7) Sources
Source links are provided in the original draft. Per publication format, this section is maintained as a compact reference area without reproducing headline lists in the body.
You may also like: How KGNAI AI ranks instruments across global markets
Disclaimer: KGNAI provides AI-generated analytics and educational market commentary only. This is not financial advice. Markets involve risk. Always do your own research.