
GOOG — Alphabet Inc Class C Technical & Sentiment Overview (15-May-2026) | Neutral Ranks, Bullish Technical Confluence
Alphabet Inc Class C (GOOG) is currently characterized by mixed cross-horizon ranking pressure alongside a constructive technical signal stack. As of 15-May-2026, KGNAI’s universe ranking places GOOG near the middle of the 2053-instrument set on the daily lens, improves on the weekly horizon, and weakens materially on the 3-month horizon. In contrast, the technical composite remains Bullish, driven by a favorable moving-average structure and a majority of bullish indicator flags across momentum and accumulation metrics. Volatility conditions appear contained rather than expanding, with Bollinger Bandwidth at 0.1916, which can reduce follow-through reliability unless confirmed by volume and price acceptance. News sentiment is modestly positive on a normalized basis, with an average sentiment score of 0.070 and a KGNAI news sentiment score of 0.44, indicating a supportive bias but not an extreme one. The key analytical question is whether price can convert constructive technical confluence into persistence without violating the defined decision zones.
- Short / Mid / Long stance (KGNAI ranks): Neutral / Bearish / Neutral (Mixed)
- Technical confluence label: Bullish (18-signal + DRL blend)
- Key levels: Support ~ 283.2100 | Resistance ~ 396.7017
- News sentiment bias: Slightly constructive (score avg 0.070; normalized score 0.44)
- Confirmation / invalidation condition: Acceptance above 396.7017 with volume supports continuation conditions; a close below 283.2100 elevates deterioration risk.
KGNAI evaluates assets using large cross-sectional datasets built from millions of structured data points. Inputs incorporate fundamental metrics, technical structures, and systematically processed news sentiment. Statistical models, machine learning, and AI frameworks are used to assess relative positioning, signal alignment, and probabilistic behavior across broad universes.
- Ranks are comparative across the tracked universe, not absolute price targets.
- Confluence reflects alignment among independent signal groups.
- Support/resistance levels are probabilistic decision zones, not guarantees.
- Sentiment provides contextual bias within the broader analytical framework.
1) KGNAI AI Analysis
Region: USA
Total universe size: 2053 ranked instruments
- Daily rank: #1040 out of 2053 — Neutral
- Weekly rank: #633 out of 2053 — Neutral
- Monthly rank: #1441 out of 2053 — Neutral
- 3-Monthly rank: #1724 out of 2053 — Bearish
- 6-Monthly rank: #1594 out of 2053 — Neutral
- Yearly rank: #1492 out of 2053 — Neutral
GOOG’s rank profile points to a non-uniform regime across horizons. The daily placement at #1040 sits close to the universe midpoint, consistent with a market state that is not strongly skewed toward either persistent strength or broad deterioration. The weekly rank at #633 improves into a firmer middle band, suggesting shorter-cycle conditions have been comparatively steadier than the multi-month picture.
The key divergence emerges on the intermediate horizon: the 3-month rank at #1724 signals comparatively weak positioning versus peers, even while longer windows (6-month #1594 and yearly #1492) remain labeled Neutral. This pattern often corresponds to an instrument that has recently lagged its universe but may not be in a structurally persistent down regime, particularly if technical conditions are improving concurrently.
KGNAI’s stated term view—Short-term Neutral, Mid-term Bearish, Long-term Neutral—should be read as a cross-sectional probability posture, not as a directional forecast. The analytical emphasis is on whether improving technical confluence (discussed below) can translate into rank repair, especially from the weaker 3-month placement, without a breakdown through defined support. If multi-horizon ranks remain dispersed, traders often see more mean-reversion behavior and less clean trend persistence.
KGNAI ranks each instrument across large universes using multiple proprietary AI tests and statistical models (millions of data points). Lower ranks generally indicate stronger probability of favorable performance behavior, while higher ranks indicate weaker probability and more bearish positioning.
Term view: Short-term: Neutral. Mid-term: Bearish. Long-term: Neutral.
Want the full universe and complete rank tables? Unlock full access on KGNAI: https://www.kgnai.com/pricing
2) Price & trend overview
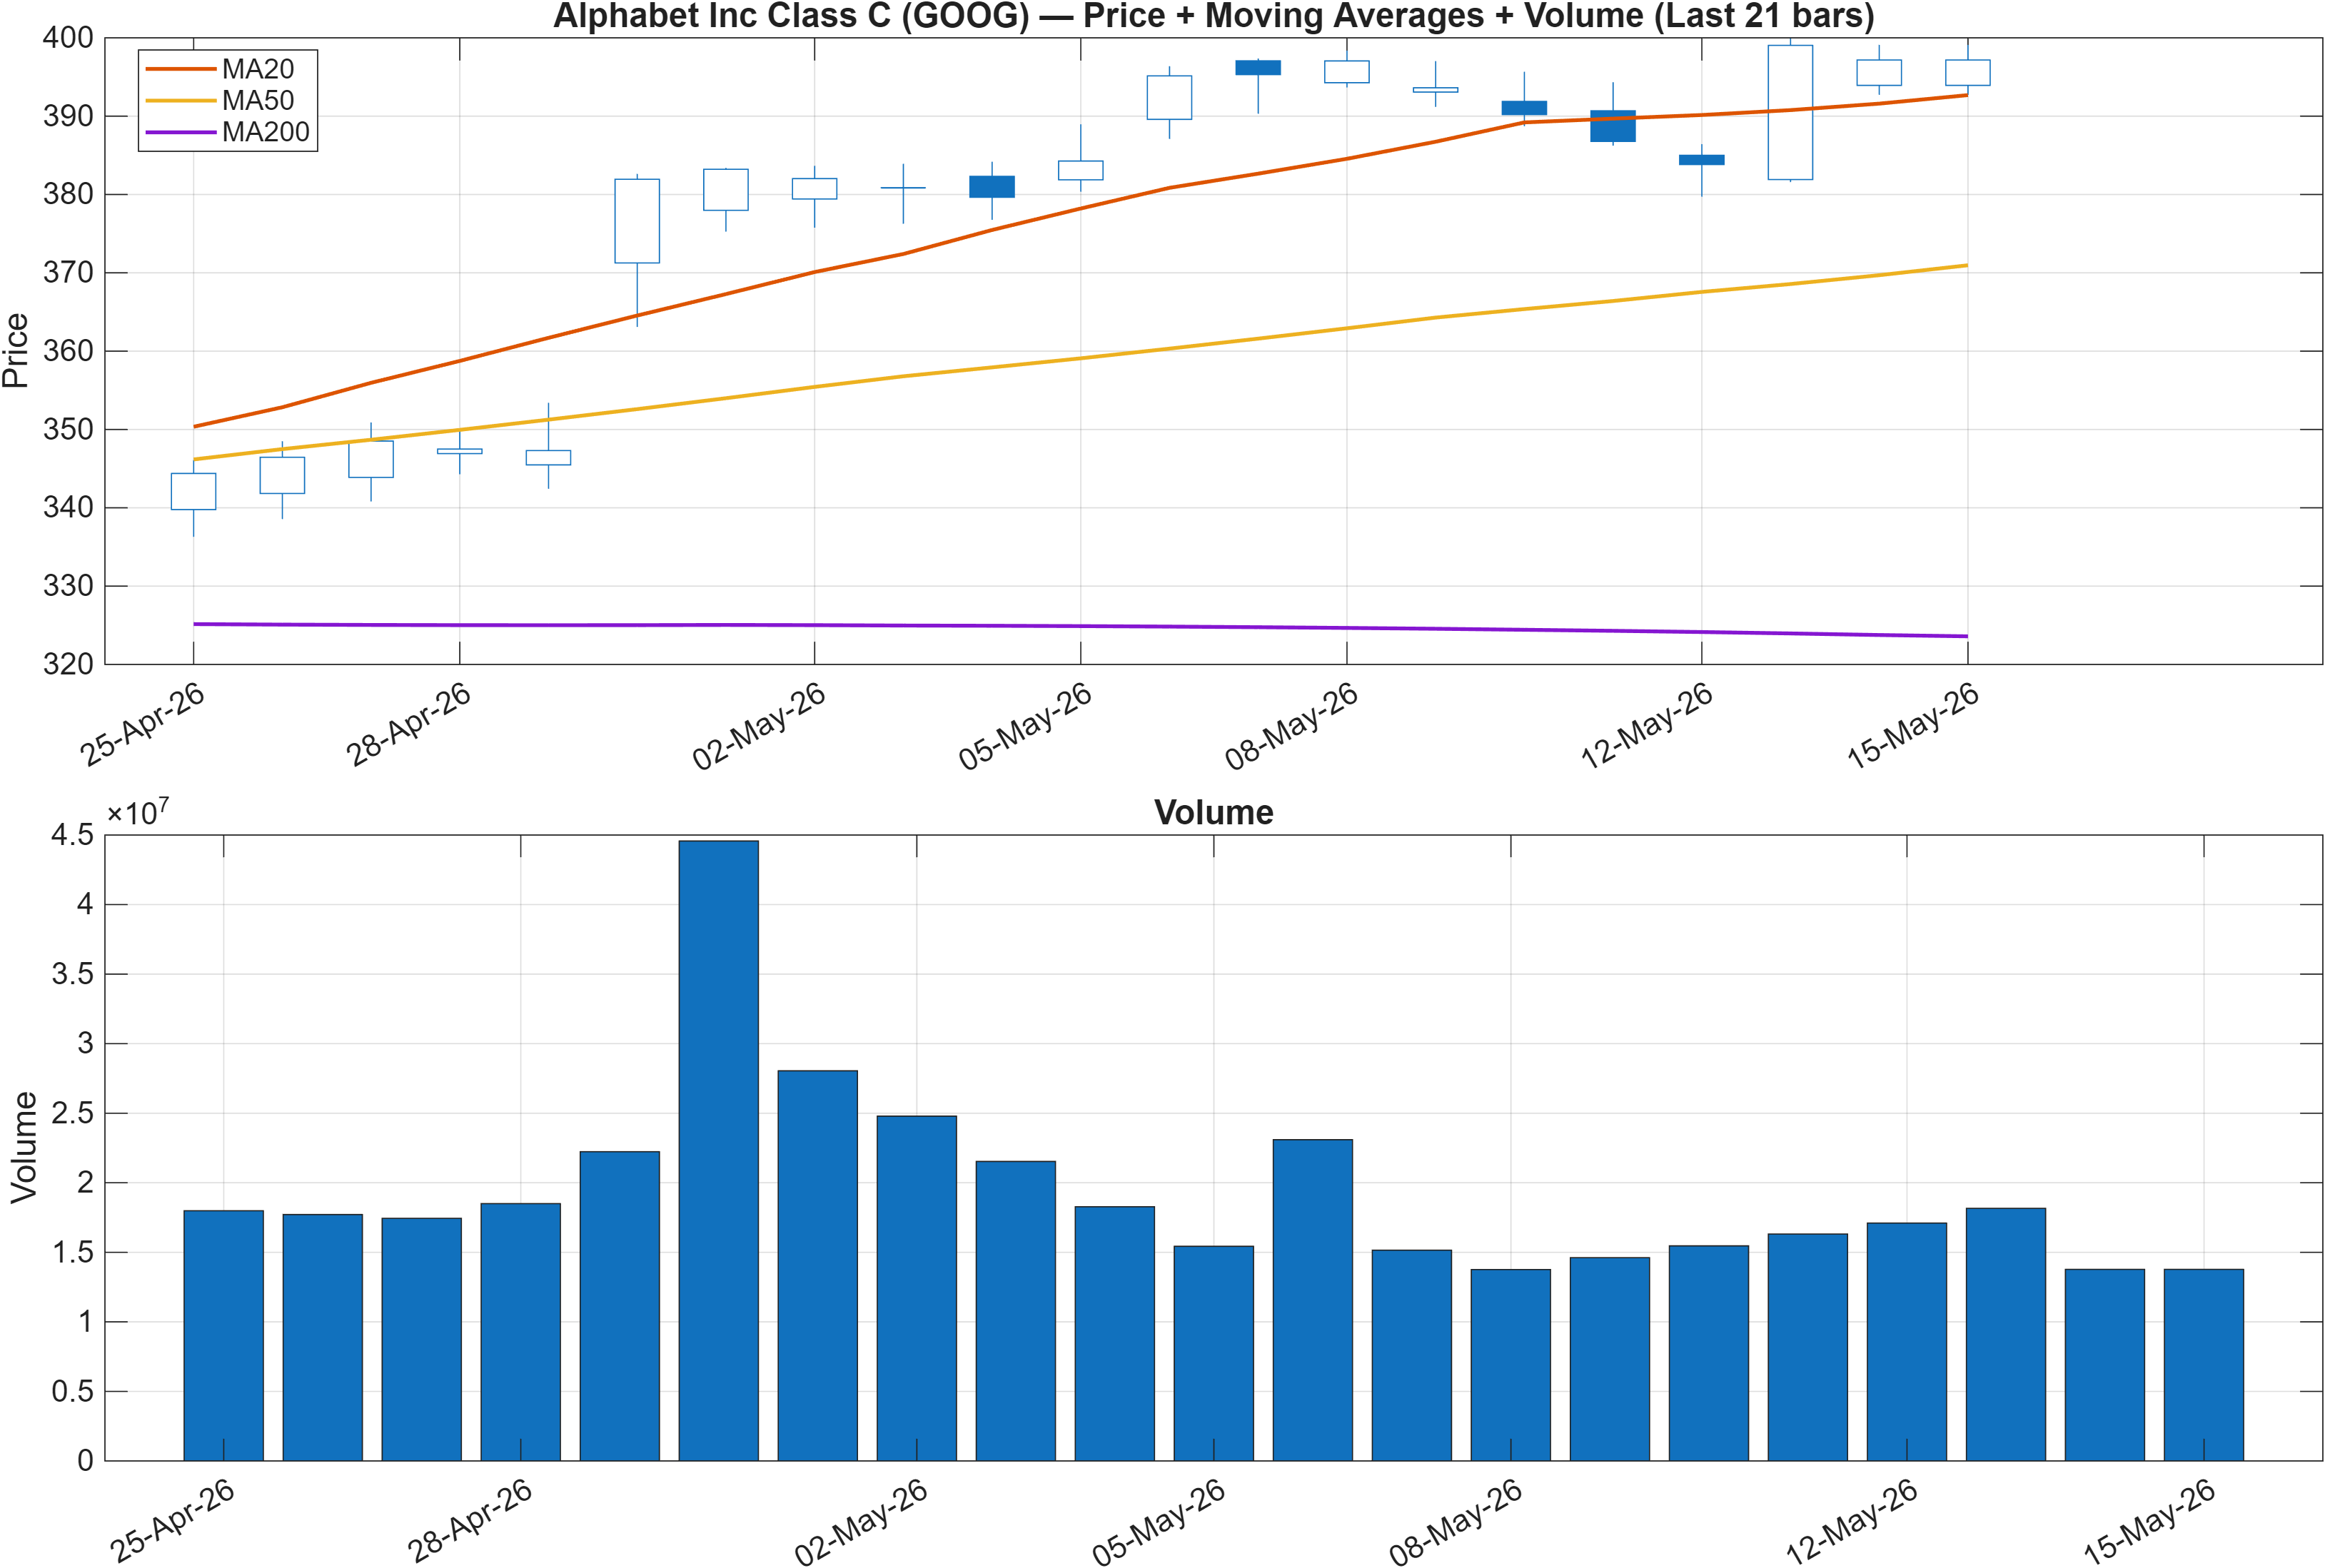
Interpretation: Close vs MA50 = Bullish, MA50 vs MA200 = Bullish.
Trend structure vs rank regime
The trend framework is constructive on classic moving-average definitions: price relative to MA50 is Bullish, and MA50 relative to MA200 is also Bullish. That combination typically describes an upward-biased structure or at least a market that has been able to hold above intermediate trend support while maintaining longer-run slope alignment.
The notable tension is that this trend-positive structure coexists with a Neutral-to-Bearish rank profile (daily #1040, 3-month #1724). From a market-structure perspective, that divergence can occur when a trend is present but not sufficiently dominant versus peers, or when recent relative performance has been uneven despite a generally rising moving-average scaffold.
For practical interpretation, trend conditions look less like “no trend” in the moving-average sense and more like a trend that still requires confirmation through persistence. With resistance defined at 396.7017 and support at 283.2100, the distance between decision zones is wide enough to allow substantial oscillation without forcing a regime call. In that context, the moving averages can be treated as dynamic support, while the static support/resistance levels provide the higher-conviction boundaries that can validate or reject continuation behavior.
3) Momentum & volatility dashboard
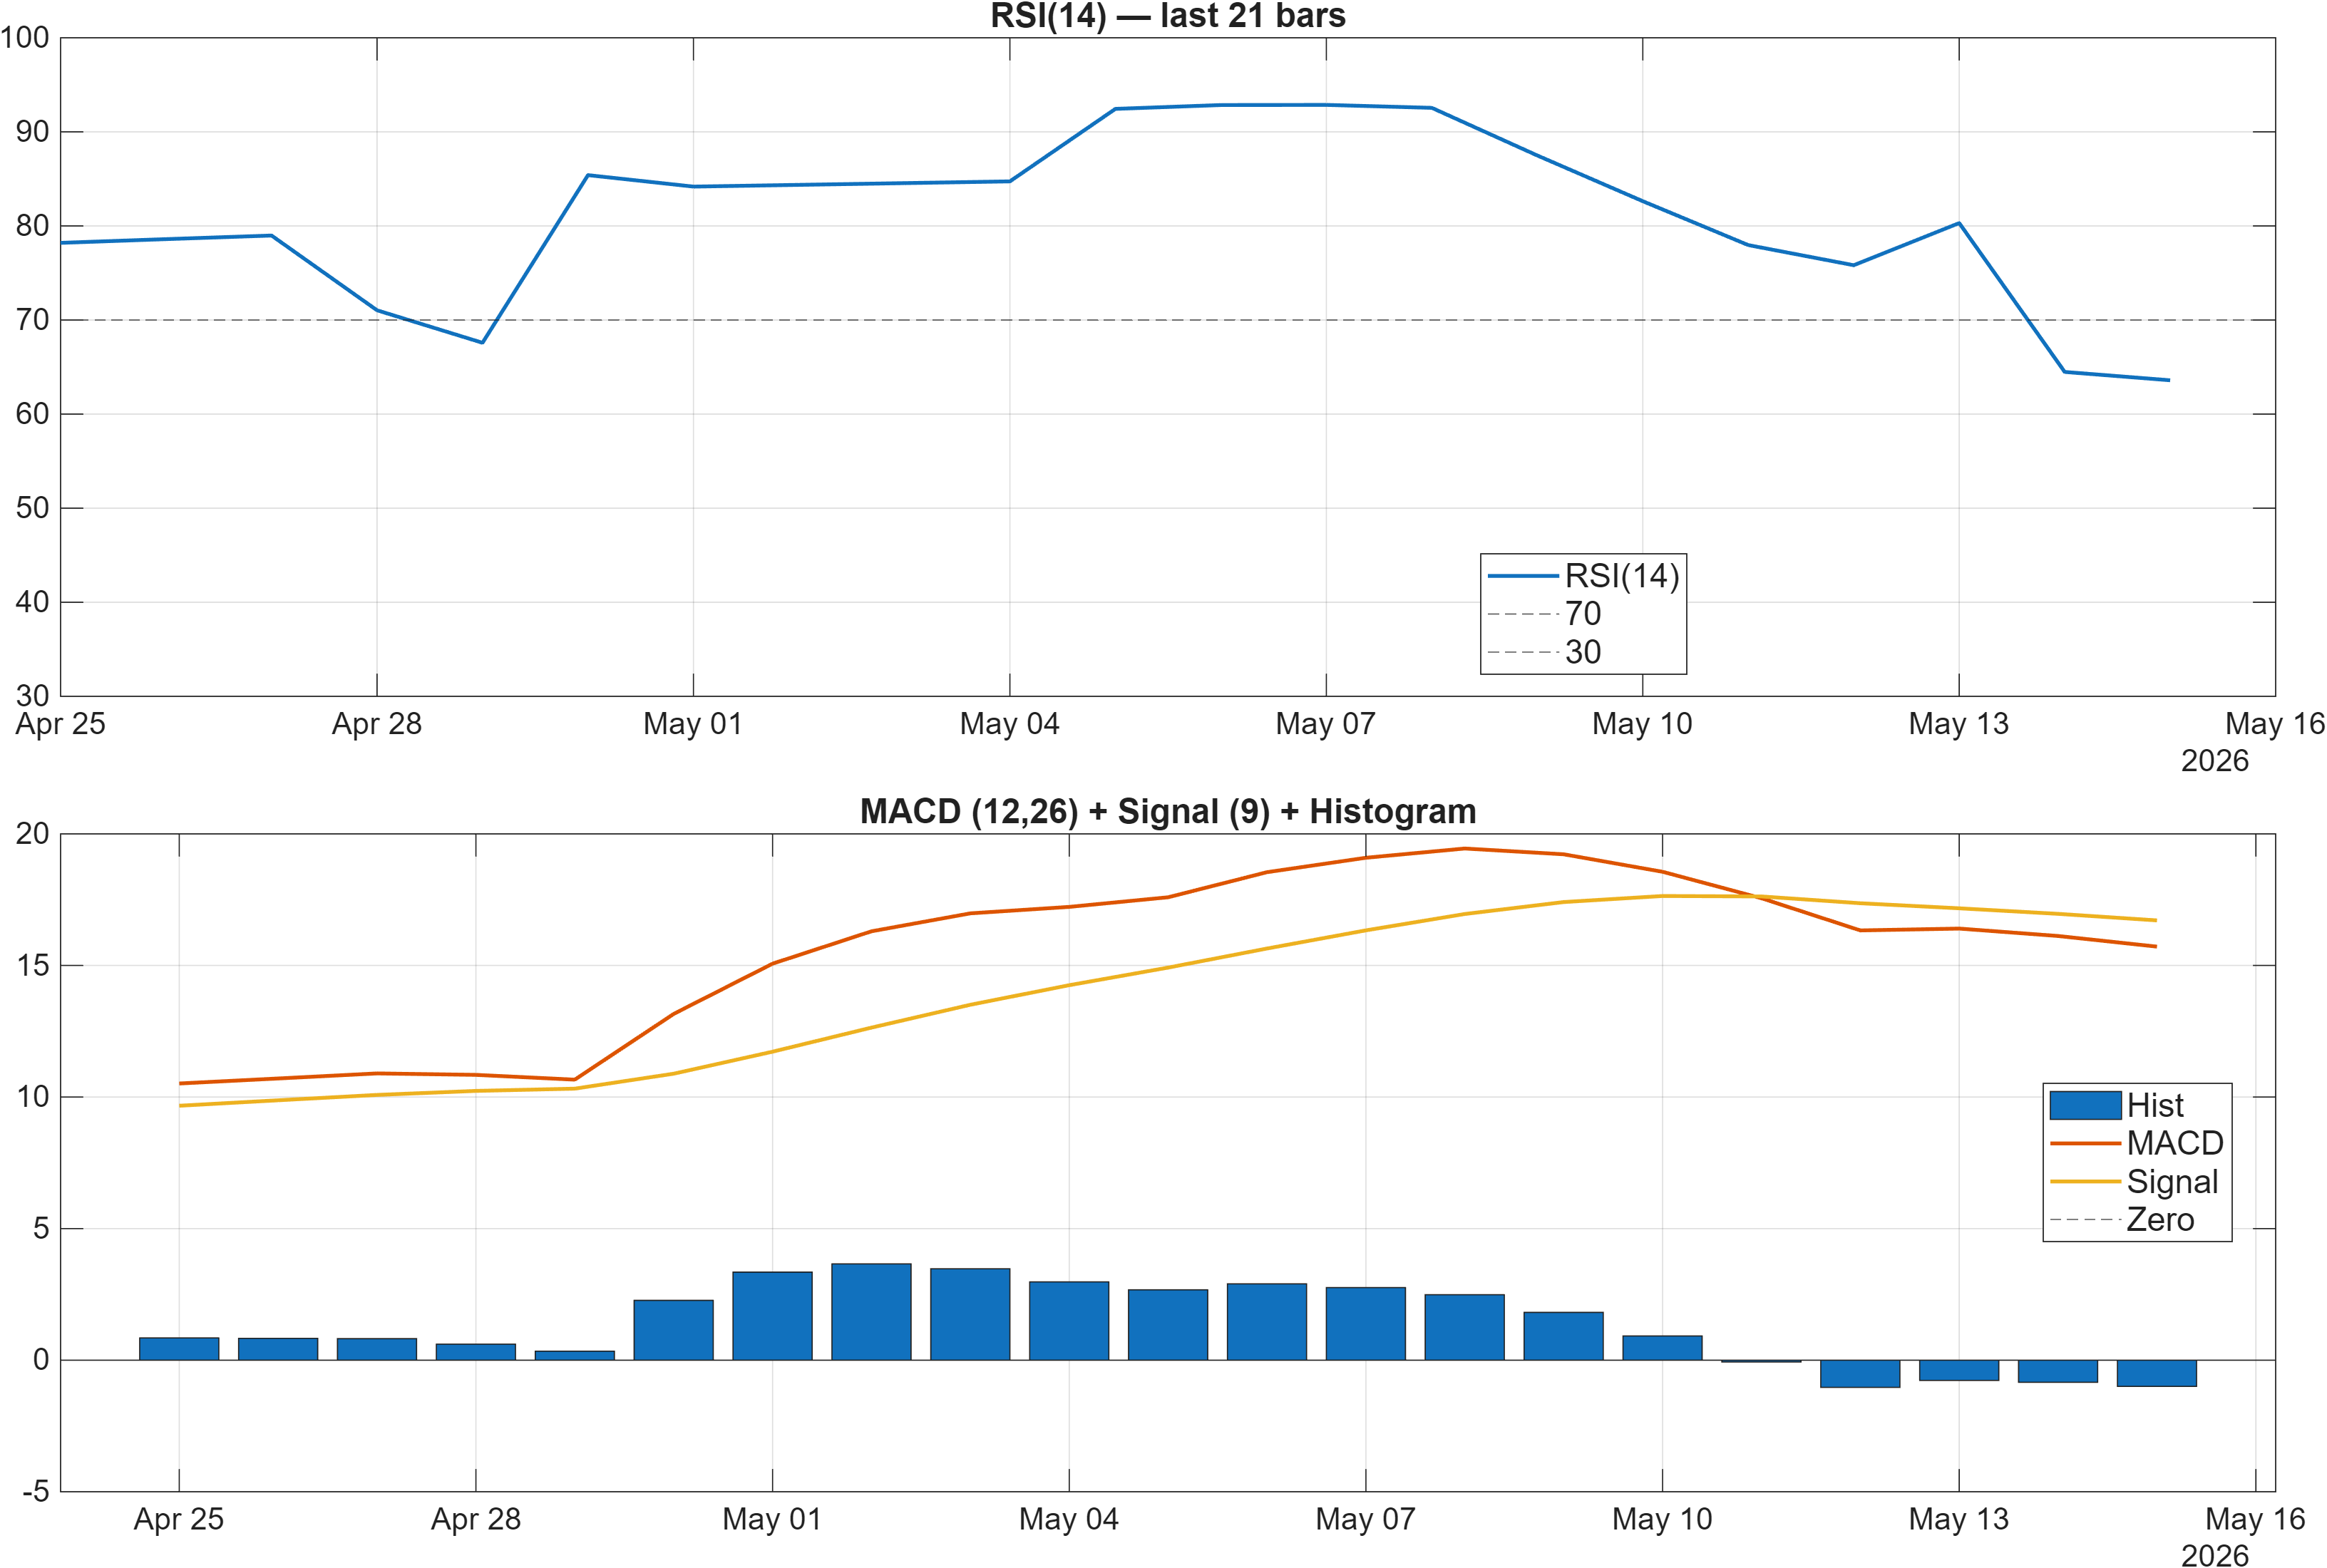
Interpretation: RSI bias = Bullish, MACD hist = -0.9966.
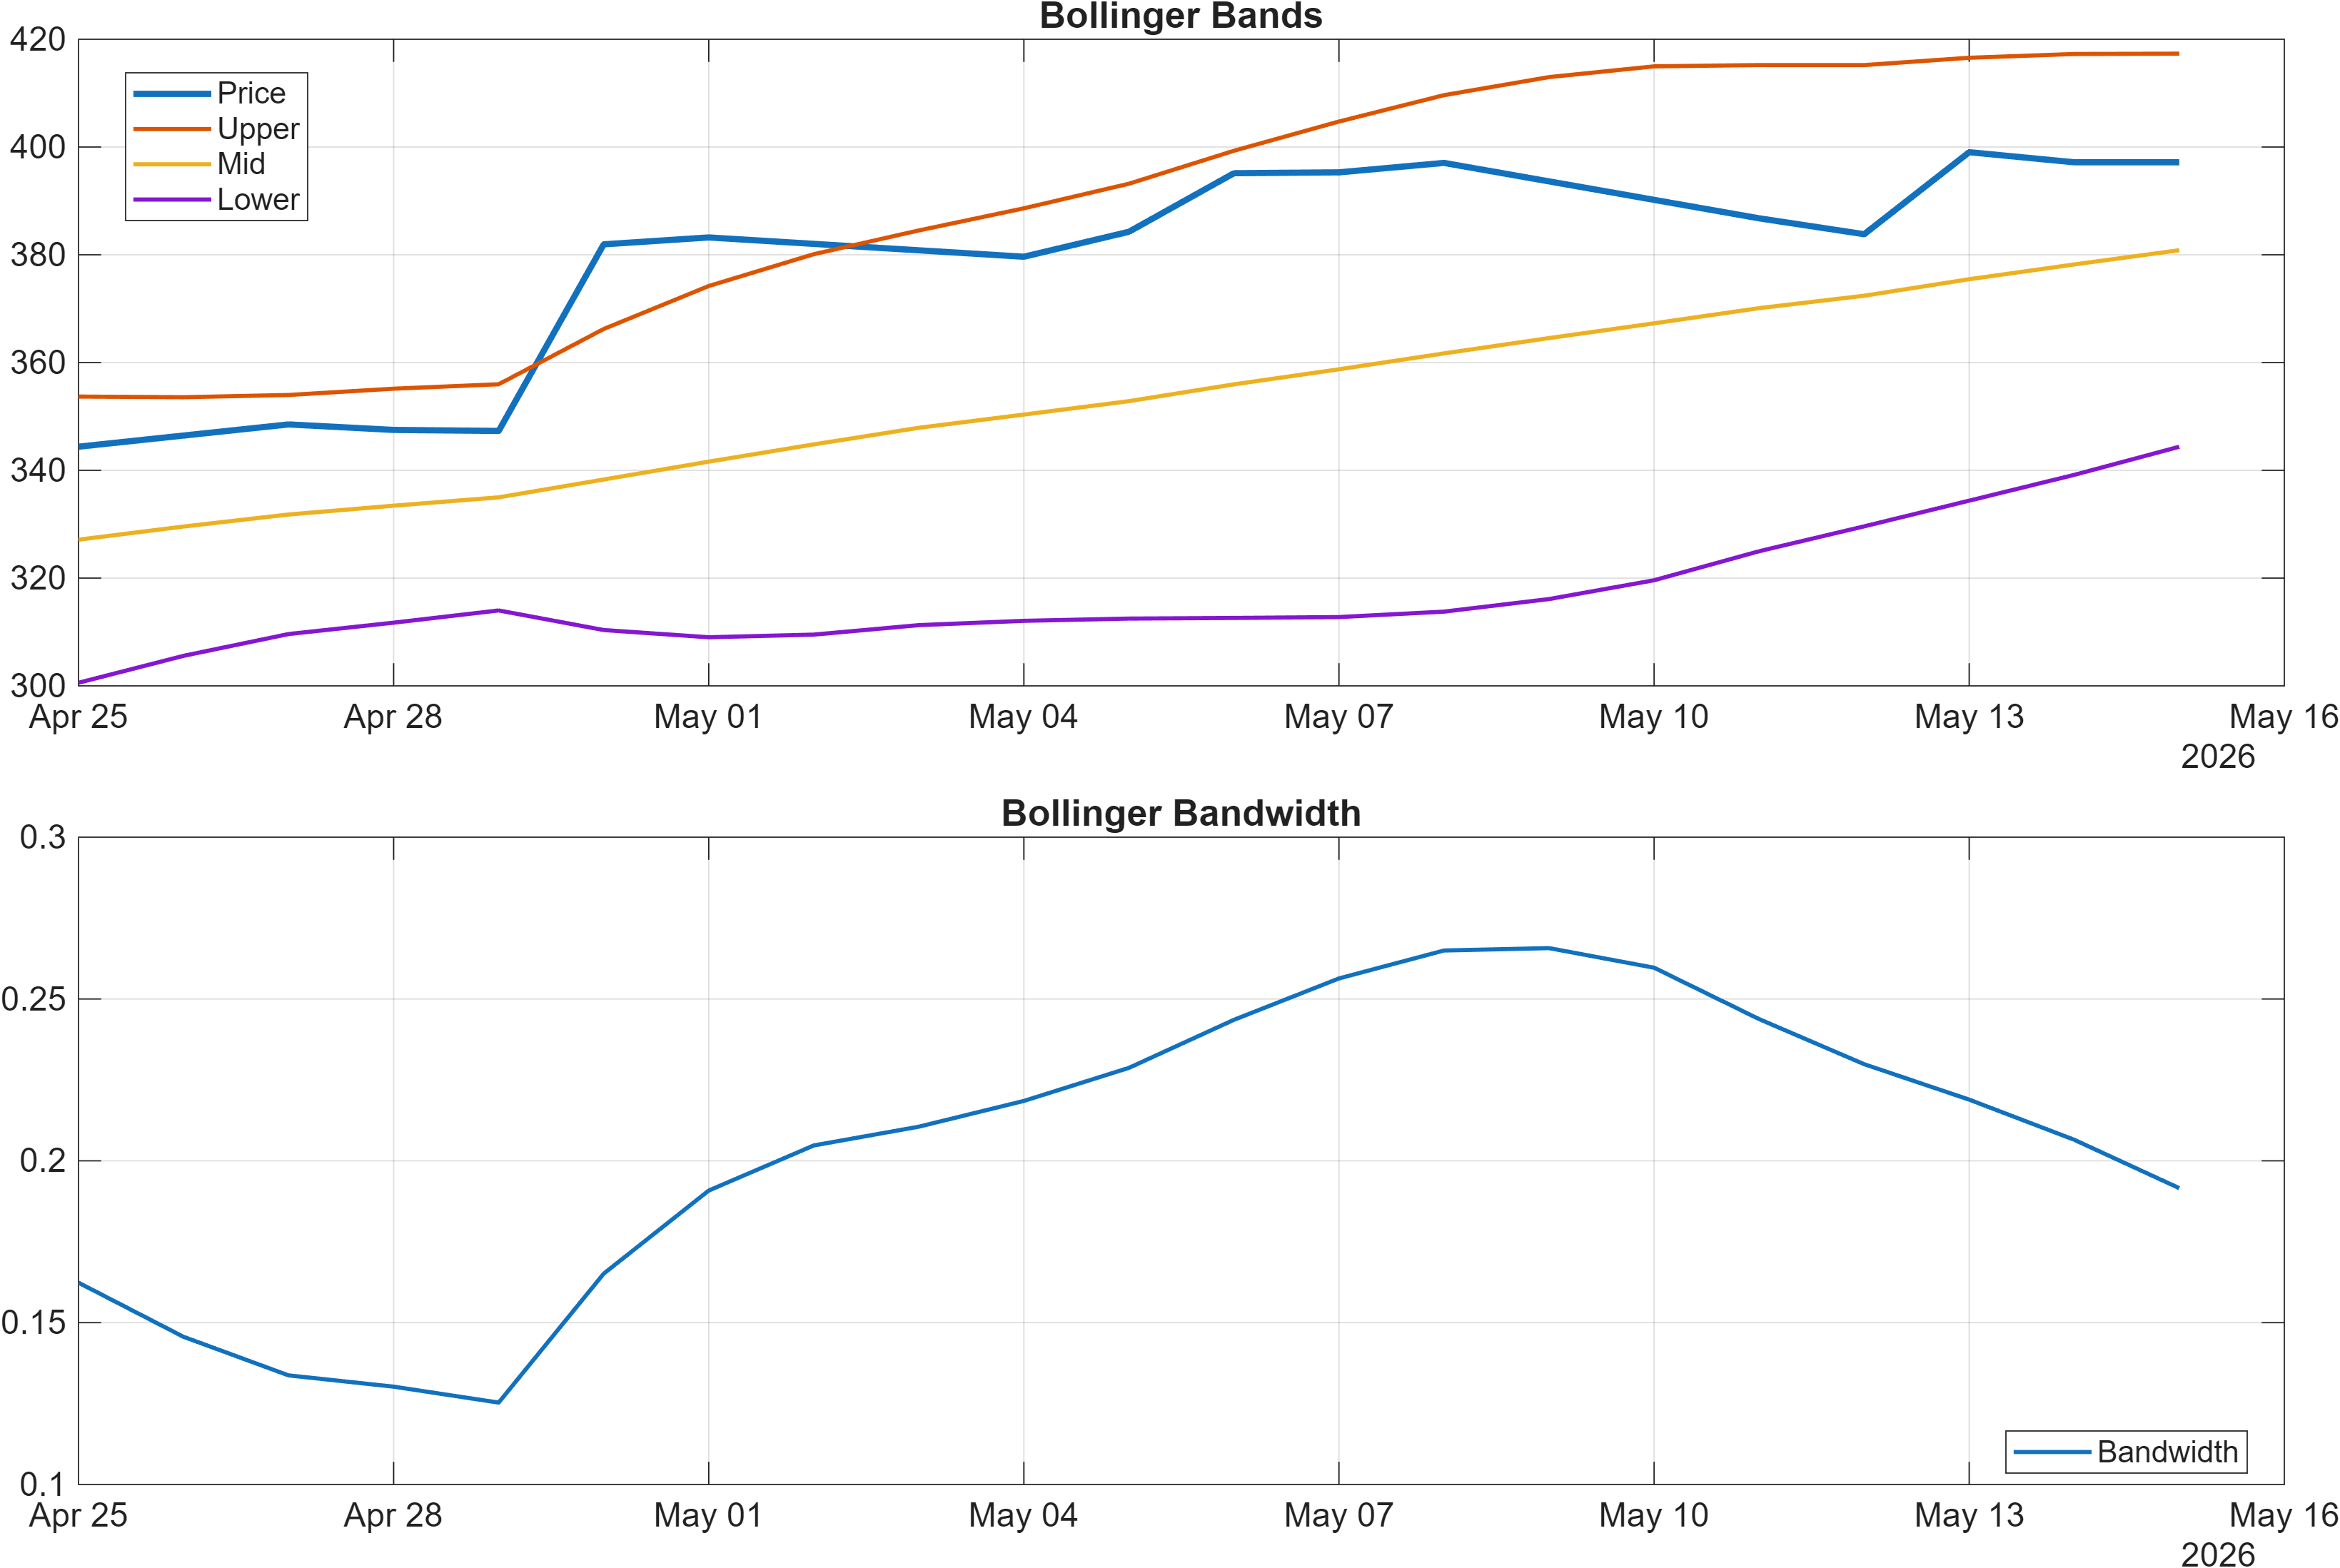
Interpretation: Bandwidth (volatility regime) latest = 0.1916.
Momentum divergence: RSI constructive, MACD pressure
Momentum signals are not fully synchronized. RSI bias is Bullish, and RSI(14) at 63.59 is consistent with constructive momentum that has not yet reached an extreme exhaustion reading. At the same time, the MACD histogram is -0.9966, which introduces a bearish counter-signal that often appears when upside momentum is slowing or when trend continuation is struggling to re-accelerate.
Volatility regime: contained, not expansionary
Bollinger Bandwidth at 0.1916 indicates a volatility state that appears moderate and not aggressively expanding. In practice, contained bandwidth can support grinding trends, but it can also coincide with range-bound or rotational price action where breakouts require stronger confirmation. This matters because moving-average alignment is already Bullish, so the next incremental confirmation often comes from volatility expansion paired with directional follow-through.
Heatmap context: overbought pressure vs trend momentum
Two readings help frame near-term “push/pull” conditions: Stoch %K at 86.34 is flagged Bearish, consistent with late-cycle/overbought dynamics that can lead to pauses, while TS Mom(20) at 50.72 remains Bullish, indicating trend momentum is still supportive. The combined message is less about reversal and more about whether momentum can re-accelerate (MACD improvement) versus compress into consolidation (stoch pressure) while volatility stays contained.
4) Support / Resistance zones
Support ~ 283.2100 | Resistance ~ 396.7017
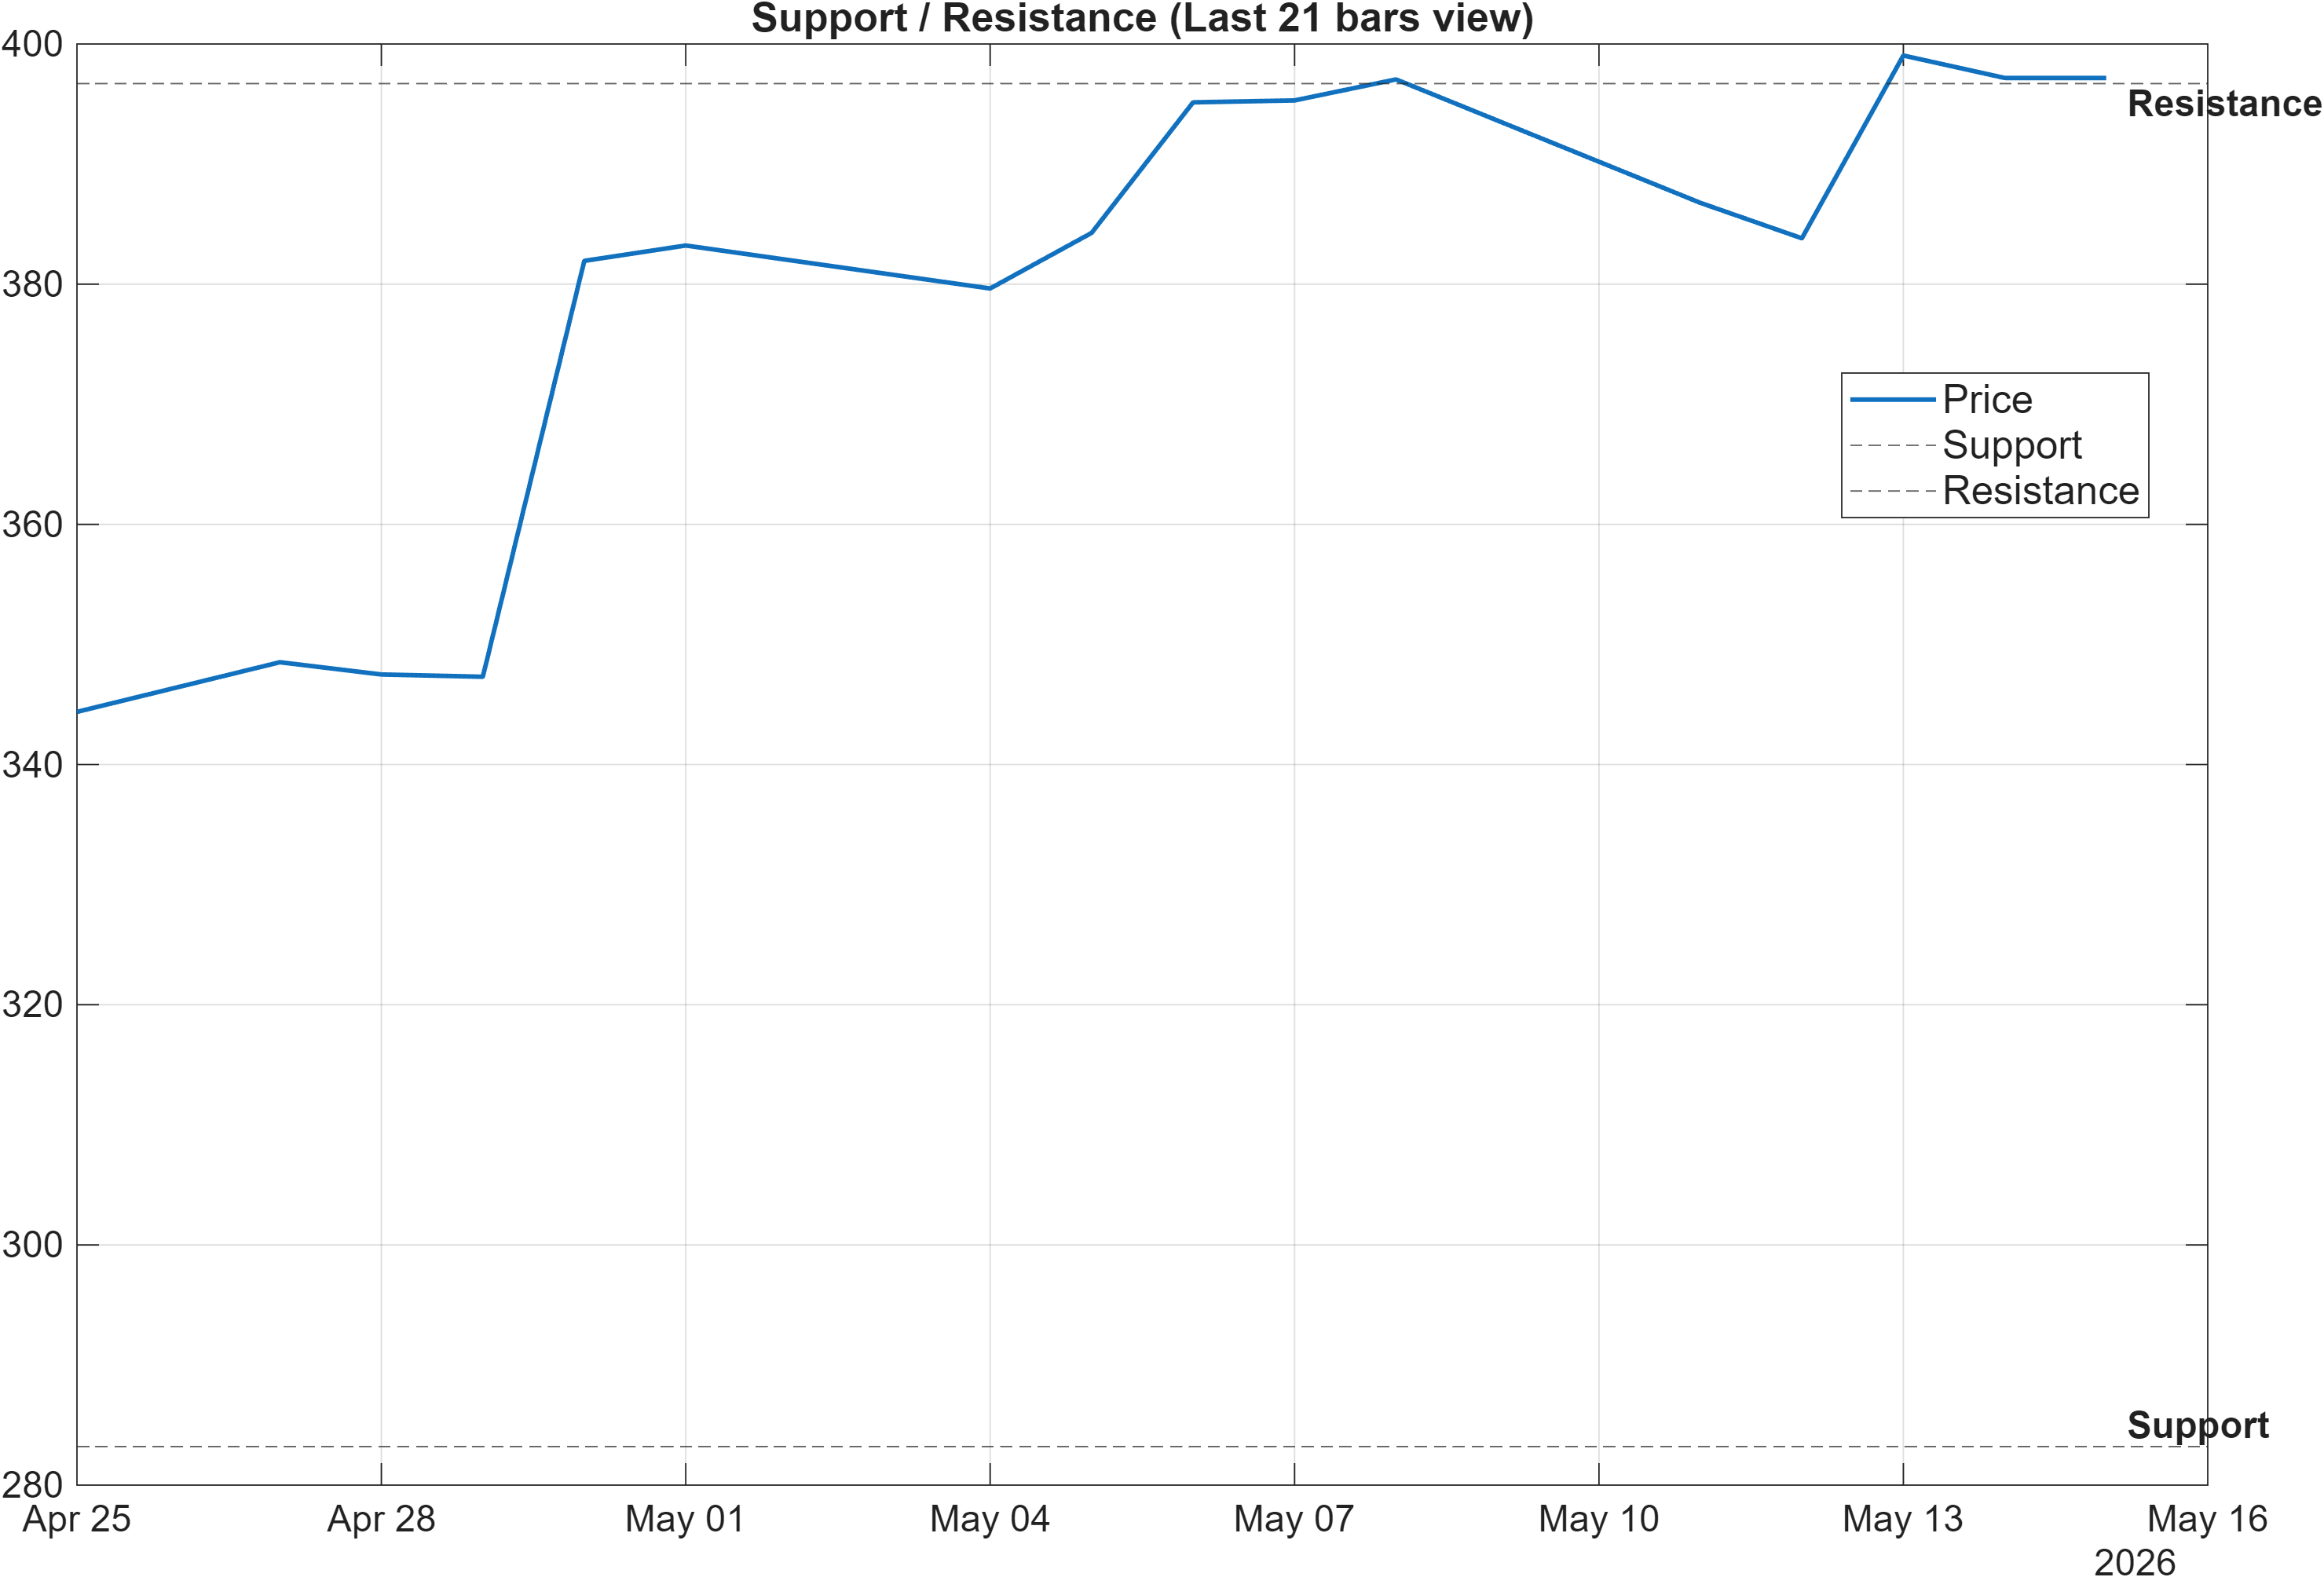
Scenario view: Break above resistance with volume → continuation. Close below support → signal deterioration risk.
Decision zones as regime tests, not precision points
The current map is defined by a wide probabilistic corridor: support near 283.2100 and resistance near 396.7017. Given the constructive moving-average interpretation (Close vs MA50 Bullish; MA50 vs MA200 Bullish), the resistance zone becomes the key area where the market must demonstrate acceptance rather than transient probing. A sustained break above 396.7017 with volume is the framework’s continuation validation, aligning with the bullish trend scaffold and the technical confluence label.
The downside condition is equally important because GOOG’s ranks are not uniformly strong (notably the 3-month rank at #1724). A close below 283.2100 would represent a deterioration event that can cause the signal stack to flip from “constructive but mixed” into “bearish alignment,” particularly if accompanied by renewed negative momentum (e.g., persistence of MACD histogram weakness at -0.9966 rather than improvement).
Because the distance between zones is significant, this is a structure where traders often look for intermediate confirmations (momentum improvement, volatility expansion, and volume confirmation) before treating any move as a durable regime shift. Conversely, if price remains between the zones while Bollinger Bandwidth stays near 0.1916, the more likely market behavior is rotational, with technical signals needing repeated confirmation rather than a single decisive trigger.
5) Quant Technical Dashboard (18 Signals)
KGNAI AI Technical Analysis Score (Deep Reinforcement Learning): Rank #363 out of 2052 (Rank 1 represents the strongest technical positioning and a higher probability of favorable price behavior. As ranks increase toward the maximum, the probability of favorable outcomes weakens and bearish positioning becomes more dominant.) | Label: Bullish | Score: 0.646
18-Signal Technical Confluence Score: 0.333 (Bullish)
Overall Technical Score (18-signal confluence + DRL rank blend): 0.427 (Bullish)
Note: The blended score reflects signal strength weighted against broader AI technical ranking, which may temporarily diverge.
Blended technical score breakdown: 0.427 (Bullish | Bull 10 / Bear 4 / Neutral 4)
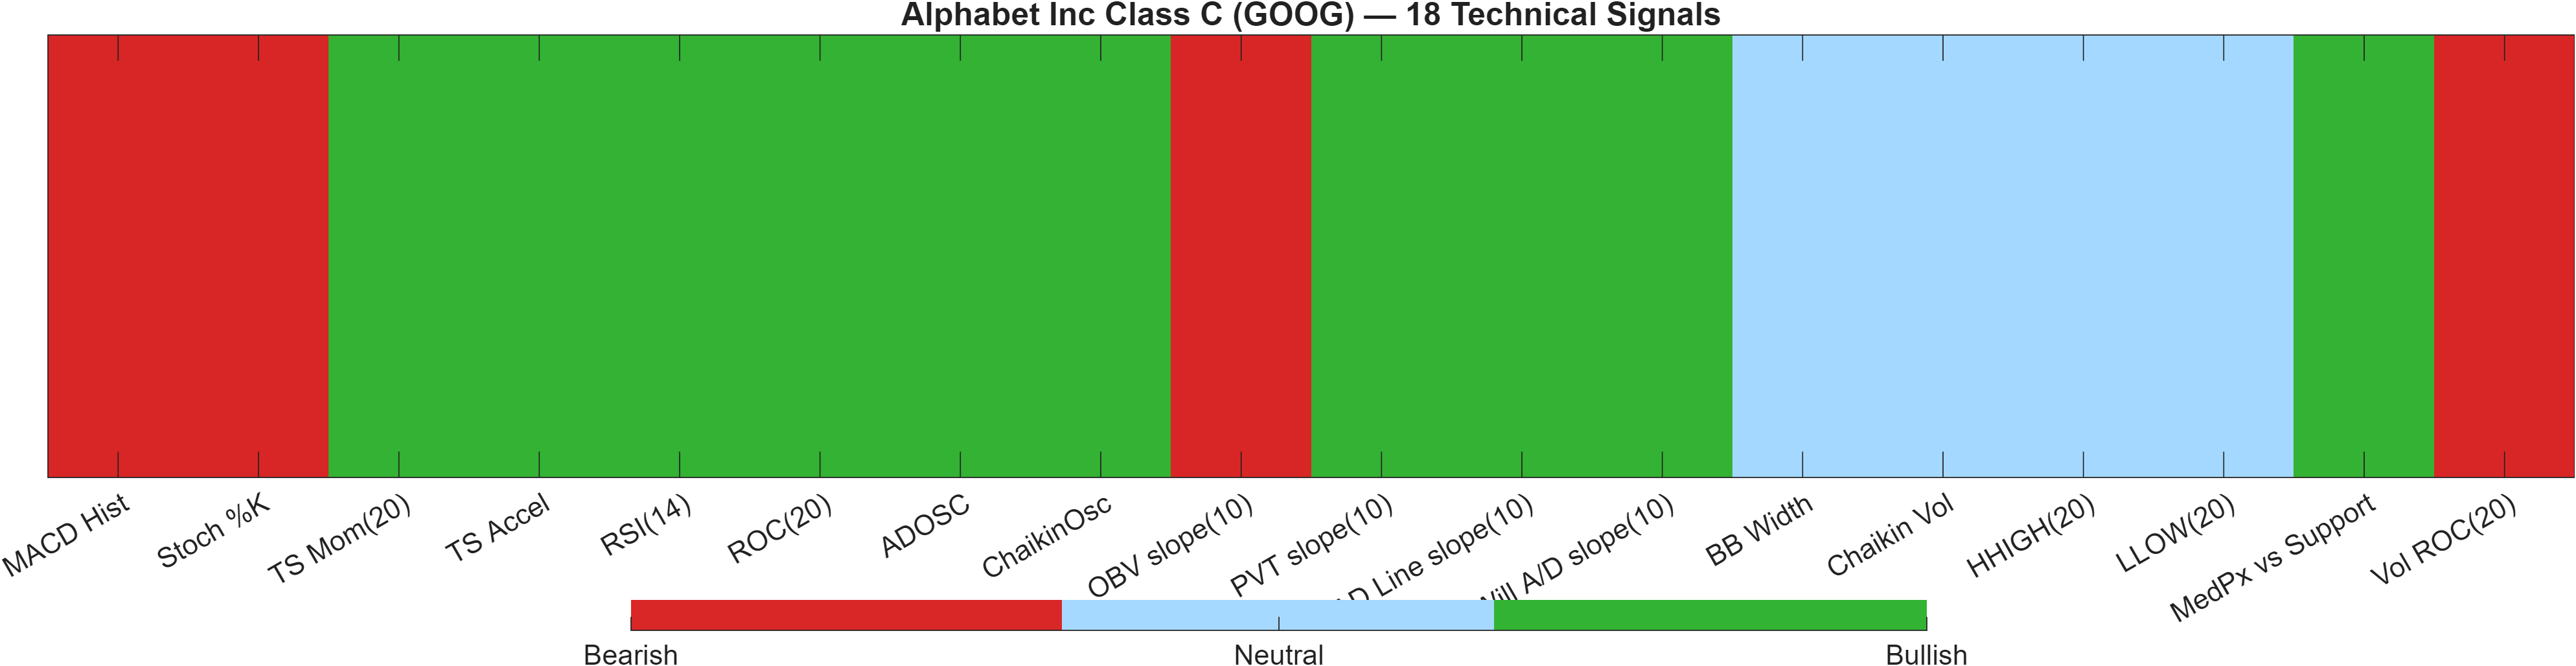
Signal blend: breadth bullish, but with targeted frictions
The technical layer is the most consistently constructive part of the dataset. The Deep Reinforcement Learning technical rank at #363 out of 2052 sits in the upper portion of the universe, reinforcing a Bullish technical label with a score of 0.646. Separately, the 18-signal confluence score of 0.333 is also Bullish, and the blended overall technical score holds at 0.427, with breadth showing Bull 10 / Bear 4 / Neutral 4.
The analytical nuance is that the bullish majority is not “clean.” Several bearish flags concentrate in places that can matter for near-term follow-through: MACD Hist at -0.9966 is Bearish, and Vol ROC(20) at -22.24 is also Bearish—together implying that momentum/participation may not be fully supportive even if price structure holds. Additionally, OBV slope(10) at -7.098e+06 is Bearish, which can reflect distribution or weaker net volume flow in the lookback window.
Offsetting that friction, multiple accumulation and trend-momentum inputs are Bullish (e.g., RSI(14) 63.59 and ROC(20) 14.64), indicating the constructive signal stack is not solely dependent on one indicator family. Overall, the dashboard reads as bullish technical conditions with selective confirmation requirements: improvement in participation and MACD dynamics would better align the indicator layer with the stronger DRL rank, while deterioration near the support zone would likely force a faster technical reclassification.
Signal table (Bull/Bear/Neutral)
| Indicator | Value | Signal |
|---|---|---|
| MACD Hist | -0.9966 | Bearish |
| Stoch %K | 86.34 | Bearish |
| TS Mom(20) | 50.72 | Bullish |
| TS Accel | 8.193 | Bullish |
| RSI(14) | 63.59 | Bullish |
| ROC(20) | 14.64 | Bullish |
| ADOSC | 75.41 | Bullish |
| ChaikinOsc | 1.351e+07 | Bullish |
| OBV slope(10) | -7.098e+06 | Bearish |
| PVT slope(10) | 8.415e+05 | Bullish |
| AD Line slope(10) | 3.485e+07 | Bullish |
| Will A/D slope(10) | 15.35 | Bullish |
| BB Width | 0.1916 | Neutral |
| Chaikin Vol | -5.86 | Neutral |
| HHIGH(20) | 399.9 | Neutral |
| LLOW(20) | 338.6 | Neutral |
| MedPx vs Support | 112.7 | Bullish |
| Vol ROC(20) | -22.24 | Bearish |
Interpretation: Indicator-level signals form the base confluence, which is then adjusted using a separate AI-driven technical ranking model. The final technical score summarizes this combined view.
6) News sentiment + extractive gist
Sentiment score (avg): 0.070 | Positive: 33% | Neutral: 67% | Negative: 0%
KGNAI AI News Sentiment Score (normalized -1 to +1): 0.44 (as of 2026-05-15) | Label: Bullish | Overall news score: 0.56
Positive Developments
Recent coverage across major financial outlets indicates a moderately constructive backdrop for Alphabet, with sentiment data skewing toward neutral-to-positive. The average sentiment score of 0.070, paired with 33% positive and 0% negative classification in the provided digest, implies that the news flow is generally not acting as a headline drag. The KGNAI normalized news sentiment score of 0.44 and Bullish label further supports a mild positive bias rather than an extreme, crowded narrative. The items in circulation appear focused on competitive positioning in AI and broader strategic initiatives, which can reinforce investor attention and keep the narrative constructive when price is testing key technical levels. From a signal-integration standpoint, a mildly supportive news tone can help the bullish technical blend (0.427) hold its edge, especially if the market is waiting on confirmation around resistance 396.7017 rather than reacting to abrupt negative catalysts.
Neutral / Mixed Developments
The same news set also contains elements that are best treated as informational rather than directional. While the normalized sentiment is positive, the distribution is dominated by 67% neutral tagging, suggesting the market may interpret developments as incremental updates rather than decisive regime changers. That neutral weight aligns with KGNAI’s broader stance that GOOG is not in a single, fully-aligned trend state: daily rank #1040 and weekly rank #633 sit near the middle of the universe even as technical confluence reads Bullish. In this environment, news may function more as context for positioning than as a trigger, leaving price/volume behavior and momentum indicators (including MACD histogram at -0.9966) to determine whether the next move is continuation or consolidation.
Negative / Risk Signals
Despite the absence of explicitly negative items in the provided sentiment split (0% negative), risk is still present through interpretation risk and expectations management. A news stream that emphasizes competitive comparisons and strategic ambition can raise the bar for confirmation in price behavior. When technicals already show selective frictions—such as Bearish MACD histogram (-0.9966) and Bearish volume rate-of-change (-22.24)—even neutral coverage can become a headwind if price fails to validate above resistance 396.7017. The practical risk signal to monitor is not a single headline, but whether sentiment remains supportive while the market rejects the upper decision zone or begins to drift toward support 283.2100. If that occurs, the gap between bullish confluence and weaker intermediate ranks (3-month #1724) becomes more relevant.
- Whether sentiment stays constructive (normalized score 0.44) if price action challenges 396.7017.
- Any shift from neutral-dominant coverage (67%) toward more polarized tone that could coincide with volatility expansion (Bandwidth 0.1916).
- Confirmation that participation improves alongside price (watch volume-linked signals given Vol ROC(20) -22.24).
Sources referenced: Reuters, Bloomberg, Yahoo Finance, MarketWatch, Investing.com
7) Sources
Not available in the provided data.
You may also like: How KGNAI AI ranks instruments across global markets
Disclaimer: KGNAI provides AI-generated analytics and educational market commentary only. This is not financial advice. Markets involve risk. Always do your own research.