
HCC (Warrior Met Coal Inc) — 17-May-2026 Technical Stance: Bullish ranks vs neutral confluence
Warrior Met Coal Inc (HCC) enters 17-May-2026 with a split profile that is analytically useful for positioning: cross-sectional KGNAI ranks remain strong on several horizons, while traditional trend and indicator confluence reads more cautious. The Daily rank of #32 and 3-Monthly rank of #21 suggest the stock is still behaving like an upper-decile instrument within the 2052-name universe, even as the price sits below MA50 and with MA50 below MA200. Momentum is not extended (RSI(14) 51.44), but MACD histogram remains negative (-0.0869), consistent with a market that is stabilizing rather than accelerating. Volatility is relatively contained (Bollinger Bandwidth 0.0796), elevating the importance of defined decision zones at 83.8225 support and 96.8450 resistance. News sentiment is mildly constructive (avg sentiment 0.088; normalized score 0.99), acting as a contextual tailwind rather than a stand-alone signal.
- Rank stance: Short Bullish | Mid Neutral | Long Bullish
- Technical confluence: Neutral (18-signal score -0.167; blended -0.187)
- Key levels: Support 83.8225 | Resistance 96.8450
- News sentiment bias: Slightly constructive (avg 0.088; normalized 0.99)
- Confirmation / invalidation: A break above 96.8450 with volume supports continuation; a close below 83.8225 increases deterioration risk.
KGNAI evaluates assets using large cross-sectional datasets built from millions of structured data points. Inputs incorporate fundamental metrics, technical structures, and systematically processed news sentiment. Statistical models, machine learning, and AI frameworks are used to assess relative positioning, signal alignment, and probabilistic behavior across broad universes.
- Ranks are comparative across the tracked universe, not absolute price targets.
- Confluence reflects alignment among independent signal groups.
- Support/resistance levels are probabilistic decision zones, not guarantees.
- Sentiment provides contextual bias within the broader analytical framework.
1) KGNAI AI Analysis
Region: USA
Total universe size: 2052 ranked instruments
- Daily rank: #32 out of 2052 — Bullish
- Weekly rank: #146 out of 2052 — Bullish
- Monthly rank: #952 out of 2052 — Neutral
- 3-Monthly rank: #21 out of 2052 — Bullish
- 6-Monthly rank: #288 out of 2052 — Bullish
- Yearly rank: #18 out of 2052 — Bullish
HCC’s rank structure reads as a time-horizon divergence rather than a uniform signal. The Daily #32 and 3-Monthly #21 placements imply strong near-term and intermediate relative behavior versus the 2052-instrument universe (upper decile). The Yearly #18 reinforces that the longer-run profile has remained persistently favorable in cross-sectional terms.
The offset is concentrated in the mid-term window: the Monthly #952 sits in the lower half of the universe, aligning with a “neutral” label. That configuration often appears when a broader uptrend remains intact in the ranking model, but the most recent month lacks the same reinforcement—consistent with consolidation, rotation, or temporary sensitivity to commodity/sector tape. Meanwhile, the Weekly #146 and 6-Monthly #288 are still constructive, indicating the monthly softness has not fully propagated across adjacent horizons.
From a process standpoint, this is a regime where rank persistence matters: multiple bullish horizons (Daily, Weekly, 3-Monthly, 6-Monthly, Yearly) coexist with a neutral month, so the more informative question becomes whether the monthly window re-joins the stronger cluster or whether the shorter windows begin to drift upward (weaken) toward the monthly reading.
Term view: Short-term: Bullish. Mid-term: Neutral. Long-term: Bullish.
Want the full universe and complete rank tables? Unlock full access on KGNAI: https://www.kgnai.com/pricing
2) Price & trend overview
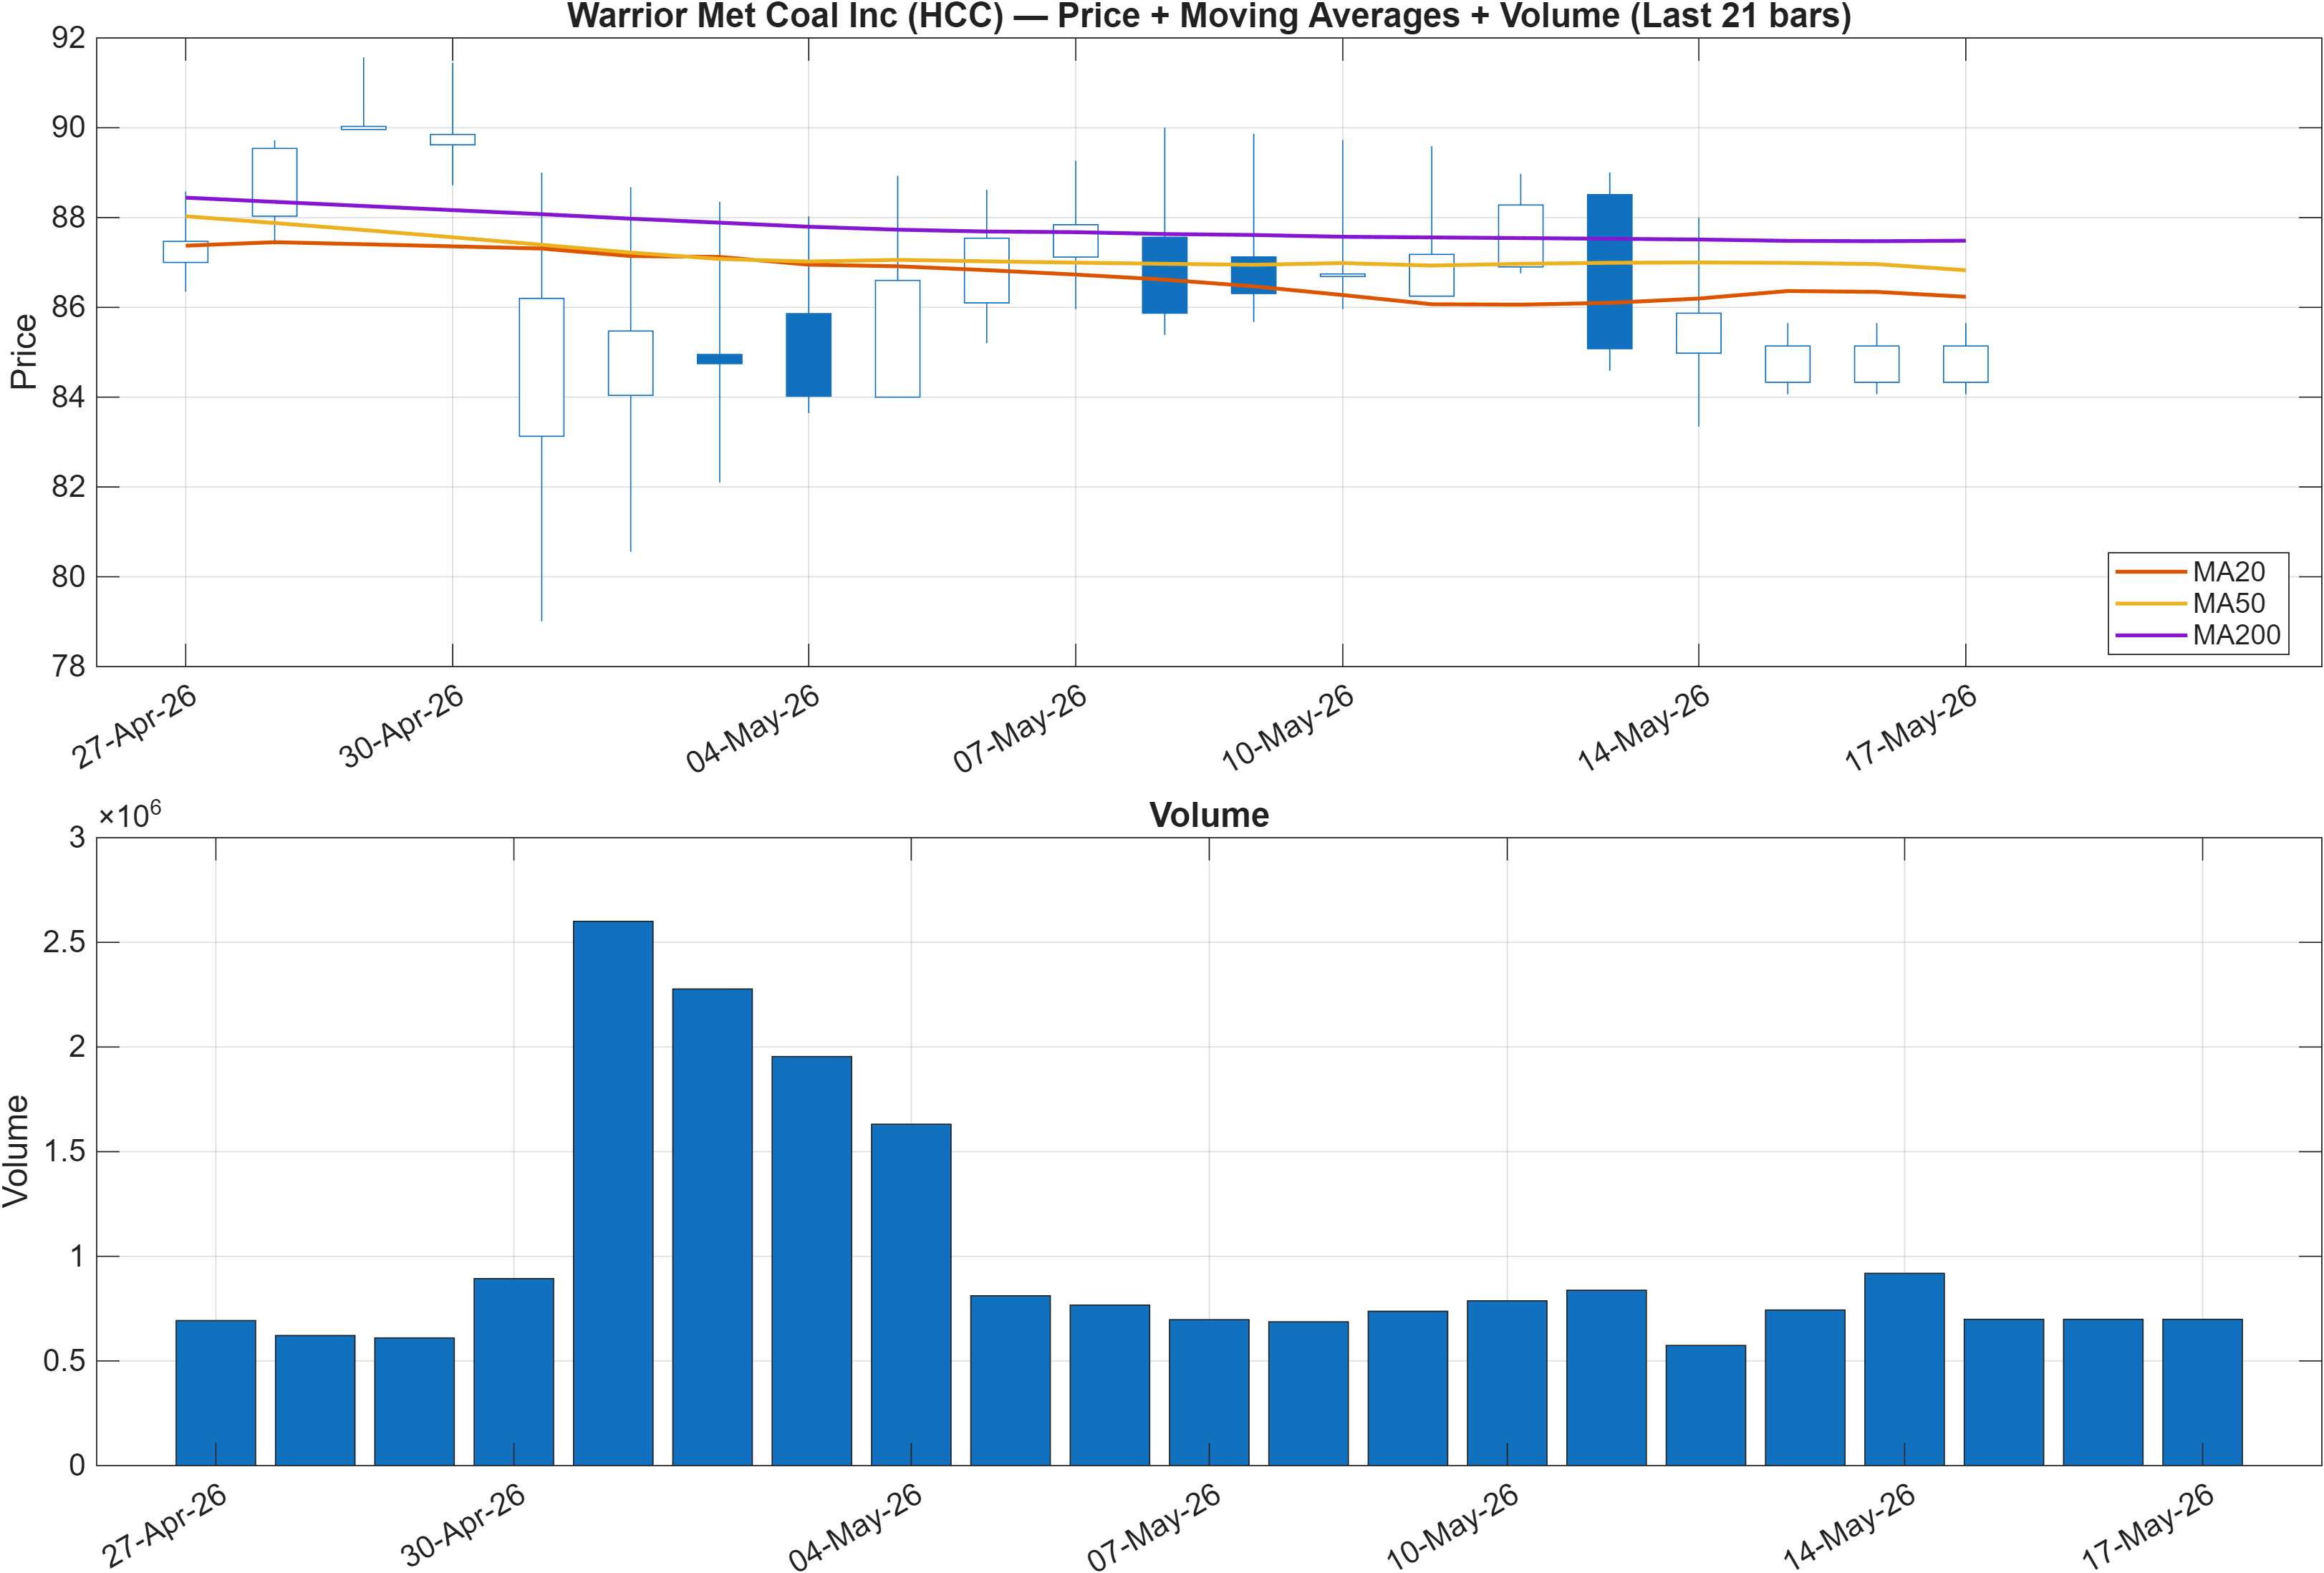
Interpretation: Close vs MA50 = Bearish, MA50 vs MA200 = Bearish.
The trend layer is currently the primary source of friction against HCC’s stronger ranks. With the close below the MA50 and MA50 below MA200, the moving-average stack describes a market that is still working through a recovery process rather than compounding a clean trend. In that state, upside attempts often need confirmation from breadth/participation and a reclaim of key moving averages before the trend model will fully agree with the rank signal.
This creates a useful “alignment vs divergence” setup: the cross-sectional ranks (e.g., Daily #32, Yearly #18) imply HCC is behaving better than most of the universe, yet the moving-average structure signals caution. When these disagree, the market frequently oscillates around decision levels and relies on breakout validation (price acceptance above resistance with volume) rather than gradual drift.
The nearby probabilistic zones add structure to that interpretation. The report’s support at 83.8225 serves as the practical line for trend deterioration risk, while resistance at 96.8450 defines the level most likely to trigger systematic trend re-engagement if cleared. In other words, trend confirmation is less about a single candle and more about whether price can sustain strength through resistance while participation improves.
3) Momentum & volatility dashboard
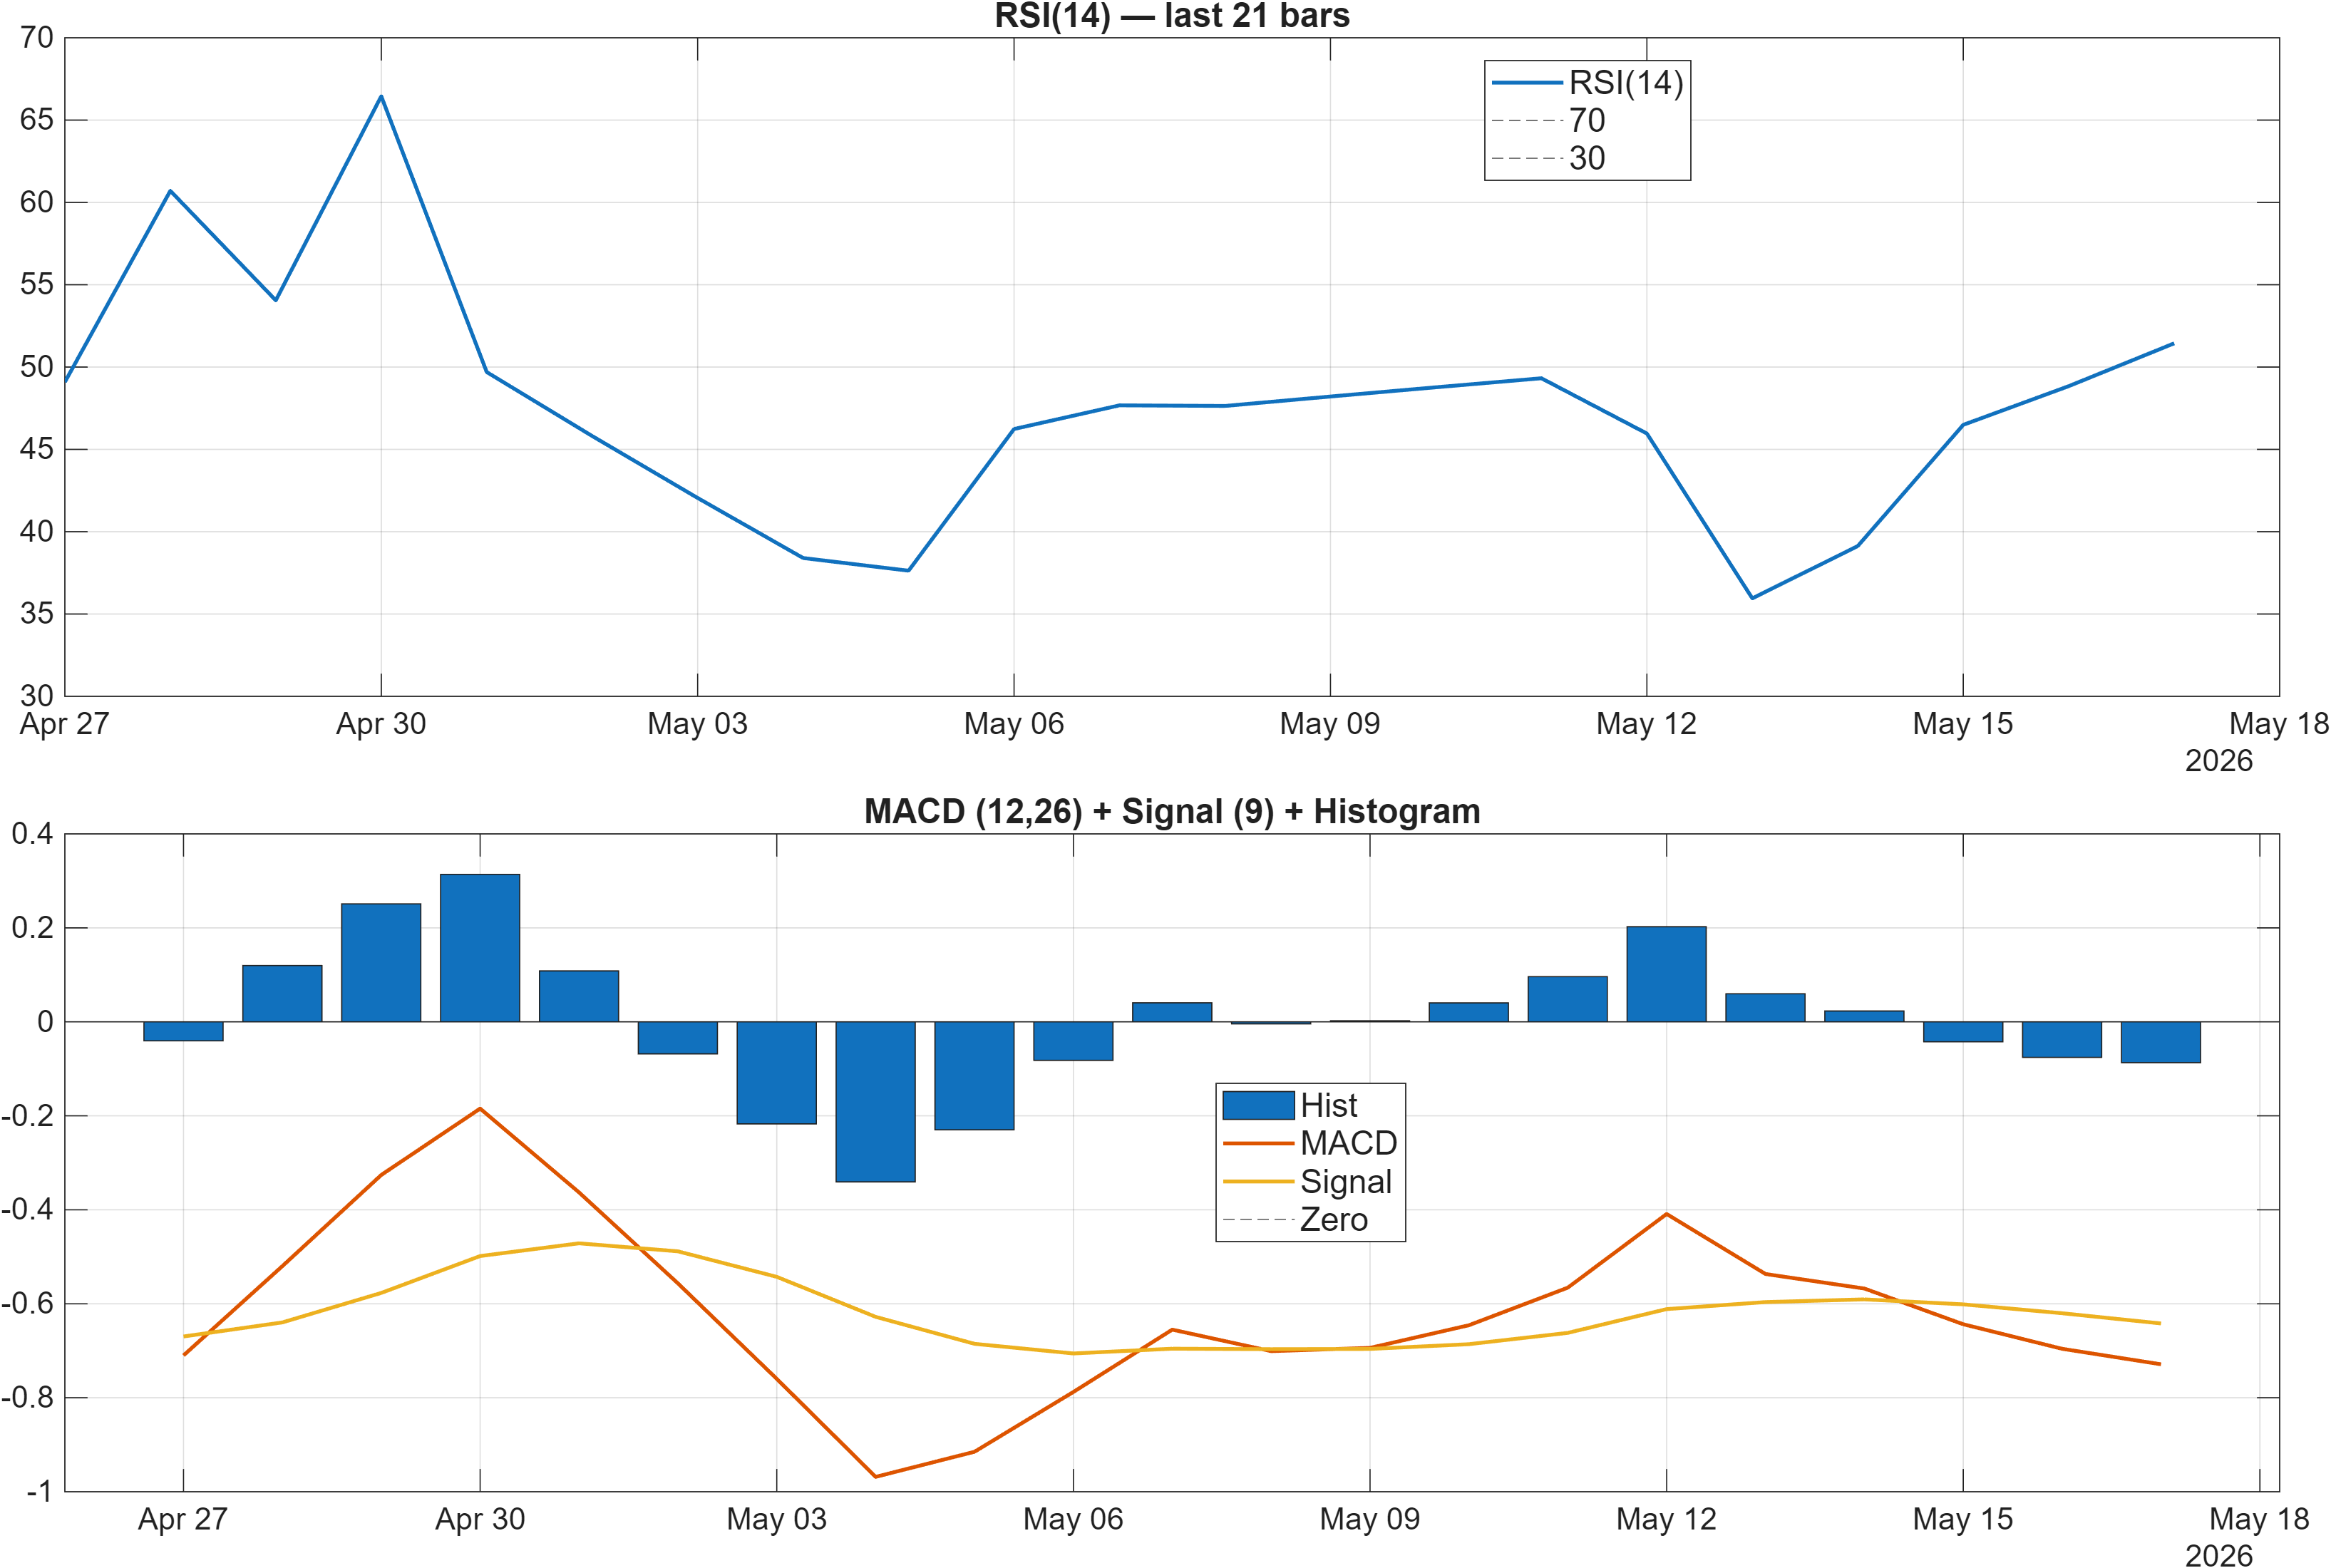
Interpretation: RSI bias = Neutral, MACD hist = -0.0869.
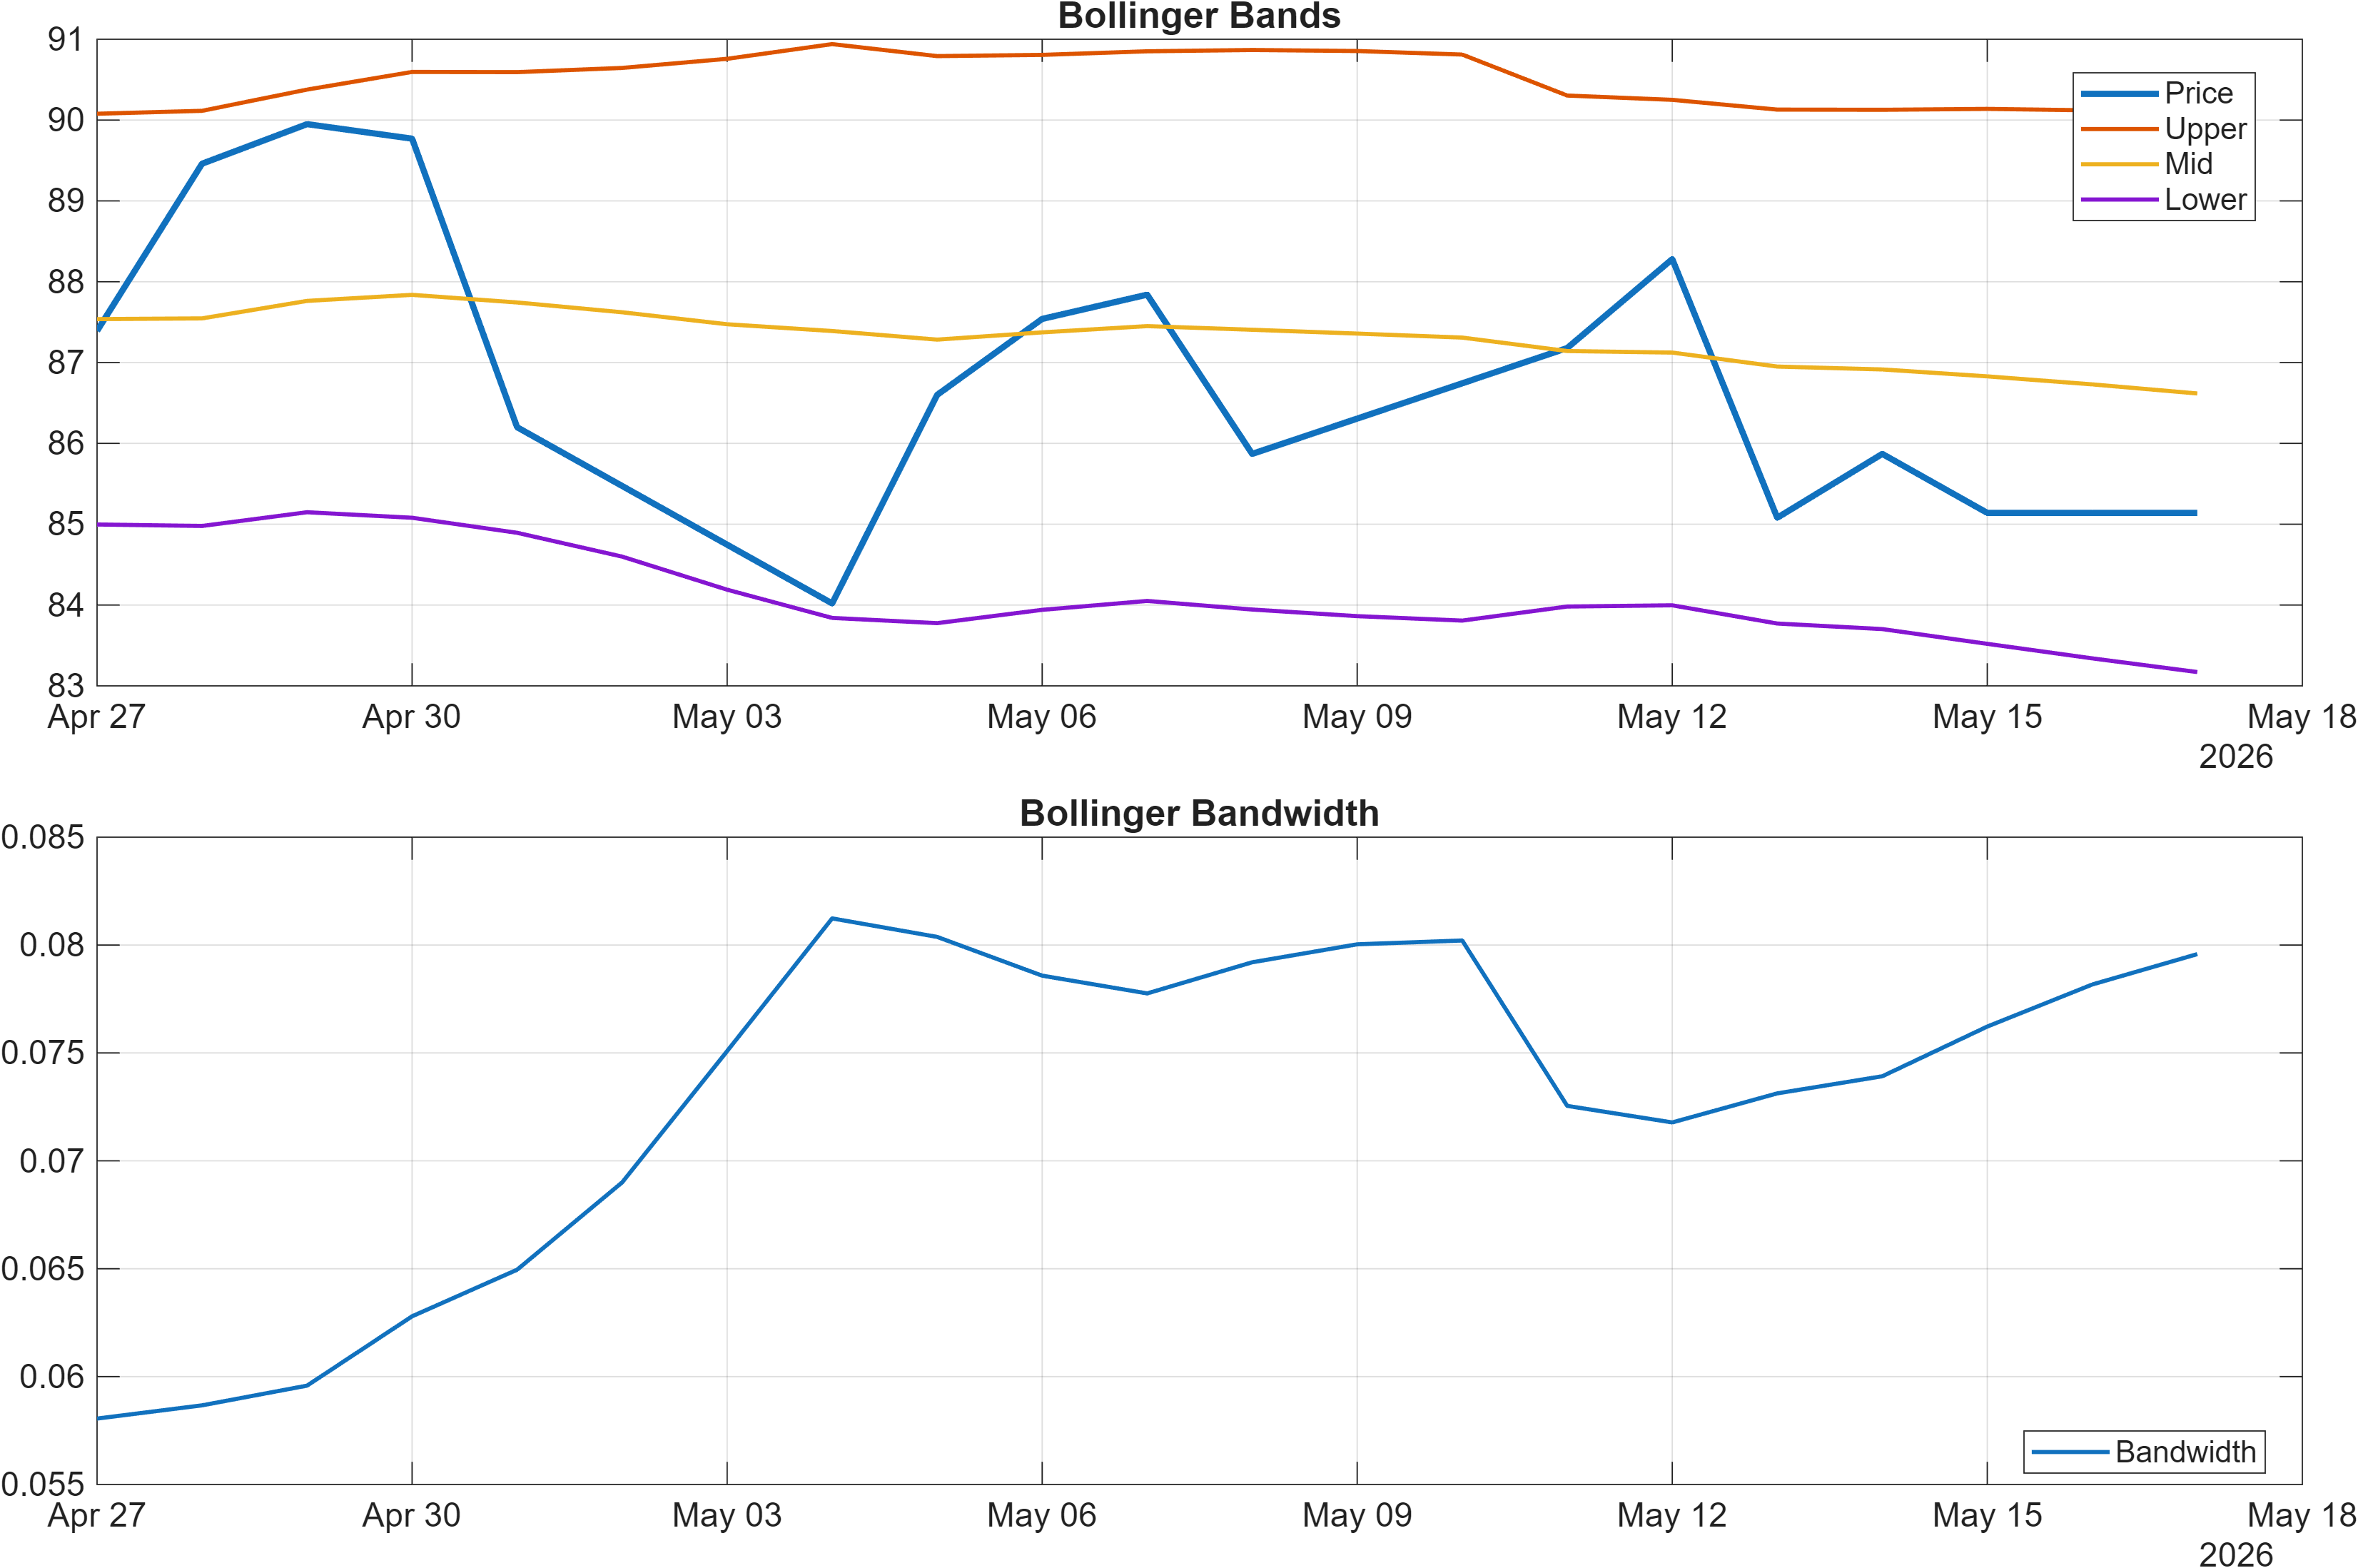
Interpretation: Bandwidth (volatility regime) latest = 0.0796.
Momentum reads more like stabilization than acceleration. RSI(14) at 51.44 is effectively neutral—neither stretched nor meaningfully washed out—so it does not provide the kind of oversold/overbought skew that can dominate near-term price behavior. At the same time, the MACD histogram at -0.0869 remains negative, consistent with a market that has not yet rebuilt upward momentum on a trend-following basis.
That pairing (neutral RSI, negative MACD) often appears in range-to-break conditions: price can grind, rotate, or mean-revert while the slower MACD component lags. For HCC, this helps explain why ranks can remain strong (relative performance vs the universe) even as the indicator set does not confirm a clean “trend-on” state.
Volatility provides the second lens. Bollinger Bandwidth at 0.0796 implies a relatively contained volatility regime. When bandwidth is compressed, price tends to respect well-defined levels more tightly; that increases the analytical weight of the support/resistance framework at 83.8225 and 96.8450. It also means that any move beyond those zones—especially if accompanied by improving participation signals—can carry more informational value than during a high-volatility environment.
Overall, the dashboard points to a regime where confirmation is more likely to arrive through a break-and-hold dynamic than through a steady momentum ramp.
4) Support / Resistance zones
Support ~ 83.8225 | Resistance ~ 96.8450
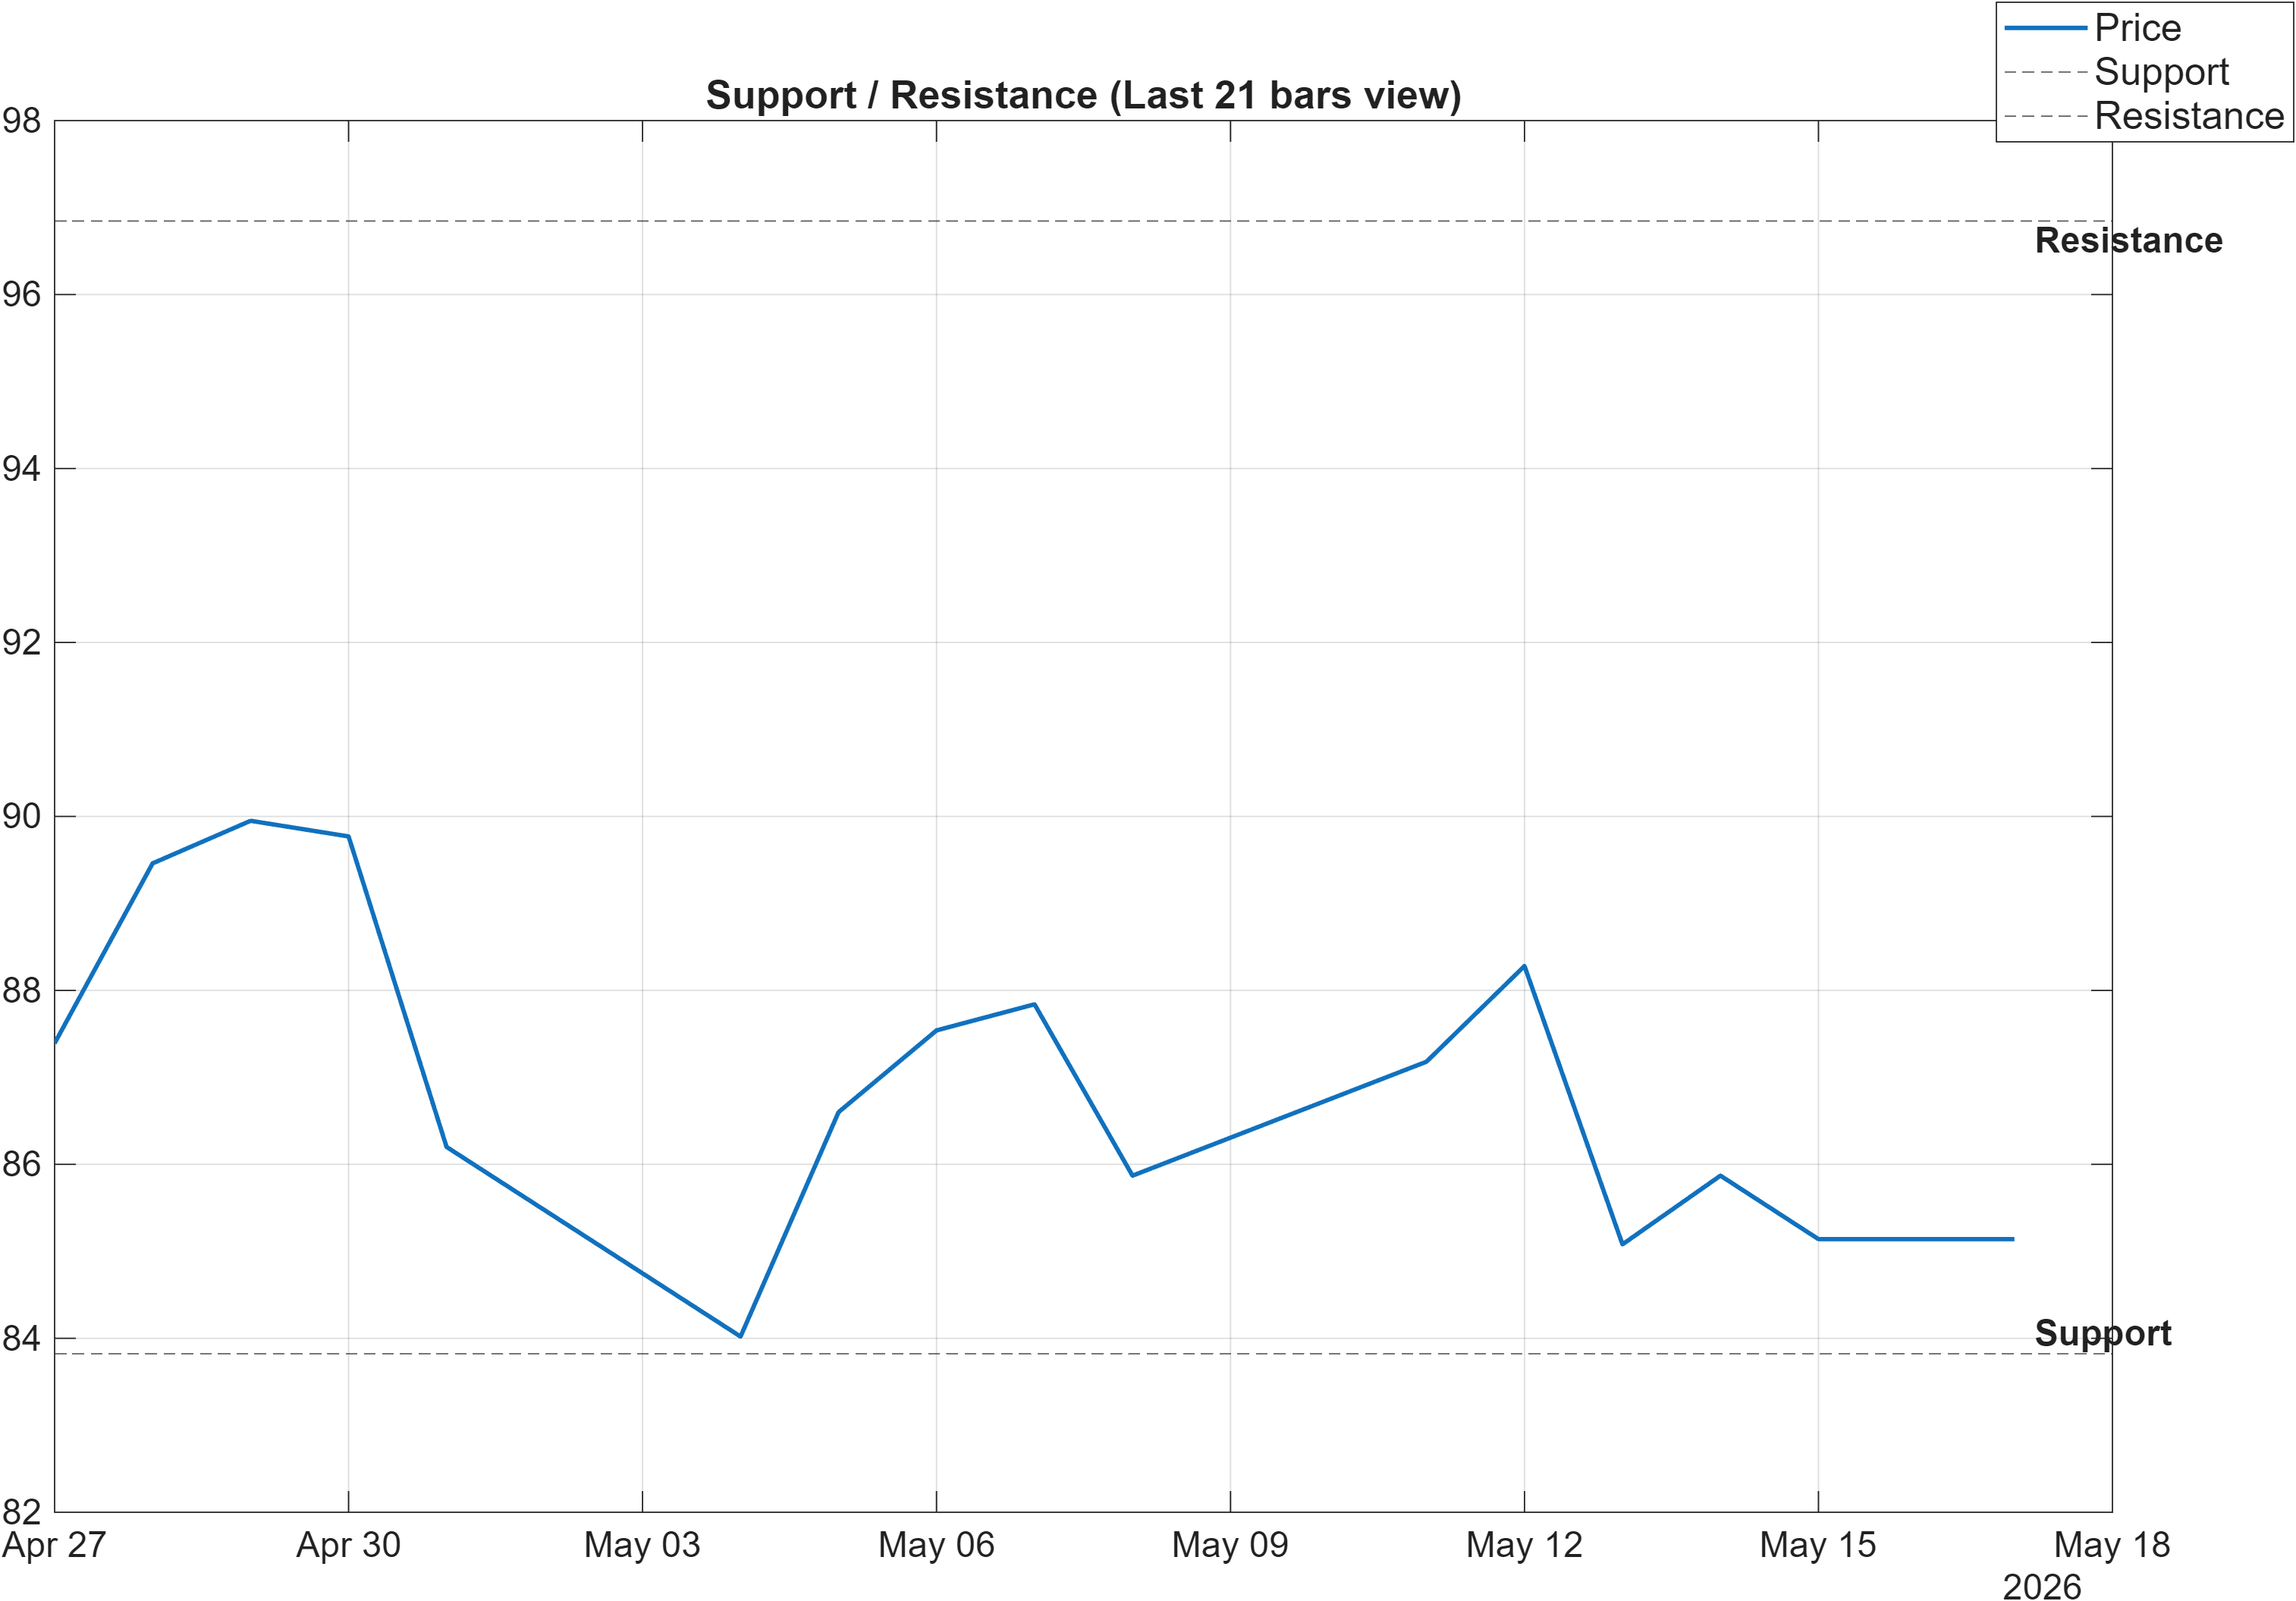
Scenario view: Break above resistance with volume → continuation. Close below support → signal deterioration risk.
The level structure is straightforward and fits the broader “neutral confluence” profile. Support at 83.8225 functions as the principal area where dip demand needs to remain visible to preserve the current constructive rank backdrop (e.g., Daily #32, 3-Monthly #21). A sustained close below that zone would not merely be a short-term drawdown; it would increase the probability that the monthly neutrality (#952) starts to influence shorter horizons.
Resistance at 96.8450 is the more consequential threshold for re-synchronizing the signal stack. Given the moving-average interpretation (close below MA50; MA50 below MA200), a decisive break and acceptance above resistance is the pathway most consistent with trend repair. In a tighter volatility regime (Bandwidth 0.0796), breaks can be sharper, but also more sensitive to false starts—making “with volume” a meaningful qualifier in the scenario framing.
Between these zones, the risk is signal churn: RSI near 51.44 can remain neutral for extended periods, while MACD histogram at -0.0869 can improve slowly without immediately turning positive. In that environment, support/resistance tends to be the most actionable structure for separating routine back-and-fill from a genuine regime transition.
Practically, the market is being asked to choose: either defend the lower boundary and rebuild upward pressure toward resistance, or lose support and shift the discussion from consolidation to deterioration.
5) Quant Technical Dashboard (18 Signals)
KGNAI AI Technical Analysis Score (Deep Reinforcement Learning): Rank #1266 out of 2052 (Rank 1 represents the strongest technical positioning and a higher probability of favorable price behavior. As ranks increase toward the maximum, the probability of favorable outcomes weakens and bearish positioning becomes more dominant.) | Label: Neutral | Score: -0.234
18-Signal Technical Confluence Score: -0.167 (Neutral)
Overall Technical Score (18-signal confluence + DRL rank blend): -0.187 (Neutral)
Note: The blended score reflects signal strength weighted against broader AI technical ranking, which may temporarily diverge.
Blended technical score breakdown: -0.187 (Neutral | Bull 5 / Bear 8 / Neutral 5)
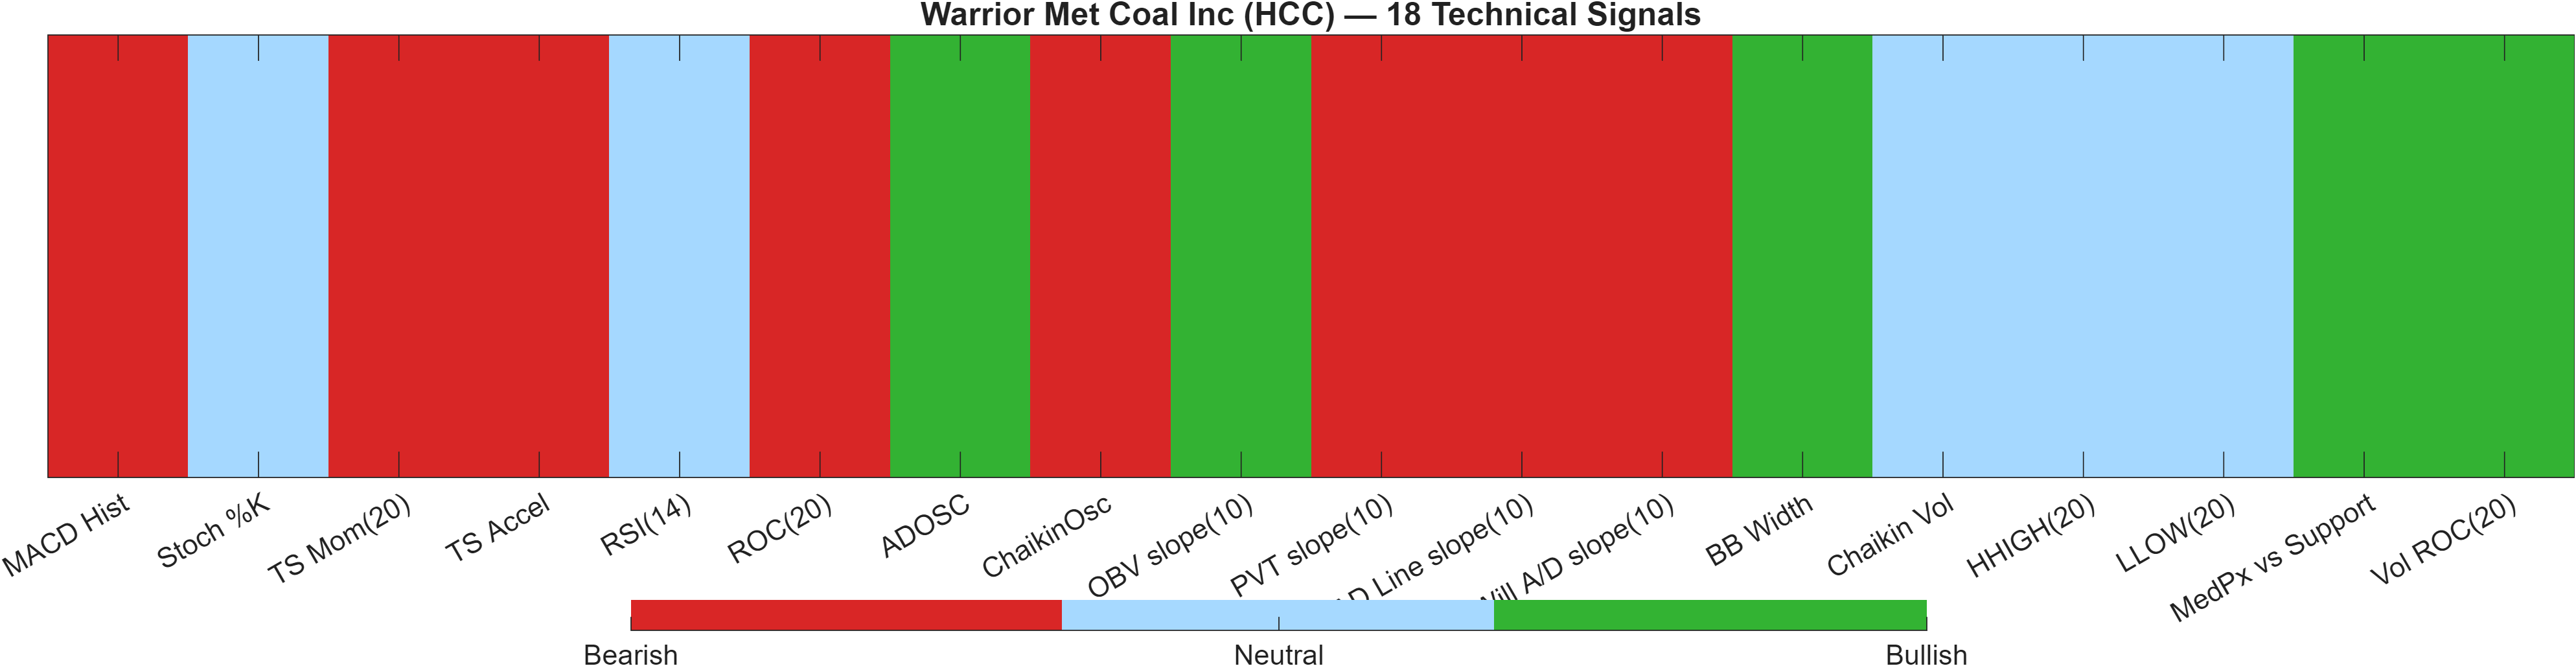
Signal table (Bull/Bear/Neutral)
| Indicator | Value | Signal |
|---|---|---|
| MACD Hist | -0.08692 | Bearish |
| Stoch %K | 26.92 | Neutral |
| TS Mom(20) | -4.4 | Bearish |
| TS Accel | -8.24 | Bearish |
| RSI(14) | 51.44 | Neutral |
| ROC(20) | -4.829 | Bearish |
| ADOSC | 75.55 | Bullish |
| ChaikinOsc | -1.596e+05 | Bearish |
| OBV slope(10) | 1.726e+06 | Bullish |
| PVT slope(10) | -2.057e+04 | Bearish |
| AD Line slope(10) | -1.427e+06 | Bearish |
| Will A/D slope(10) | -2.395 | Bearish |
| BB Width | 0.07958 | Bullish |
| Chaikin Vol | -34.28 | Neutral |
| HHIGH(20) | 91.57 | Neutral |
| LLOW(20) | 79.01 | Neutral |
| MedPx vs Support | 1.035 | Bullish |
| Vol ROC(20) | 12.47 | Bullish |
Interpretation: Indicator-level signals form the base confluence, which is then adjusted using a separate AI-driven technical ranking model. The final technical score summarizes this combined view.
The quant dashboard clarifies why the article’s stance is “bullish ranks vs neutral technicals.” The 18-signal confluence is -0.167 and the blended overall technical score is -0.187, both neutral. That neutrality is not driven by an absence of signals, but by an internal split: the breakdown shows Bear 8 versus Bull 5, with Neutral 5, keeping the aggregate score slightly negative without reaching a high-conviction bearish state.
Two aspects stand out. First is the momentum/price-change complex: MACD histogram is -0.08692 (bearish) and ROC(20) is -4.829 (bearish), consistent with the earlier reading that acceleration is not yet positive. Second is participation: there are selective constructive elements such as OBV slope(10) 1.726e+06 (bullish) and Vol ROC(20) 12.47 (bullish), suggesting that volume dynamics are not uniformly consistent with breakdown behavior.
The Deep Reinforcement Learning technical rank adds an additional moderation layer. At #1266 out of 2052 with a score of -0.234 (neutral), the DRL model is not corroborating a “technical strength” regime. In combination, these readings point to a market where signal compression is present: enough mixed evidence to avoid a directional technical label, but with level-based triggers (support/resistance) likely to determine which side resolves the neutrality.
6) News sentiment + extractive gist
Sentiment score (avg): 0.088 | Positive: 39% | Neutral: 55% | Negative: 6%
KGNAI AI News Sentiment Score (normalized -1 to +1): 0.99 (as of 2026-05-16) | Label: Bullish | Overall news score: 0.98
Positive Developments
Recent coverage across major financial outlets indicates a generally constructive tone around HCC, consistent with the model’s high normalized sentiment reading of 0.99 (as of 2026-05-16). The distribution shows 39% positive and only 6% negative, which can matter most when technicals are neutral and price is navigating defined zones. Commentary has leaned toward company-specific narratives and positioning discussions, which can support incremental demand during pullbacks—particularly when broader indicator alignment is mixed (overall technical score -0.187). In this setup, favorable sentiment is best interpreted as a contextual bias: it does not override bearish components like MACD histogram (-0.0869), but it can reduce the probability that a routine dip becomes a disorderly move if support near 83.8225 is tested.
Neutral / Mixed Developments
The neutral bucket remains the largest share at 55%, reinforcing that the information flow is not uniformly directional despite the bullish label on normalized sentiment. This often corresponds to market attention on valuation framing, investor repositioning, and incremental operational or sector updates rather than new, high-conviction catalysts. For HCC specifically, that mix is consistent with the broader analytical picture: ranks are strong (e.g., Daily #32, Yearly #18), yet trend indicators remain cautious (close vs MA50 bearish; MA50 vs MA200 bearish). In such conditions, neutral news flow tends to amplify the importance of technical confirmation—particularly whether price can approach and hold above 96.8450 rather than repeatedly failing near resistance.
Negative / Risk Signals
Negative coverage is comparatively limited at 6%, but it still provides useful risk framing because the technical stack is not fully supportive. When the 18-signal set contains more bearish than bullish signals (Bear 8 vs Bull 5), even a small increase in adverse narratives can coincide with quicker drawdowns—especially if volatility expands from the current Bandwidth reading of 0.0796. Risk-oriented commentary has generally focused on industry headwinds and the potential for sentiment to cool after strong prior moves, which is consistent with the idea that this is a regime validation market: if price closes below 83.8225, the news backdrop may not be sufficient to counteract technical deterioration.
- Whether sentiment remains constructive if price revisits 83.8225 support.
- Any shift in the positive/neutral/negative split away from 39% / 55% / 6%.
- Whether coverage tone changes alongside a break above 96.8450 with volume.
Sources referenced: Reuters, Bloomberg, Yahoo Finance, MarketWatch, Investing.com
7) Sources
Not available in the provided data.
You may also like: How KGNAI AI ranks instruments across global markets
Disclaimer: KGNAI provides AI-generated analytics and educational market commentary only. This is not financial advice. Markets involve risk. Always do your own research.