
VRDN (Viridian Therapeutics Inc) Technical & Sentiment Overview — 20-May-2026 | Bearish Rank Profile with Neutral Technical Confluence
Viridian Therapeutics Inc (VRDN) screens as persistently weak on KGNAI’s cross-sectional ranking framework as of 20-May-2026, with the daily rank at #2038 out of 2051 and similarly elevated ranks across weekly (#2034) and monthly (#1923) horizons—placing VRDN in the lower tail of the tracked universe. In contrast, the signal-level technical picture is more mixed: the 18-signal confluence score is 0.000 (Neutral) and the blended overall technical score is -0.174 (Neutral), indicating balance between bullish and bearish sub-signals even while broader rank pressure remains negative. Momentum reads lean cautious with RSI(14) at 29.9 and MACD histogram at -0.0297. Volatility is not exceptionally compressed, with Bollinger Bandwidth at 0.3518. Key decision zones remain support ~13.3275 and resistance ~26.3183. News analytics skew constructive on the normalized model (0.96), but price/participation signals still require confirmation.
- Rank stance: Short Bearish | Mid Bearish | Long Bearish
- Technical confluence: Neutral (18-signal score 0.000; blended -0.174)
- Key levels: Support ~13.3275 | Resistance ~26.3183
- News sentiment bias: Bullish on normalized score (0.96), while average sentiment is slightly negative (-0.011)
- Confirmation / invalidation: A break above 26.3183 with volume supports continuation; a close below 13.3275 raises deterioration risk.
KGNAI evaluates assets using large cross-sectional datasets built from millions of structured data points. Inputs incorporate fundamental metrics, technical structures, and systematically processed news sentiment. Statistical models, machine learning, and AI frameworks are used to assess relative positioning, signal alignment, and probabilistic behavior across broad universes.
- Ranks are comparative across the tracked universe, not absolute price targets.
- Confluence reflects alignment among independent signal groups.
- Support/resistance levels are probabilistic decision zones, not guarantees.
- Sentiment provides contextual bias within the broader analytical framework.
1) KGNAI AI Analysis
Region: USA
Total universe size: 2051 ranked instruments
- Daily rank: #2038 out of 2051 — Bearish
- Weekly rank: #2034 out of 2051 — Bearish
- Monthly rank: #1923 out of 2051 — Bearish
- 3-Monthly rank: #1886 out of 2051 — Bearish
- 6-Monthly rank: #1742 out of 2051 — Bearish
- Yearly rank: #1750 out of 2051 — Bearish
Cross-horizon persistence vs isolated shocks
VRDN’s ranking profile is notable for persistence rather than a single-horizon dislocation. With the daily rank at #2038/2051 and the weekly rank at #2034/2051, the short window is consistently in the weakest slice of the universe. The monthly (#1923) and 3-month (#1886) horizons remain comparably elevated, while the 6-month (#1742) and yearly (#1750) ranks show only modest improvement—still in the lower portion of the distribution.
This alignment across horizons suggests a regime where relative positioning has been structurally weak, not merely volatile. In practice, that tends to coincide with repeated failures to convert rebounds into sustained trend repair, even if tactical oscillators temporarily improve. The key analytical implication is that mean-reversion setups require stronger confirmation thresholds when the broader rank “gravity” remains negative.
The term view is uniformly Bearish (short, mid, and long), which frames subsequent technical readings as potential counter-trend signals rather than immediate trend endorsement. Any improvement in tactical indicators should be evaluated for follow-through—i.e., whether it can lift price structure through defined resistance and stabilize participation measures.
KGNAI ranks each instrument across large universes using multiple proprietary AI tests and statistical models (millions of data points). Lower ranks generally indicate stronger probability of favorable performance behavior, while higher ranks indicate weaker probability and more bearish positioning.
Term view: Short-term: Bearish. Mid-term: Bearish. Long-term: Bearish.
Want the full universe and complete rank tables? Unlock full access on KGNAI: https://www.kgnai.com/pricing
2) Price & trend overview
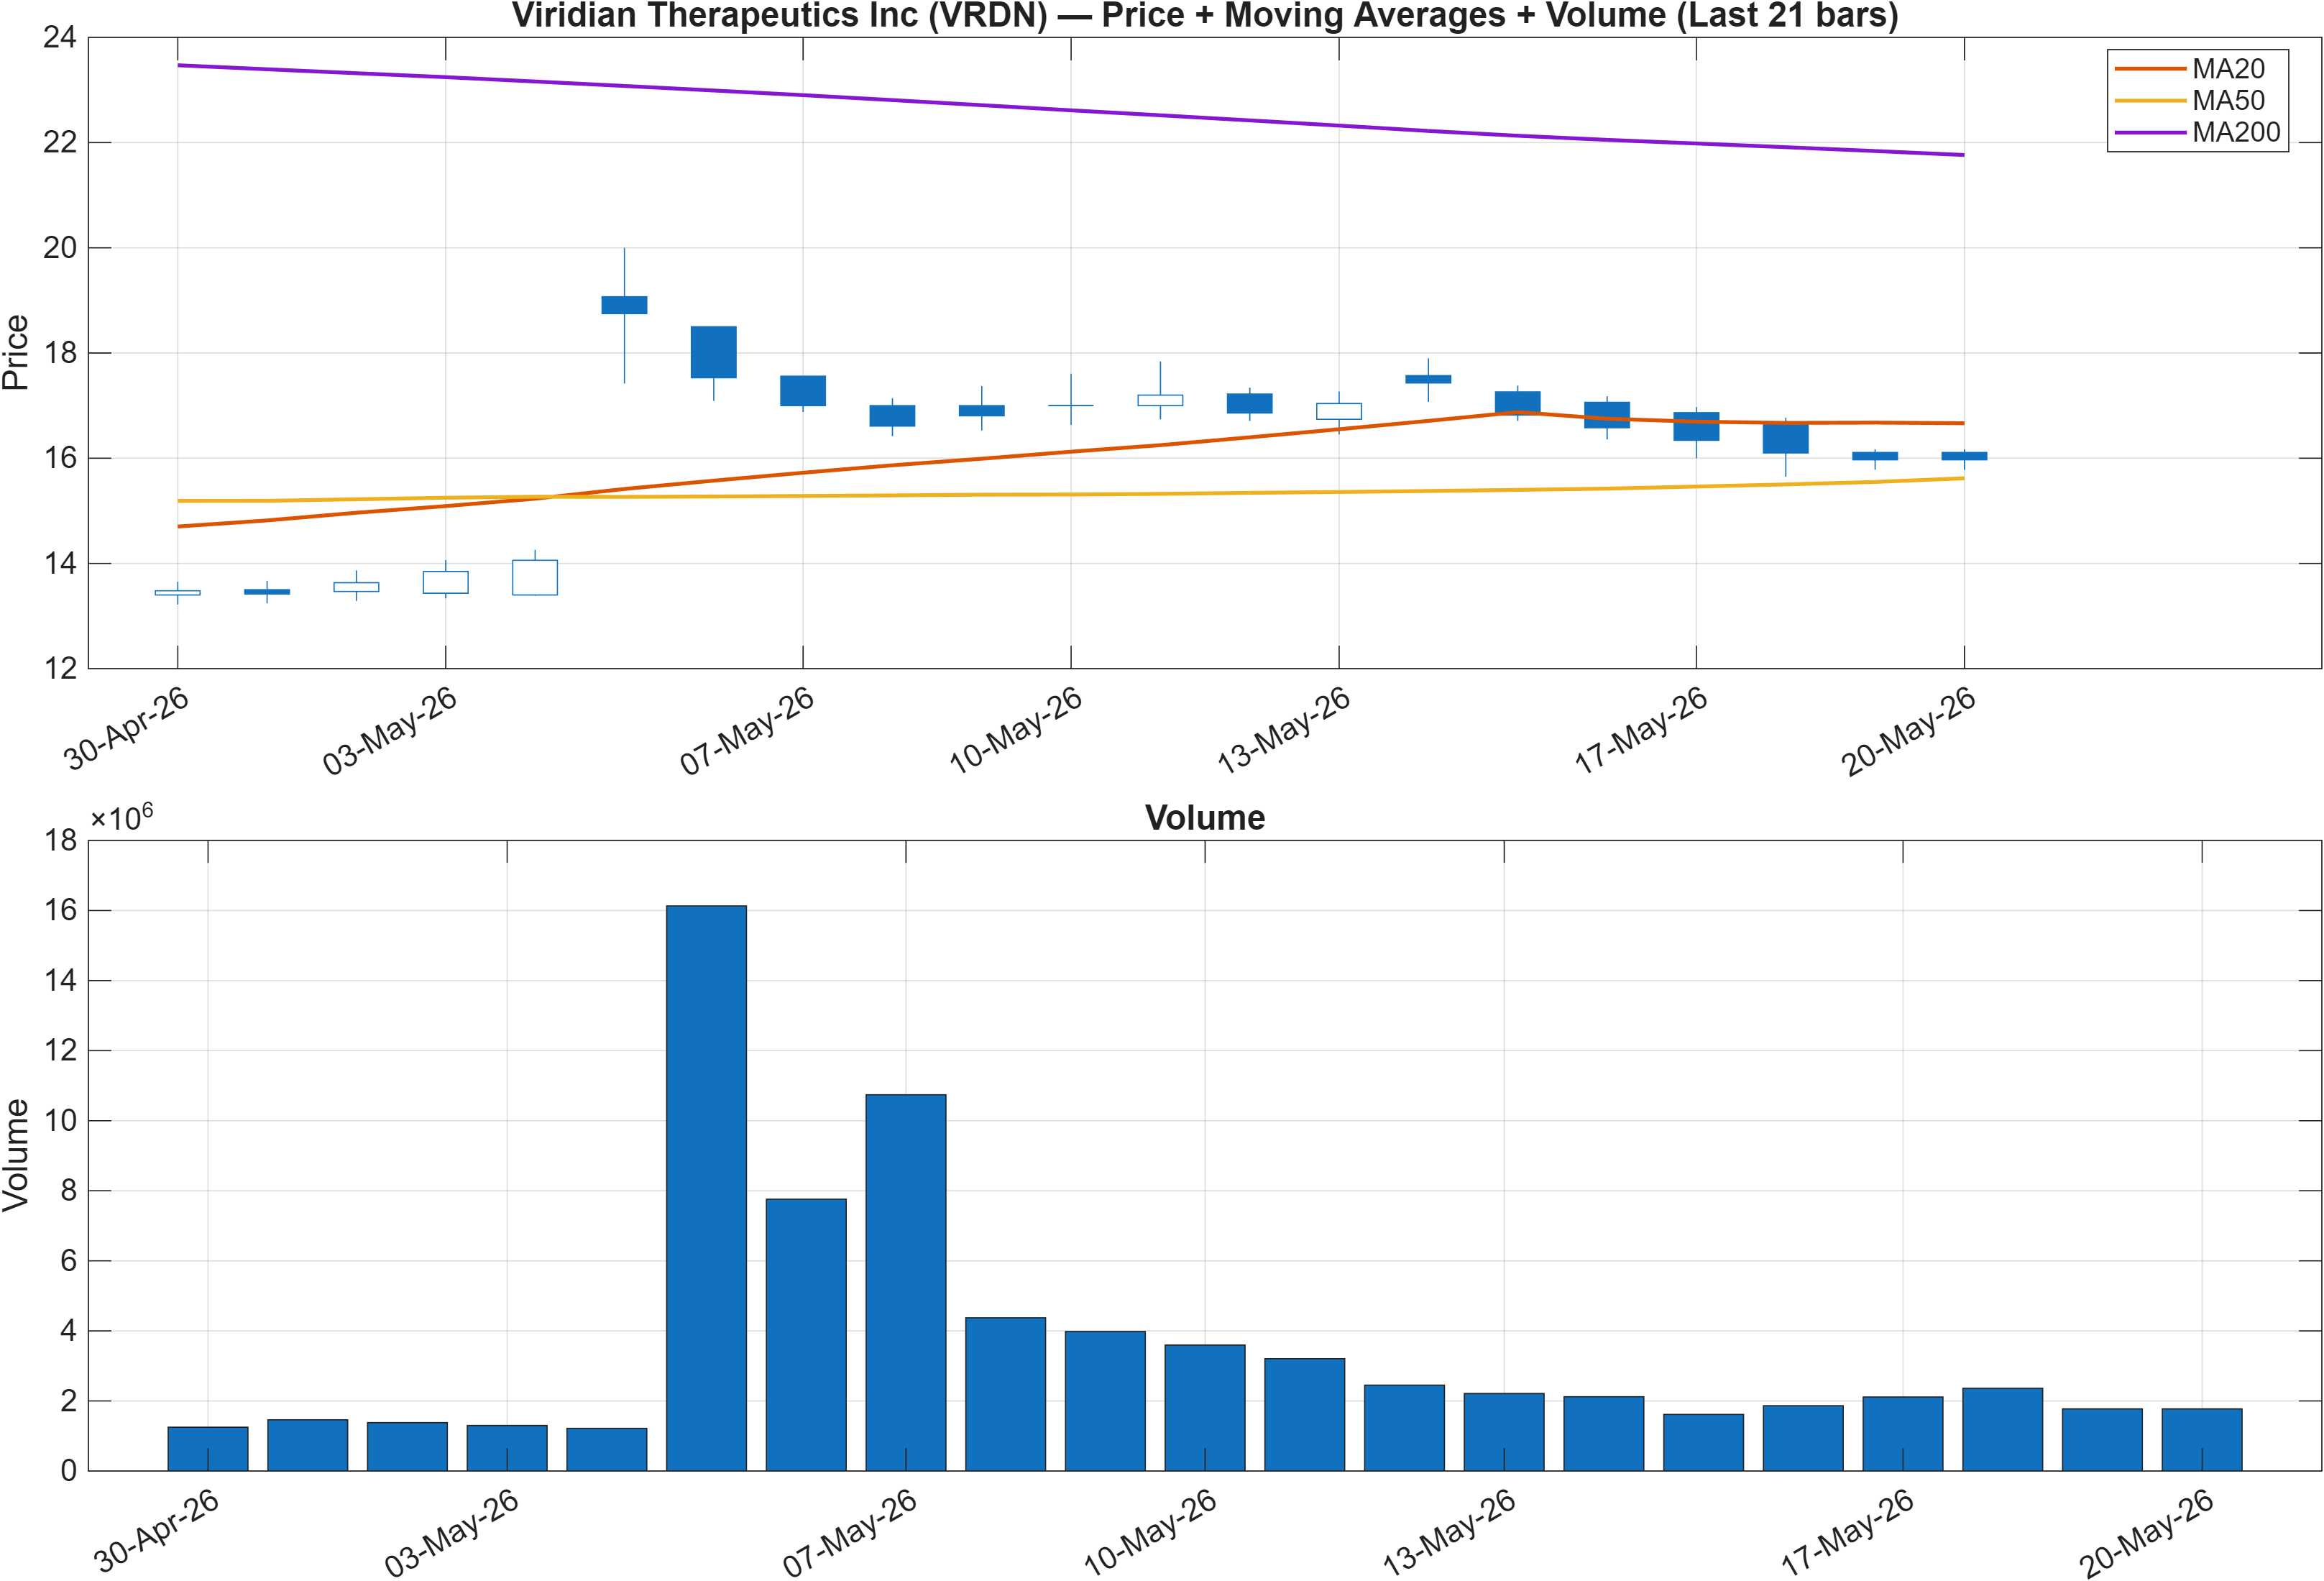
Interpretation: Close vs MA50 = Bullish, MA50 vs MA200 = Bearish.
Trend state: short-term lift vs longer-term drag
The moving-average configuration implies a market that can still produce short-term rebounds, while remaining challenged on the broader trend definition. With close vs MA50 labeled Bullish but MA50 vs MA200 labeled Bearish, VRDN is exhibiting a common “repair attempt” structure: price can trade above the intermediate average without yet re-establishing a longer-term uptrend.
This split often matters most around inflection zones where participants decide whether the rebound is a tradable bounce or the start of a durable trend transition. In VRDN’s case, the nearby macro structure is anchored by the reported support ~13.3275 and resistance ~26.3183. The distance between these zones is wide, which typically increases the importance of incremental checkpoints (e.g., successive higher lows) rather than a single “all-or-nothing” breakout narrative.
Price action should also be interpreted alongside ranking persistence. Even if price sits above MA50, the extremely weak cross-sectional ranks (e.g., #2038 daily) argue that trend quality has not yet translated into strong relative behavior versus the broader universe. That mismatch is often seen when rallies occur on limited participation or when prior supply remains overhead.
The most disciplined read is to treat the MA signal split as a conditional improvement: constructive for tactical stabilization, but not a confirmation of a regime change unless subsequent signals (momentum, volatility behavior, and level breaks) align.
3) Momentum & volatility dashboard
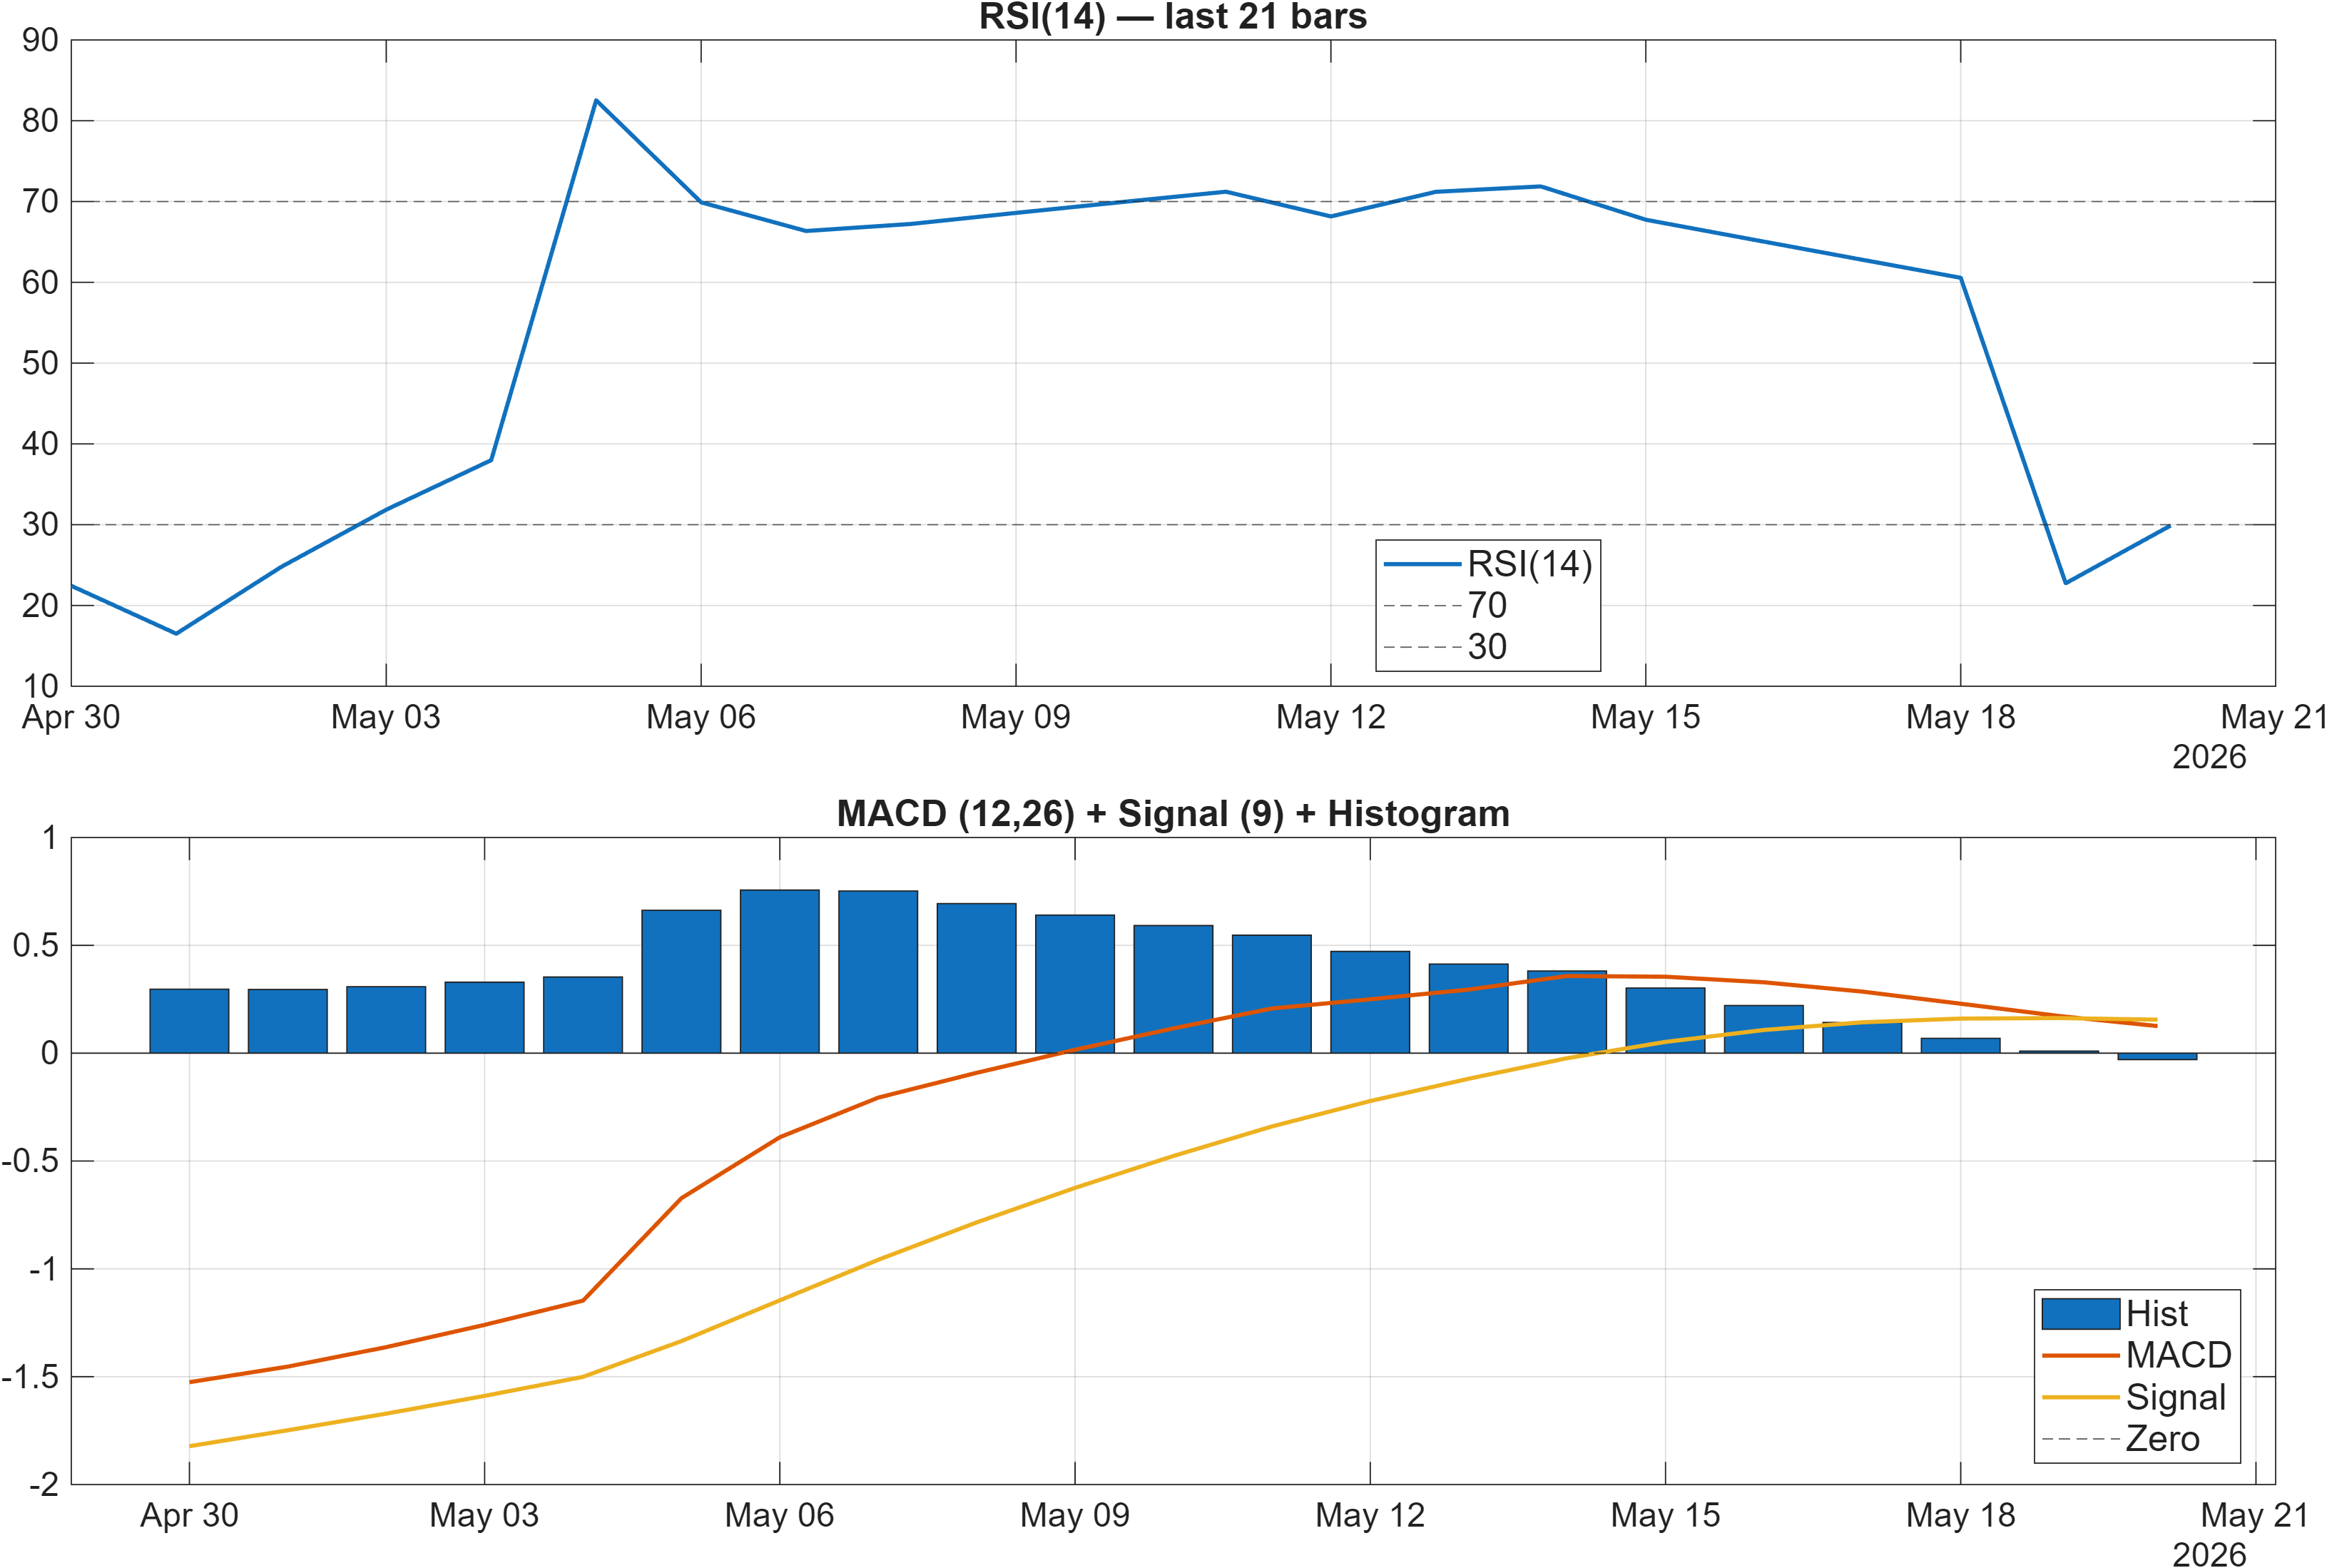
Interpretation: RSI bias = Bearish, MACD hist = -0.0297.
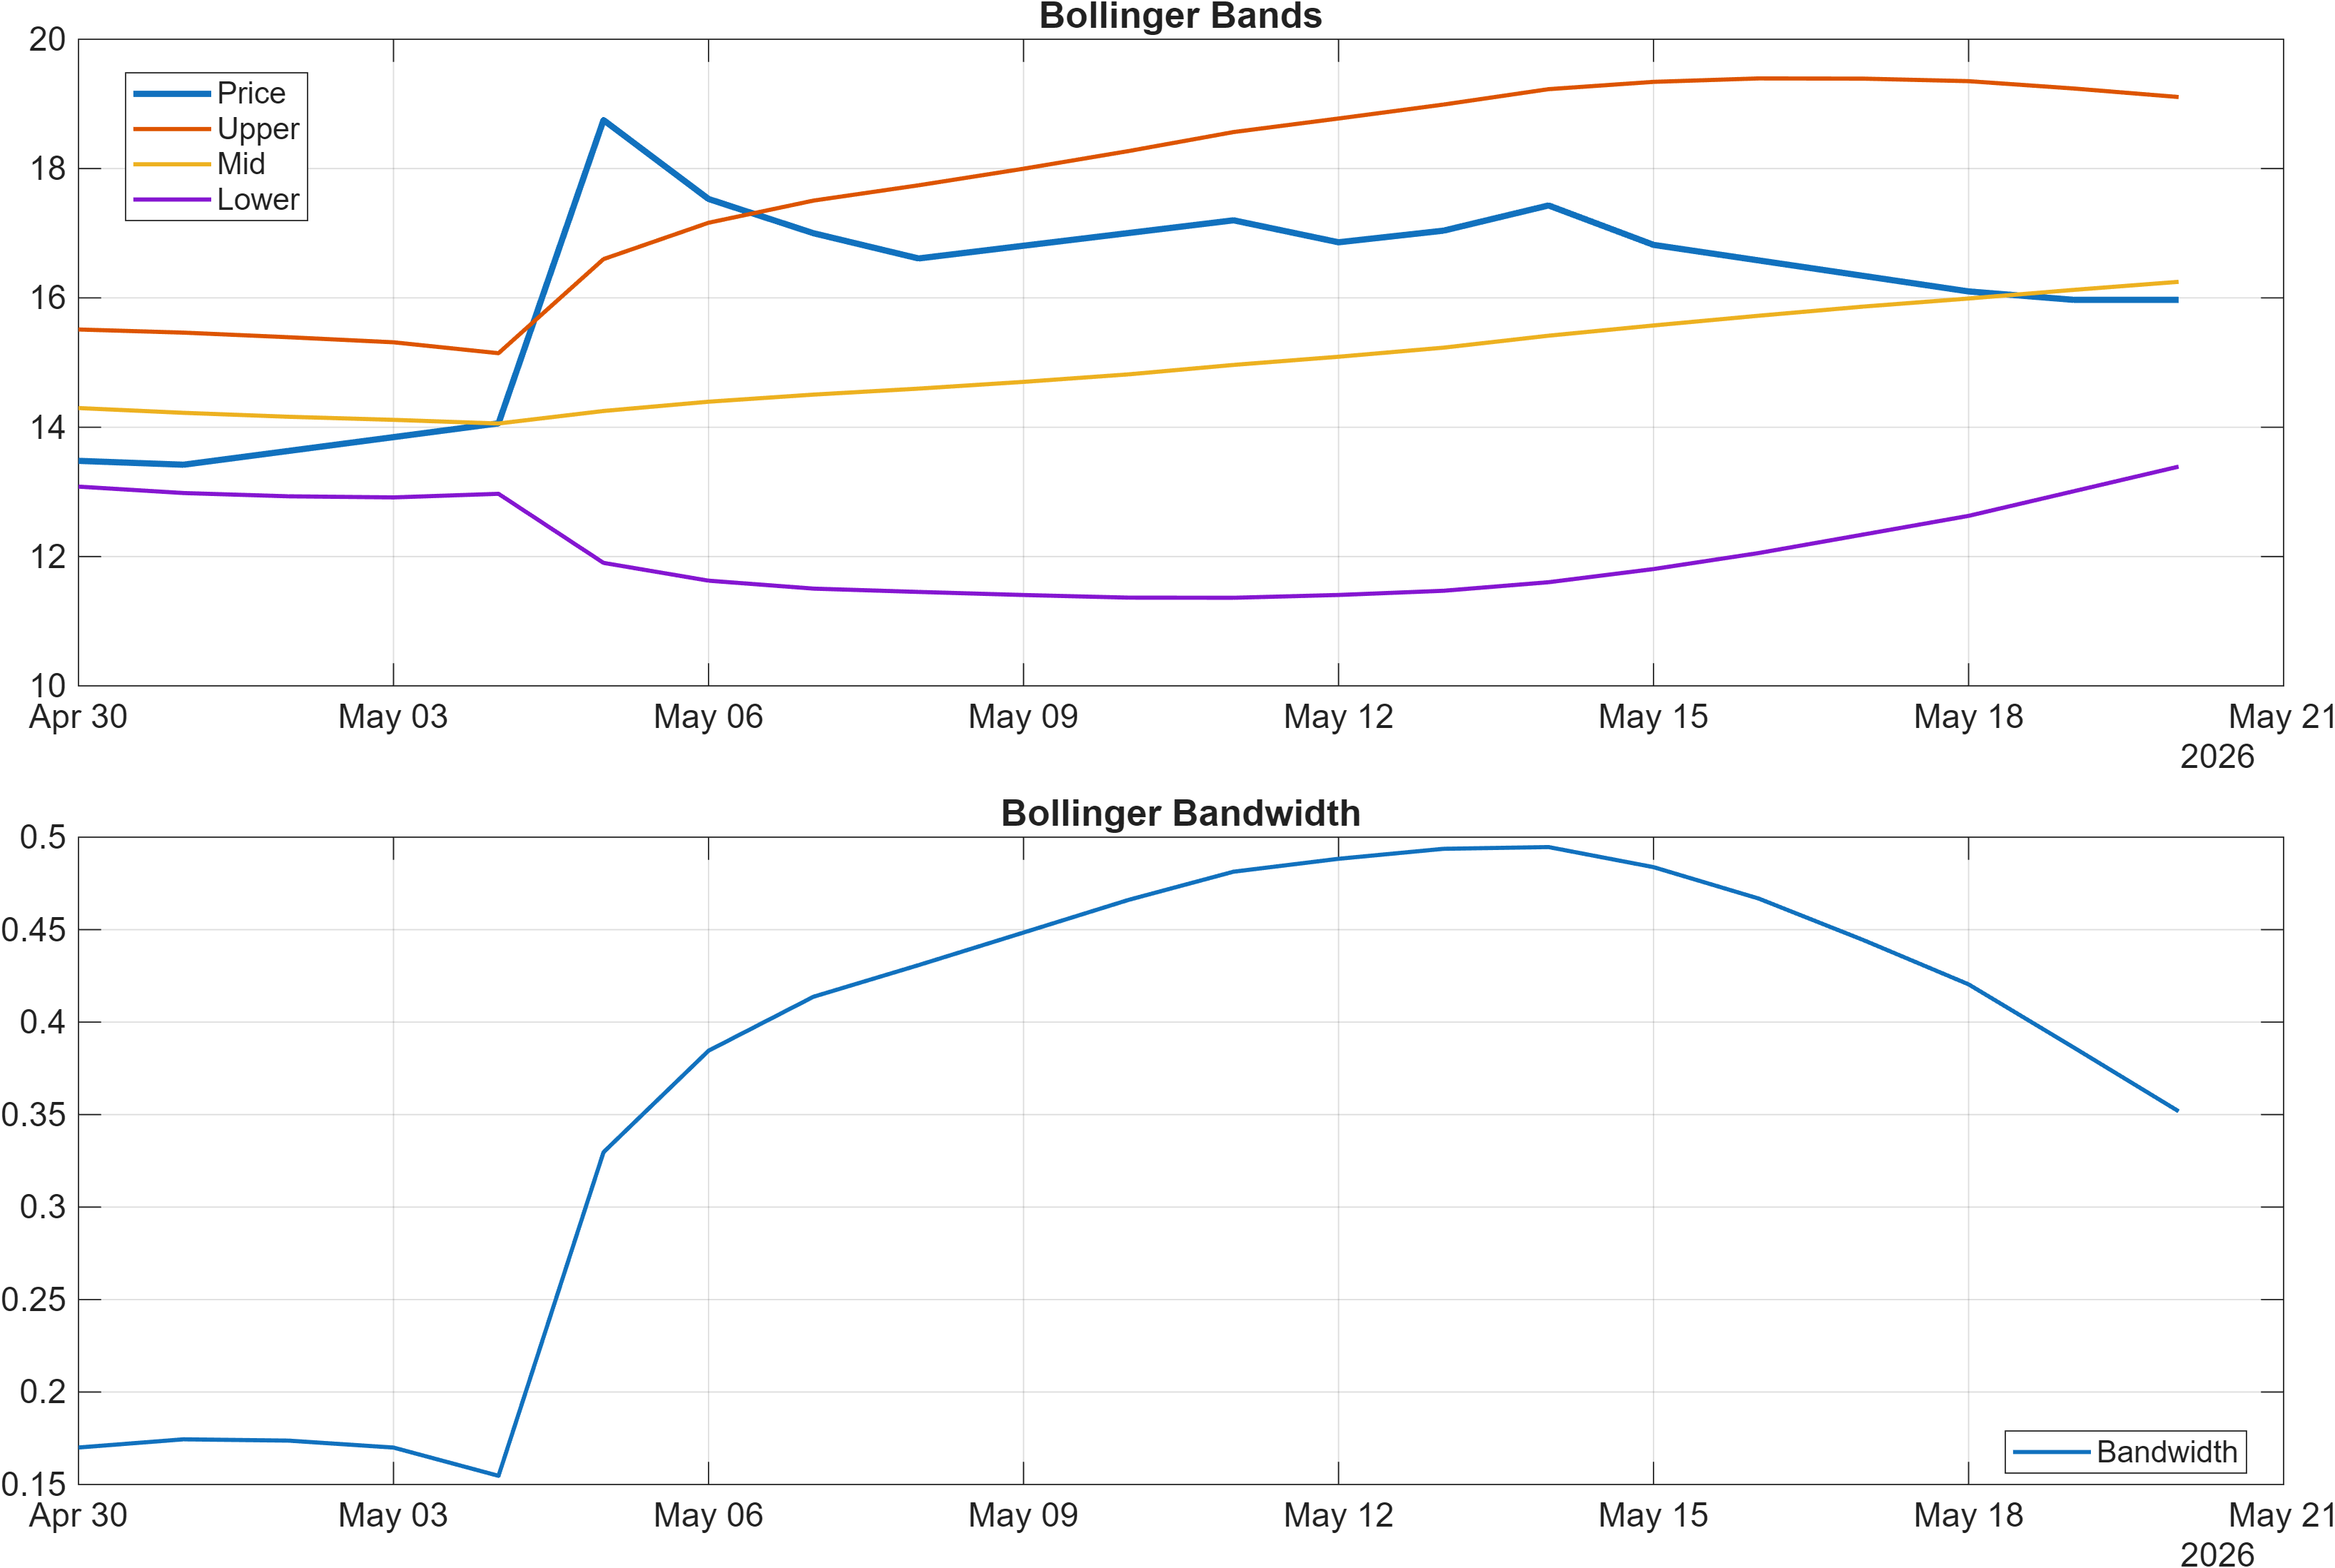
Interpretation: Bandwidth (volatility regime) latest = 0.3518.
Momentum: oversold conditions without MACD confirmation
Momentum conditions are mixed in a way that often produces choppy follow-through. The RSI(14) at 29.9 is consistent with weak or oversold-leaning momentum, aligning with the stated RSI bias = Bearish. At the same time, the MACD histogram at -0.0297 indicates negative momentum persistence rather than a clean bullish inflection. Taken together, this configuration can support short reflexive bounces, but it typically requires a subsequent MACD improvement to validate durability.
Volatility regime: not compressed enough to force directional resolution
Volatility, as proxied by Bollinger Bandwidth at 0.3518, is not presented as an extreme compression in the provided snapshot. That matters because the highest-probability “breakout” conditions often involve tightly compressed bands followed by a volatility expansion. Here, bandwidth suggests an environment where swings can occur, but where direction may remain contested unless price also clears key structural levels.
Signal interplay: rebound attempts vs rank headwind
The practical analytical tension is between oversold-style RSI and still-negative MACD, while broader ranks remain deep in the lower tail (daily #2038/2051). A more robust stabilization profile would typically show RSI lifting while MACD histogram moves toward zero and volatility behavior supports more orderly trend development.
4) Support / Resistance zones
Support ~ 13.3275 | Resistance ~ 26.3183
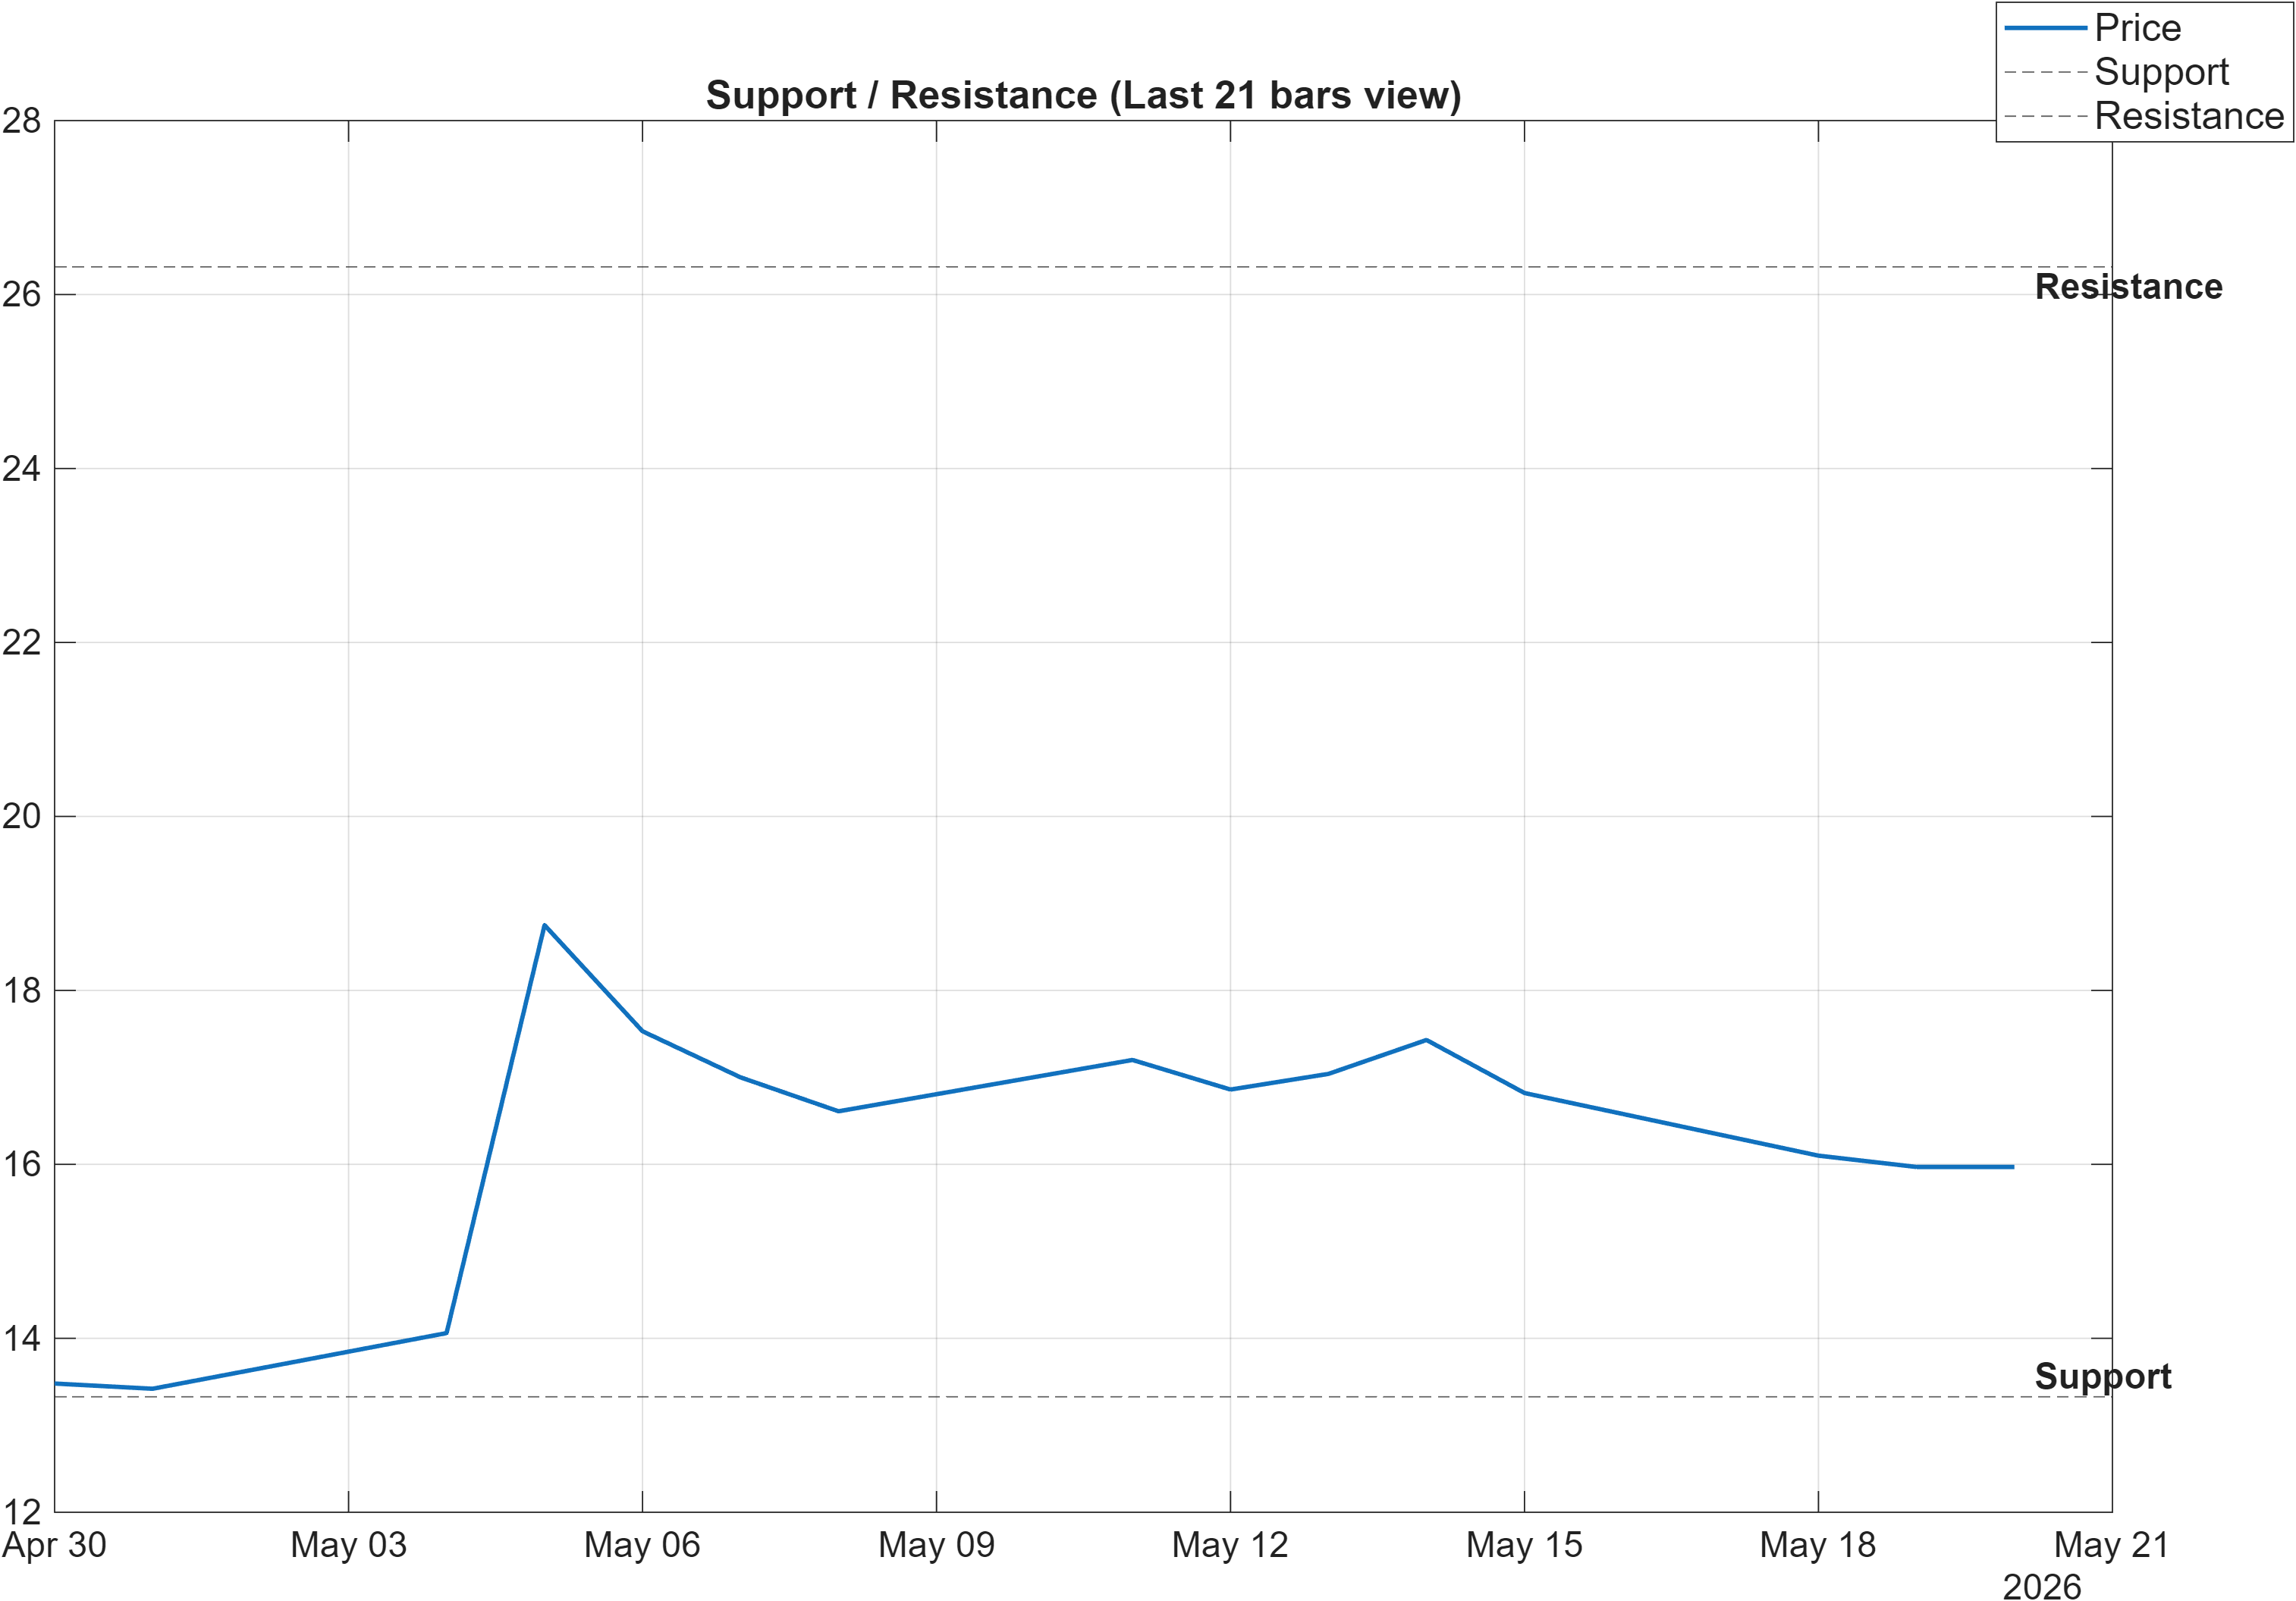
Scenario view: Break above resistance with volume → continuation. Close below support → signal deterioration risk.
Decision zones: asymmetric risk control around widely spaced levels
The defined levels—support ~13.3275 and resistance ~26.3183—create a wide operating range. When support and resistance are this far apart, signals tend to be most useful when they help identify whether price is building acceptance above support or repeatedly failing beneath overhead supply. The scenario framing provided is appropriately conditional: continuation requires a break above resistance with volume, while a close below support increases deterioration risk.
The level framework also helps reconcile conflicting inputs elsewhere in the report. For example, momentum is weak (RSI(14) 29.9, MACD histogram -0.0297), yet the blended technical score is still Neutral (-0.174). In that setup, levels tend to become the “tie-breaker”: a market can exhibit neutral multi-signal balance while still being directionally unresolved until it proves itself through a structural breach.
Volatility context supports the same read. With Bollinger Bandwidth at 0.3518 (not flagged as a highly compressed regime here), a clean level break may be less “forced” by volatility mechanics and more dependent on sustained participation.
From a process standpoint, the most decision-useful interpretation is to treat 13.3275 as the primary invalidation boundary for stabilization attempts, while 26.3183 represents the threshold where a broader trend repair could start to register across the cross-sectional ranks.
5) Quant Technical Dashboard (18 Signals)
KGNAI AI Technical Analysis Score (Deep Reinforcement Learning): Rank #1618 out of 2050 (Rank 1 represents the strongest technical positioning and a higher probability of favorable price behavior. As ranks increase toward the maximum, the probability of favorable outcomes weakens and bearish positioning becomes more dominant.) | Label: Neutral | Score: -0.579
18-Signal Technical Confluence Score: 0.000 (Neutral)
Overall Technical Score (18-signal confluence + DRL rank blend): -0.174 (Neutral)
Note: The blended score reflects signal strength weighted against broader AI technical ranking, which may temporarily diverge.
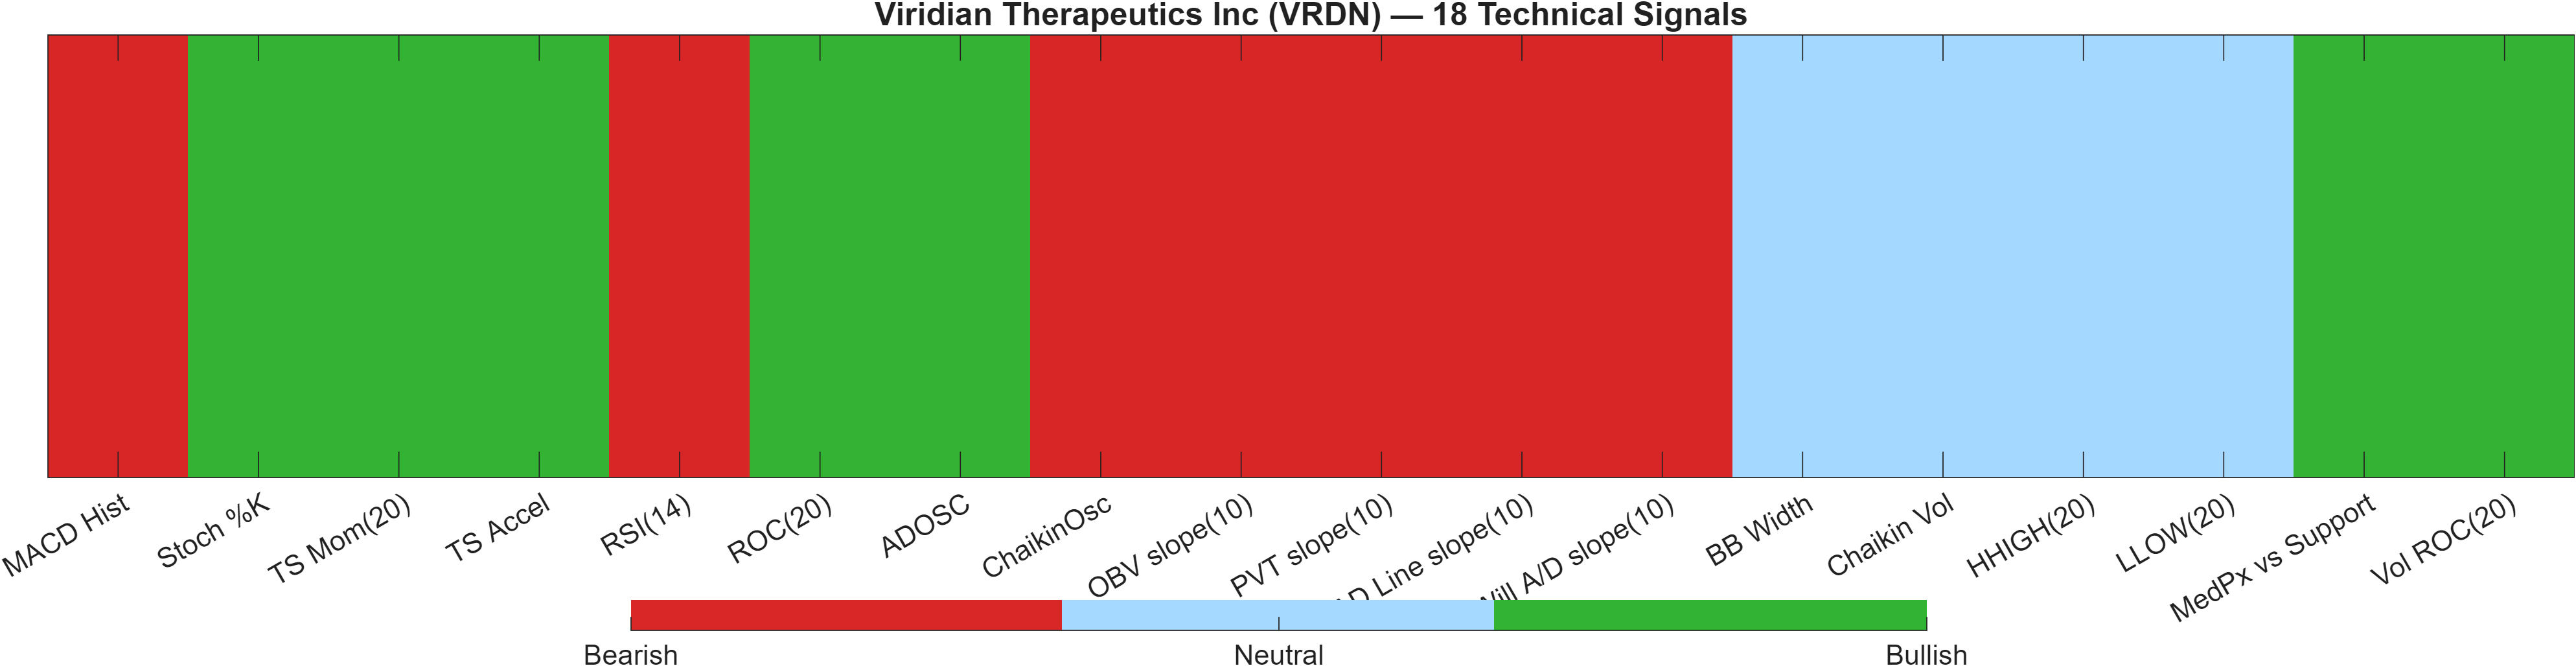
Blended technical score breakdown: -0.174 (Neutral | Bull 7 / Bear 7 / Neutral 4)
Signal blend: balanced micro-signals vs weaker model-ranked structure
VRDN’s dashboard is best characterized as internally balanced at the indicator layer, but still constrained by weaker technical positioning in the separate AI ranking model. The confluence score is 0.000 (Neutral), and the blend remains Neutral (-0.174) with an even split (Bull 7 / Bear 7 / Neutral 4). That symmetry typically implies a market where timing signals exist on both sides, but conviction is limited until a smaller set of indicators becomes dominant.
The Deep Reinforcement Learning technical rank at #1618 out of 2050 (score -0.579, labeled Neutral) leans toward the weaker side of the distribution even if not outright bearish by label. This is a key divergence: a neutral confluence can coexist with a poorer “quality of trend” assessment when the model emphasizes broader structural properties beyond point-in-time oscillator readings.
Within the indicator mix, momentum and participation are not uniformly supportive. The MACD histogram (-0.0297) and RSI(14) at 29.9 sit on the cautious end, while selected short-term momentum/oscillator measures register constructive (e.g., Stoch %K at 14.22 reads bullish in the table). This combination often produces sharp, tactical reversals that still fail to migrate into durable trend repair unless volume/flow measures stabilize.
Overall, the dashboard argues for treating VRDN’s technical state as range-bound and conditional: neutral confluence is not a bullish thesis on its own, particularly when cross-sectional ranks remain in the universe’s weakest tail.
Signal table (Bull/Bear/Neutral)
| Indicator | Value | Signal |
|---|---|---|
| MACD Hist | -0.0297 | Bearish |
| Stoch %K | 14.22 | Bullish |
| TS Mom(20) | 2.55 | Bullish |
| TS Accel | 3.98 | Bullish |
| RSI(14) | 29.9 | Bearish |
| ROC(20) | 19 | Bullish |
| ADOSC | 32.05 | Bullish |
| ChaikinOsc | -2.14e+06 | Bearish |
| OBV slope(10) | -4.638e+06 | Bearish |
| PVT slope(10) | -1.019e+05 | Bearish |
| AD Line slope(10) | -4.258e+06 | Bearish |
| Will A/D slope(10) | -1.754 | Bearish |
| BB Width | 0.3518 | Neutral |
| Chaikin Vol | -23.94 | Neutral |
| HHIGH(20) | 20 | Neutral |
| LLOW(20) | 13.24 | Neutral |
| MedPx vs Support | 2.648 | Bullish |
| Vol ROC(20) | 21.31 | Bullish |
Interpretation: Indicator-level signals form the base confluence, which is then adjusted using a separate AI-driven technical ranking model. The final technical score summarizes this combined view.
6) News sentiment + extractive gist
Sentiment score (avg): -0.011 | Positive: 19% | Neutral: 56% | Negative: 26%
KGNAI AI News Sentiment Score (normalized -1 to +1): 0.96 (as of 2026-05-19) | Label: Bullish | Overall news score: 0.84
Positive Developments
Recent coverage across major financial outlets indicates a constructive narrative centered on late-stage program progress and supportive analyst framing. The news analytics reflect this with a normalized sentiment score of 0.96 (labeled Bullish) and an overall news score of 0.84. While the average sentiment score is only slightly negative (-0.011), the distribution still shows meaningful positive coverage (19%) within a majority neutral mix (56%). In a market-structure sense, that blend can act as a stabilizer: a steady stream of informational updates combined with occasional constructive catalysts can help reduce “information vacuum” risk and sustain attention. However, for a sentiment tailwind to convert into price persistence, it typically needs reinforcement from participation and trend measures—areas where VRDN’s broader ranks remain weak (e.g., #2038 daily), keeping the overall setup conditional rather than decisive.
Neutral / Mixed Developments
Mixed items in the tape appear to cluster around financing and positioning updates alongside clinical or corporate communications. That kind of flow often reads as structurally neutral for near-term price direction: it can improve balance-sheet flexibility and extend runway, but it can also introduce supply and re-pricing dynamics that delay trend repair. The sentiment composition supports this interpretation—56% neutral coverage suggests market participants are processing developments without forming a uniform directional view. This aligns with the technical picture: the 18-signal confluence score is 0.000 (Neutral) and the blended technical score is -0.174 (Neutral), implying that even with constructive narrative elements, price-based confirmation remains the gating factor.
Negative / Risk Signals
Risk-oriented coverage includes items that can weigh on investor perception, particularly where losses, estimate revisions, or positioning changes are highlighted. Even with bullish-normalized news scoring, the sentiment breakdown still includes 26% negative coverage, which is material enough to matter when the price structure is fragile. From a trading-read perspective, negative items tend to have greater impact when momentum is already weak—consistent with RSI(14) at 29.9 and a MACD histogram of -0.0297. In that context, downside narratives can reinforce risk-off behavior into support tests, while upside narratives may struggle to generate sustained follow-through without a technical regime shift. The cleanest way to contextualize the risk balance is to treat sentiment as a bias input, with levels (13.3275 support; 26.3183 resistance) as the validation mechanism.
- Whether sentiment stays constructive while price holds 13.3275 without repeated breakdown attempts.
- Any shift in momentum confirmation, particularly MACD histogram improving from -0.0297 toward zero.
- Evidence of acceptance above 26.3183 alongside stronger participation signals.
Sources referenced: Reuters, Bloomberg, Yahoo Finance, MarketWatch, Investing.com
Snapshot: AI Rank (Short–Mid–Long): Bearish (Bearish–Bearish–Bearish) · Technical Confluence: Neutral · Key Levels: Support ~13.33 | Resistance ~26.32 · News Sentiment: Neutral
7) Sources
Not available in the provided data.
You may also like: How KGNAI AI ranks instruments across global markets
Disclaimer: KGNAI provides AI-generated analytics and educational market commentary only. This is not financial advice. Markets involve risk. Always do your own research.