
HCC (Warrior Met Coal Inc) Technical & Rank Review — 24-May-2026 | Constructive Ranks vs Bearish Technical Confluence
Warrior Met Coal Inc (HCC) presents a notable cross-signal setup: KGNAI’s cross-sectional ranks are strongly supportive on key horizons, while traditional technical confluence remains bearish. In the ranked universe of 2049 instruments, HCC’s daily rank (#7) and 3-month and yearly ranks (#21 each) place it in the top tier of the model’s relative positioning, suggesting favorable probabilistic behavior versus peers. At the same time, trend structure shows close vs MA50 = Bearish and MA50 vs MA200 = Bearish, with momentum measures leaning soft (e.g., RSI(14) 36.01 and MACD histogram -0.1240). Price-location risk is framed by support ~82.6417 and resistance ~96.3425. News sentiment is modestly positive in scoring (avg 0.088) but mostly neutral in distribution (55% neutral), making confirmation from price/volume behavior particularly relevant around the key levels.
- Short / Mid / Long rank stance: Bullish / Neutral / Bullish (daily #7, monthly #728, yearly #21 out of 2049).
- Technical confluence label: Bearish (18-signal confluence -0.333; overall technical score -0.527).
- Key levels: Support 82.6417 | Resistance 96.3425.
- News sentiment bias: Mildly constructive score (0.088) with predominantly neutral mix (55% neutral; 6% negative).
- Confirmation / invalidation condition: A break above 96.3425 with volume supports continuation; a close below 82.6417 increases deterioration risk.
What KGNAI Measures
KGNAI evaluates assets using large cross-sectional datasets built from millions of structured data points. Inputs incorporate fundamental metrics, technical structures, and systematically processed news sentiment. Statistical models, machine learning, and AI frameworks are used to assess relative positioning, signal alignment, and probabilistic behavior across broad universes.
How to Read This Report
- Ranks are comparative across the tracked universe, not absolute price targets.
- Confluence reflects alignment among independent signal groups.
- Support/resistance levels are probabilistic decision zones, not guarantees.
- Sentiment provides contextual bias within the broader analytical framework.
1) KGNAI AI Analysis
Region: USA
Total universe size: 2049 ranked instruments
- Daily rank: #7 out of 2049 — Bullish
- Weekly rank: #313 out of 2049 — Bullish
- Monthly rank: #728 out of 2049 — Neutral
- 3-Monthly rank: #21 out of 2049 — Bullish
- 6-Monthly rank: #260 out of 2049 — Bullish
- Yearly rank: #21 out of 2049 — Bullish
The rank stack for HCC is front-loaded with strength despite uneven mid-horizon placement. The daily rank (#7) places HCC in the top decile of the entire 2049-instrument universe, and the 3-monthly and yearly ranks (#21 each) reinforce that the model sees persistence in relative behavior beyond short bursts. Weekly and 6-month horizons remain supportive (#313 and #260), consistent with a market profile that can outperform peers even if the price chart is still repairing.
The key friction point sits in the mid-term: the monthly rank (#728) is Neutral. That combination often occurs when cross-sectional factors (relative strength vs the universe, regime fit, and distribution characteristics) are improving faster than the traditional “trend-following” picture. Put differently, KGNAI’s comparative tests are flagging HCC as well-positioned versus alternatives, but the one-month window has not fully confirmed that shift as a stable trend state.
Term framing in the provided data is explicit: Short-term Bullish, Mid-term Neutral, Long-term Bullish. The practical read is not a forecast, but a probabilistic hierarchy: the model’s strongest conviction is on the shortest and longest horizons, while the monthly window remains the primary zone where confirmation is still being negotiated.
2) Price & trend overview
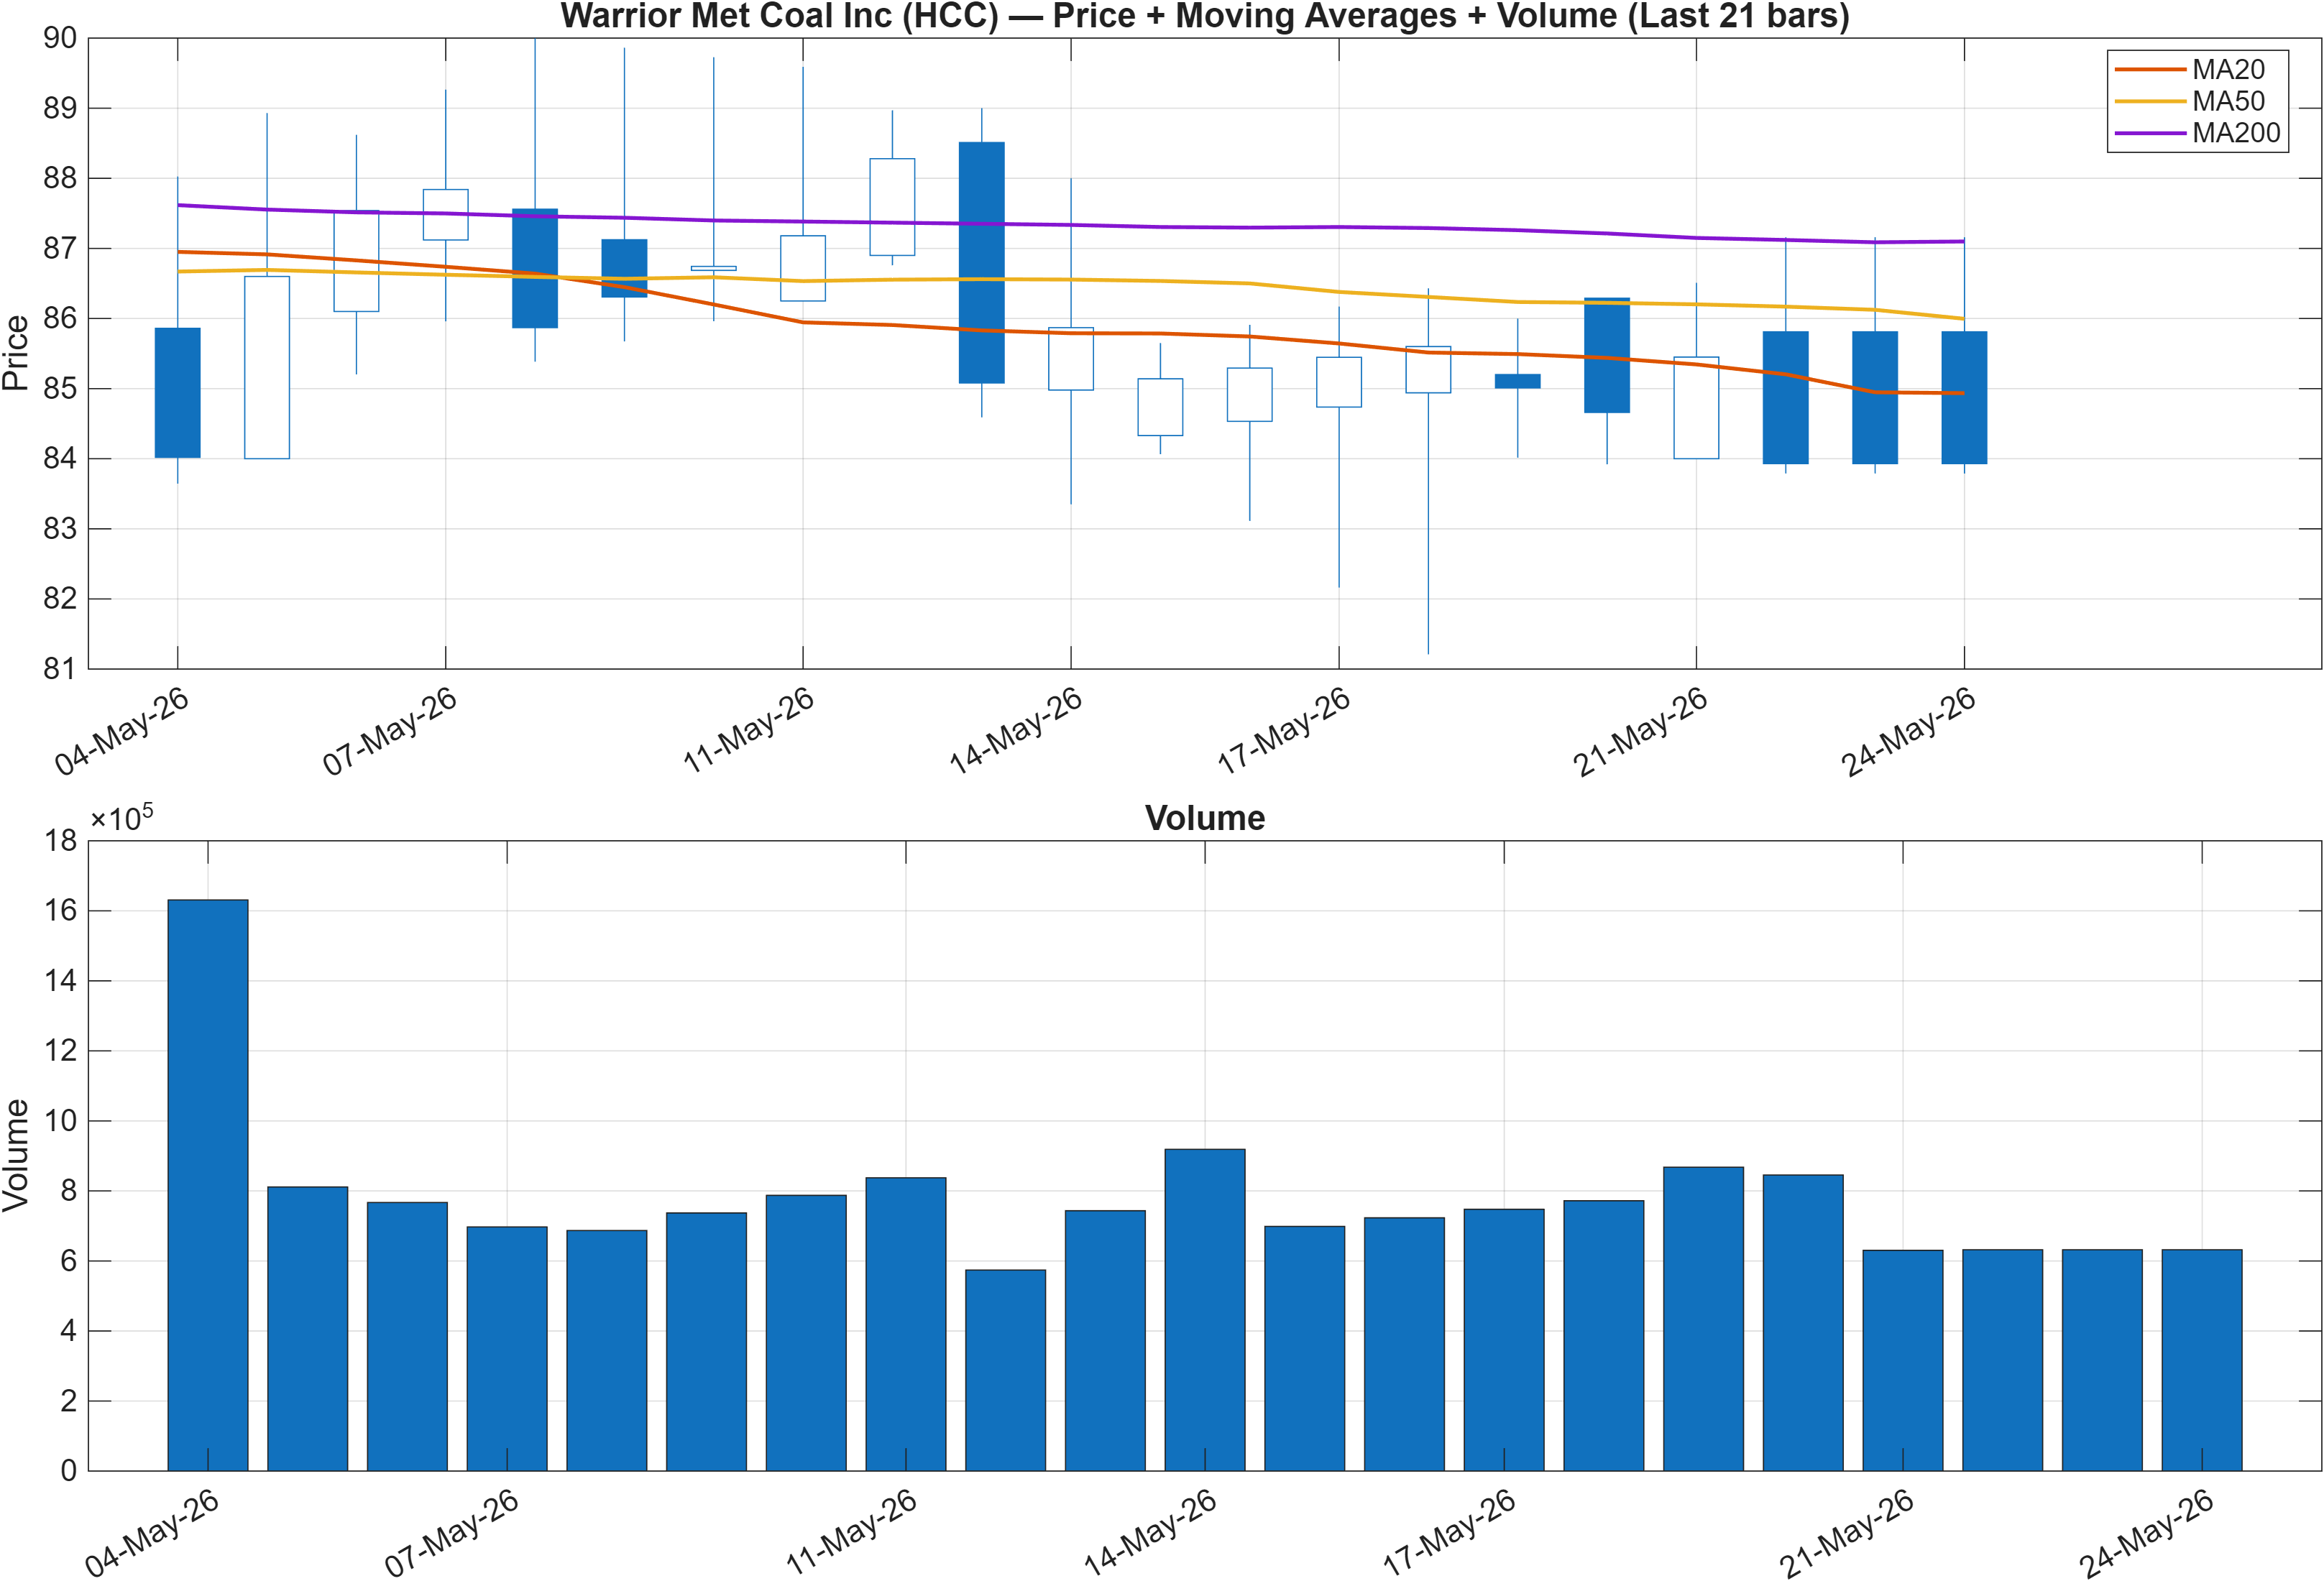
Interpretation: Close vs MA50 = Bearish, MA50 vs MA200 = Bearish.
Trend state: repair process vs regime shift
The moving-average configuration is unambiguous: price below the MA50 and MA50 below the MA200 keeps the trend template in a bearish regime. That matters because it defines the baseline “cost of proof” for any constructive thesis—trend systems typically require sustained closes back above intermediate averages before they recognize a transition.
However, the broader report context introduces a tension: KGNAI’s daily rank (#7) and yearly rank (#21) indicate the instrument is behaving favorably relative to the broader universe even while trend structure remains negative. This type of split often appears when a decline is losing marginal downside follow-through versus peers, or when selective accumulation begins before the moving averages respond.
The nearby level map gives the trend state a concrete boundary. With support ~82.6417 and resistance ~96.3425, the current regime can be assessed as “trend-repair inside a defined range.” A decisive move above the resistance zone would more credibly challenge the bearish MA stack, while acceptance below support would align the price structure with the bearish signal set seen elsewhere in the dashboard (including negative momentum readings).
Volume is presented in Figure 1, and the report’s scenario language explicitly ties breakout validity to participation: a break above resistance “with volume” is treated as continuation evidence, reinforcing the idea that trend confirmation is conditional rather than assumed.
3) Momentum & volatility dashboard
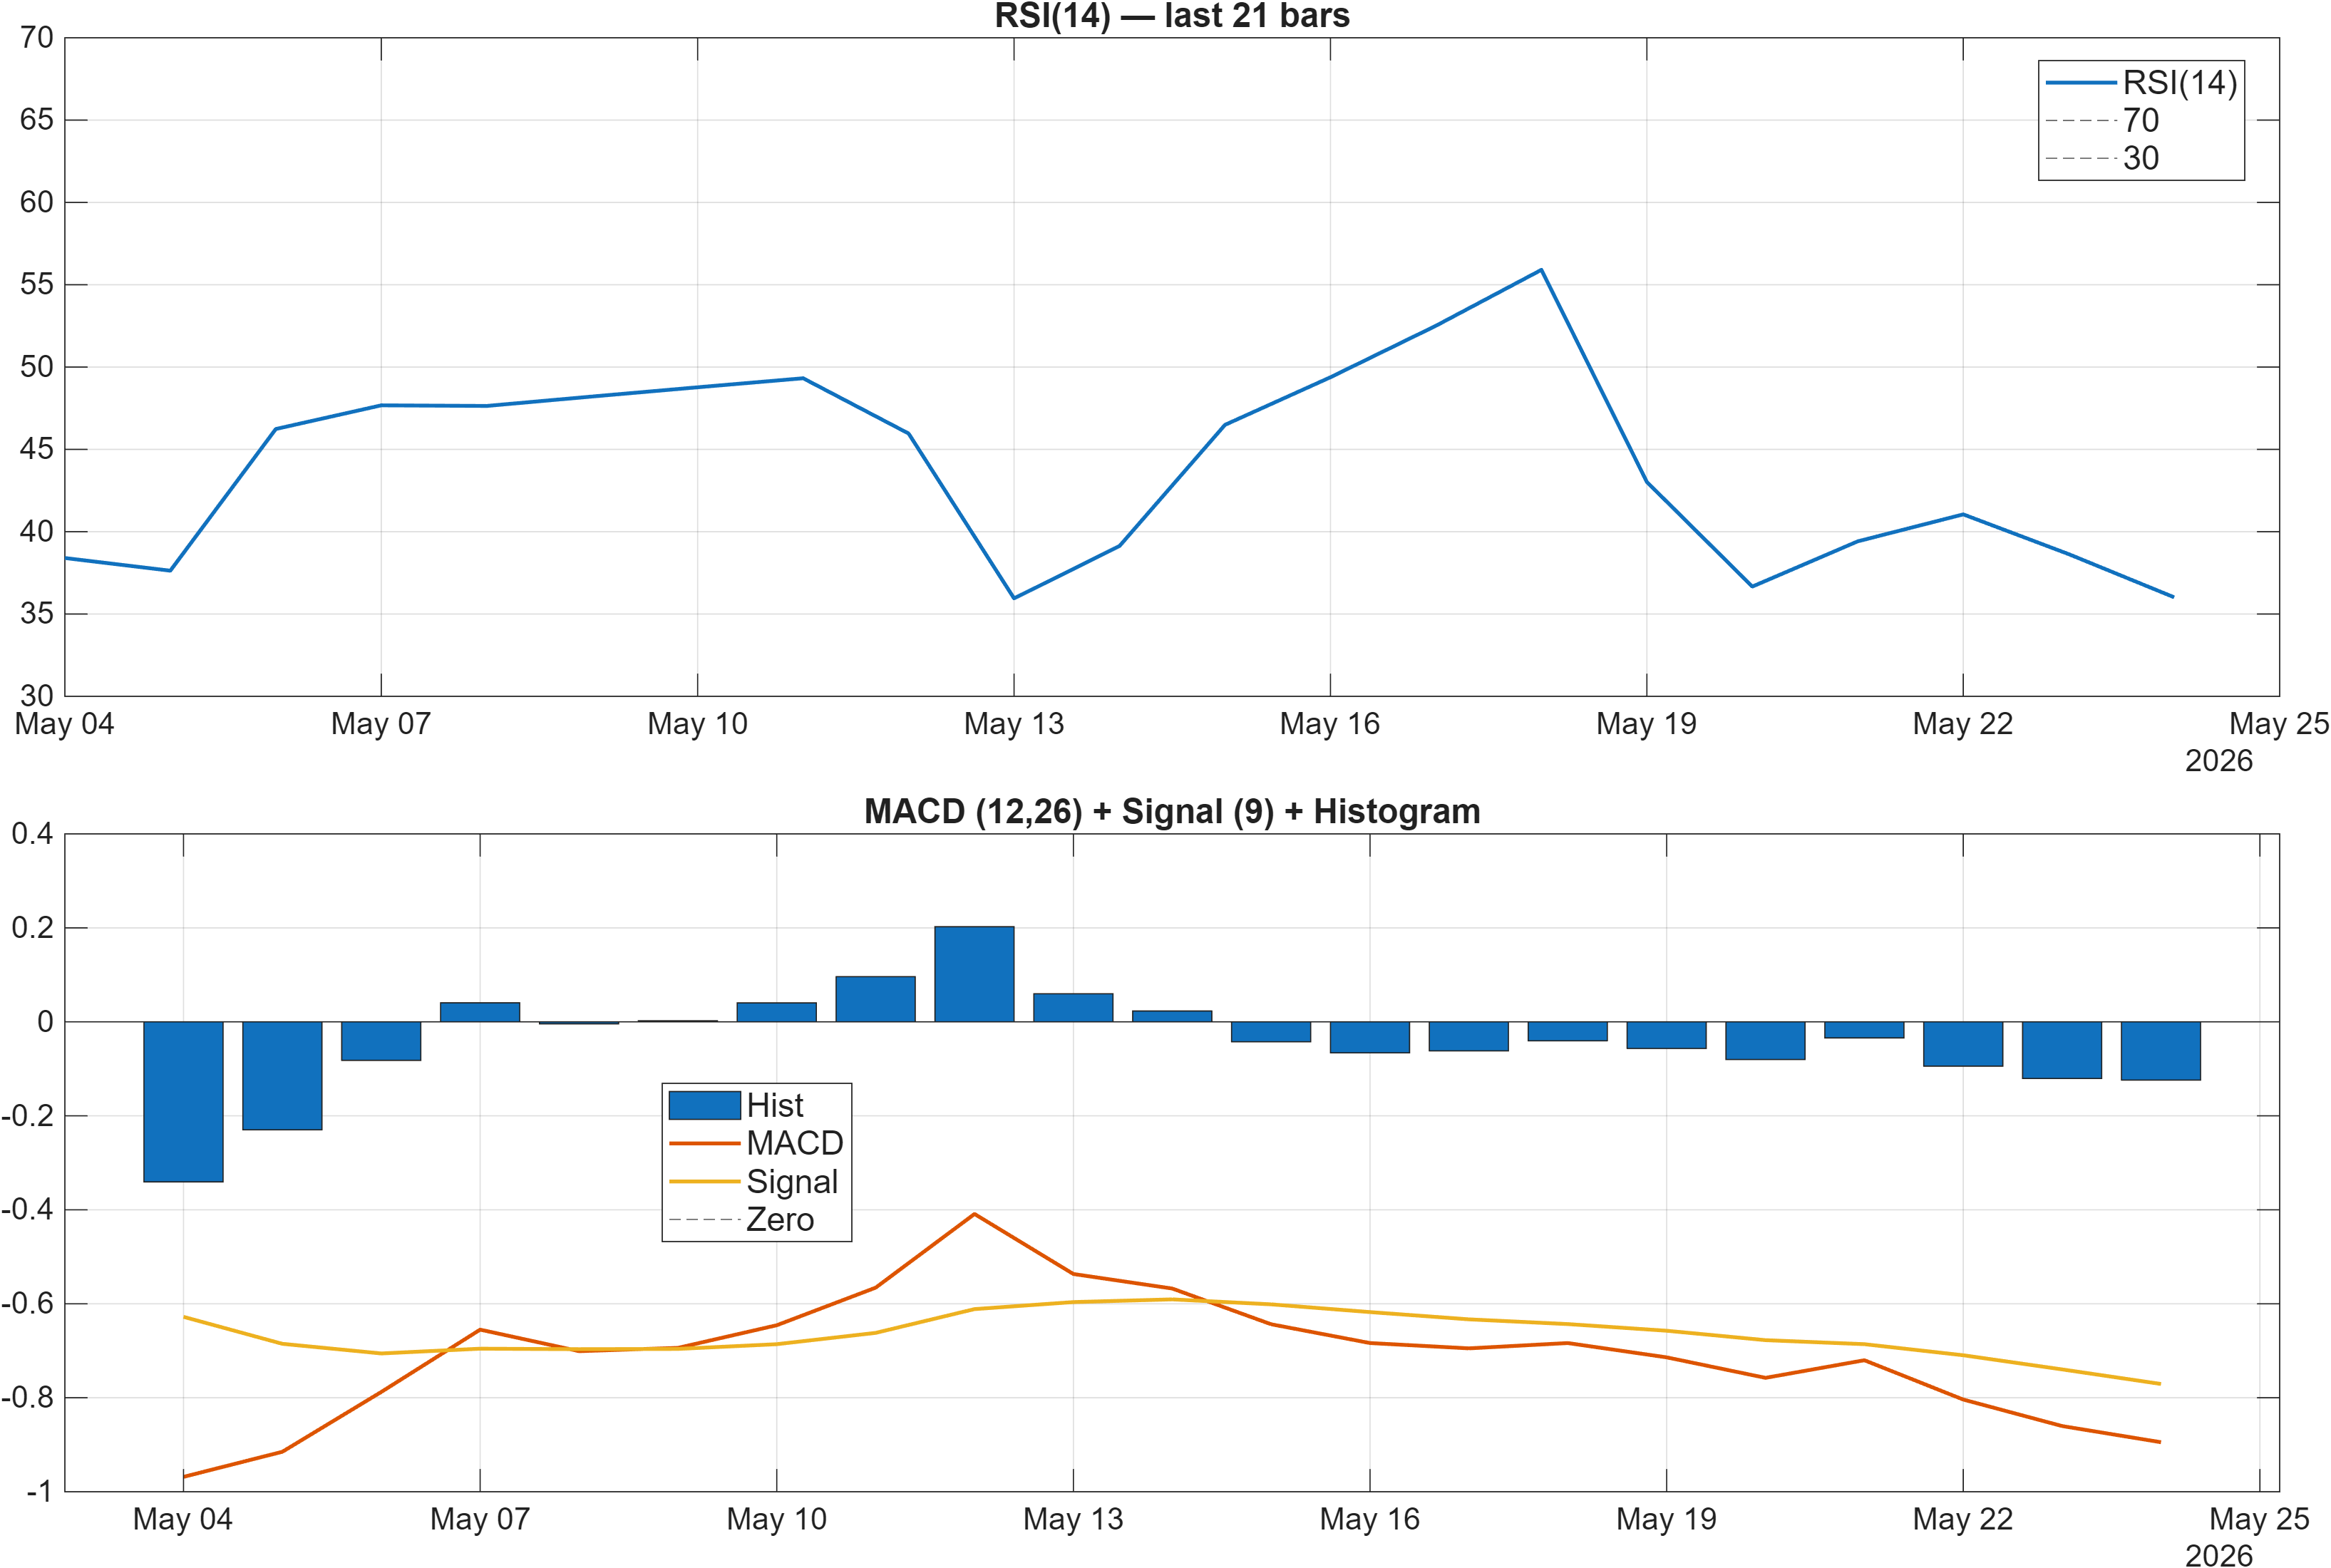
Interpretation: RSI bias = Bearish, MACD hist = -0.1240.
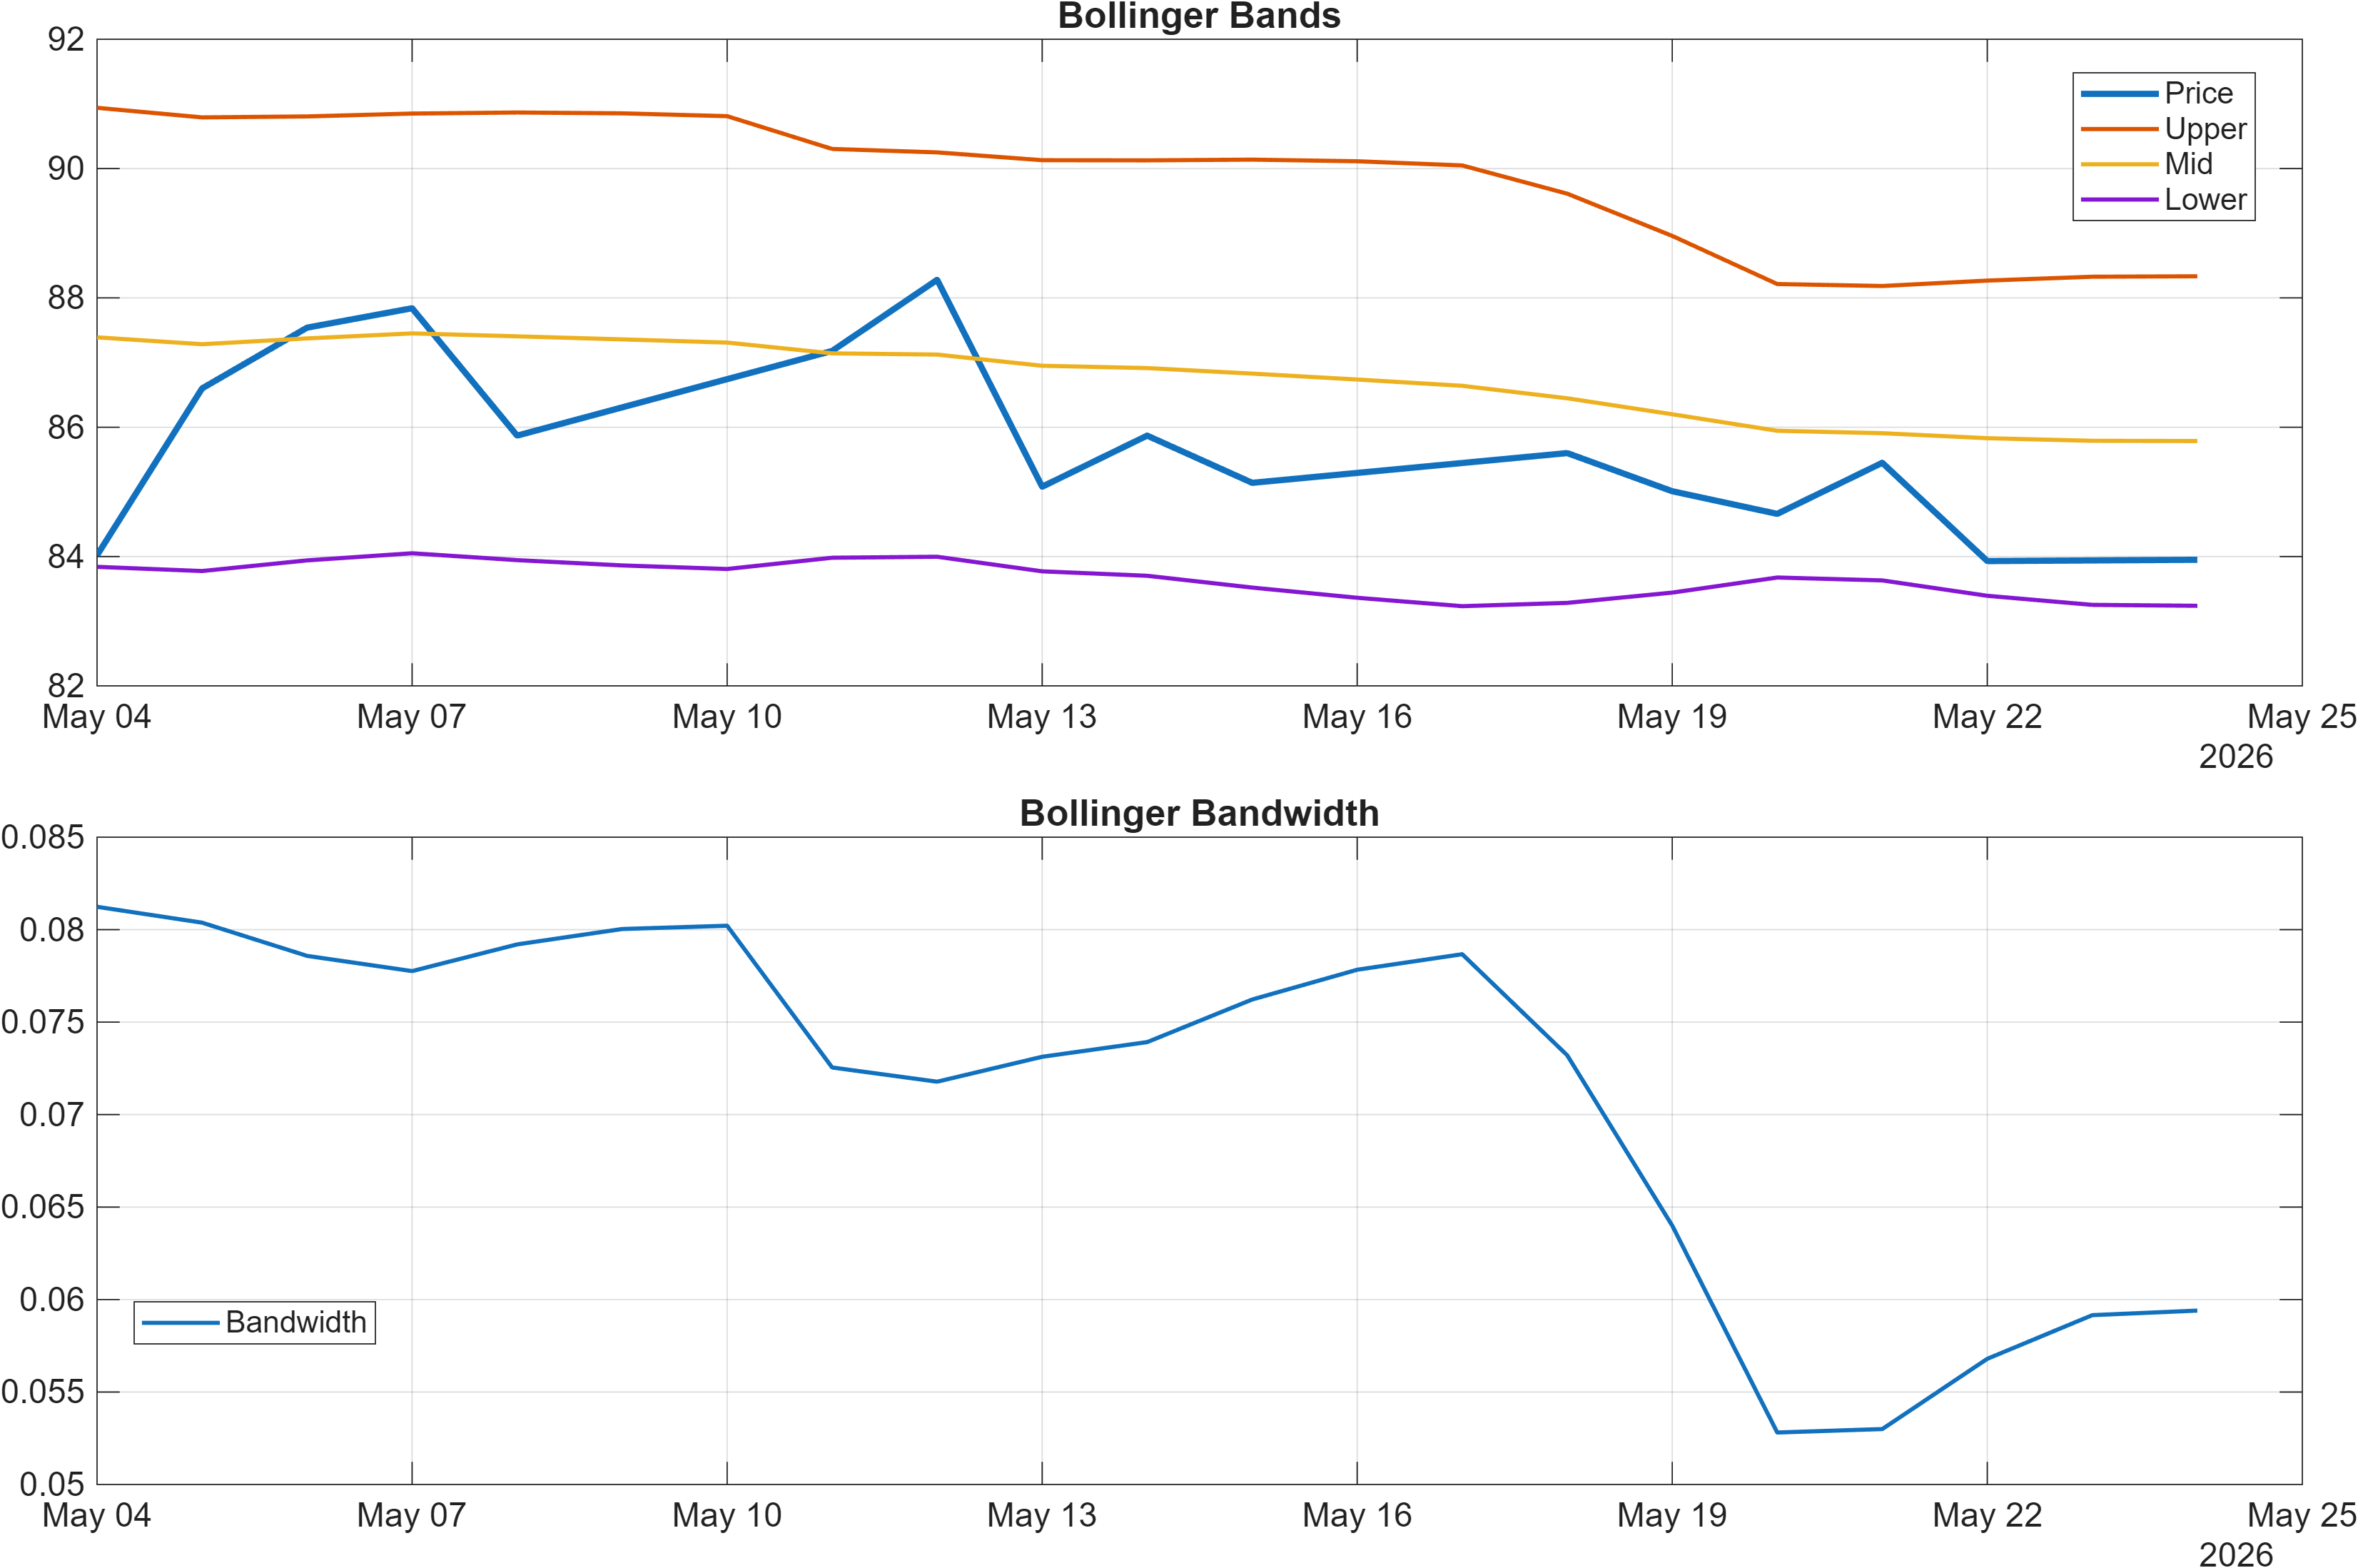
Interpretation: Bandwidth (volatility regime) latest = 0.0594.
Momentum: bearish bias with incomplete washout signals
Momentum indicators lean defensive. The dashboard notes RSI bias = Bearish, consistent with the signal table’s RSI(14) at 36.01—a level that often reflects weak demand following prior selling pressure. MACD is also negative via the histogram at -0.1240, indicating downside momentum remains present rather than fully mean-reverted.
Still, the momentum picture is not a single-direction narrative. For example, Stoch %K at 45.72 is Neutral, which can occur when a market is moving from impulse selling into a more balanced, range-driven phase. That neutrality can be consistent with “repair” rather than continuation, particularly when juxtaposed with the rank strength at the daily horizon.
Volatility regime: compression that can amplify level breaks
Volatility is quantified through Bollinger bandwidth at 0.0594. Regardless of direction, a tighter bandwidth environment typically elevates the importance of nearby reference points because breaks can travel further once compression resolves. In this report, that naturally channels attention to the 82.6417 / 96.3425 zone boundaries.
The implication is conditional: with momentum still weak, volatility compression alone is not a bullish signal. Rather, it increases the value of confirmation mechanics—price acceptance above resistance (ideally alongside improving MACD/RSI behavior) versus failed rallies that keep MACD negative and RSI pinned in bearish territory.
4) Support / Resistance zones
Support ~ 82.6417 | Resistance ~ 96.3425
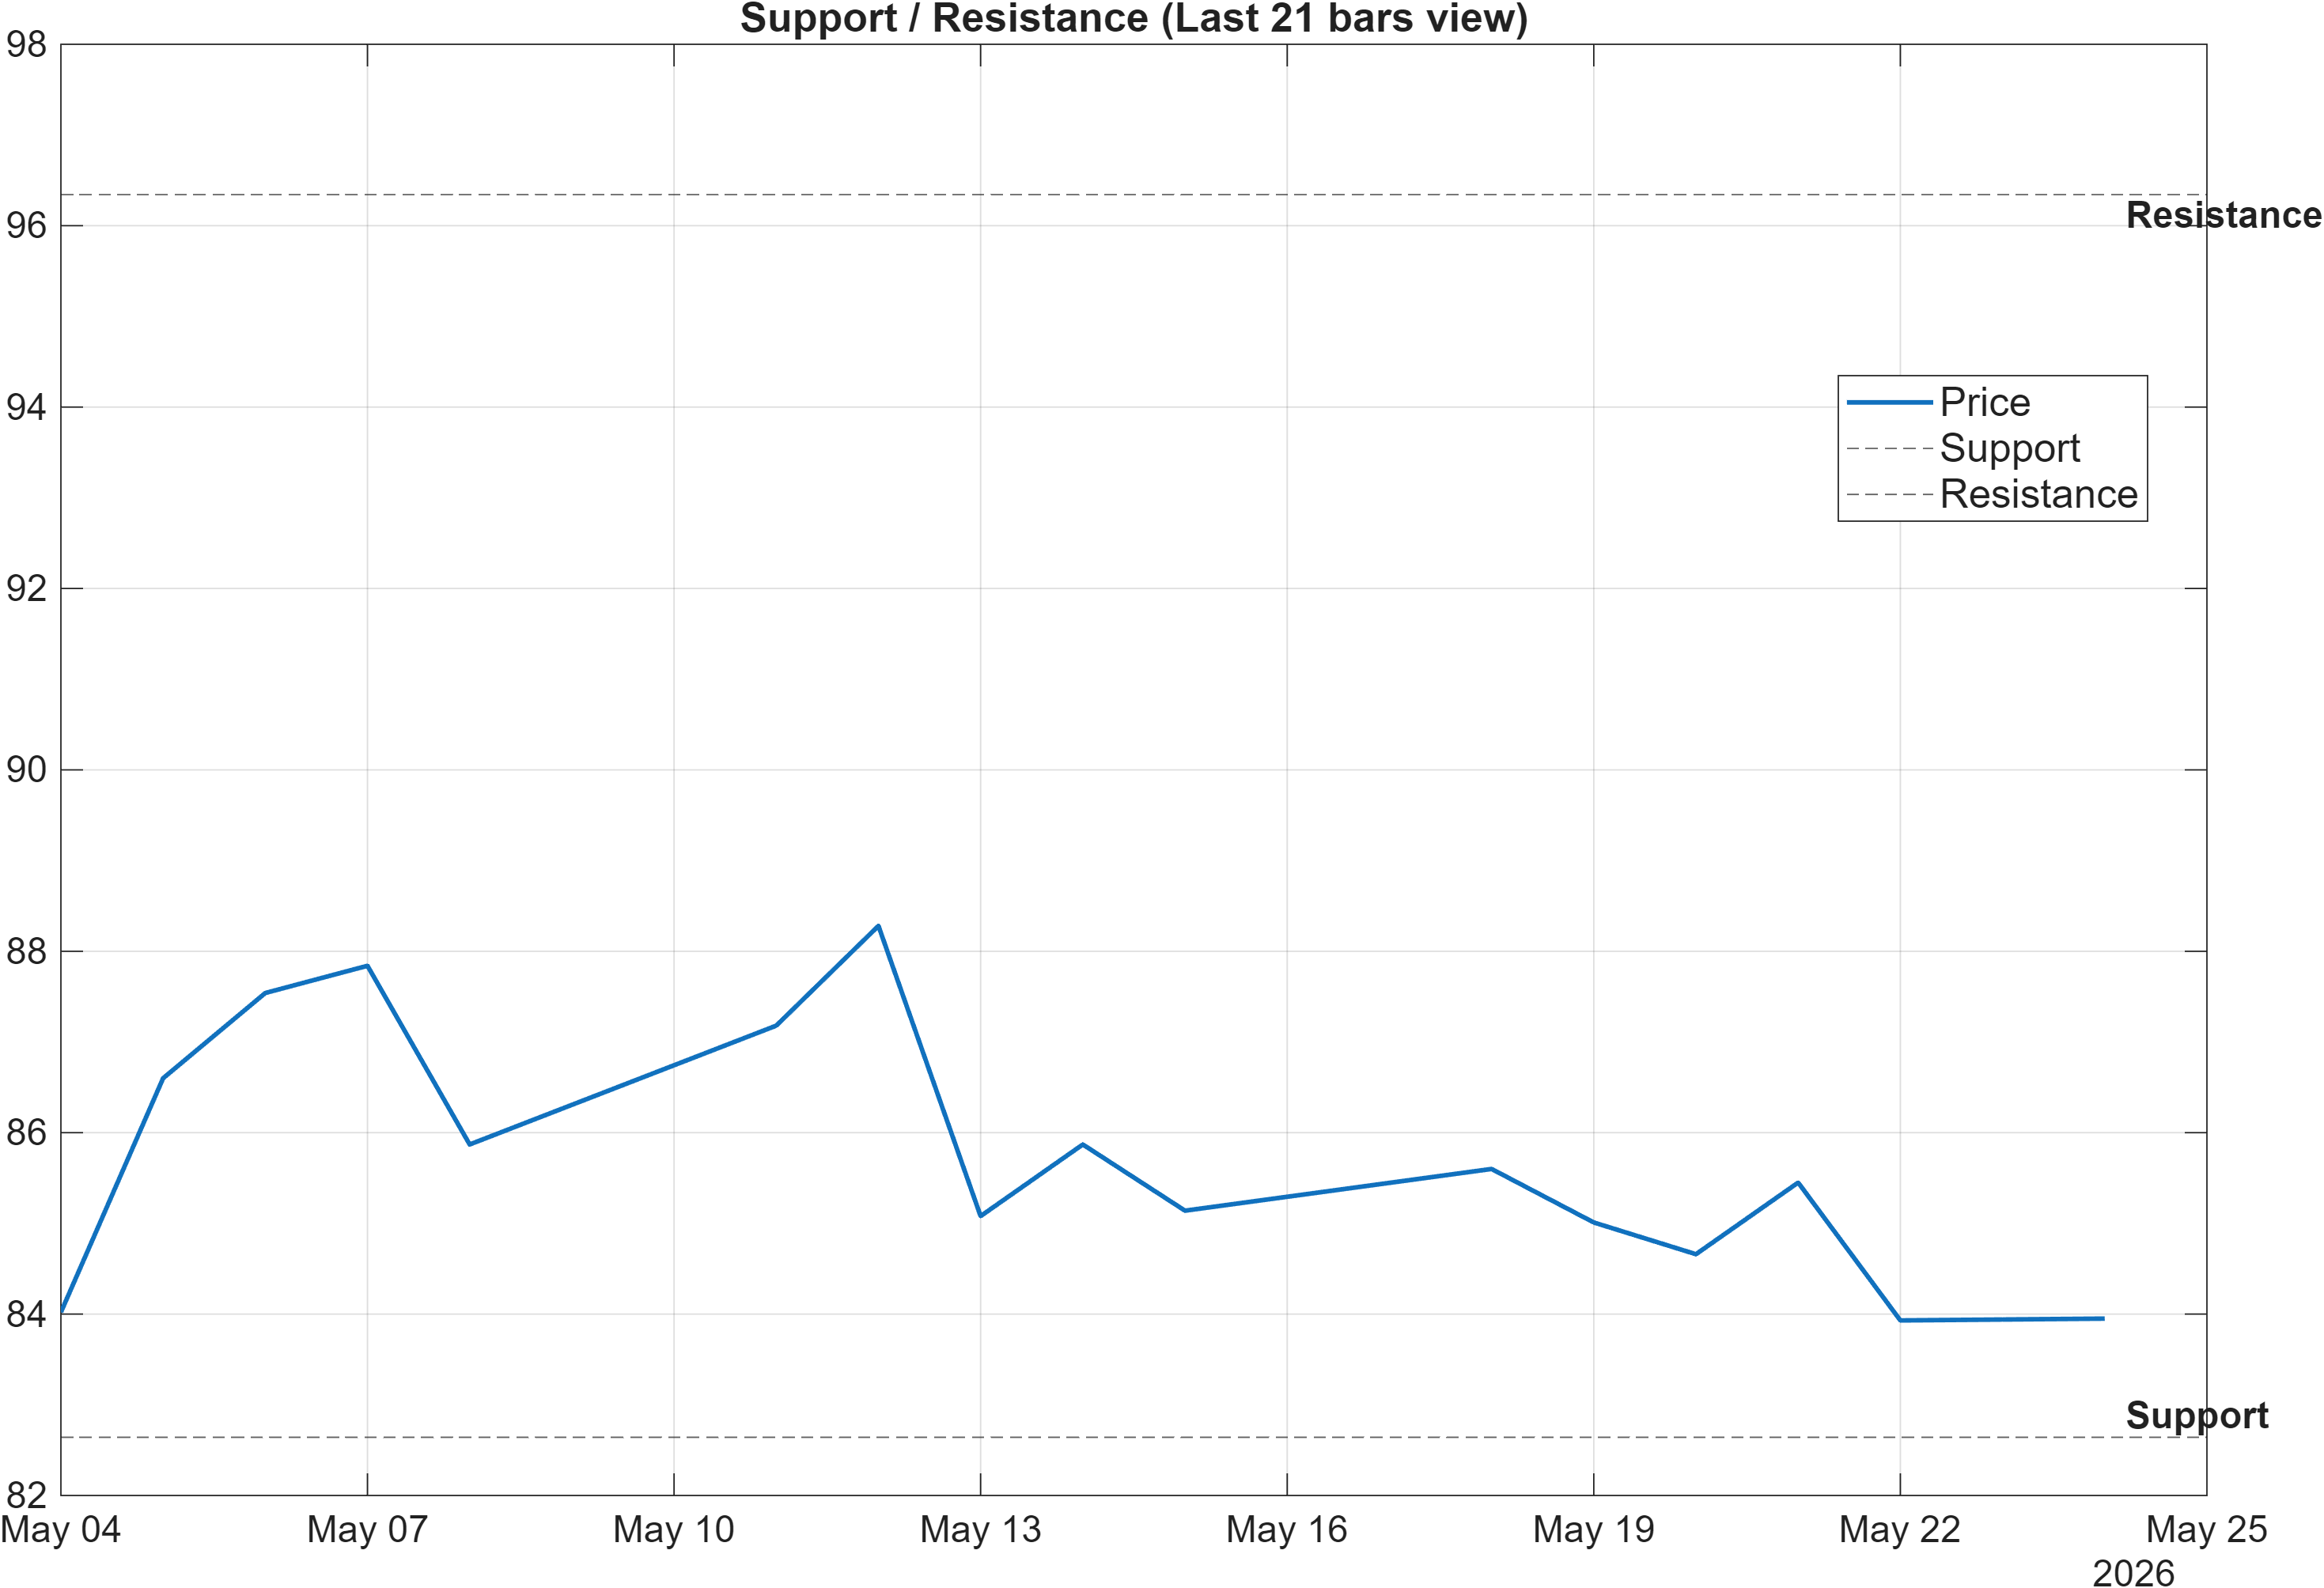
Scenario view: Break above resistance with volume → continuation. Close below support → signal deterioration risk.
Decision zones: where rank strength must meet price acceptance
The level structure is compact and actionable: 82.6417 defines the primary downside reference, while 96.3425 sets the upside gate for continuation. In a regime where moving averages remain bearish and the blended technical score is negative, these zones help separate mean-reversion rallies from a more durable transition.
The signal table adds context for how close price is positioned relative to the floor: MedPx vs Support = 2.833 is marked Bullish, suggesting price location is not sitting directly on the support line. That distance can be constructive if the market is stabilizing; it can also reduce the immediacy of a “must hold today” test, shifting attention toward whether rallies can challenge resistance with credible participation.
The report’s own conditionality is explicit: a break above 96.3425 with volume is treated as continuation evidence. This is consistent with the broader volatility compression noted at 0.0594, where a resolved move can become directional. Conversely, a close below 82.6417 would align the price structure with the existing bearish technical stack (negative MACD histogram, RSI in the mid-30s) and would likely pressure the favorable short-horizon rank signal to re-evaluate.
In short, these levels are less about “targets” and more about market acceptance: whether the tape can prove strength above resistance, or whether weakness reasserts below support.
5) Quant Technical Dashboard (18 Signals)
KGNAI AI Technical Analysis Score (Deep Reinforcement Learning): Rank #2028 out of 2048 (Rank 1 represents the strongest technical positioning and a higher probability of favorable price behavior. As ranks increase toward the maximum, the probability of favorable outcomes weakens and bearish positioning becomes more dominant.) | Label: Bearish | Score: -0.980
18-Signal Technical Confluence Score: -0.333 (Bearish)
Overall Technical Score (18-signal confluence + DRL rank blend): -0.527 (Bearish)
Note: The blended score reflects signal strength weighted against broader AI technical ranking, which may temporarily diverge.
Blended technical score breakdown: -0.527 (Bearish | Bull 4 / Bear 10 / Neutral 4)
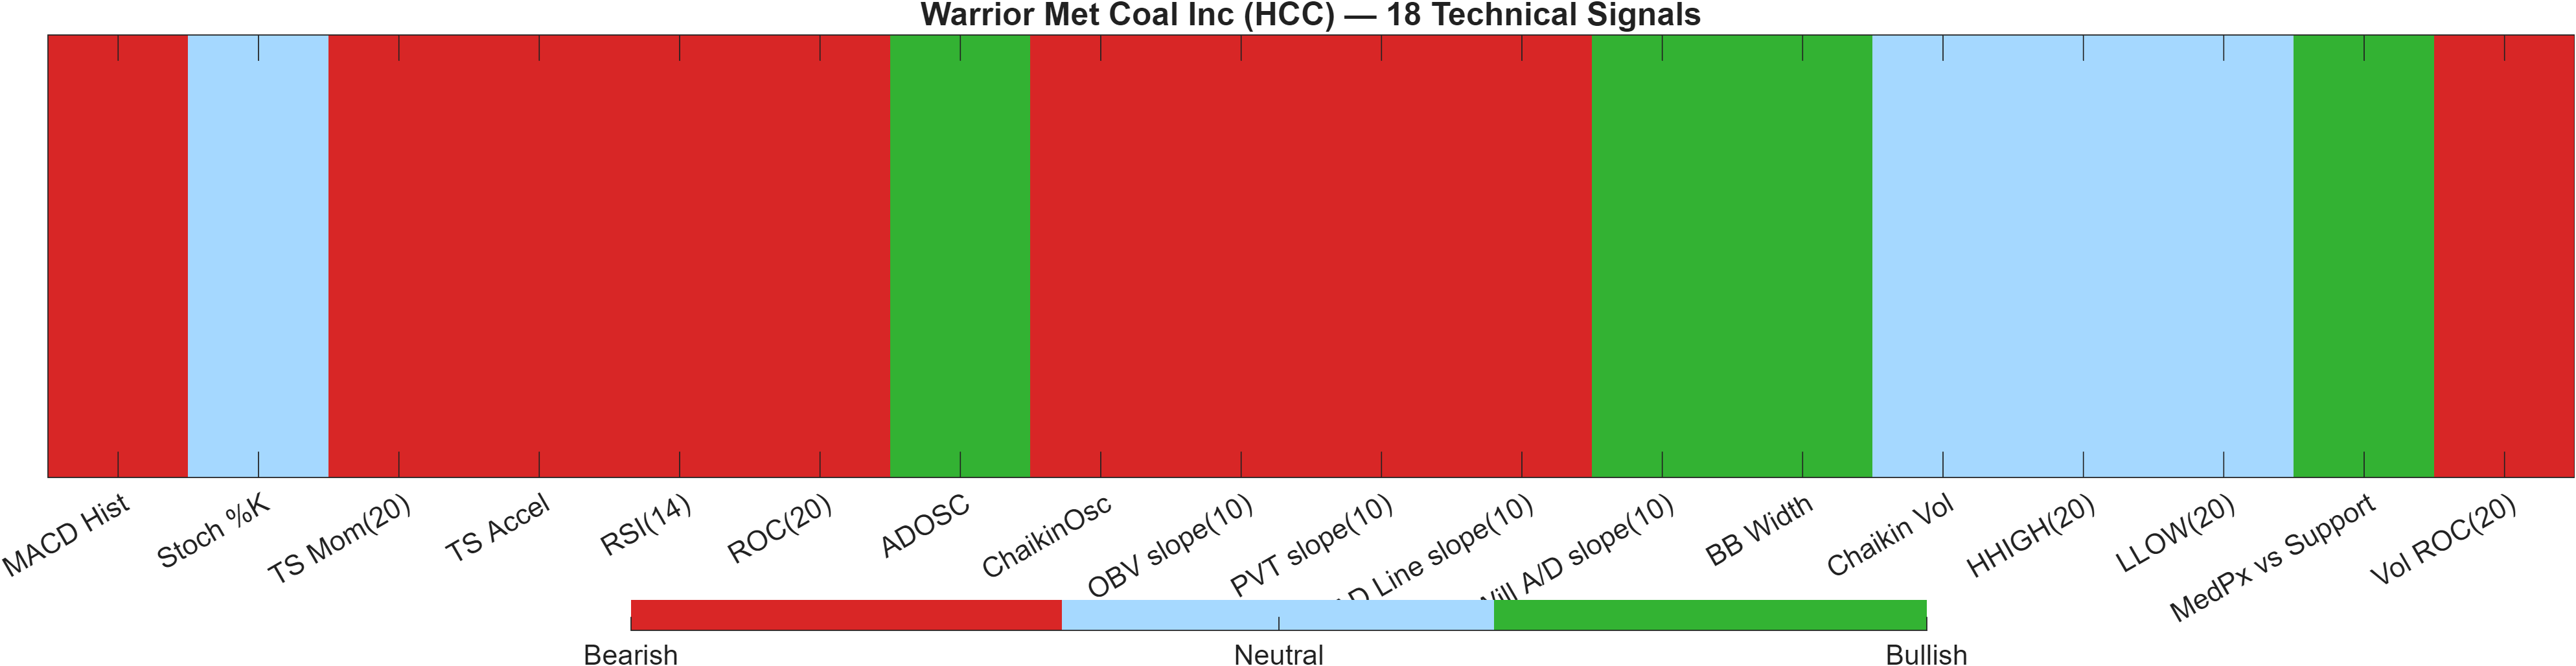
Confluence vs AI technical rank: a controlled contradiction
The technical layer is decisively negative in aggregate. The 18-signal confluence score (-0.333) and the overall technical score (-0.527) both carry a Bearish label, and the breadth is skewed with Bear 10 versus Bull 4 (with Neutral 4). That imbalance suggests weakness is distributed across multiple families rather than confined to a single indicator.
The Deep Reinforcement Learning technical model is even more extreme: rank #2028 out of 2048 with a -0.980 score, placing HCC in the lowest decile for technical positioning by that specific framework. This contrasts sharply with the cross-asset ranks (e.g., daily #7, yearly #21 out of 2049), creating a useful analytical tension: relative cross-sectional positioning looks strong, but standalone technical structure looks poor.
What’s driving the bearish stack—momentum and participation
The signal table highlights several bearish momentum reads that reinforce the broader label: MACD Hist -0.124, RSI(14) 36.01, and ROC(20) -3.06 collectively indicate momentum remains tilted lower. Participation measures also lean negative, with OBV slope(10) -1.71e+05 and Vol ROC(20) -22.1 suggesting volume dynamics have not been supportive.
Is there any constructive texture inside the bearish aggregate?
Yes—but it is narrow. A small set of bullish signals (e.g., ADOSC 22.1 and Will A/D slope(10) 4.726) can be consistent with early stabilization attempts. Additionally, volatility compression (BB Width 0.0594) can coincide with range formation. The dashboard’s message remains that HCC needs price validation at the resistance band to convert those isolated positives into broader confluence.
Signal table (Bull/Bear/Neutral)
| Indicator | Value | Signal |
|---|---|---|
| MACD Hist | -0.124 | Bearish |
| Stoch %K | 45.72 | Neutral |
| TS Mom(20) | -2.67 | Bearish |
| TS Accel | -3.45 | Bearish |
| RSI(14) | 36.01 | Bearish |
| ROC(20) | -3.06 | Bearish |
| ADOSC | 22.1 | Bullish |
| ChaikinOsc | -5.364e+05 | Bearish |
| OBV slope(10) | -1.71e+05 | Bearish |
| PVT slope(10) | -1.673e+04 | Bearish |
| AD Line slope(10) | -2.984e+05 | Bearish |
| Will A/D slope(10) | 4.726 | Bullish |
| BB Width | 0.0594 | Bullish |
| Chaikin Vol | -9.11 | Neutral |
| HHIGH(20) | 90 | Neutral |
| LLOW(20) | 81.21 | Neutral |
| MedPx vs Support | 2.833 | Bullish |
| Vol ROC(20) | -22.1 | Bearish |
Interpretation: Indicator-level signals form the base confluence, which is then adjusted using a separate AI-driven technical ranking model. The final technical score summarizes this combined view.
6) News sentiment + extractive gist
Sentiment score (avg): 0.088 | Positive: 39% | Neutral: 55% | Negative: 6%
KGNAI AI News Sentiment Score (normalized -1 to +1): 1.00 (as of 2026-05-20) | Label: Bullish | Overall news score: 0.98
Positive Developments
Recent coverage across major financial outlets indicates a constructive narrative tilt around company execution and investor positioning, reflected in the 39% positive share of sentiment and the model’s high normalized reading (1.00 as of 2026-05-20). The tone of bullish commentary emphasizes operational progress themes and the market’s ongoing effort to contextualize prior strength with current pricing. From an analytics perspective, this constructive news backdrop is most useful when it aligns with observable confirmation on the chart—particularly if price action can credibly challenge the 96.3425 resistance area. Given the technical dashboard remains bearish (overall technical score -0.527), supportive narratives function less as “signals” and more as potential catalysts that may (or may not) translate into improved participation measures and momentum stabilization.
Neutral / Mixed Developments
The dominant sentiment bucket is still Neutral (55%), which suggests a market that is actively reassessing rather than uniformly committed to a single direction. Mixed commentary frequently accompanies range-bound trading and consolidation phases—consistent with the tight volatility regime suggested by Bollinger bandwidth at 0.0594. This “informational” flow tends to matter most in how it shapes expectations around near-term volatility and whether buyers are willing to defend the 82.6417 support zone on adverse days. In a setup where cross-sectional ranks are strong (e.g., daily #7) but the MA structure remains bearish, neutral coverage can persist until a technical inflection becomes visible.
Negative / Risk Signals
Negative sentiment is low at 6%, but risk flags still appear in the form of cautionary framing and profit-taking sensitivity after periods of strong prior performance. This matters because the technical picture is already fragile: momentum readings such as RSI(14) 36.01 and MACD histogram -0.1240 imply that the tape may be more susceptible to drawdowns if incremental news flow turns less supportive. In that context, “low negative share” should not be conflated with low price risk—risk is better defined here by the level map and the confluence stack. A close below 82.6417 would be consistent with a shift from stabilization to deterioration, regardless of whether the news mix remains broadly neutral.
- What to monitor next: Whether price can regain acceptance above 96.3425 with visible volume expansion.
- What to monitor next: Any improvement in momentum gauges (MACD histogram moving toward zero; RSI lifting away from 36.01).
- What to monitor next: Stability around 82.6417 if volatility expands from the current bandwidth (0.0594).
Sources referenced: Reuters, Bloomberg, Yahoo Finance, MarketWatch, Investing.com
Snapshot: AI Rank (Short–Mid–Long): Mixed (Bullish tilt) (Bullish–Neutral–Bullish) · Technical Confluence: Bearish · Key Levels: Support ~82.64 | Resistance ~96.34 · News Sentiment: Neutral
7) Sources
Not available in the provided data.
You may also like: How KGNAI AI ranks instruments across global markets
Disclaimer: KGNAI provides AI-generated analytics and educational market commentary only. This is not financial advice. Markets involve risk. Always do your own research.