
SHOP (Shopify Inc) — 22-May-2026 Neutral-to-Mixed Signal Stack with Short-Term Rank Strength
Shopify Inc (SHOP) enters 22-May-2026 with a split regime: KGNAI’s cross-sectional ranks are notably strong in the near term, while traditional trend and momentum overlays remain less supportive. Daily rank sits at #8 and weekly at #99, placing SHOP in the upper portion of the tracked universe, yet the price/MA structure flags close vs MA50 = Bearish and MA50 vs MA200 = Bearish. Momentum is similarly conflicted: RSI(14) at 39.92 implies weak upside pressure, but MACD histogram at 0.7618 suggests improving impulse. Volatility is moderate with Bollinger bandwidth at 0.3174, leaving room for expansion if price approaches key decision zones. The primary map remains defined by support ~98.6325 and resistance ~132.0050, while news sentiment leans constructive with a normalized score of 0.99 despite an overall digest that reads more balanced.
- Short / Mid / Long rank stance: Short-term Bullish (daily #8, weekly #99), Mid-term Neutral (3-month #637, 6-month #418), Long-term Neutral (yearly #279 with mixed trend confirmation).
- Technical confluence label: Neutral (18-signal confluence 0.111; blended technical score 0.126).
- Key levels: Support 98.6325 | Resistance 132.0050.
- News sentiment bias: Bullish normalized sentiment 0.99, with 46% positive / 54% neutral / 0% negative in the digest mix.
- Confirmation / invalidation: Acceptance above 132.0050 with volume would better align ranks with trend; a close below 98.6325 increases deterioration risk versus the current neutral technical blend.
KGNAI evaluates assets using large cross-sectional datasets built from millions of structured data points. Inputs incorporate fundamental metrics, technical structures, and systematically processed news sentiment. Statistical models, machine learning, and AI frameworks are used to assess relative positioning, signal alignment, and probabilistic behavior across broad universes.
- Ranks are comparative across the tracked universe, not absolute price targets.
- Confluence reflects alignment among independent signal groups.
- Support/resistance levels are probabilistic decision zones, not guarantees.
- Sentiment provides contextual bias within the broader analytical framework.
1) KGNAI AI Analysis
Region: USA
Total universe size: 2050 ranked instruments
- Daily rank: #8 out of 2050 — Bullish
- Weekly rank: #99 out of 2050 — Bullish
- Monthly rank: #80 out of 2050 — Bullish
- 3-Monthly rank: #637 out of 2050 — Neutral
- 6-Monthly rank: #418 out of 2050 — Neutral
- Yearly rank: #279 out of 2050 — Bullish
SHOP’s rank curve is front-loaded: the daily reading (#8) and monthly reading (#80) sit in the upper tier of the 2050-instrument universe, but that advantage fades into a more average posture over 3–6 months (#637 and #418). This pattern often appears when cross-sectional behavior improves faster than slower-moving price structure—i.e., the asset begins to behave “better than peers” before classical trend filters fully turn.
The key analytical tension is persistence versus reversion. A daily rank as strong as #8 can be informative, but it is also more sensitive to short-lived flow and risk-on bursts; the weekly rank (#99) provides a sturdier confirmation layer, and here it still supports a bullish near-term stance. The mid-term neutrality implies the market has not fully repriced SHOP into a higher-confidence continuation regime across multiple horizons.
KGNAI’s term view is explicitly Bullish short-term and Neutral mid/long-term, which should be treated as an alignment check against the technical dashboard later in the report. The most constructive interpretation is that SHOP is in a transition zone: improving relative behavior without a completed trend rebuild. The most cautious interpretation is that short-term rank strength is not yet reinforced by broader regime indicators and could fade if key levels fail.
Term view: Short-term: Bullish. Mid-term: Neutral. Long-term: Neutral.
2) Price & trend overview
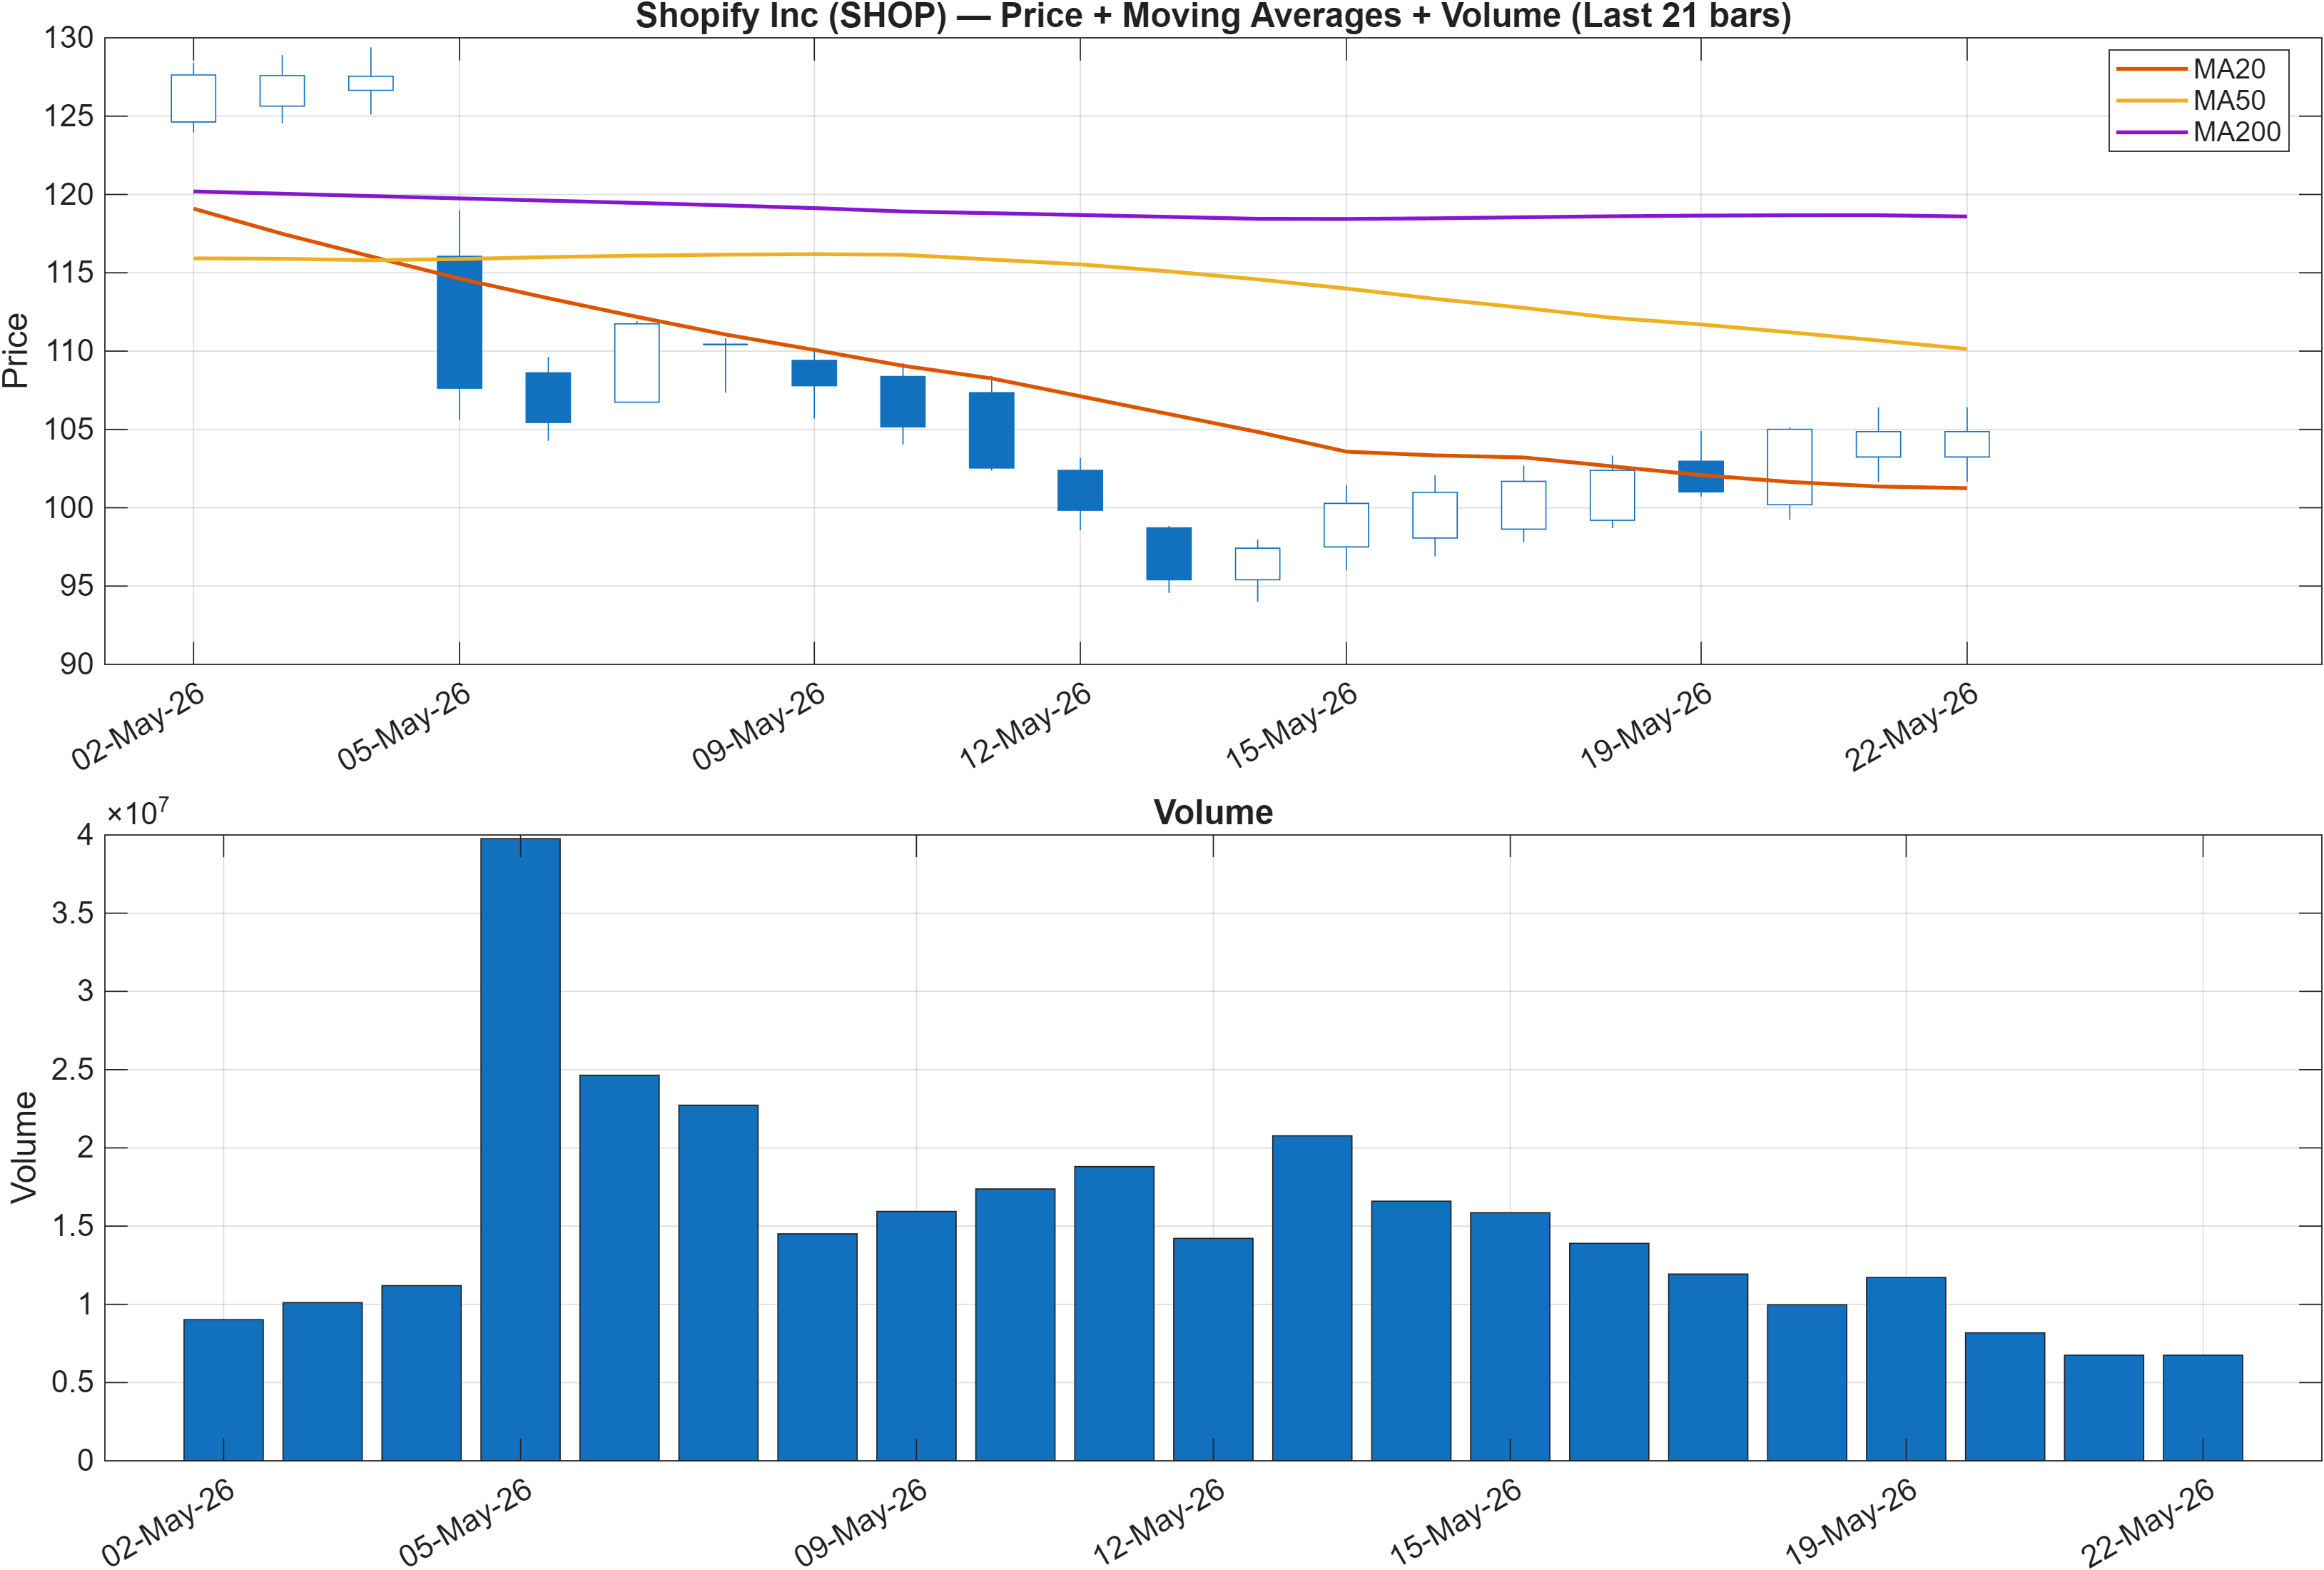
The moving-average stack remains a headwind. With close vs MA50 = Bearish and MA50 vs MA200 = Bearish, SHOP is still trading beneath a declining intermediate trend that also sits below the longer trend proxy. This configuration typically describes a market that has not completed a durable trend reversal, even if tactical rebounds occur.
The practical implication is that rank strength is currently leading while trend confirmation lags. This is consistent with a scenario where relative performance improves (better than peers), but the instrument still needs time and follow-through to reclaim key moving averages. Until then, rallies can be more sensitive to profit-taking and mean reversion.
The nearby price map in this report anchors on support at 98.6325 and resistance at 132.0050. Those levels are important not only as horizontal zones but because trend filters often flip only after price proves it can hold above a well-defined ceiling. Conversely, a breakdown below support would keep the MA structure bearish and reduce the probability that the strong daily rank (#8) represents a durable regime change.
Volume context is shown in Figure 1; however, specific volume statistics are not available in the provided data. In this setup, confirmation typically comes from price acceptance above resistance with volume that is meaningfully supportive relative to recent activity rather than isolated spikes.
3) Momentum & volatility dashboard
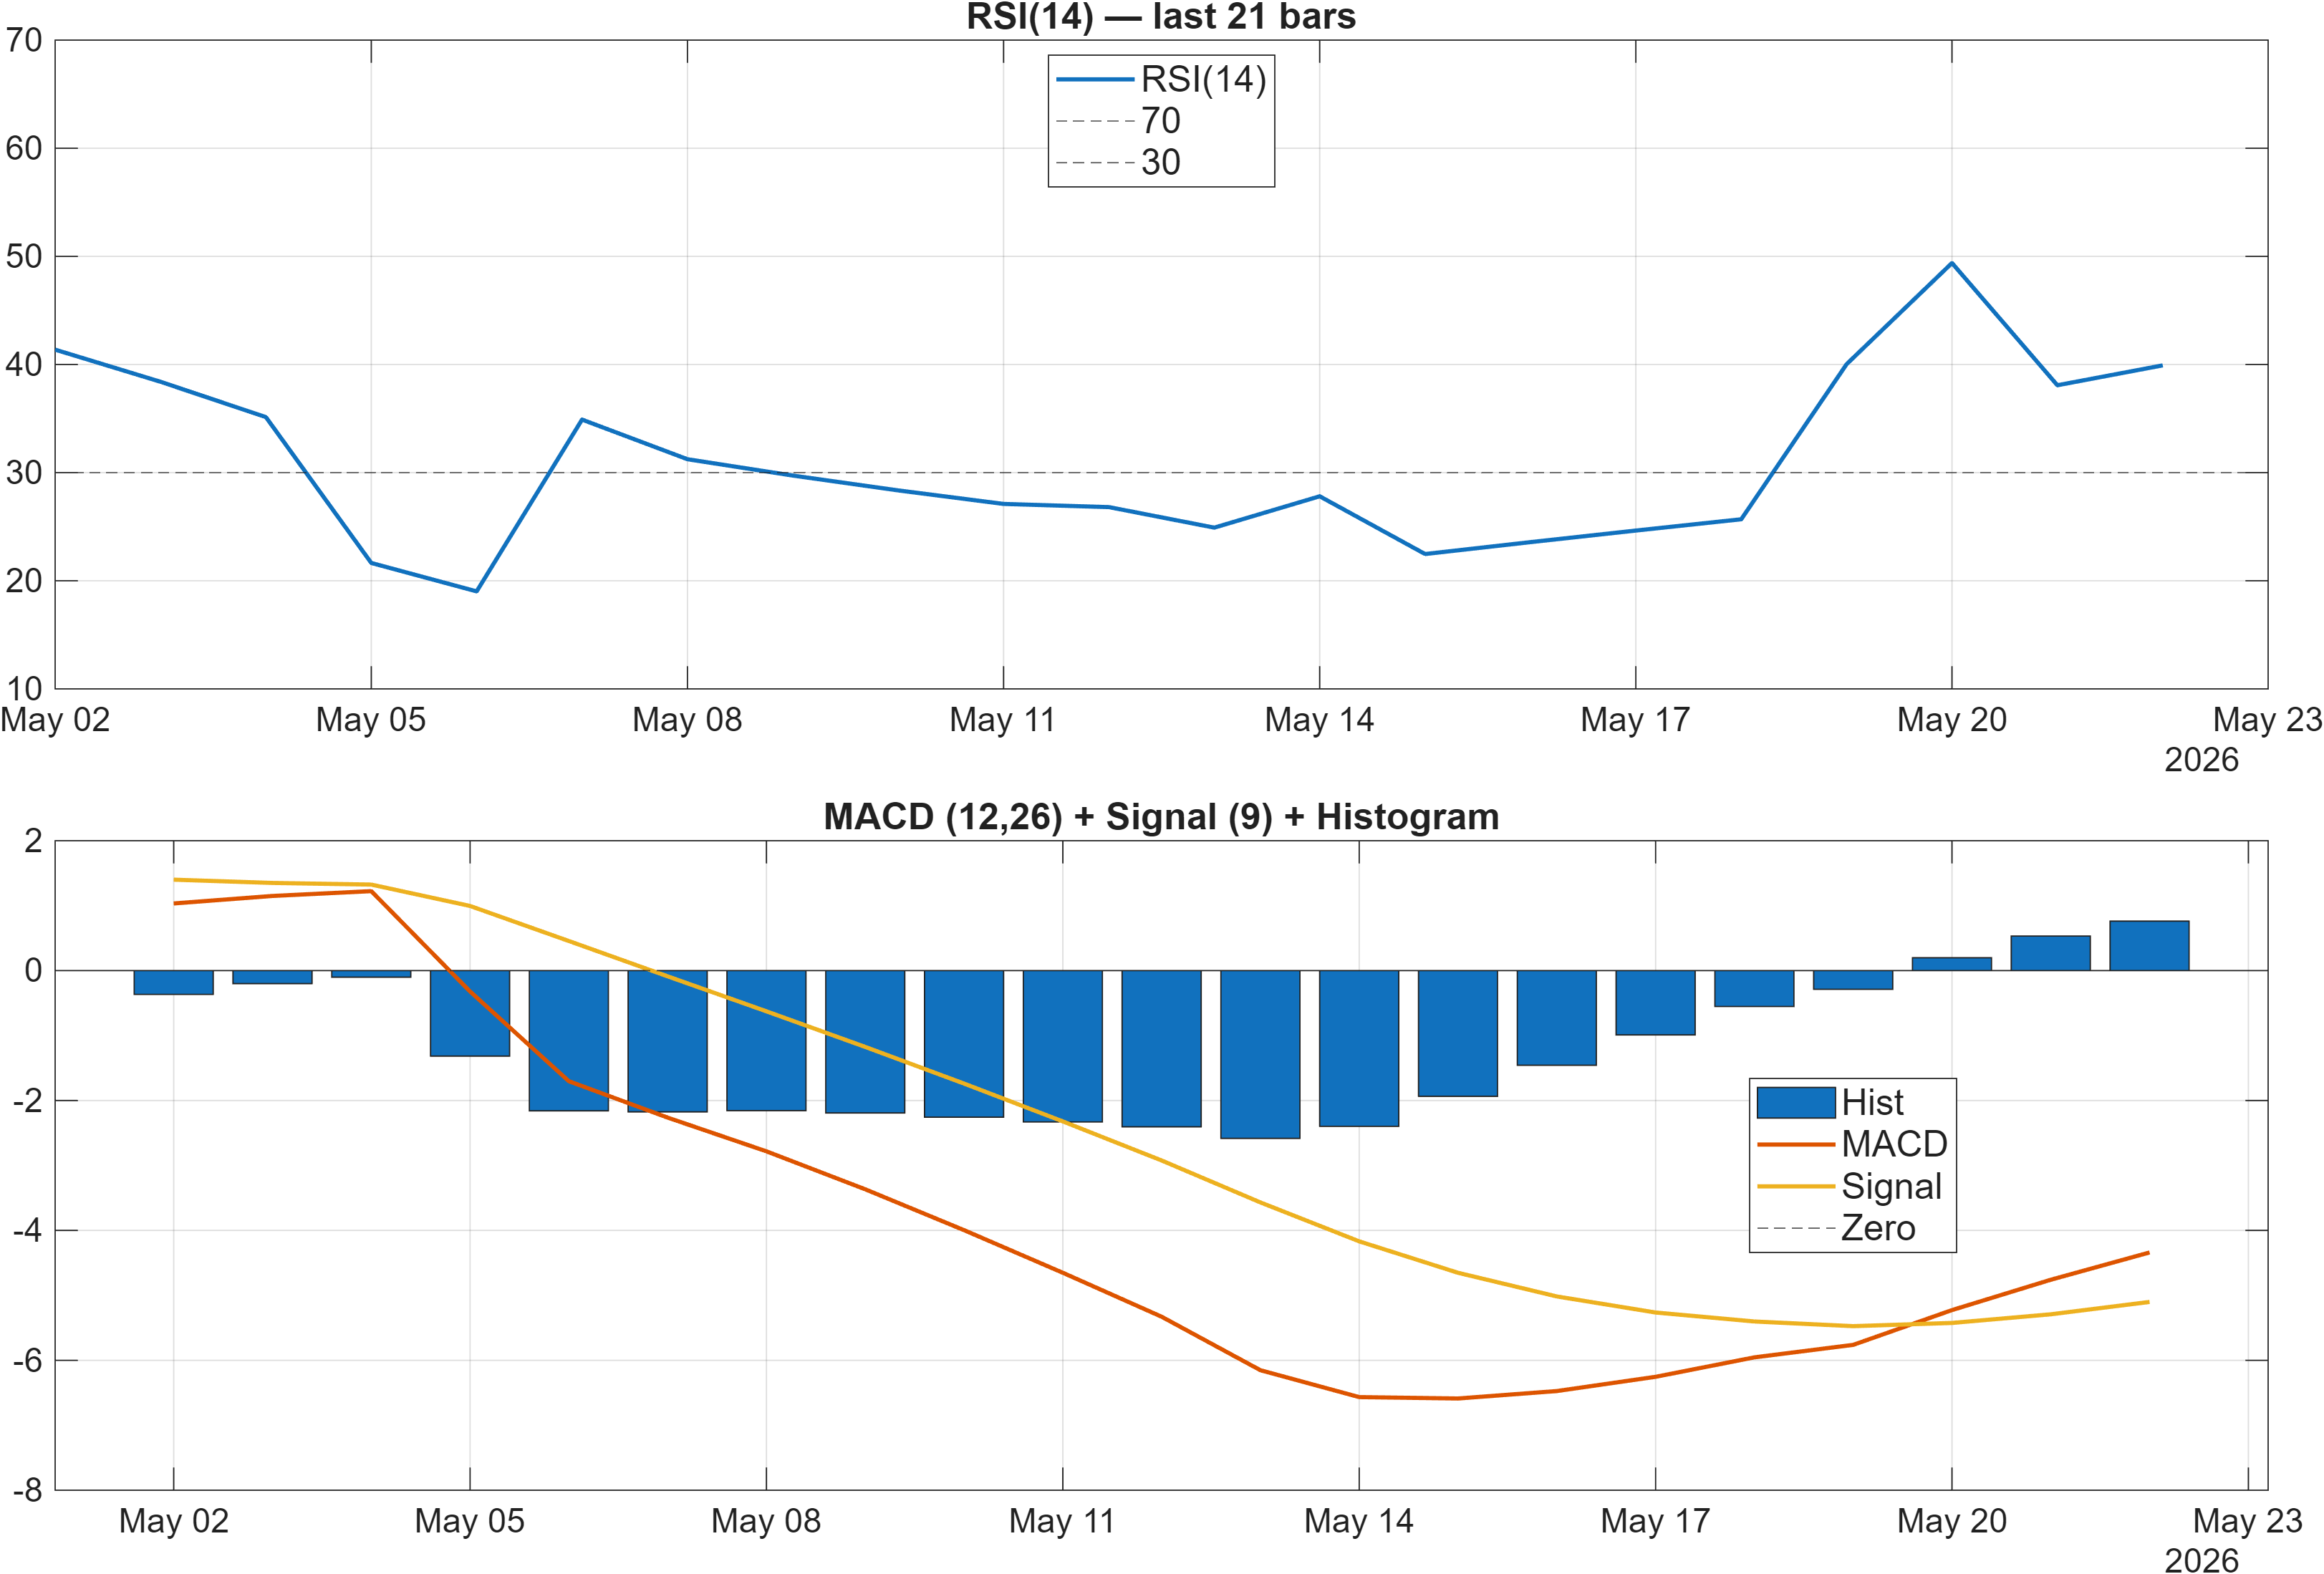
Momentum is split rather than directionally clean. The dashboard flags RSI bias = Bearish, and the underlying reading of RSI(14) at 39.92 sits below the midline, which commonly aligns with weak trend demand and reduced upside follow-through. At the same time, MACD histogram at 0.7618 is positive, suggesting that shorter-term momentum is attempting to improve even while broader conditions remain heavy.
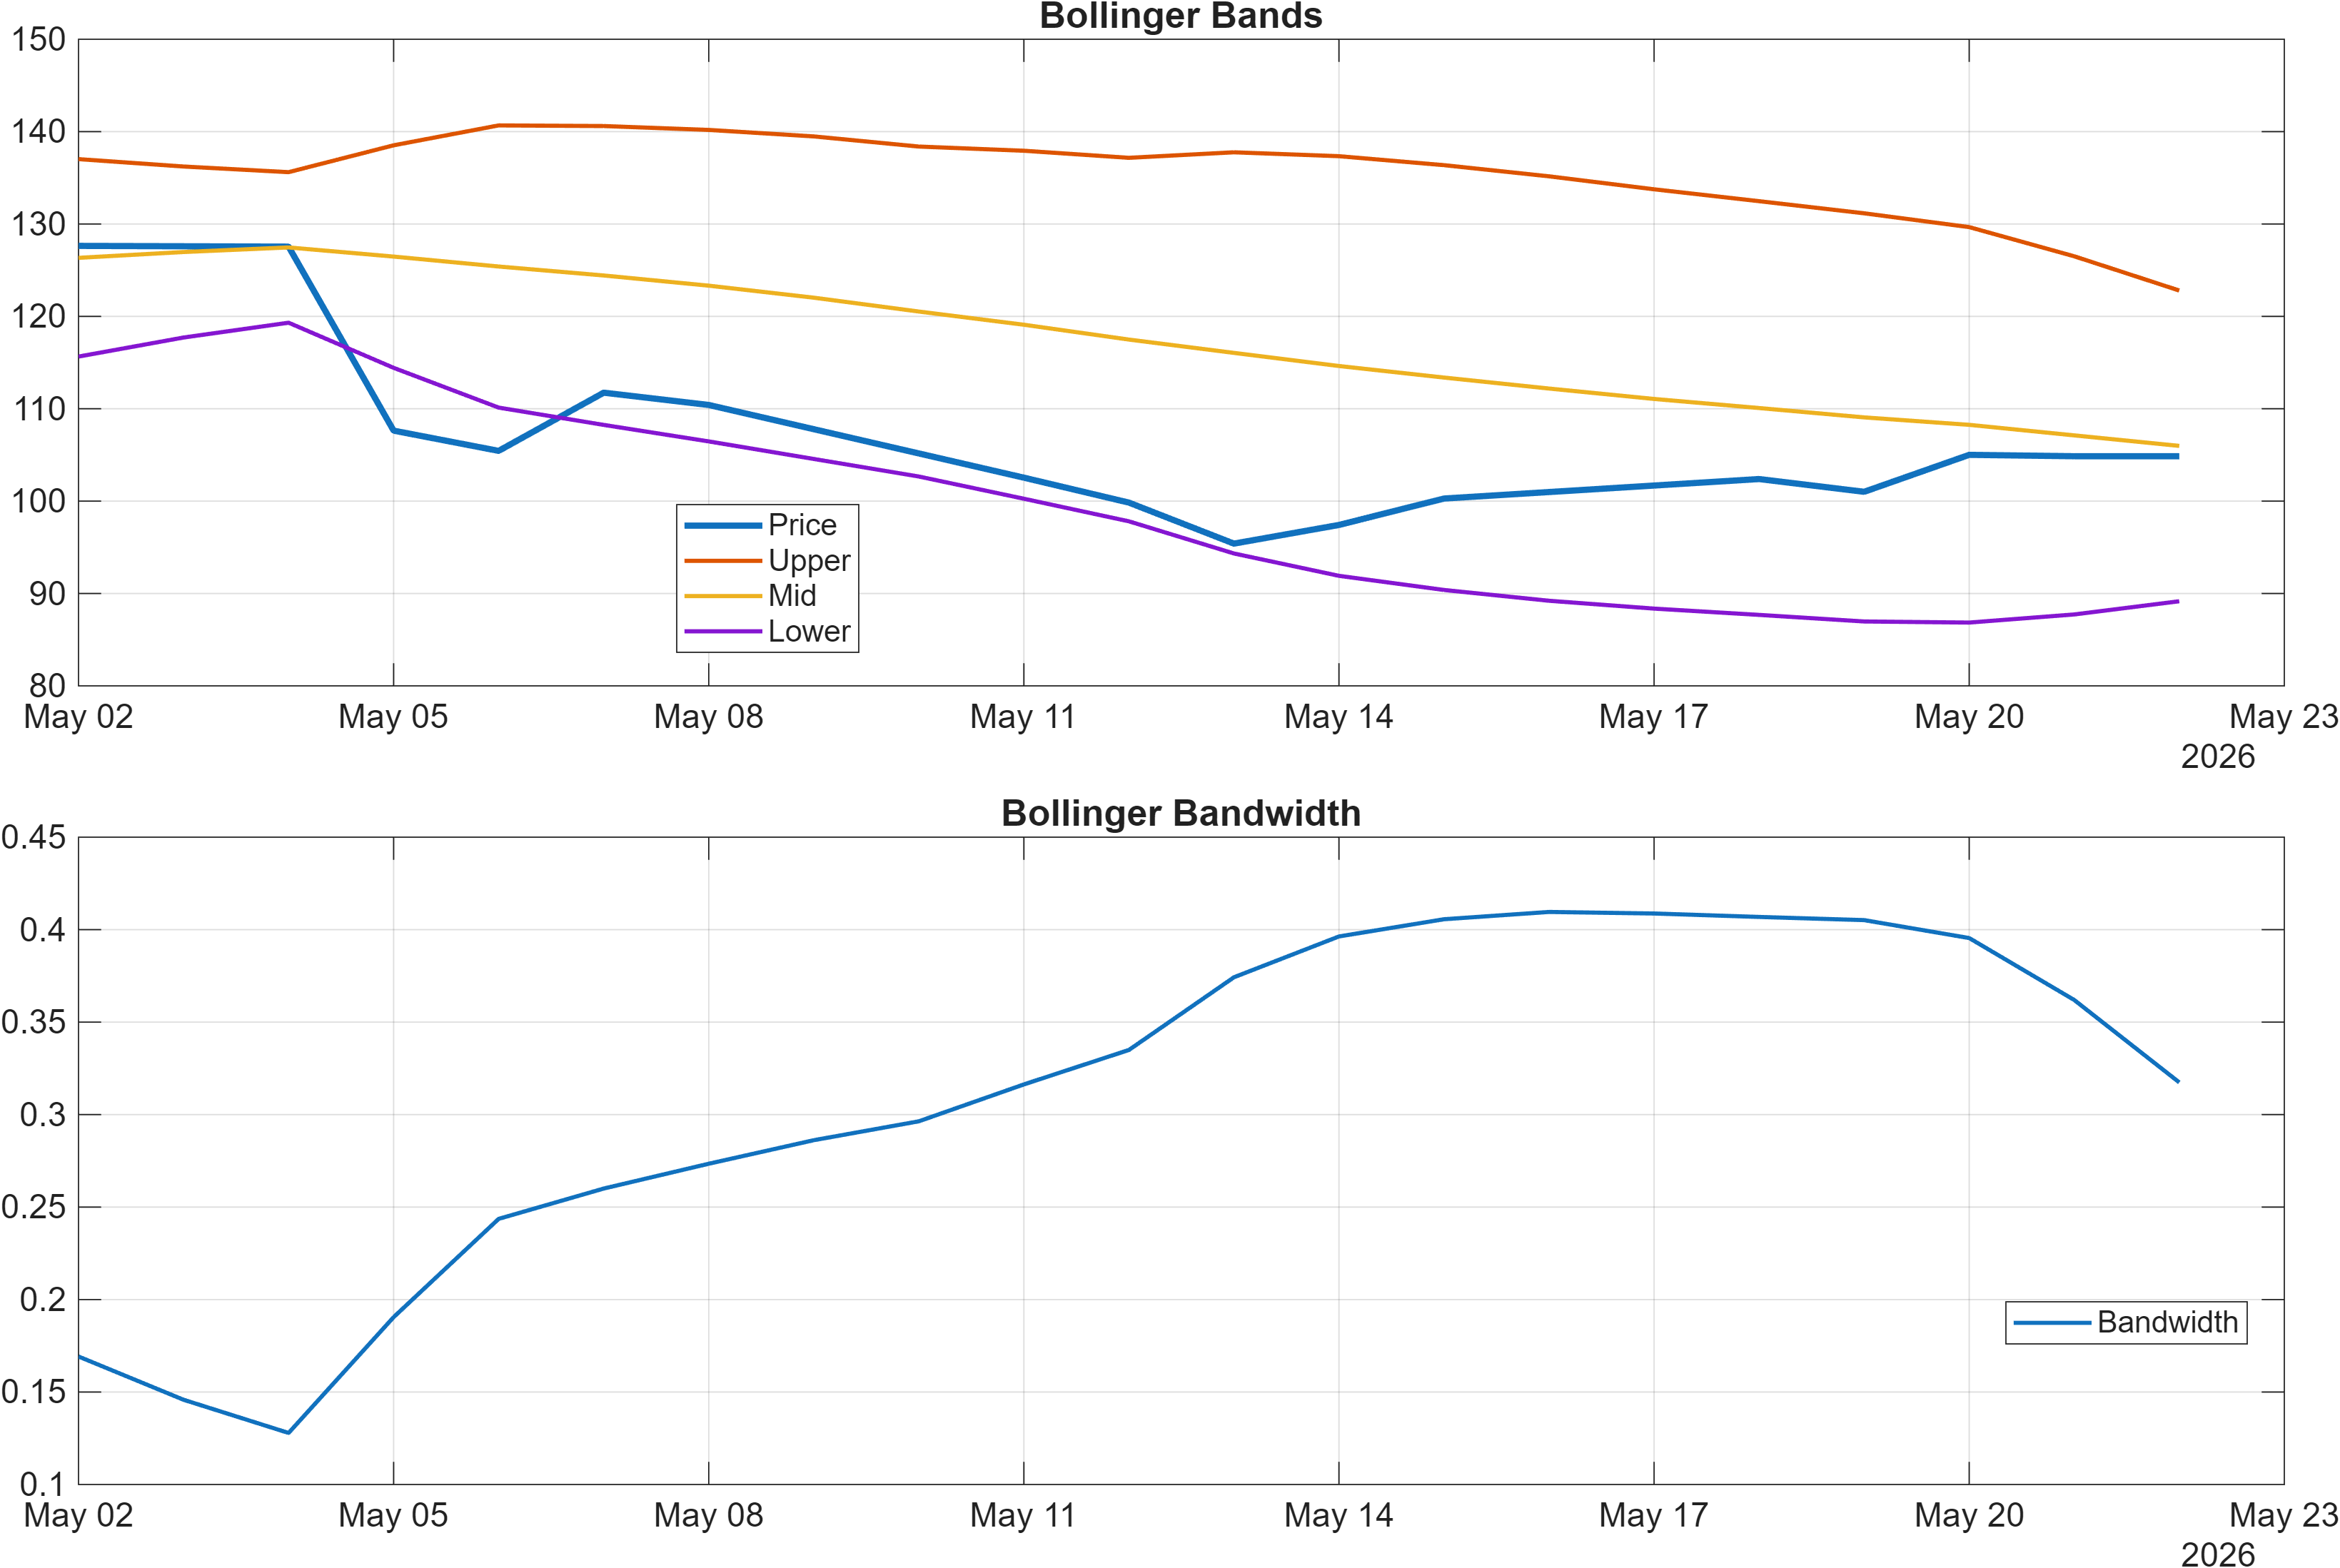
Volatility sits in a moderate regime with bandwidth at 0.3174. That level does not signal an extreme squeeze, but it also does not imply runaway expansion. For positioning, this matters because a MACD improvement without a volatility pickup can lead to grinding price action rather than fast directional resolution—especially when trend filters (MA50/MA200) remain bearish.
Within the 18-signal panel, short-cycle indicators show tension: Stoch %K at 87.47 prints as bearish (often consistent with an overbought/late-cycle reading), while the MACD histogram remains bullish. That pairing can occur when rebounds become extended before the larger trend truly flips, producing “two-speed” behavior—strong intrawave thrust but fragile trend durability.
Taken together, the momentum/volatility stack favors selective confirmation: improvements need to persist long enough to pull RSI out of the sub-40 area while volatility and price structure support follow-through. Without that, momentum signals can remain episodic.
4) Support / Resistance zones
Support ~ 98.6325 | Resistance ~ 132.0050
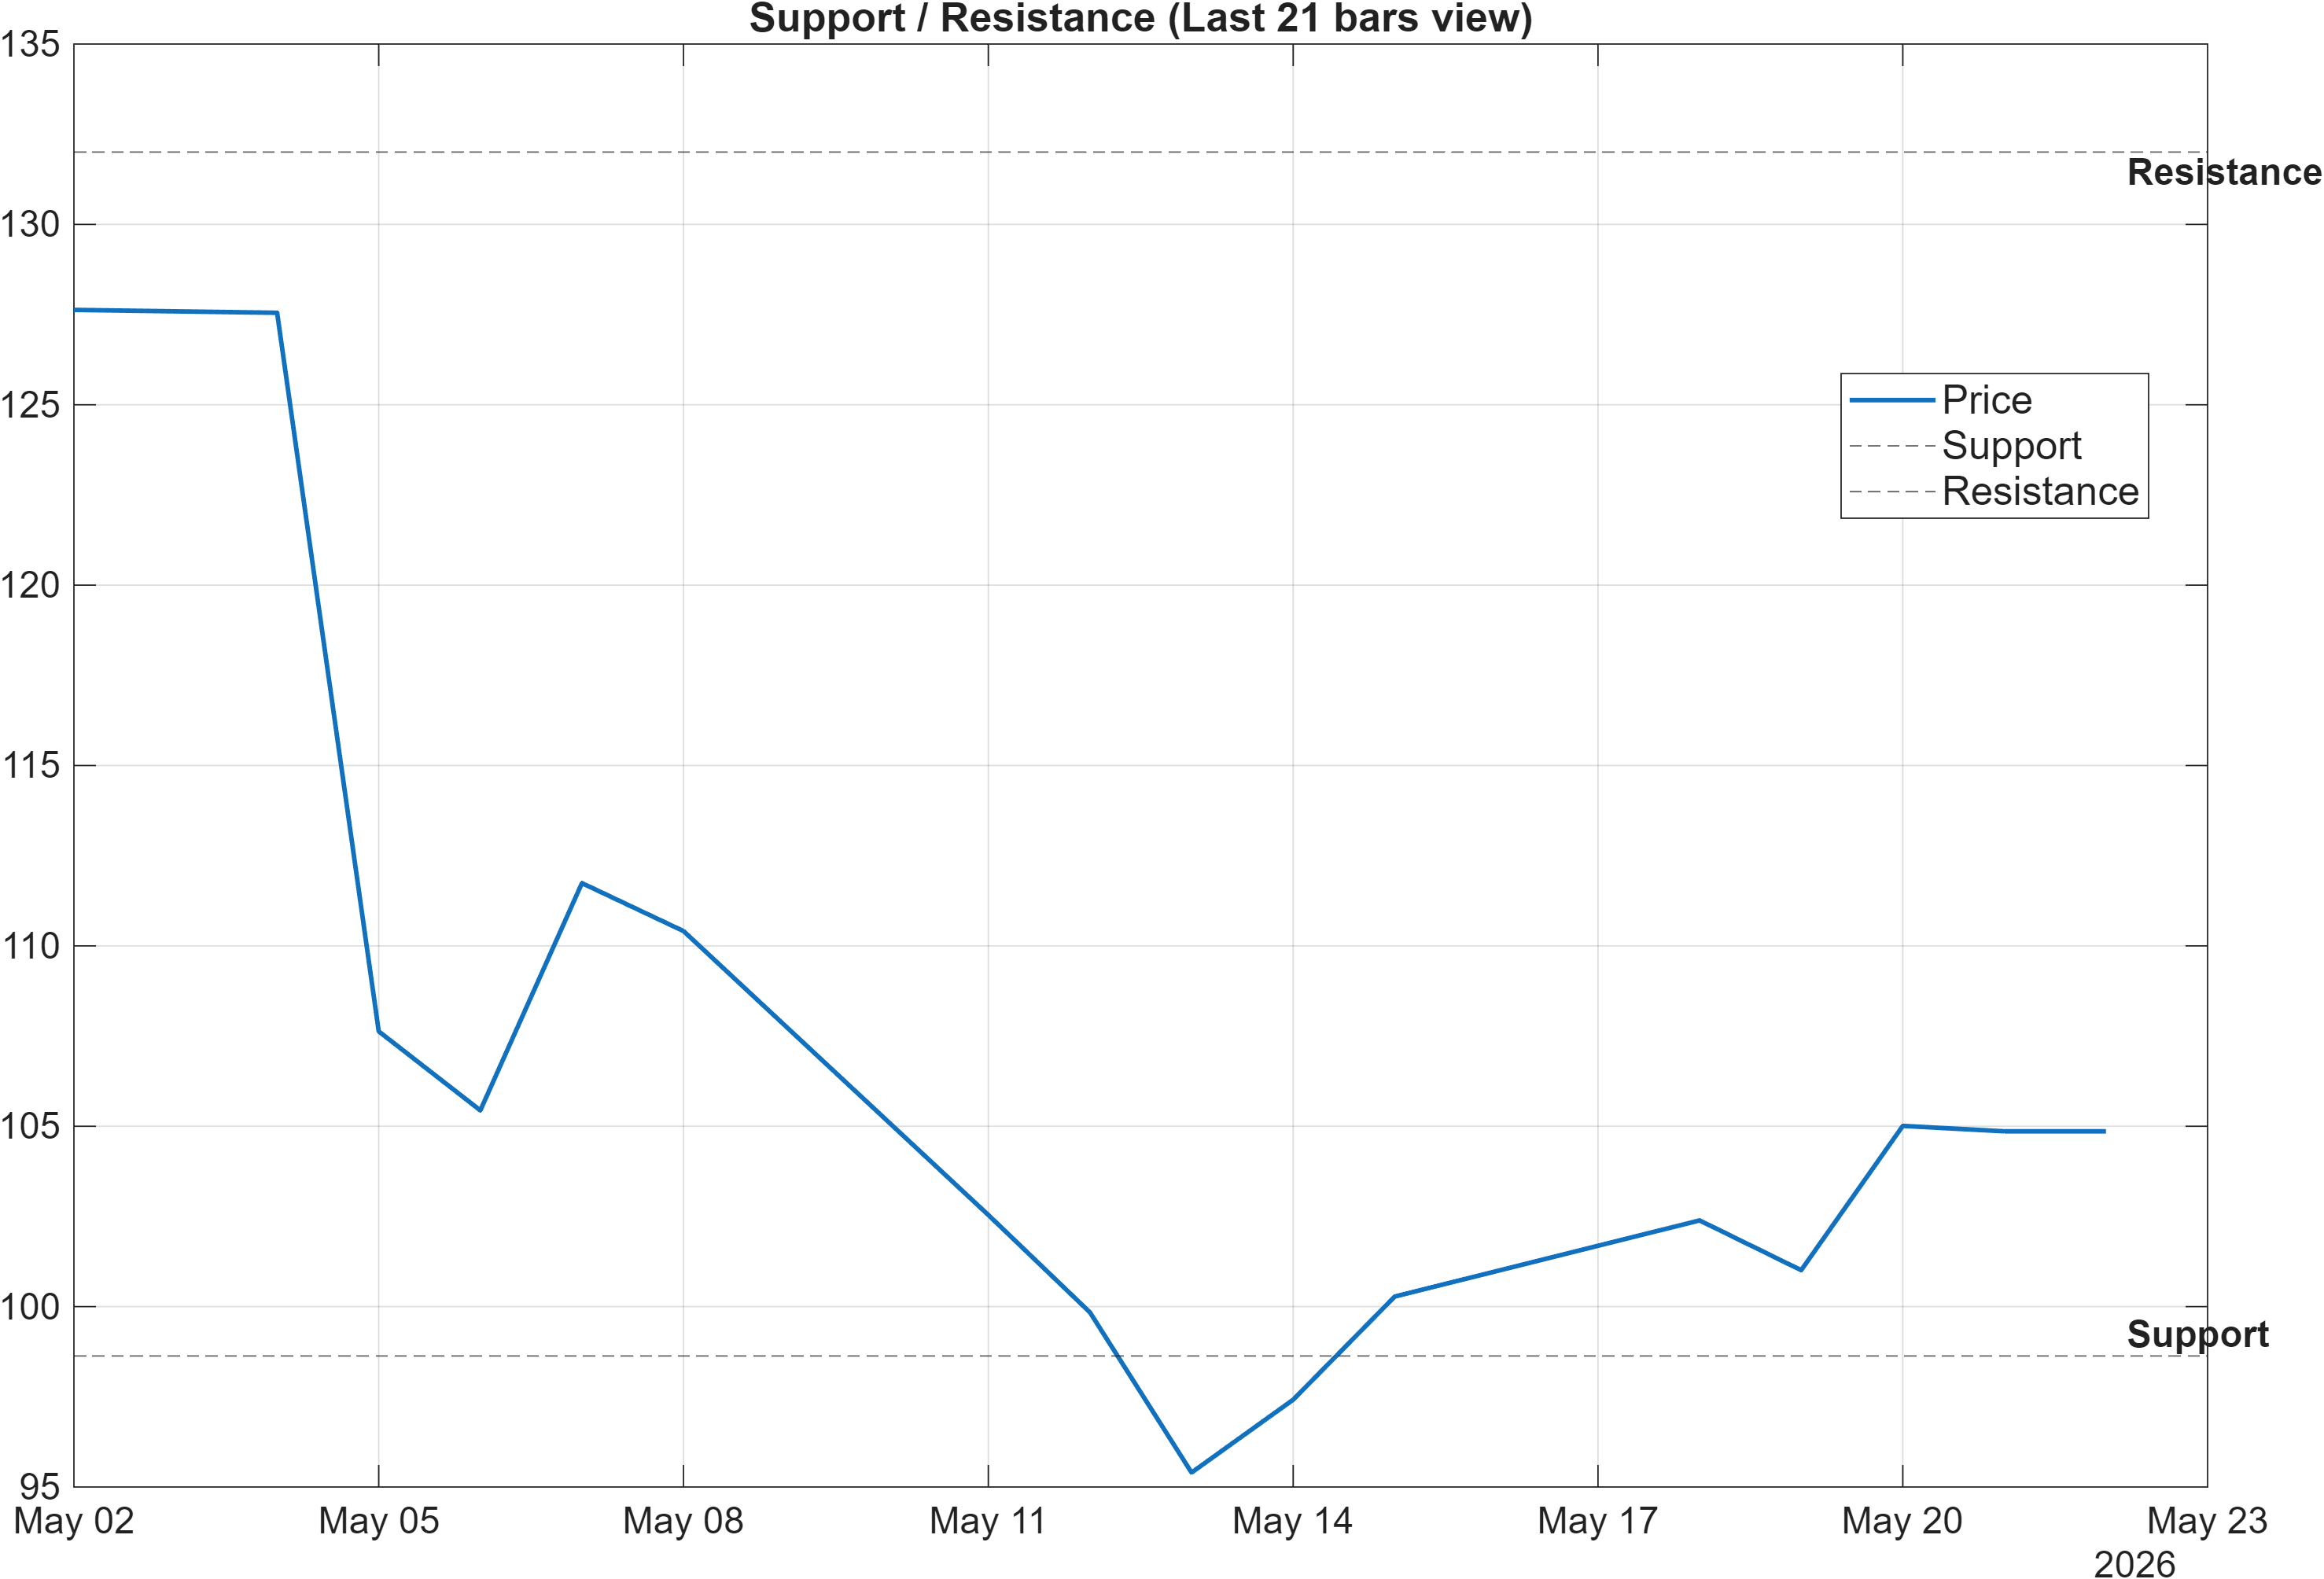
These zones define the decision boundary between a continuation attempt and renewed deterioration risk. With trend filters currently bearish (close vs MA50 and MA50 vs MA200), resistance at 132.0050 functions as more than a ceiling—it is the level that, if reclaimed and held, would better reconcile the strong cross-sectional ranks (daily #8, monthly #80) with the slower-moving trend state.
On the downside, 98.6325 is the level that matters for regime integrity. A close below support would not merely be a “bad day”; it would increase the probability that the mid-term neutral ranks (#637 over 3 months) are correctly warning that the broader regime has not improved. In that case, bullish near-term ranks become easier to interpret as counter-trend strength rather than durable trend repair.
The signal table also provides a supportive nuance: MedPx vs Support at 5.403 is flagged bullish, which is consistent with price maintaining separation from the support zone in the measured window. However, this sits alongside a bearish Vol ROC(20) at -33.26, suggesting that participation has not been expanding in a way that typically strengthens breakouts. When volume momentum is negative, markets may still traverse levels, but they can struggle to sustain acceptance beyond them.
The scenario framing remains conditional: break/hold above resistance with volume supports continuation; close below support elevates deterioration risk, especially given the bearish MA stack.
5) Quant Technical Dashboard (18 Signals)
KGNAI AI Technical Analysis Score (Deep Reinforcement Learning): Rank #860 out of 2050 (Rank 1 represents the strongest technical positioning and a higher probability of favorable price behavior. As ranks increase toward the maximum, the probability of favorable outcomes weakens and bearish positioning becomes more dominant.) | Label: Neutral | Score: 0.161
18-Signal Technical Confluence Score: 0.111 (Neutral)
Overall Technical Score (18-signal confluence + DRL rank blend): 0.126 (Neutral)
Note: The blended score reflects signal strength weighted against broader AI technical ranking, which may temporarily diverge.
Blended technical score breakdown: 0.126 (Neutral | Bull 8 / Bear 6 / Neutral 4)
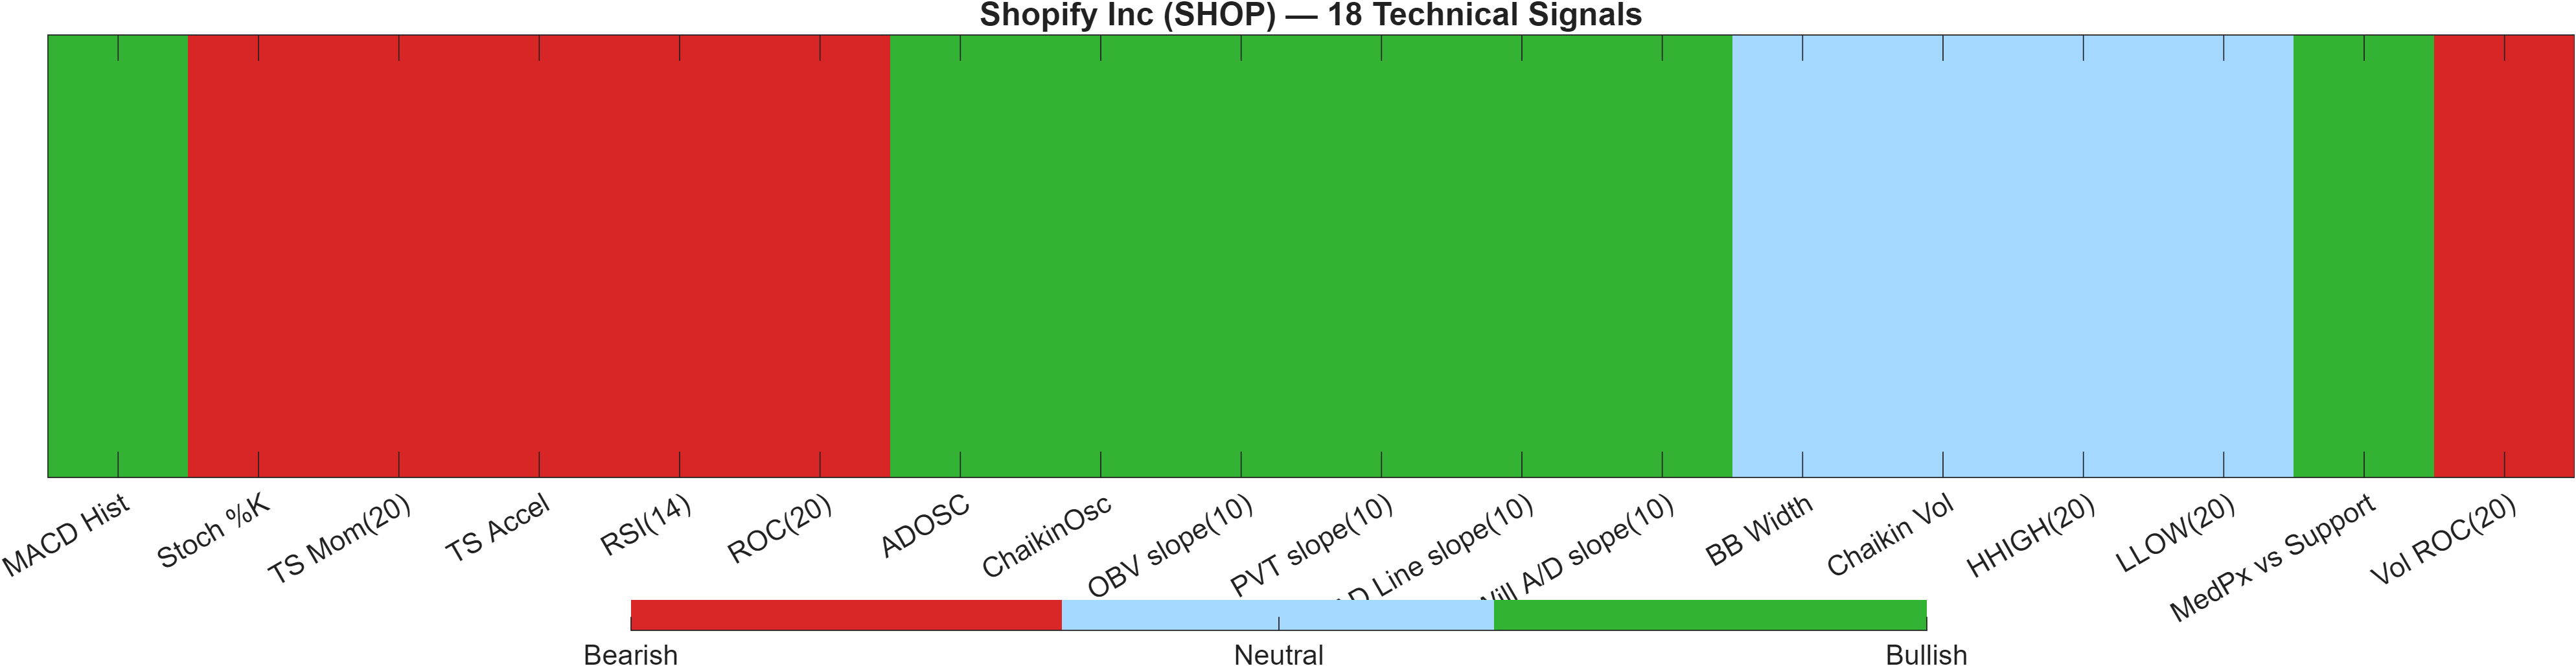
The technical layer is best described as neutral with internal dispersion. The confluence score of 0.111 and blended score of 0.126 both sit in Neutral, yet the composition (Bull 8 / Bear 6 / Neutral 4) signals that SHOP is not “flat”—it is contested. This typically coincides with markets that are tradable tactically but less reliable for one-way positioning unless a key level resolves the conflict.
The Deep Reinforcement Learning technical rank at #860 (Neutral) is a useful counterweight to the very strong short-horizon KGNAI ranks. In cross-validation terms, it argues that the broader technical state still looks average across the universe even if recent relative behavior is strong. That divergence is consistent with the bearish moving-average interpretation and the bearish momentum bias (RSI).
Inside the signal set, several accumulation and volume-flow proxies are bullish (e.g., ADOSC at 67.02 and OBV slope(10) at 3.72e+07), while classic momentum/price-rate measures remain bearish (e.g., ROC(20) at -17.81, RSI(14) at 39.92). This is a recognizable configuration when participation improves but price has not yet converted that participation into a clean trend repair—often a “build” phase rather than a confirmed breakout phase.
Signal table (Bull/Bear/Neutral)
| Indicator | Value | Signal |
|---|---|---|
| MACD Hist | 0.7618 | Bullish |
| Stoch %K | 87.47 | Bearish |
| TS Mom(20) | -22.73 | Bearish |
| TS Accel | -32.68 | Bearish |
| RSI(14) | 39.92 | Bearish |
| ROC(20) | -17.81 | Bearish |
| ADOSC | 67.02 | Bullish |
| ChaikinOsc | 6.547e+06 | Bullish |
| OBV slope(10) | 3.72e+07 | Bullish |
| PVT slope(10) | 2.991e+05 | Bullish |
| AD Line slope(10) | 3.191e+07 | Bullish |
| Will A/D slope(10) | 15.25 | Bullish |
| BB Width | 0.3174 | Neutral |
| Chaikin Vol | -2.483 | Neutral |
| HHIGH(20) | 129.4 | Neutral |
| LLOW(20) | 94 | Neutral |
| MedPx vs Support | 5.403 | Bullish |
| Vol ROC(20) | -33.26 | Bearish |
Overall, the dashboard favors a wait-for-resolution posture: a confirmed move through resistance would improve alignment across trend, momentum, and the already-strong short-horizon ranks; a loss of support would tilt the balance toward the bearish momentum cluster that is still present across ROC/RSI and related measures.
6) News sentiment + extractive gist
Sentiment score (avg): 0.115 | Positive: 46% | Neutral: 54% | Negative: 0%
KGNAI AI News Sentiment Score (normalized -1 to +1): 0.99 (as of 2026-05-22) | Label: Bullish | Overall news score: 0.93
Positive Developments
Recent coverage across major financial outlets indicates a broadly constructive tone around Shopify, emphasizing product capability and ecosystem positioning rather than near-term volatility. The sentiment normalization at 0.99 aligns with this backdrop, even though the digest mix is still dominated by neutral items (54%). Commentary frequently frames Shopify’s platform model and payments-driven engagement as strategically relevant, which can support investor attention during transitional technical regimes. The absence of negative items in the digest (0%) also reduces headline-driven downside skew in the immediate narrative set. In a market-structure sense, constructive news flow can help explain why the cross-sectional ranks are strong (daily #8) despite bearish moving-average signals: relative demand can improve first through positioning and narrative stabilization, then later show up in trend confirmation.
Neutral / Mixed Developments
The average sentiment score of 0.115 is modest, consistent with an information-heavy feed that does not uniformly translate into directional conviction. A large neutral share (54%) suggests market participants are receiving updates and commentary without a clear consensus on near-term trajectory. This matters because neutral news regimes often coincide with range-bound behavior around technical decision levels such as 98.6325 and 132.0050. When news is mostly contextual, price tends to defer to technical structure—momentum indicators like RSI(14) at 39.92 and volatility metrics like bandwidth 0.3174 can become the primary timing inputs.
Negative / Risk Signals
While the digest shows 0% negative items, “risk” remains present through signal inconsistency rather than adverse headlines. The market is still contending with bearish trend flags (close vs MA50 and MA50 vs MA200) and a bearish RSI bias, which can amplify drawdowns if price loses structural support at 98.6325. Another risk is that constructive sentiment can become crowded without being validated by participation; the technical table’s Vol ROC(20) at -33.26 indicates volume momentum is not currently reinforcing a breakout narrative. If price fails repeatedly near resistance 132.0050, news positivity may not be sufficient to sustain the short-term rank advantage.
- Whether price can reclaim and hold above 132.0050 alongside improving participation (watch volume behavior versus the current Vol ROC(20) -33.26).
- Whether RSI(14) can recover from 39.92 while MACD hist remains positive at 0.7618.
- Downside integrity of 98.6325 support if the bearish MA stack persists.
Sources referenced: Reuters, Bloomberg, Yahoo Finance, MarketWatch, Investing.com
7) Sources
Not available in the provided data.
You may also like: How KGNAI AI ranks instruments across global markets
Disclaimer: KGNAI provides AI-generated analytics and educational market commentary only. This is not financial advice. Markets involve risk. Always do your own research.