
Lamb Weston Holdings Inc (LW) — Quant rank strength vs mixed momentum signals (01-Mar-2026)
Lamb Weston Holdings Inc (LW) enters 01-Mar-2026 with a constructive medium-to-long horizon rank profile inside KGNAI’s 2067-instrument U.S. universe, while near-term technicals remain more mixed. The longer-horizon ranks (including #29 on the 3-month and #34 on the 6-month) contrast with a more moderate #394 daily reading, consistent with a market state where longer-cycle positioning is stronger than the latest momentum impulse. On the indicator layer, the 18-signal blend is Neutral (-0.167) and the combined technical blend is also Neutral (0.176), despite an AI technical rank of #26 (Bullish) that can temporarily diverge from the indicator stack. Key decision zones remain defined by support ~40.9250 and resistance ~50.6963. News sentiment is narrowly positive by normalized scoring (0.99) but distribution remains mostly neutral (57%), suggesting context support rather than a standalone driver.
- Rank stance (Short / Mid / Long): Neutral / Bullish / Bullish (daily rank #394 vs 3-month #29 and 6-month #34).
- Technical confluence label: Neutral (18-signal -0.167; overall technical 0.176), alongside DRL technical rank #26 (Bullish).
- Key levels: Support 40.9250 | Resistance 50.6963.
- News sentiment bias: Slight positive tilt (avg 0.022; normalized 0.99) with a largely neutral article mix (57% neutral).
- Confirmation / invalidation: A break above 50.6963 with volume supports continuation conditions; a close below 40.9250 increases deterioration risk per the scenario framework.
KGNAI evaluates assets using large cross-sectional datasets built from millions of structured data points. Inputs incorporate fundamental metrics, technical structures, and systematically processed news sentiment. Statistical models, machine learning, and AI frameworks are used to assess relative positioning, signal alignment, and probabilistic behavior across broad universes.
- Ranks are comparative across the tracked universe, not absolute price targets.
- Confluence reflects alignment among independent signal groups.
- Support/resistance levels are probabilistic decision zones, not guarantees.
- Sentiment provides contextual bias within the broader analytical framework.
1) KGNAI AI Analysis
Region: USA
Total universe size: 2067 ranked instruments
- Daily rank: #394 out of 2067 — Bullish
- Weekly rank: #419 out of 2067 — Neutral
- Monthly rank: #87 out of 2067 — Bullish
- 3-Monthly rank: #29 out of 2067 — Bullish
- 6-Monthly rank: #34 out of 2067 — Bullish
- Yearly rank: #174 out of 2067 — Bullish
The rank stack for LW is best described as timeframe dispersion with a bullish longer-cycle anchor. The 3-month (#29) and 6-month (#34) readings place LW in the top decile of the tracked universe, indicating stronger relative positioning on multi-month behavior. The monthly rank (#87) remains in the upper slice as well, consistent with constructive intermediate conditions.
By contrast, the daily (#394) and weekly (#419) ranks sit closer to the upper quartile / top-third boundary rather than the very top of the distribution, aligning with the report’s stated Short-term: Neutral posture. This configuration often appears when a broader trend or mean-reversion regime remains intact, but the most recent impulse is not fully synchronized across shorter-horizon tests.
The practical interpretation is not that the longer-horizon ranks “overrule” the shorter horizon, but that LW’s current state is more consistent with pullback/repair dynamics inside a stronger multi-month ranking profile than with a uniformly accelerating tape. For readers focused on regime classification, the dominant feature is that the mid-to-long ranks remain supportive while the short-term ranks warrant additional confirmation from price structure, momentum, and volume behavior.
Term view: Short-term: Neutral. Mid-term: Bullish. Long-term: Bullish.
Want the full universe and complete rank tables? Unlock full access on KGNAI: https://www.kgnai.com/pricing
2) Price & trend overview
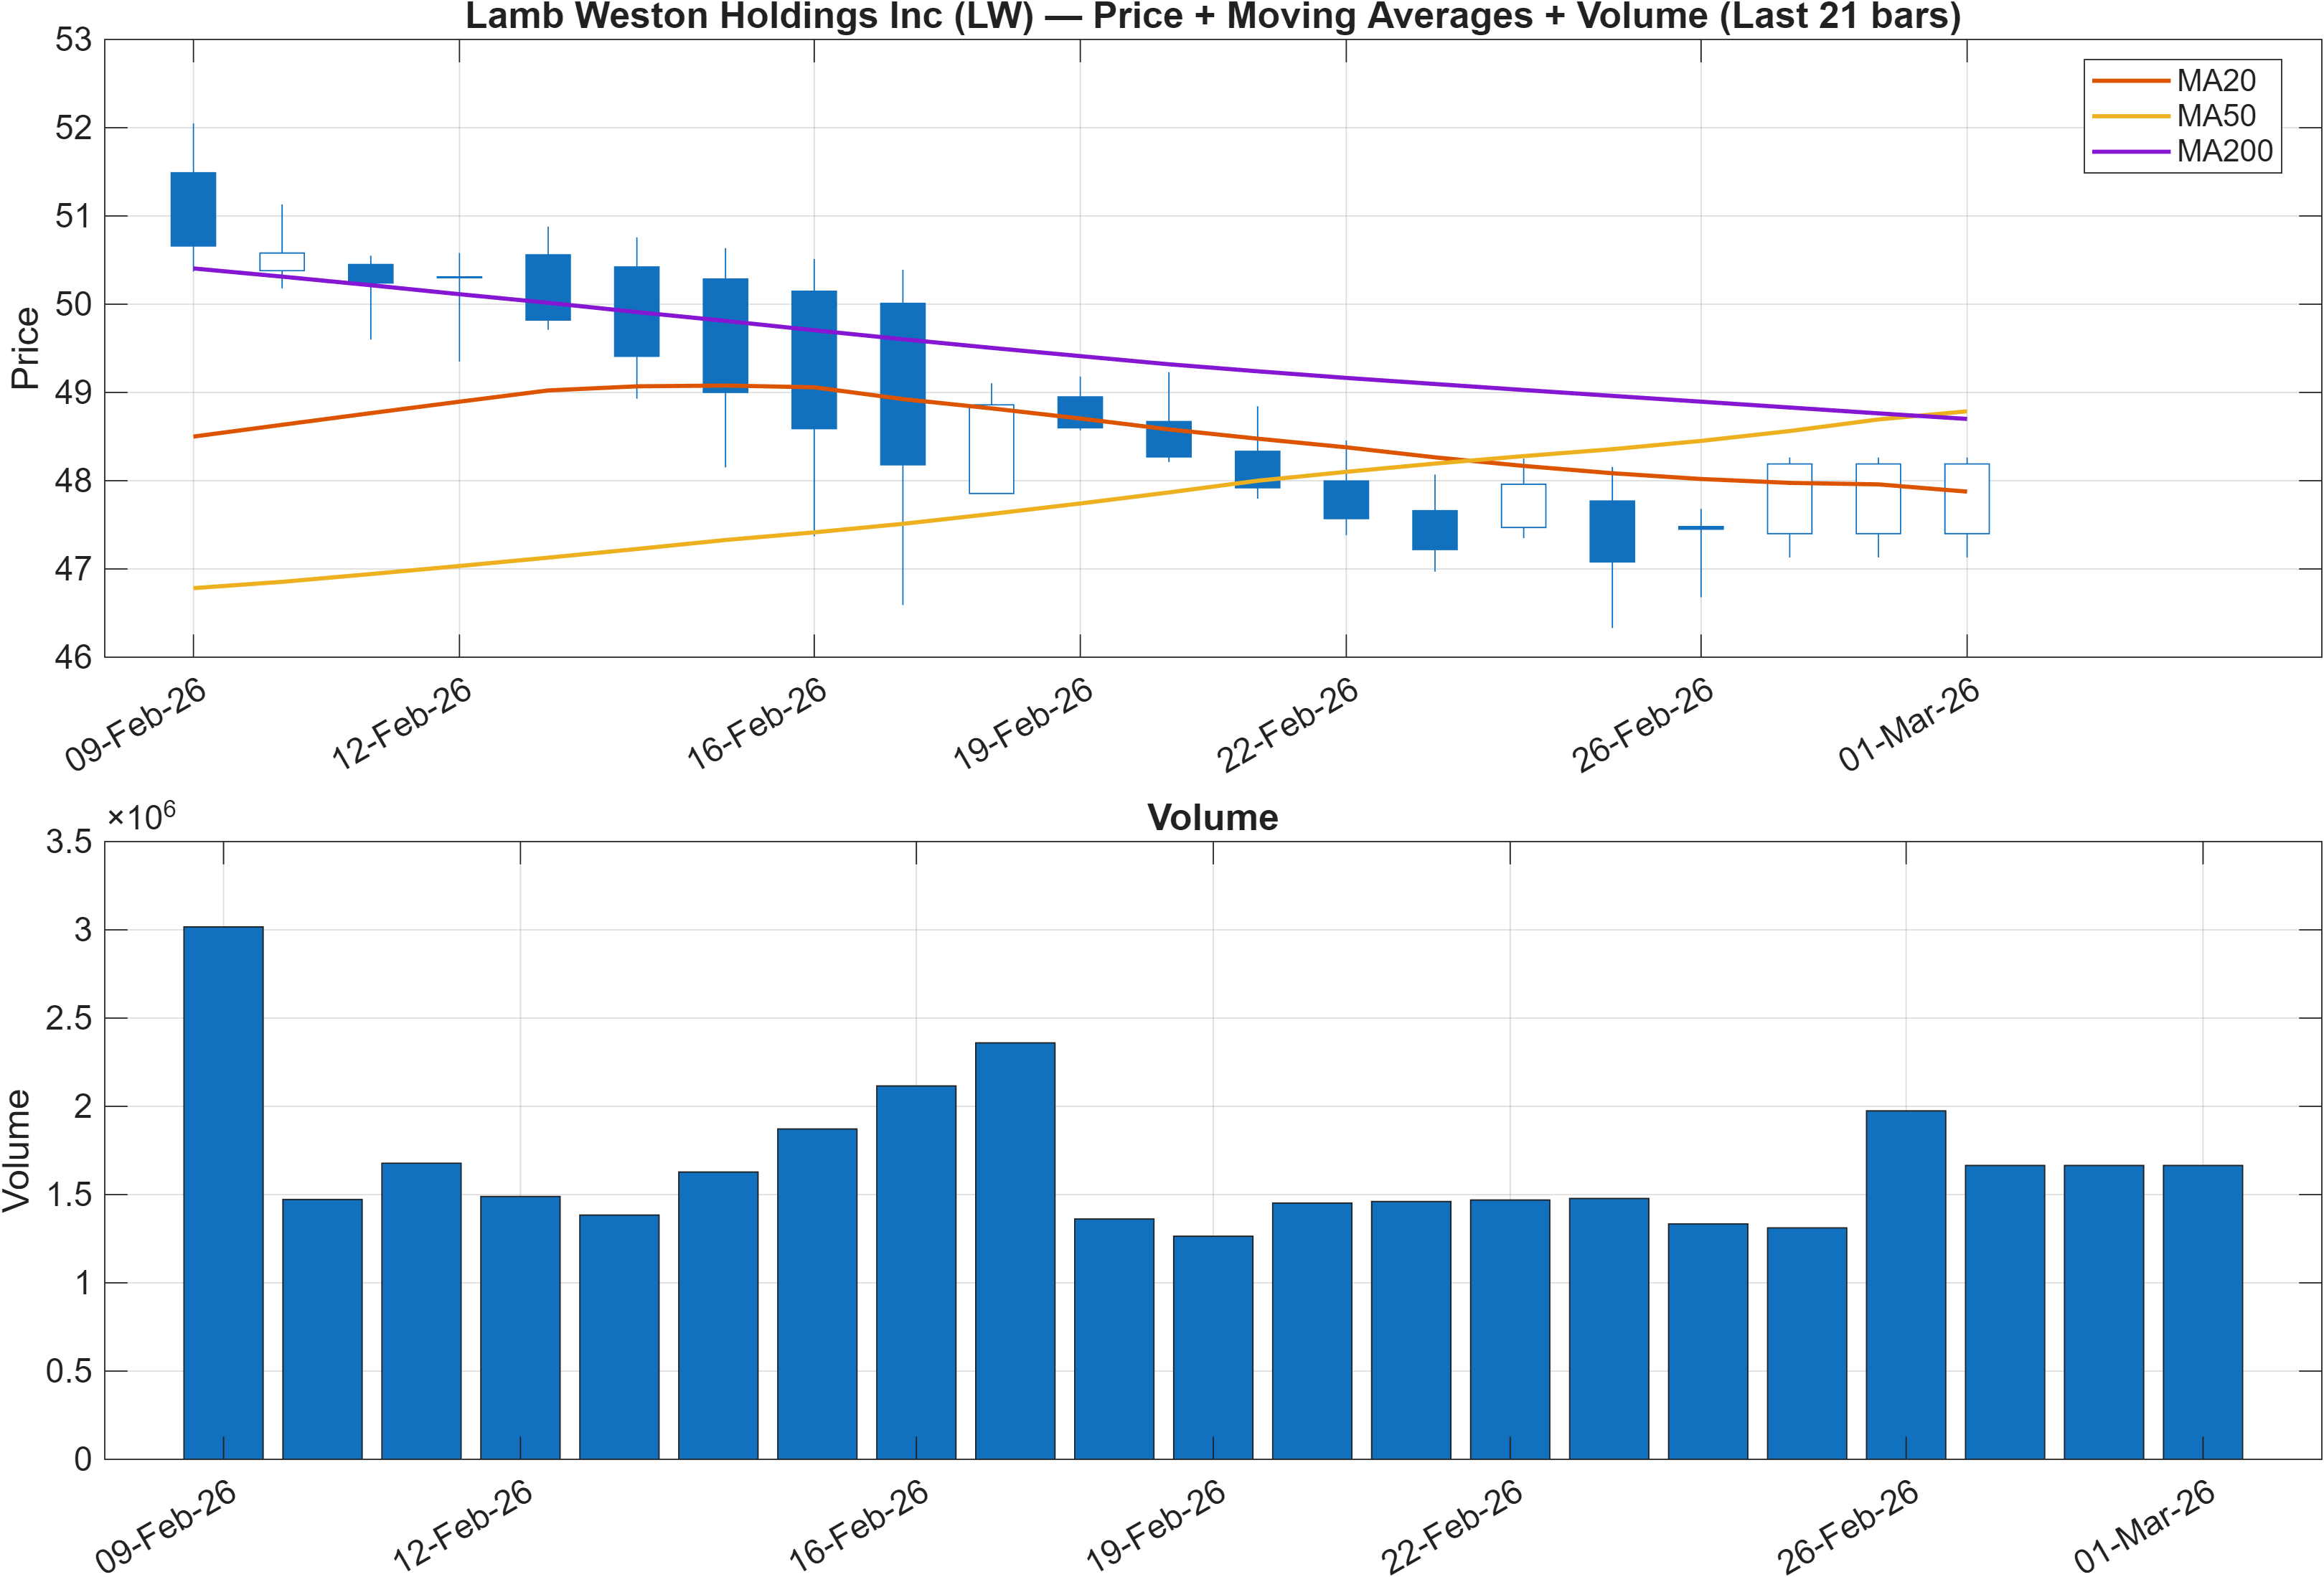
The moving-average read is explicitly split: Close vs MA50 = Bearish while MA50 vs MA200 = Bullish. That combination is typically consistent with a pullback within a broader uptrend structure or a re-accumulation phase after an extended move. In other words, the longer-cycle trend proxy (MA50 above MA200) remains constructive, but recent price action has slipped below the intermediate trend line (MA50), which is often where trend durability is tested.
This aligns well with the rank dispersion seen in Section 1: multi-month ranks (for example, #29 and #34) are stronger than the short-horizon ranks (#394, #419). When these layers agree, the core question becomes whether price can reclaim the MA50 with improving participation, or whether the dip evolves into a more persistent de-risking phase.
Volume adds an important filter in this framework, because the scenario logic later emphasizes a break above resistance with volume. Without introducing new volume statistics beyond the provided figure, the analytical takeaway is that the current structure calls for validation through participation, not just price drifting higher.
From a regime perspective, the trend template still leans constructive due to MA50 vs MA200 being bullish, but the near-term positioning remains conditional until price behavior improves relative to the MA50 and interacts with the nearby decision zones (support 40.9250, resistance 50.6963).
3) Momentum & volatility dashboard
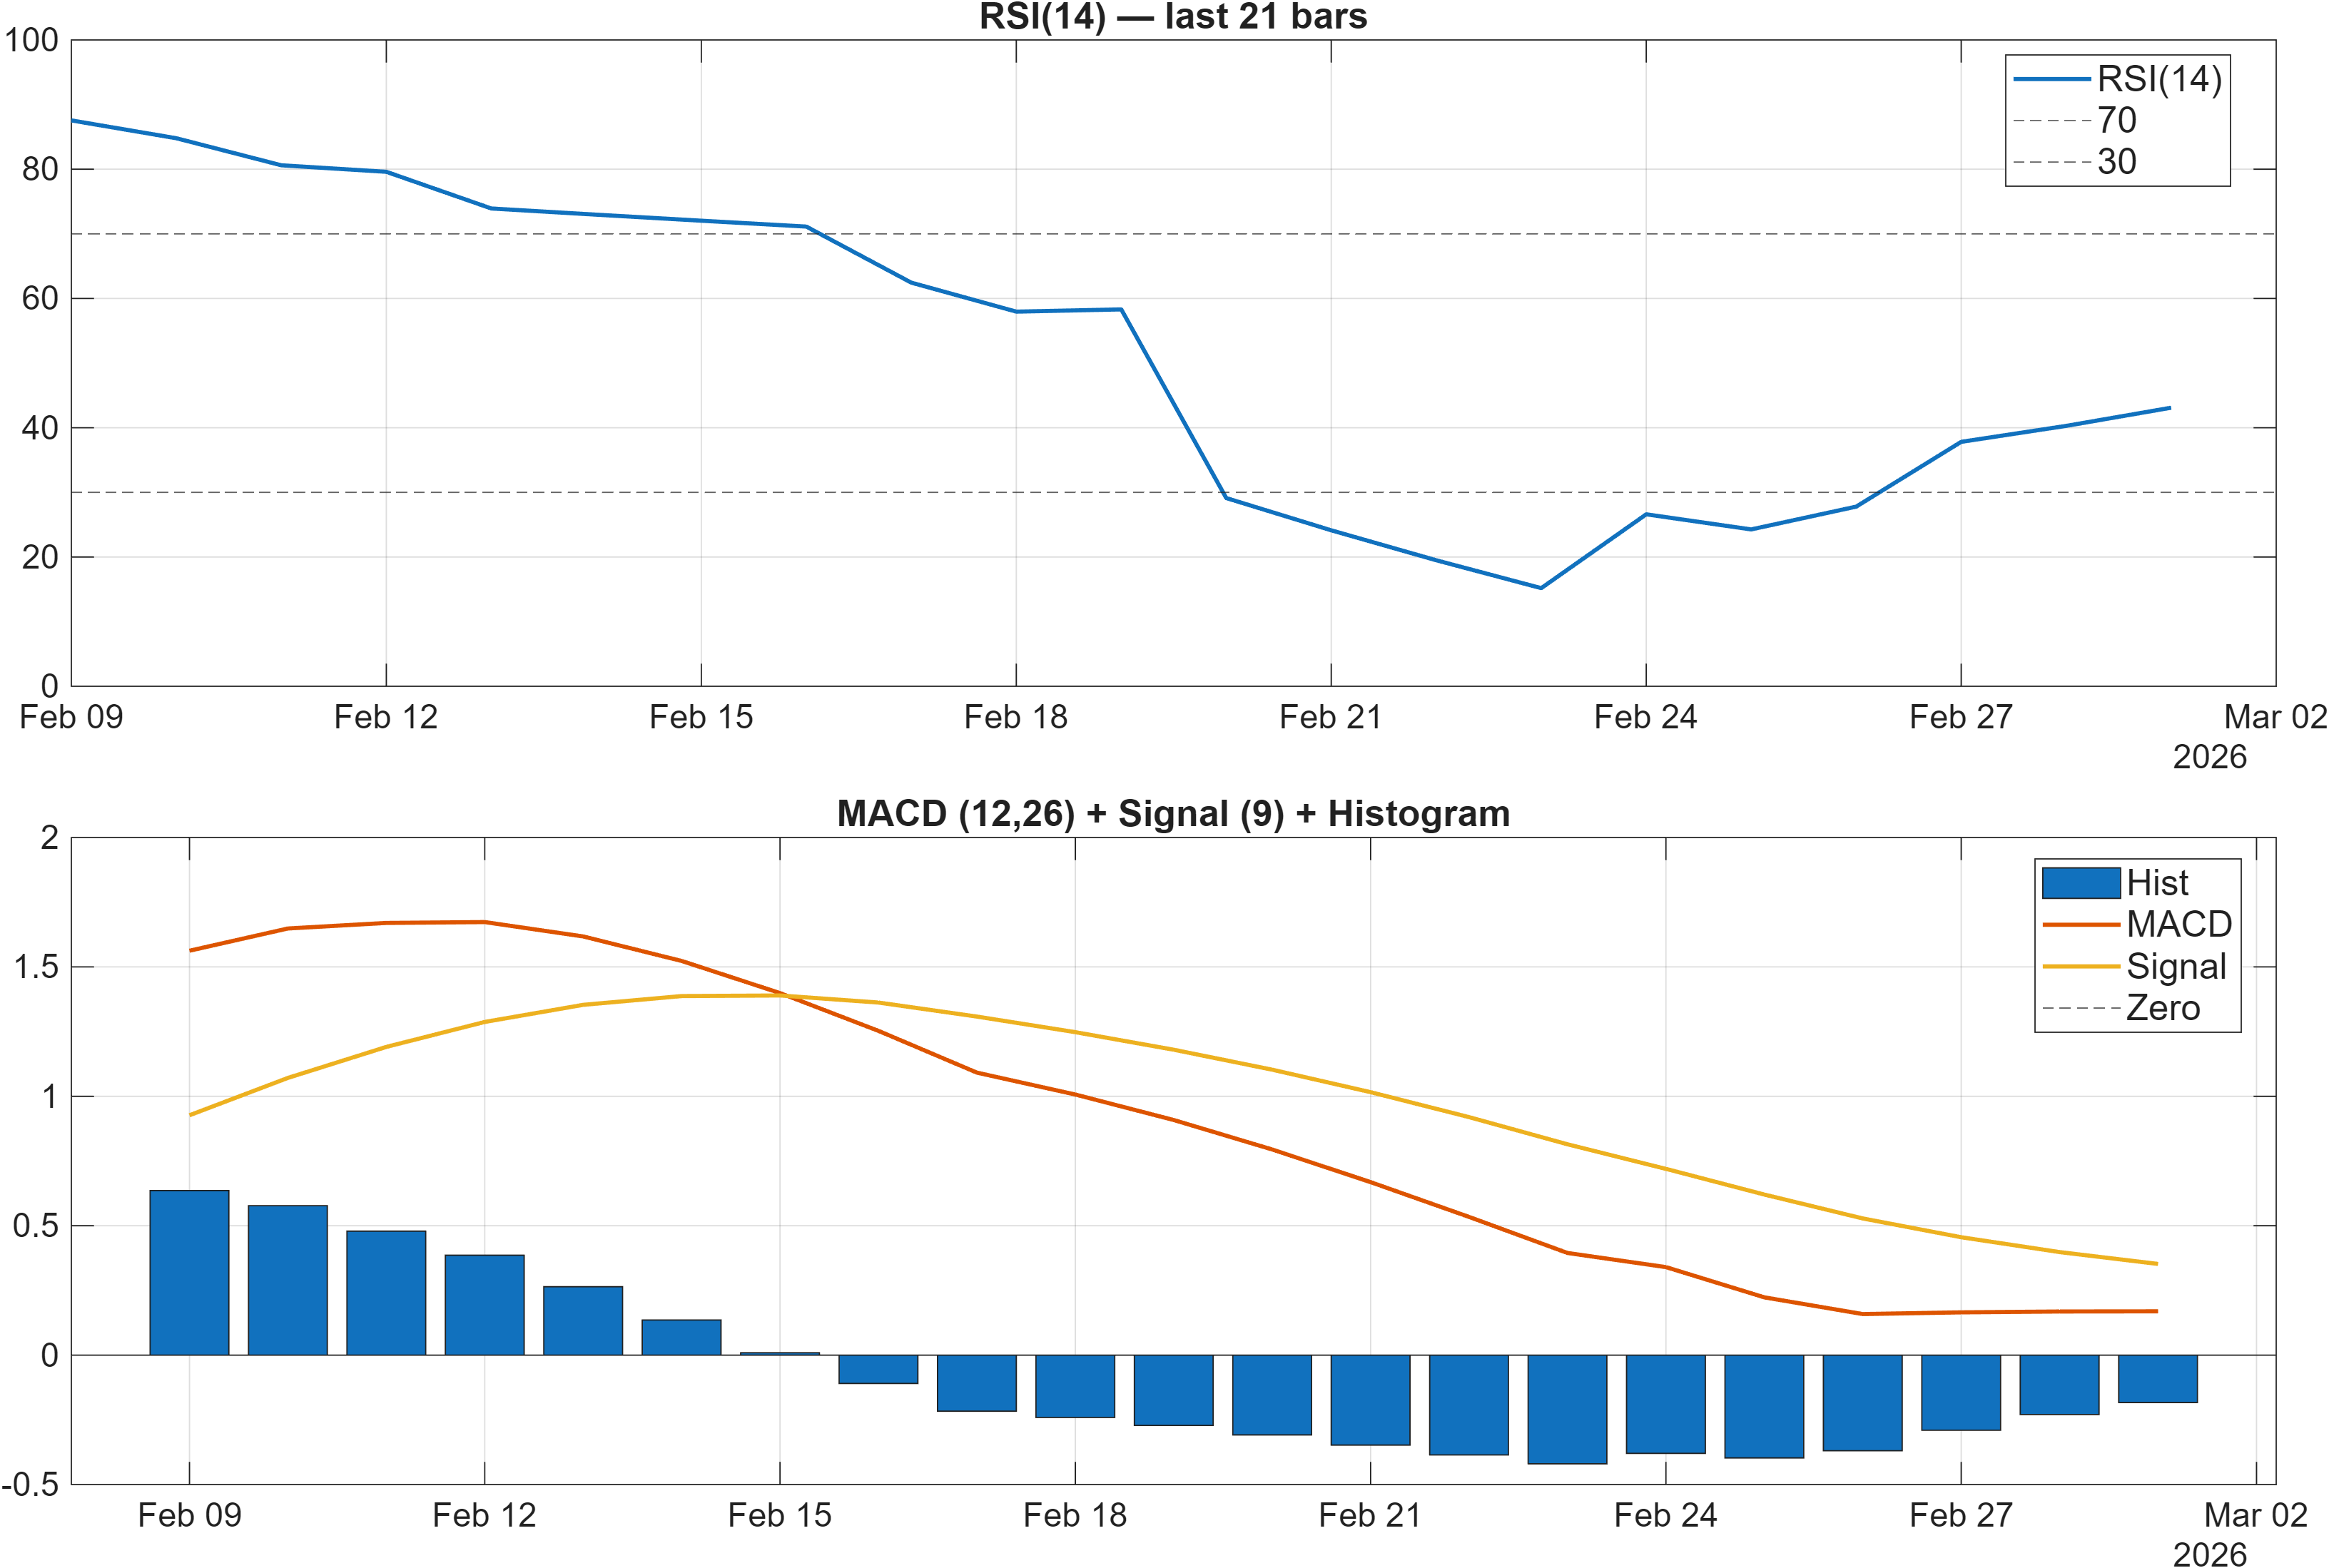
Interpretation: RSI bias = Neutral, MACD hist = -0.1831.
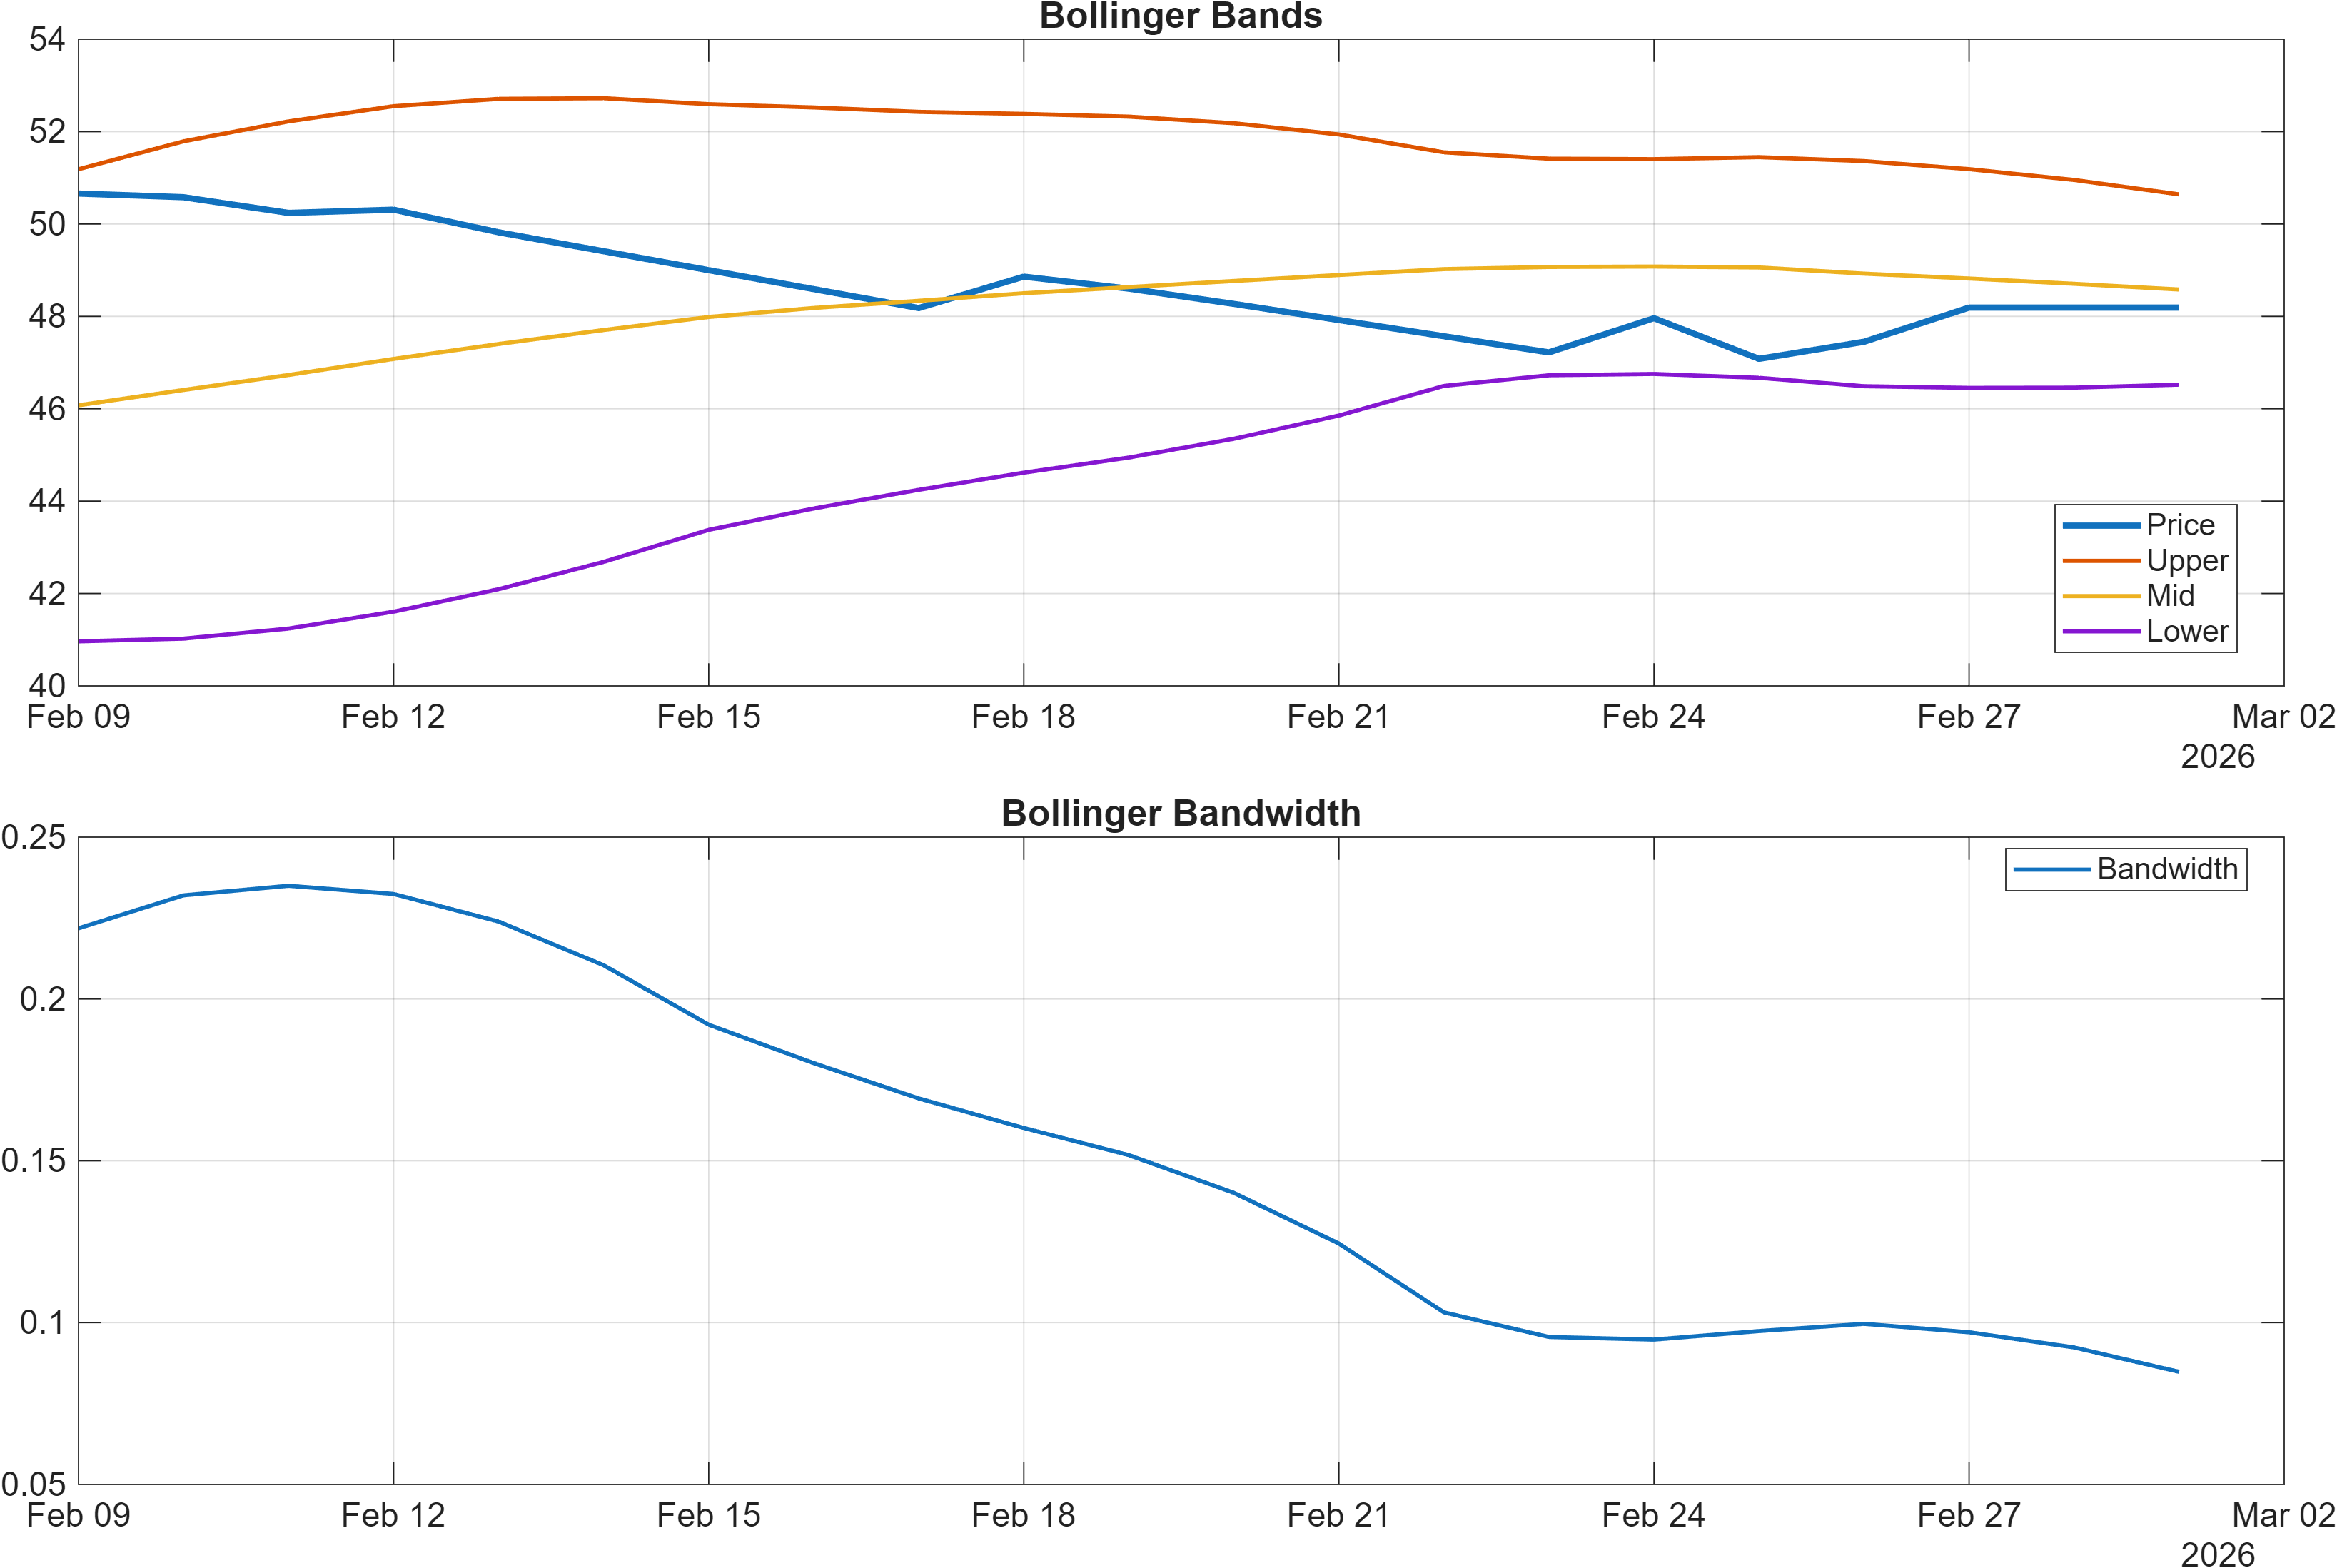
Interpretation: Bandwidth (volatility regime) latest = 0.0848.
Momentum is currently characterized more by hesitation than impulse. The MACD histogram at -0.1831 sits on the bearish side, signaling that downside momentum has not fully dissipated. At the same time, the dashboard calls the RSI bias Neutral, and the signal table later specifies RSI(14) = 43.1 (Bearish). Taken together, this points to a momentum profile that is not oversold by construction but still below the stronger bullish thresholds that often accompany sustained trend continuation.
Volatility conditions appear comparatively restrained. Bollinger Bandwidth at 0.0848 suggests a tighter volatility regime than would be expected during strong directional breakouts. In practice, tighter bandwidth often coincides with compression phases where price becomes more sensitive to nearby levels, and where breaks can be meaningful when confirmed by participation and follow-through.
The analytical tension is clear: a negative MACD histogram and a sub-50 RSI reading typically argue for caution on immediate trend acceleration, while the longer-horizon rank strength argues that the broader positioning has not meaningfully deteriorated. When compression (bandwidth 0.0848) combines with mixed momentum, the market often shifts into a level-driven state—making the support/resistance framework in Section 4 the more actionable lens for distinguishing continuation from drift.
4) Support / Resistance zones
Support ~ 40.9250 | Resistance ~ 50.6963
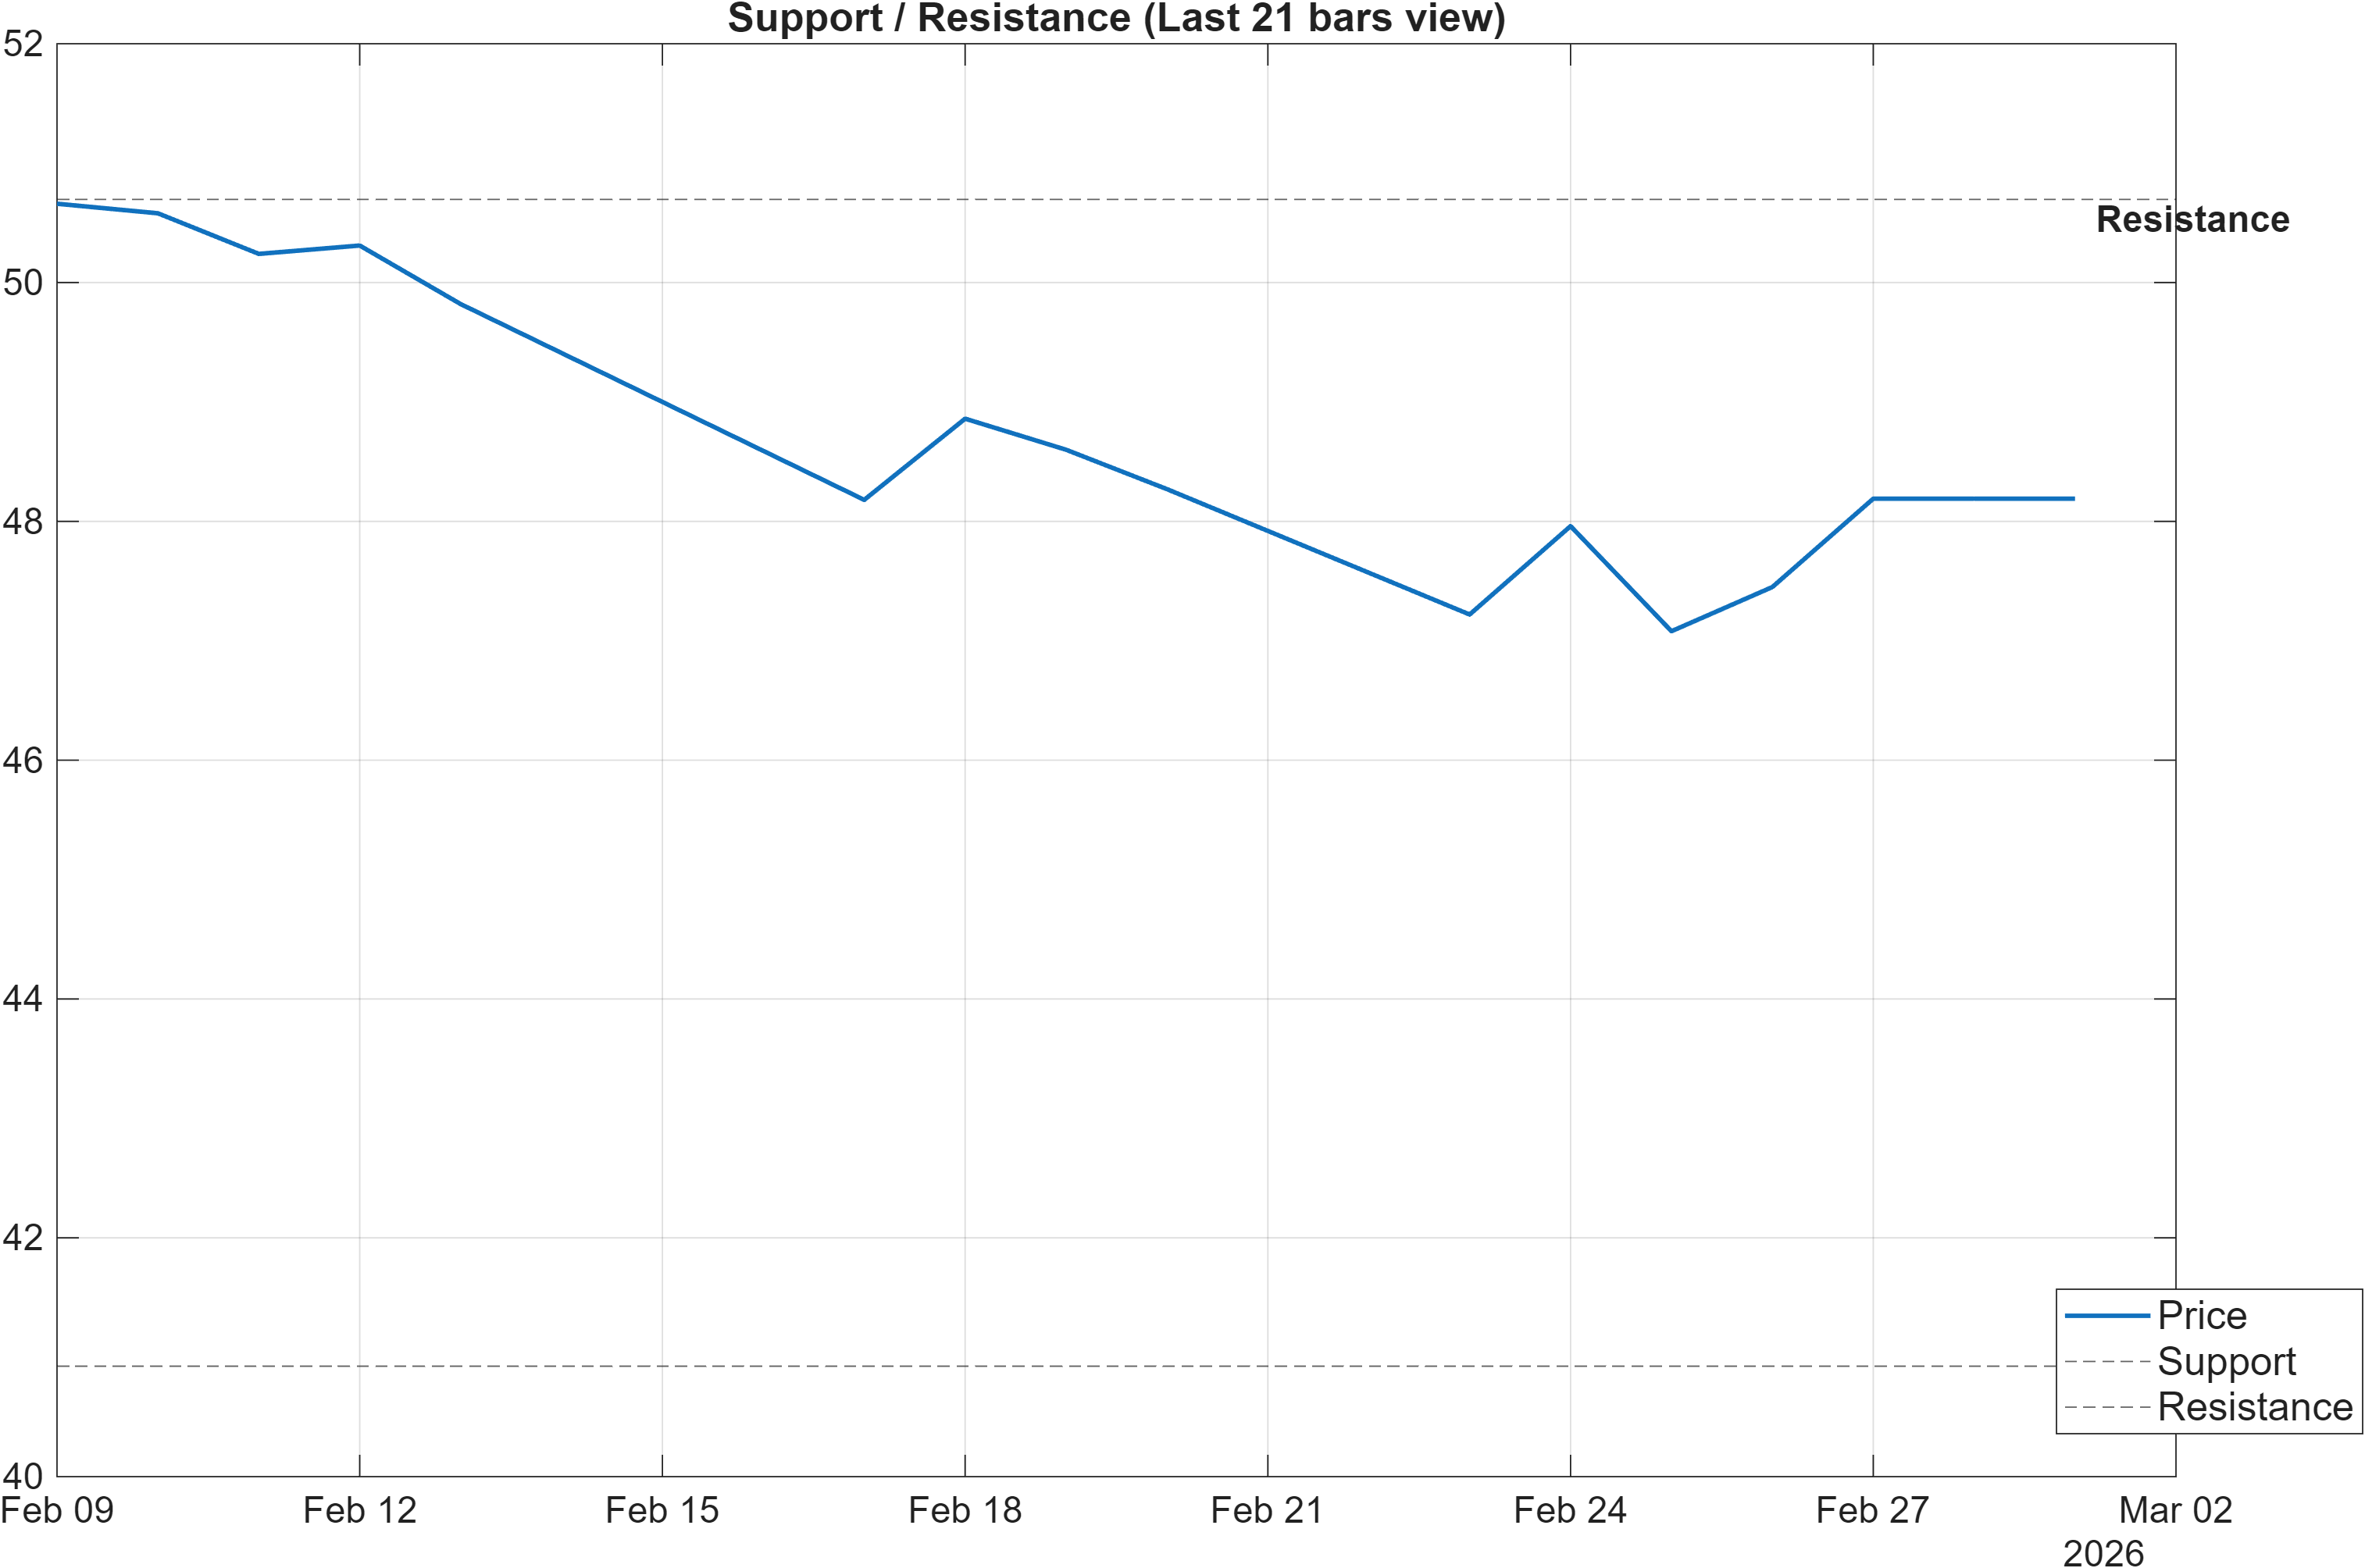
Scenario view: Break above resistance with volume → continuation. Close below support → signal deterioration risk.
The current map is clean: 40.9250 defines the primary support zone and 50.6963 defines the primary resistance zone. With momentum readings mixed (MACD histogram -0.1831) and volatility relatively compressed (bandwidth 0.0848), these levels take on added importance as probabilistic decision points rather than simple lines on a chart.
A break above 50.6963 with volume is framed as the continuation condition. In the context of Section 2’s moving-average split (close below MA50 but MA50 above MA200), a confirmed resistance break would also serve as evidence that price is regaining intermediate trend control. That would reduce the current short-horizon uncertainty implied by the daily and weekly ranks (#394, #419).
Conversely, the report flags a close below 40.9250 as deterioration risk. That condition matters because it would likely align with the already-soft momentum profile (RSI(14) 43.1 bearish, MACD histogram negative) and could force the longer-horizon bullish ranks to be re-evaluated as the market transitions from pullback to potential regime shift.
With the distance between the key levels defined, the analytical priority is how price behaves into these zones—whether it shows absorption and stabilization near support, or whether it displays acceptance below it; and whether resistance is rejected or absorbed with follow-through.
5) Quant Technical Dashboard (18 Signals)
KGNAI AI Technical Analysis Score (Deep Reinforcement Learning): Rank #26 out of 2067 (Rank 1 represents the strongest technical positioning and a higher probability of favorable price behavior. As ranks increase toward the maximum, the probability of favorable outcomes weakens and bearish positioning becomes more dominant.) | Label: Bullish | Score: 0.975
18-Signal Technical Confluence Score: -0.167 (Neutral)
Overall Technical Score (18-signal confluence + DRL rank blend): 0.176 (Neutral)
Note: The blended score reflects signal strength weighted against broader AI technical ranking, which may temporarily diverge.
Blended technical score breakdown: 0.176 (Neutral | Bull 5 / Bear 8 / Neutral 5)
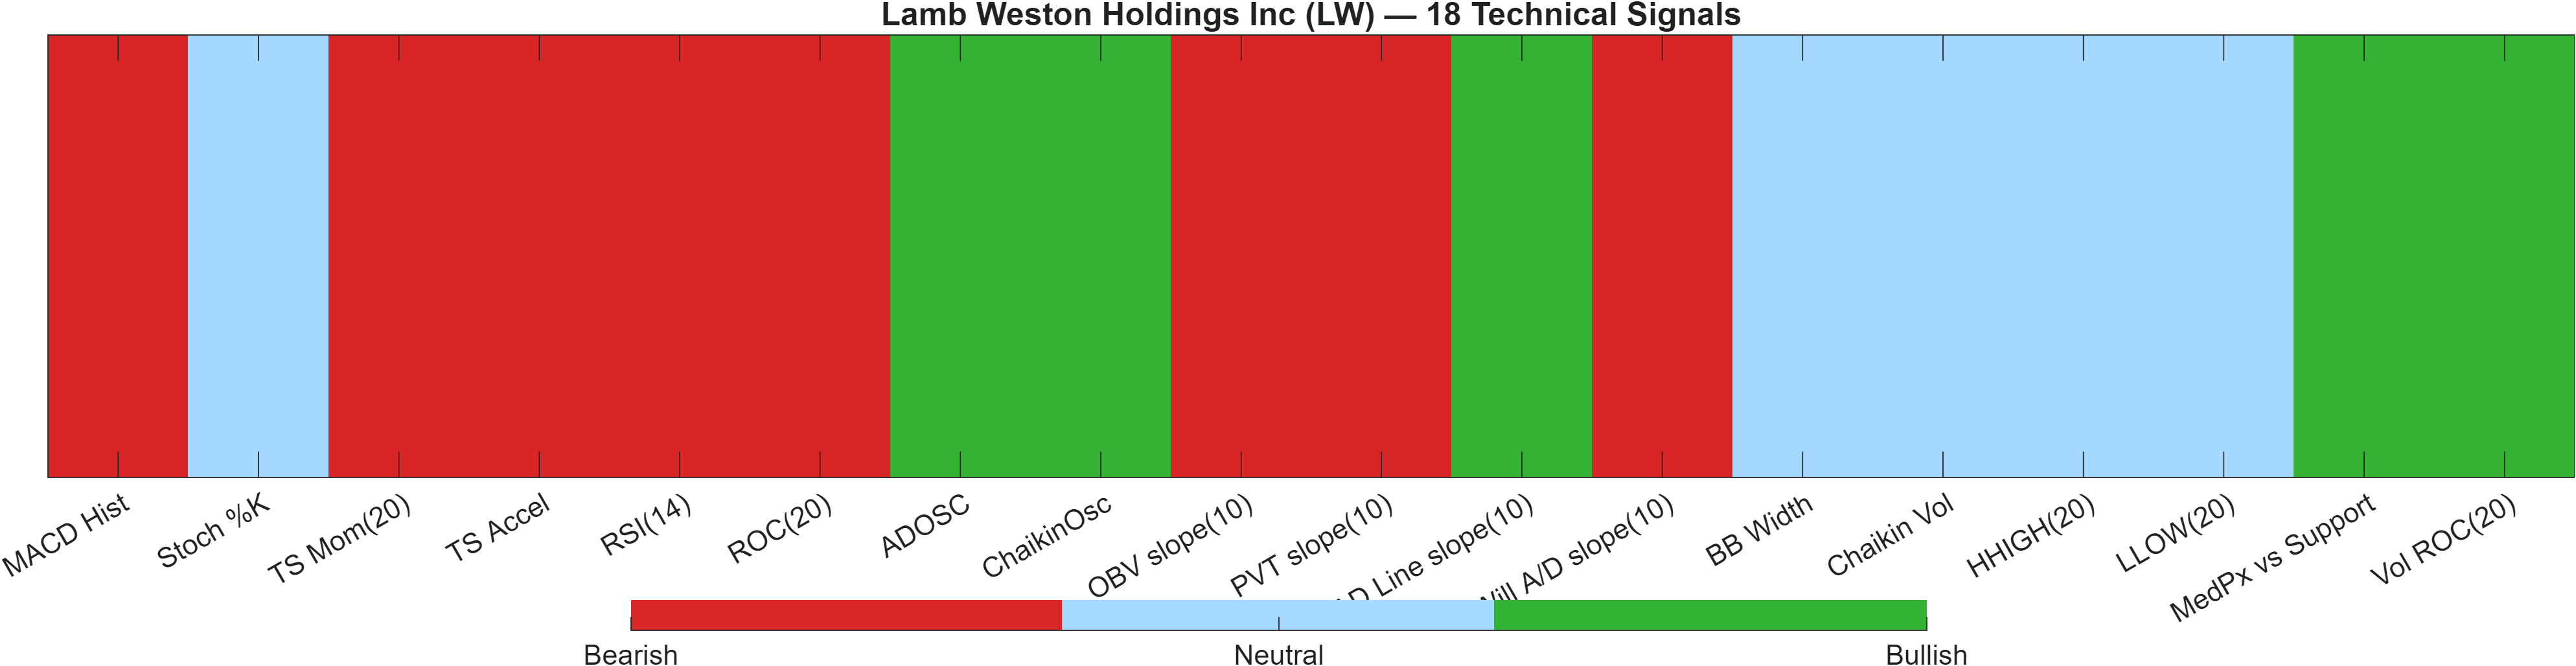
Signal alignment: confluence vs model rank
The most informative feature here is the controlled divergence between the indicator stack and the AI technical rank. The Deep Reinforcement Learning technical model places LW at #26 out of 2067 with a Bullish label (score 0.975), which is an upper-tier reading. Yet the 18-signal confluence score is -0.167 (Neutral) and the blended overall technical score is 0.176 (Neutral), with more bearish signals than bullish (Bear 8 vs Bull 5).
This is a regime where model-based positioning can be stronger than the latest surface-level indicators. Conceptually, that may occur when the model is capturing broader pattern similarities or state transitions that are not fully reflected in short-window oscillators. The note explicitly warns that the blend may temporarily diverge, and the current readings illustrate that point.
Indicator-level pressure points (without over-reading single signals)
Within the signal table, several momentum measures lean bearish, including RSI(14) = 43.1 (Bearish) and MACD Hist = -0.1831 (Bearish), which supports the “short-term neutral” stance. At the same time, there are constructive participation/flow signals such as ADOSC = 84.86 (Bullish), hinting that the tape may be undergoing accumulation-like behavior even as momentum remains soft. Volatility is not strongly directional, with BB Width = 0.08481 marked Neutral, consistent with the compression profile in Section 3.
Signal-state label badges
Signal table (Bull/Bear/Neutral)
| Indicator | Value | Signal |
|---|---|---|
| MACD Hist | -0.1831 | Bearish |
| Stoch %K | 64.14 | Neutral |
| TS Mom(20) | -2.39 | Bearish |
| TS Accel | -8.86 | Bearish |
| RSI(14) | 43.1 | Bearish |
| ROC(20) | -4.725 | Bearish |
| ADOSC | 84.86 | Bullish |
| ChaikinOsc | 1.288e+06 | Bullish |
| OBV slope(10) | -2.198e+06 | Bearish |
| PVT slope(10) | -3737 | Bearish |
| AD Line slope(10) | 1.495e+06 | Bullish |
| Will A/D slope(10) | -2.126 | Bearish |
| BB Width | 0.08481 | Neutral |
| Chaikin Vol | -25.9 | Neutral |
| HHIGH(20) | 51.13 | Neutral |
| LLOW(20) | 46.33 | Neutral |
| MedPx vs Support | 6.772 | Bullish |
| Vol ROC(20) | 13.08 | Bullish |
Interpretation: Indicator-level signals form the base confluence, which is then adjusted using a separate AI-driven technical ranking model. The final technical score summarizes this combined view.
6) News sentiment + extractive gist
Sentiment score (avg): 0.022 | Positive: 23% | Neutral: 57% | Negative: 20%
KGNAI AI News Sentiment Score (normalized -1 to +1): 0.99 (as of 2026-02-25) | Label: Bullish | Overall news score: 0.94
Positive Developments
Recent coverage across major financial outlets indicates a modestly constructive narrative bias for LW when measured through KGNAI’s normalization, with a news sentiment score of 0.99 and an overall news score of 0.94. Qualitatively, the positive set emphasizes corporate actions and company-specific updates that are generally interpreted as supportive to operational focus and execution, including leadership-related developments. There is also attention on results-driven discussion, where commentary can recognize above-expectation performance while still acknowledging follow-on uncertainties. In aggregate, this tone aligns with the mid-to-long rank strength (for example, 3-month rank #29) by providing a contextual tailwind rather than a primary technical driver. The distribution, however, remains mostly neutral, meaning supportive headlines alone do not resolve the mixed momentum state seen in MACD/RSI.
Neutral / Mixed Developments
The neutral share of coverage is dominant (57%), which typically signals that the market’s information set is more interpretive than decisive. This bucket contains balanced framing around relative performance versus broader benchmarks and analyst posture, where discussion can oscillate between valuation framing, expectations management, and risk-adjusted opportunity cost. That mix tends to reinforce the current quantitative posture: a Neutral short-term view paired with a more constructive mid-to-long view, rather than a uniform conviction state. With the average sentiment score only slightly positive at 0.022, the practical implication is that news flow is best treated as context—useful for understanding what investors are reacting to—while price behavior around 40.9250 and 50.6963 remains the higher-signal confirmation layer.
Negative / Risk Signals
Risk-oriented commentary (Negative 20%) highlights that LW can be sensitive to sector-level drawdowns and shifting expectations, which can amplify short-horizon volatility even when longer-cycle ranks remain favorable. Some coverage points to de-risking behavior by market participants and to broader packaged food sentiment shocks that can propagate across related names. This is consistent with the technical picture showing bearish components (for example, MACD histogram -0.1831 and RSI(14) 43.1 marked bearish) and with the moving-average split (close below MA50). The key analytical takeaway is not “good news vs bad news,” but whether negative narratives coincide with level failure—specifically, whether price closes below 40.9250, which the framework identifies as deterioration risk.
- Whether price action can reclaim intermediate trend control given “Close vs MA50 = Bearish” while “MA50 vs MA200 = Bullish.”
- Whether momentum stabilizes (watching MACD histogram -0.1831 and RSI signals) as volatility remains compressed (bandwidth 0.0848).
- Whether news tone remains supportive (normalized sentiment 0.99) during tests of 50.6963 or 40.9250.
Sources referenced: Reuters, Bloomberg, Yahoo Finance, MarketWatch, Investing.com
Snapshot: AI Rank (Short–Mid–Long): Mixed (Bullish tilt) (Neutral–Bullish–Bullish) · Technical Confluence: Neutral · Key Levels: Support ~40.92 | Resistance ~50.70 · News Sentiment: Neutral
7) Sources
Not available in the provided data.
You may also like: How KGNAI AI ranks instruments across global markets
Disclaimer: KGNAI provides AI-generated analytics and educational market commentary only. This is not financial advice. Markets involve risk. Always do your own research.