
MSFT (Microsoft Corporation) — 27-Feb-2026 Technical & Rank Outlook: Bullish Ranks with Neutral Confluence
Microsoft Corporation (MSFT) screens as bullish across KGNAI’s multi-horizon ranks, with the strongest placement concentrated in the intermediate window, while the technical layer remains more restrained. Across a 2067-instrument universe, MSFT’s 3-month rank of #33 contrasts with a more moderate daily rank of #308, suggesting the broader positioning is constructive even as near-term signal quality is still consolidating. On the chart, the trend read is mixed: close vs MA50 is bullish while MA50 vs MA200 is bearish, a combination that typically appears during transition phases rather than fully synchronized uptrends. Momentum confirms the “not overheated” characterization with RSI(14) at 51.7 (Neutral) and a positive MACD histogram (2.7221). Volatility remains contained with Bollinger Bandwidth at 0.0715, keeping attention on the primary decision zones: support ~392.6200 and resistance ~483.3050.
Key Takeaways
- Rank stance (Short / Mid / Long): Bullish / Bullish / Bullish (notably, 3-month #33; monthly #115; yearly #107).
- Technical confluence label: Neutral (18-signal confluence -0.167; overall technical score -0.139).
- Key levels: Support ~ 392.6200 | Resistance ~ 483.3050.
- News sentiment bias: Bullish (normalized score 0.88; avg sentiment 0.133 with 64% positive, 0% negative).
- Confirmation / invalidation: A break above 483.3050 with volume supports continuation; a close below 392.6200 increases deterioration risk.
What KGNAI Measures
KGNAI evaluates assets using large cross-sectional datasets built from millions of structured data points. Inputs incorporate fundamental metrics, technical structures, and systematically processed news sentiment. Statistical models, machine learning, and AI frameworks are used to assess relative positioning, signal alignment, and probabilistic behavior across broad universes.
How to Read This Report
- Ranks are comparative across the tracked universe, not absolute price targets.
- Confluence reflects alignment among independent signal groups.
- Support/resistance levels are probabilistic decision zones, not guarantees.
- Sentiment provides contextual bias within the broader analytical framework.
KGNAI Signal + Technical Snapshot + News Sentiment Digest
As of: 27-Feb-2026
Ticker: MSFT
1) KGNAI AI Analysis
Region: USA
Total universe size: 2067 ranked instruments
- Daily rank: #308 out of 2067 — Bullish
- Weekly rank: #155 out of 2067 — Bullish
- Monthly rank: #115 out of 2067 — Bullish
- 3-Monthly rank: #33 out of 2067 — Bullish
- 6-Monthly rank: #233 out of 2067 — Bullish
- Yearly rank: #107 out of 2067 — Bullish
The rank stack is internally consistent—bullish across all horizons—but the distribution carries useful nuance. The 3-month rank (#33) places MSFT in the top decile of the 2067-name universe, which typically corresponds to strong relative behavior over the intermediate window. In contrast, the daily rank (#308) sits closer to the upper portion of the distribution rather than the extreme leaders, implying the near-term tape is constructive but not fully “front-of-pack.”
This spread—strong intermediate ranks with a less aggressive daily reading—often appears when the broader trend is being respected while shorter-term flows oscillate. The weekly (#155) and monthly (#115) ranks support that interpretation: both are firmly positive, but not so compressed that they imply a one-way momentum regime. Meanwhile, the 6-month rank (#233) remains bullish yet less dominant than the 3-month window, suggesting the intermediate strength is the most pronounced feature of the current profile.
Taken together, KGNAI’s rank layer reads as a structurally supportive backdrop for MSFT: short-term conditions are positive but still “working,” while mid- and long-horizon placement (including yearly #107) supports a constructive bias. The key analytical tension for subsequent sections is whether the technical dashboard and participation measures can rotate from mixed/neutral into alignment with the rank strength.
Term view: Short-term: Bullish. Mid-term: Bullish. Long-term: Bullish.
Want the full universe and complete rank tables? Unlock full access on KGNAI: https://www.kgnai.com/pricing
2) Price & trend overview
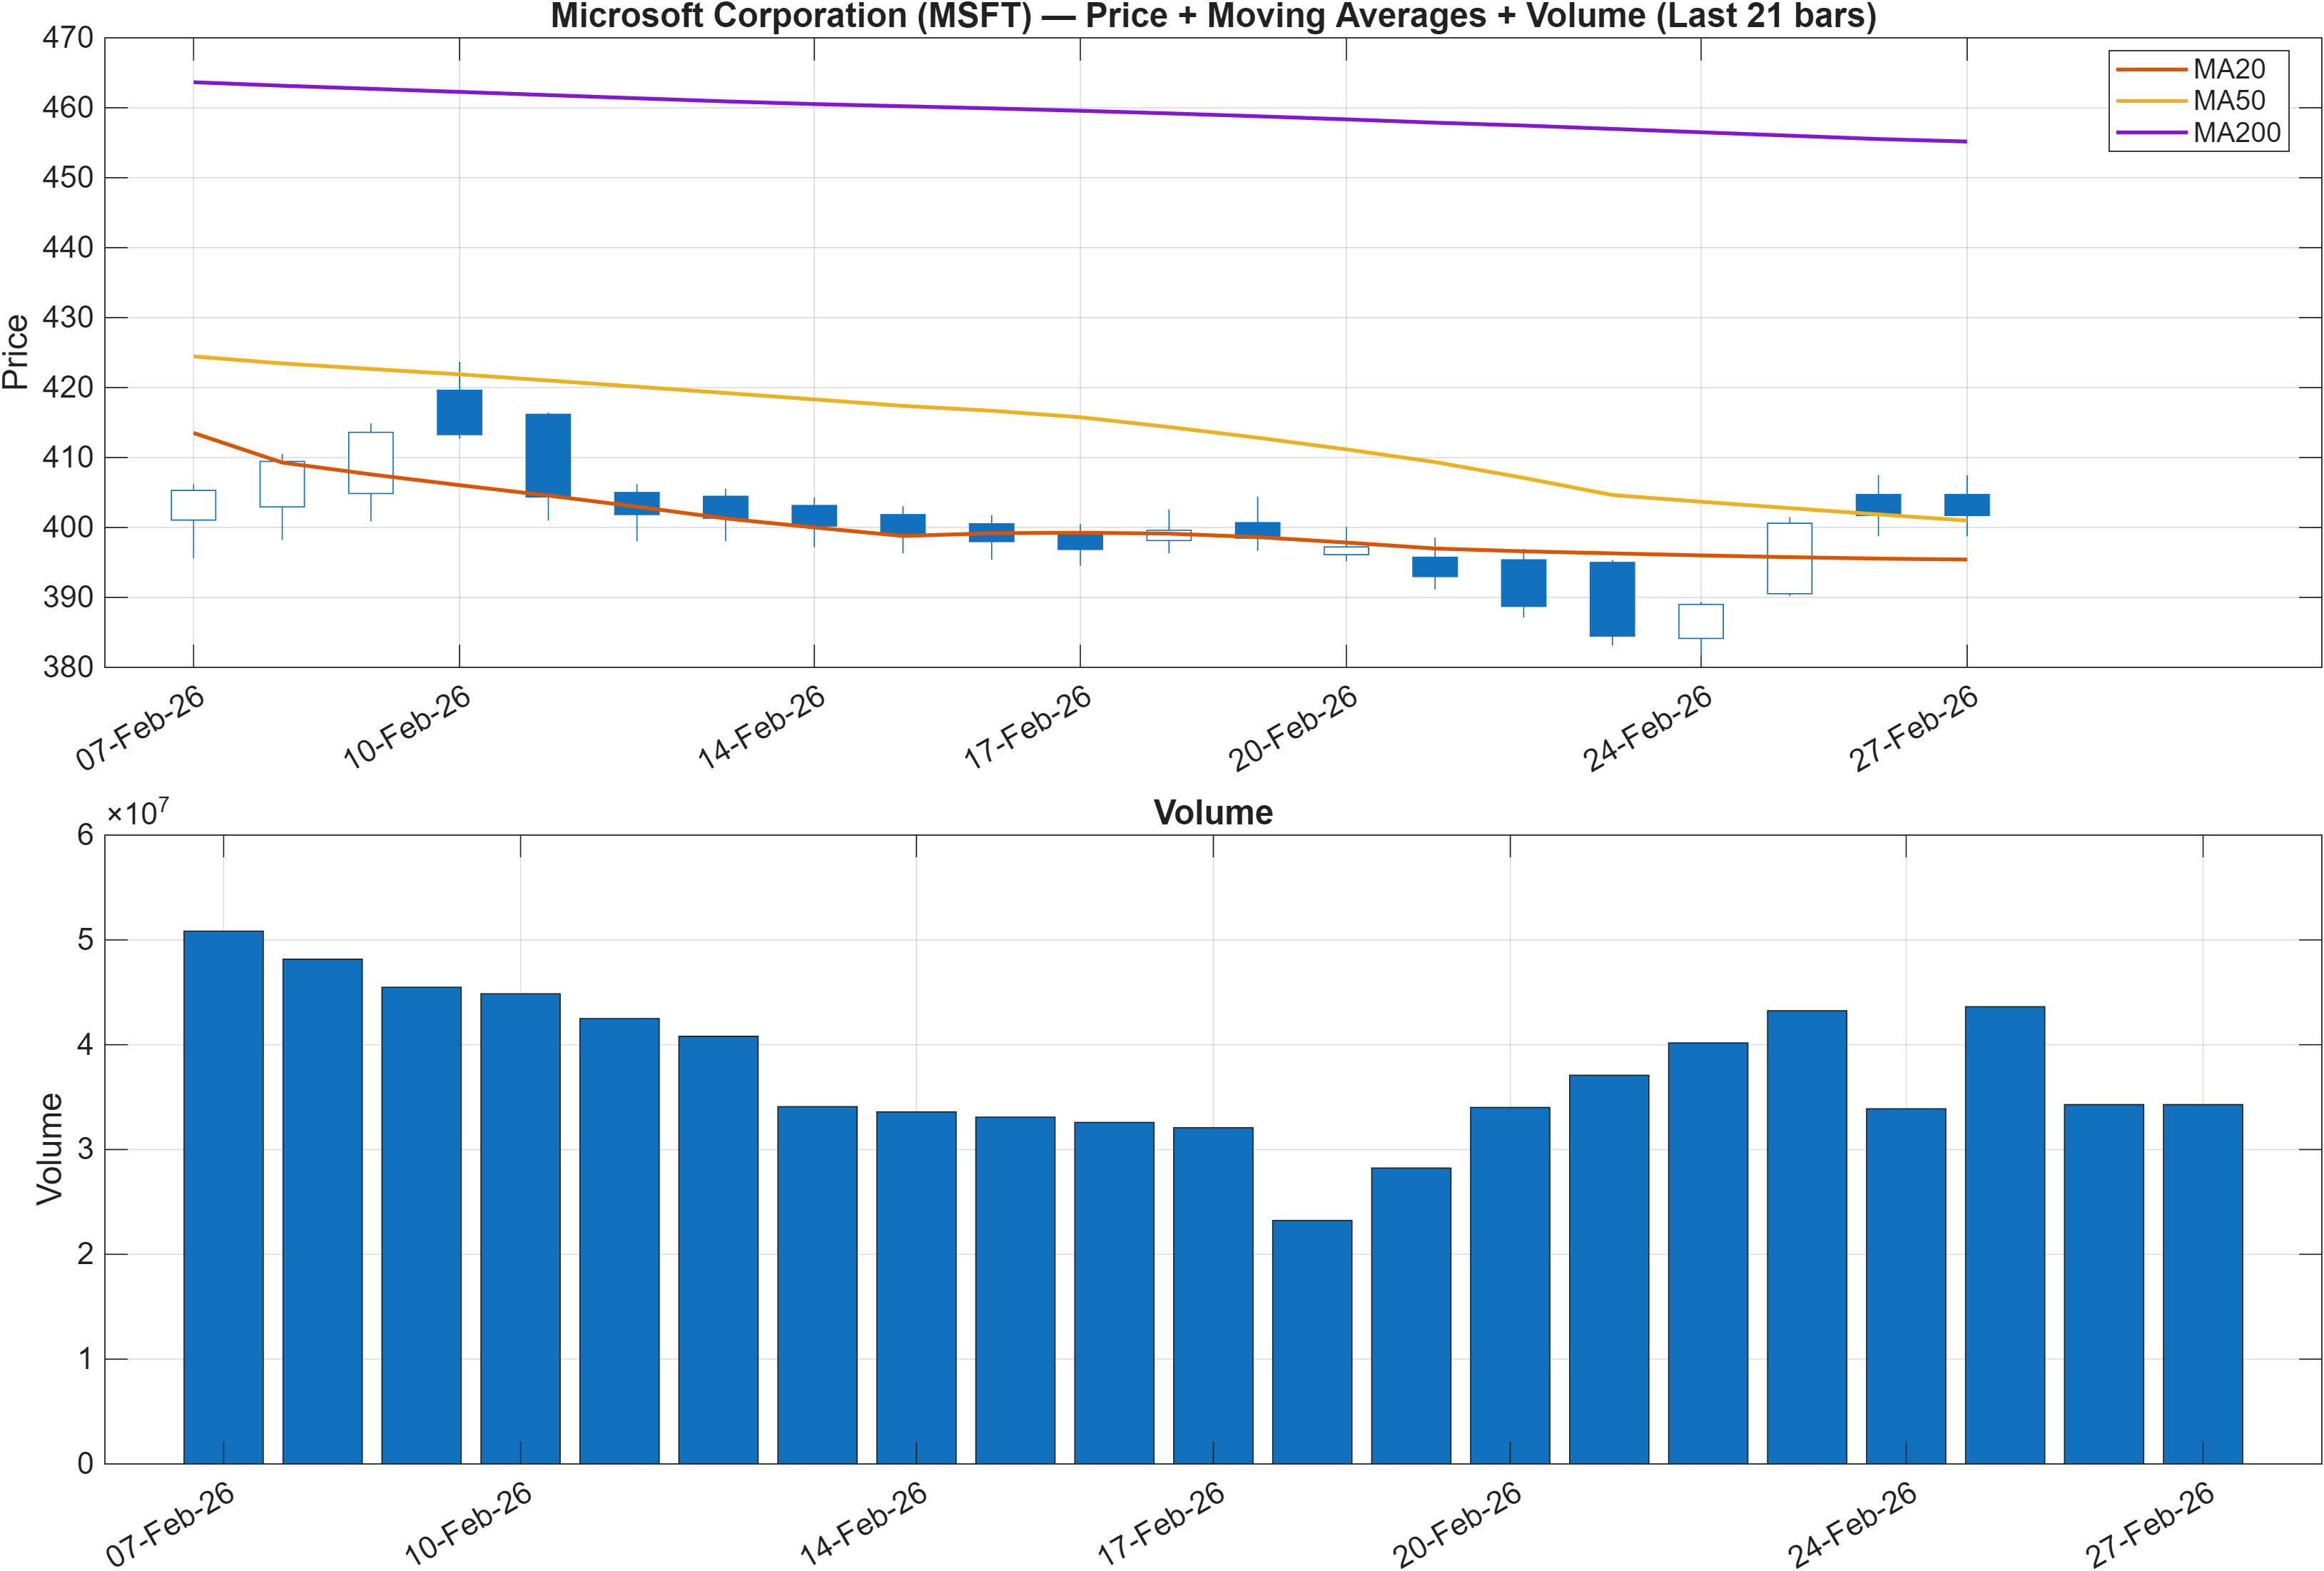
Interpretation: Close vs MA50 = Bullish, MA50 vs MA200 = Bearish.
Regime read: near-term strength within a slower-moving trend conflict
MSFT’s moving-average interpretation is deliberately split: price is above the MA50 (bullish), while MA50 remains below the MA200 (bearish). This configuration is commonly associated with recovery or transition phases, where the shorter-term trend has improved but the longer-cycle structure has not fully repaired. In that context, the ranking profile—particularly the 3-month #33 and monthly #115—adds a supportive cross-check that the market is rewarding MSFT on a relative basis even as the long moving-average relationship is lagging.
Because MA50/MA200 is backward-looking, it can remain bearish even after a multi-week improvement. That makes the “close vs MA50” signal more relevant to immediate trend persistence, while MA50 vs MA200 frames how much structural work remains before the trend becomes broadly synchronized. Practically, this split increases the importance of key price zones (covered in Section 4) and of momentum/volatility confirmation (Section 3), since trend conflicts are often resolved by either expansion through resistance or failure back into support.
The key risk in a mixed MA regime is trend fragility: pullbacks can travel further than expected if buyers do not defend higher lows. The supportive factor here is that the rank layer stays bullish across horizons (from daily #308 to yearly #107), implying the broader cross-sectional evidence is not consistent with deterioration—yet. Whether that remains true will largely depend on whether participation and momentum metrics stop contradicting the improving price trend.
3) Momentum & volatility dashboard
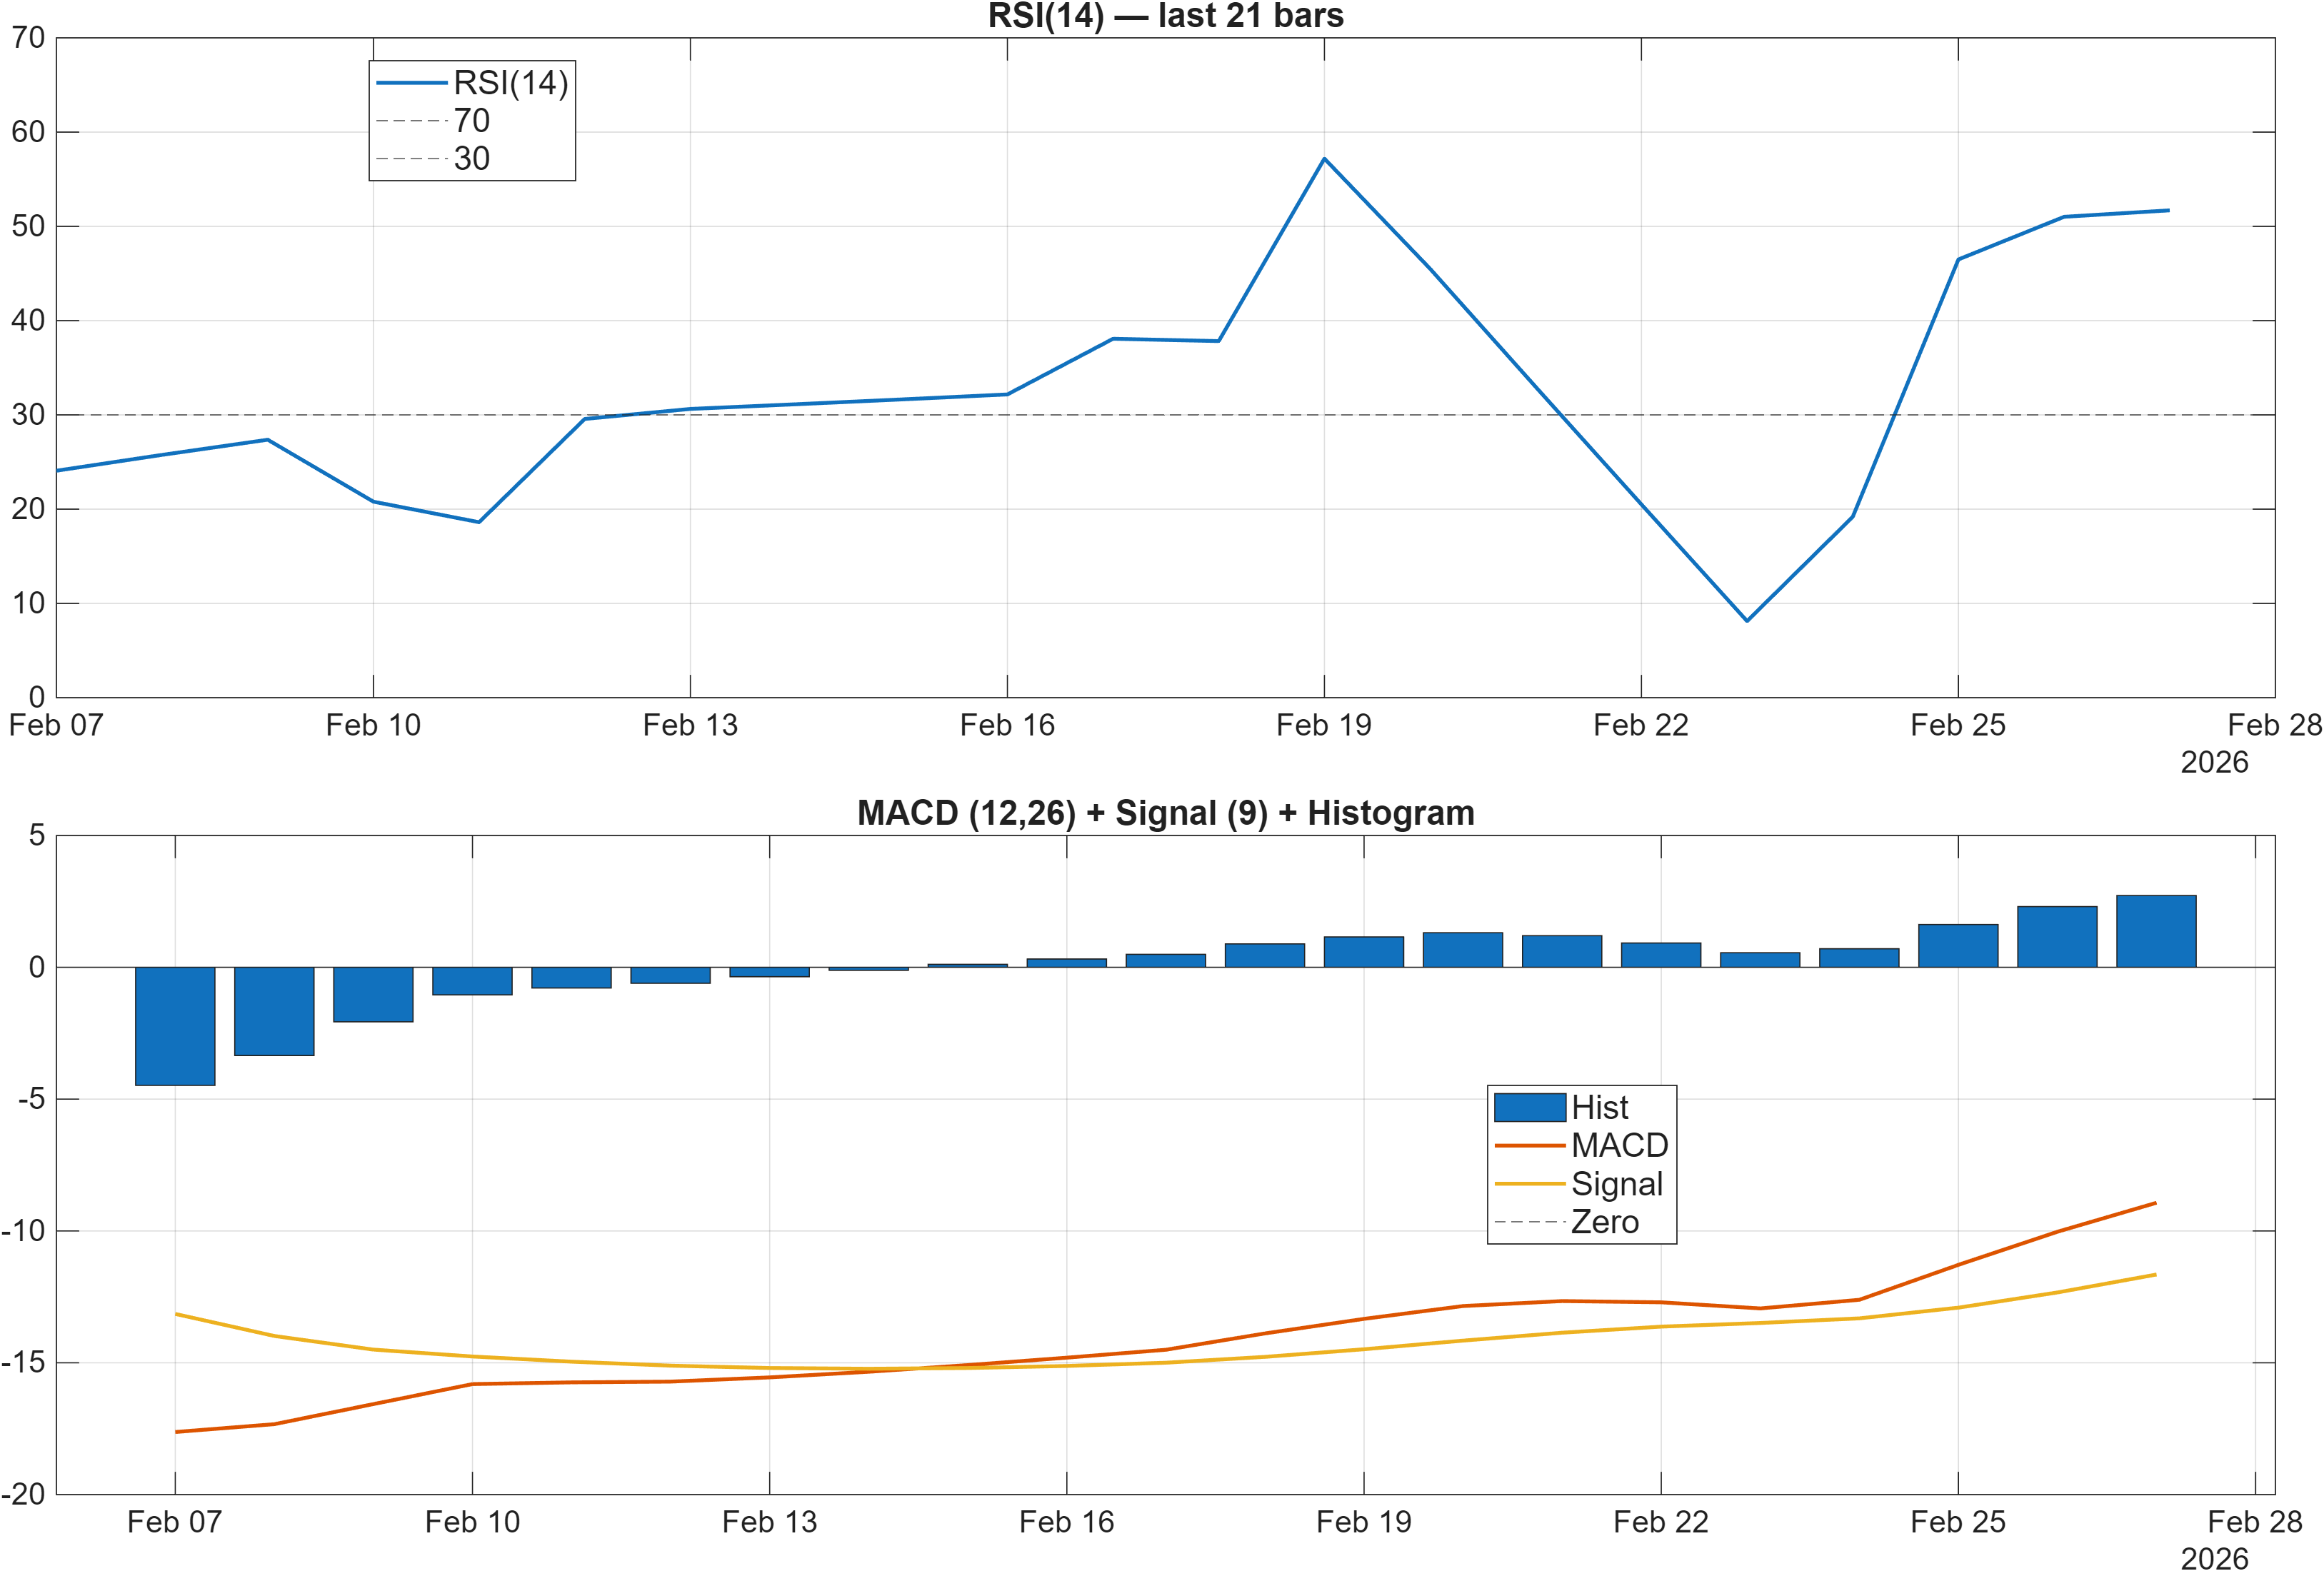
Interpretation: RSI bias = Neutral, MACD hist = 2.7221.
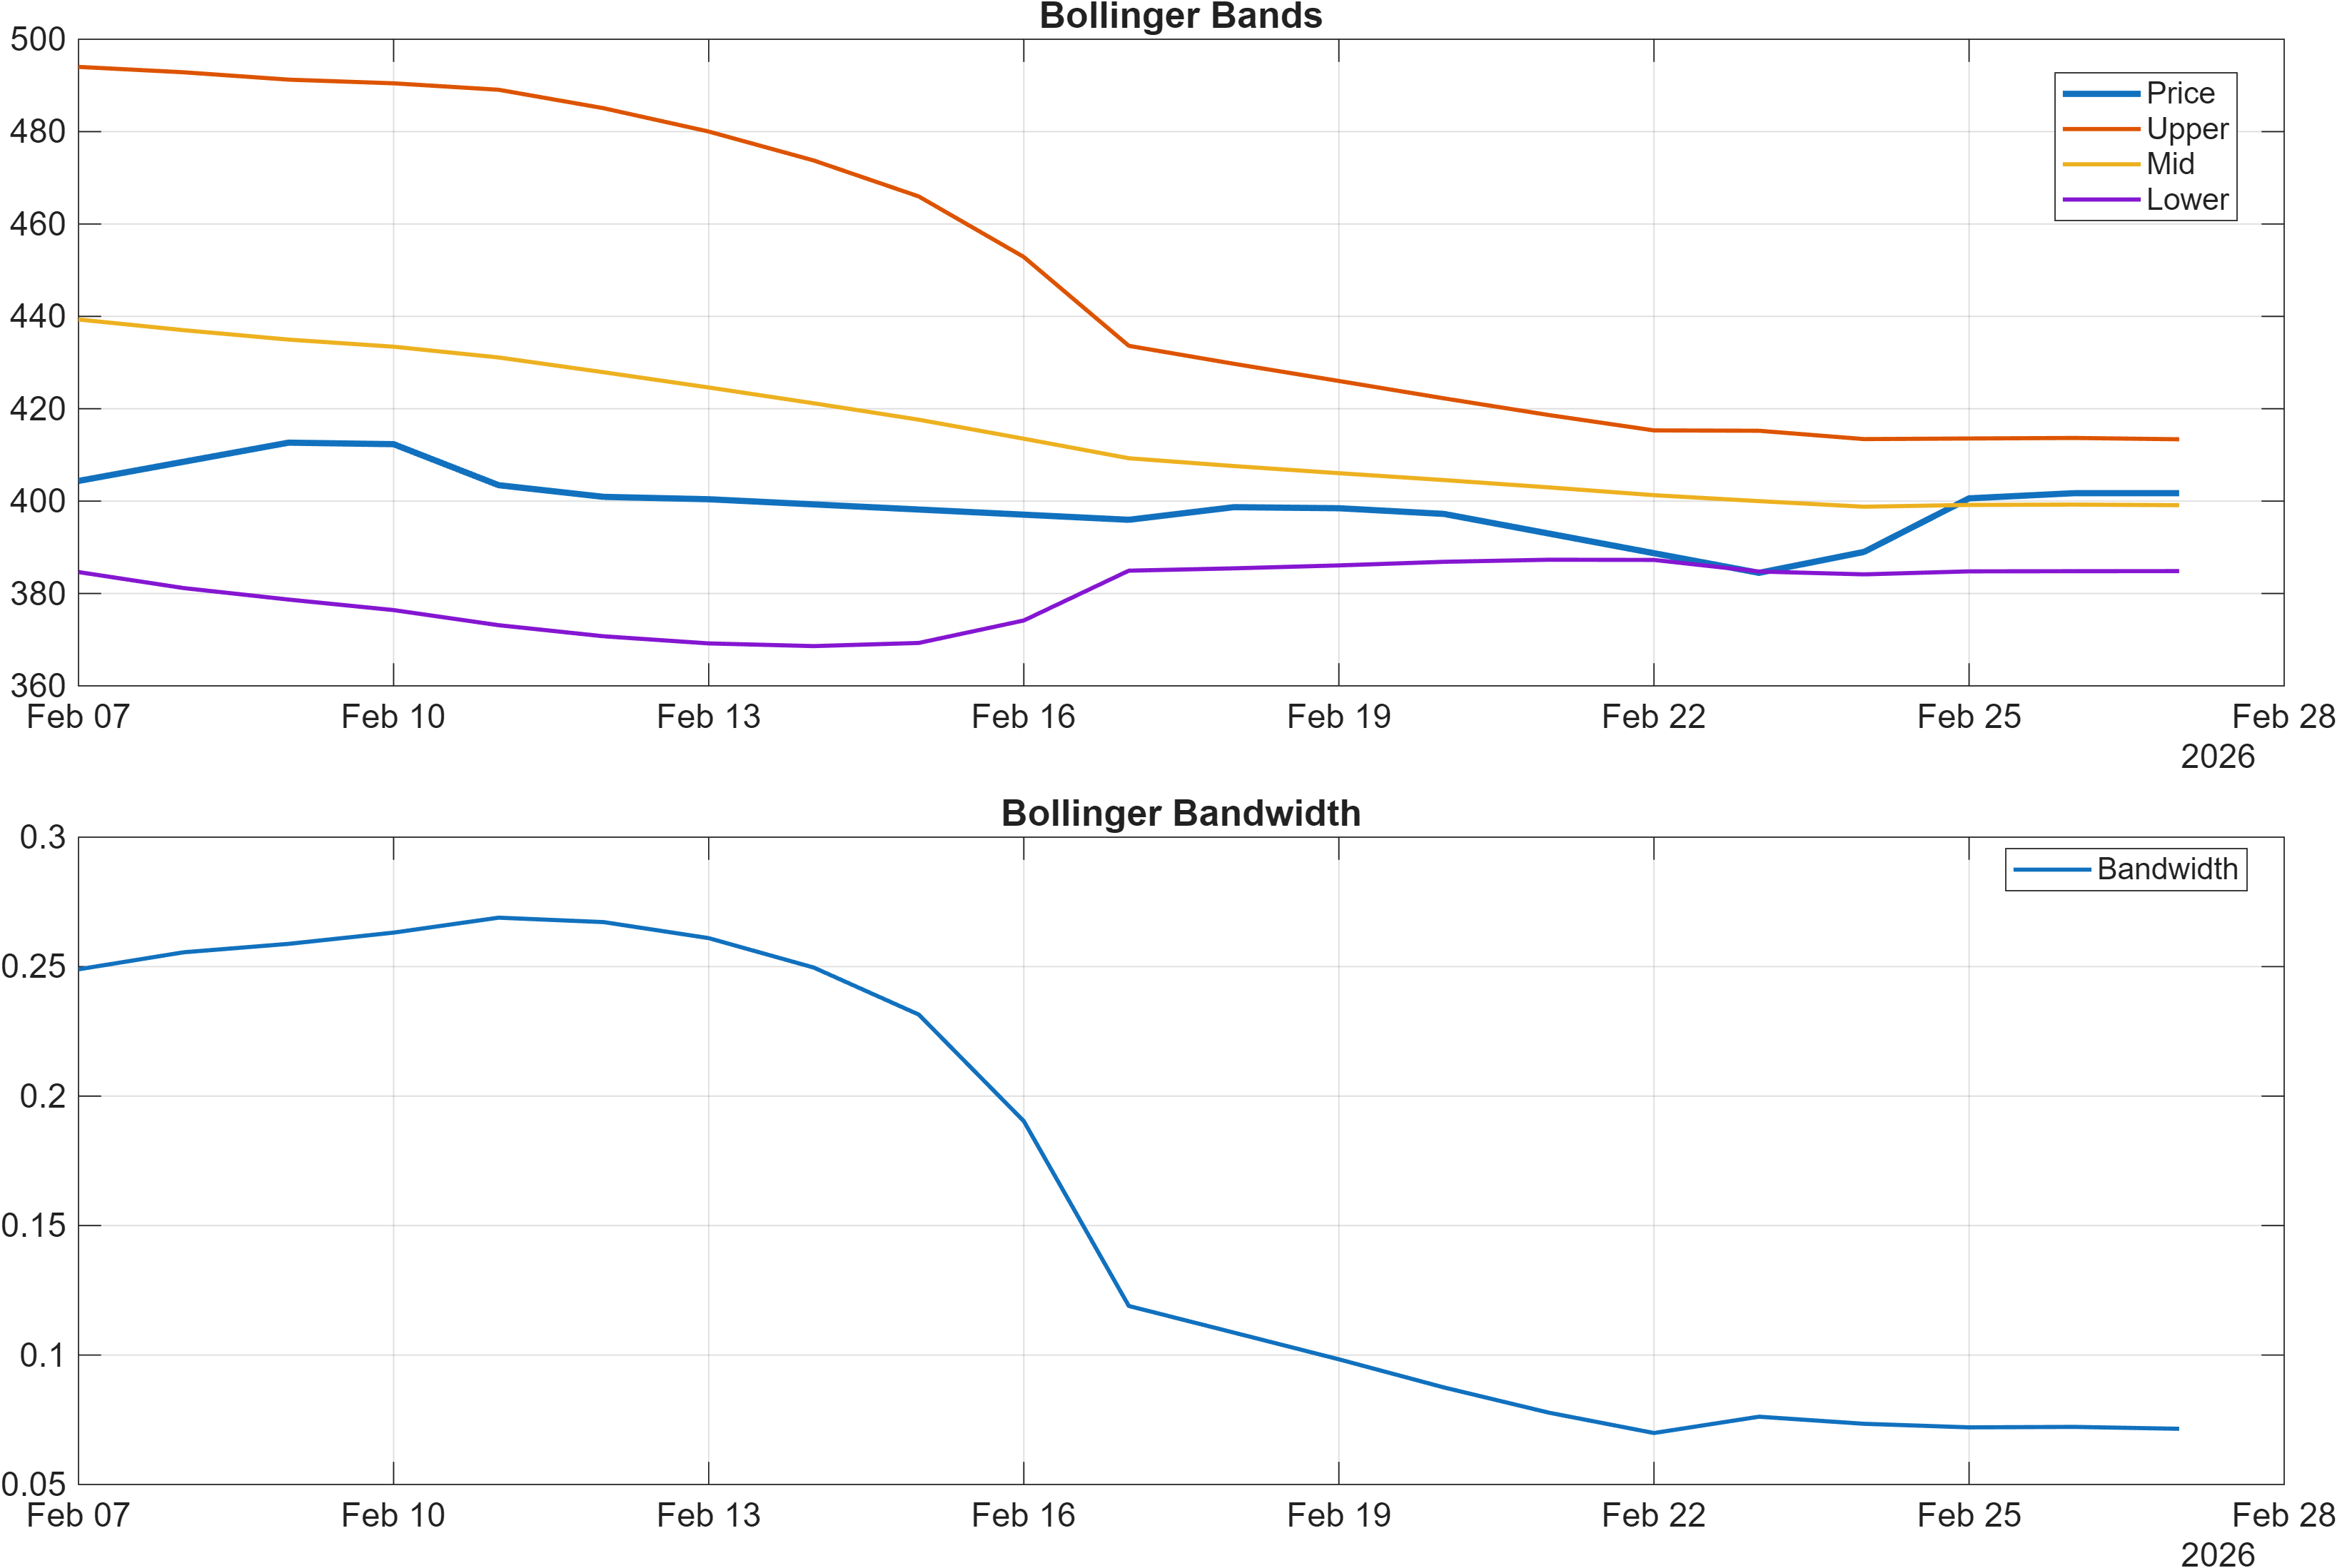
Interpretation: Bandwidth (volatility regime) latest = 0.0715.
Momentum: positive impulse without overheating
The momentum read is best described as constructive but not stretched. RSI(14) at 51.7 sits near the center of its range, aligning with a neutral bias rather than an overbought/oversold condition. That neutrality matters given the bullish rank backdrop (for example, monthly #115 and 3-month #33): it implies MSFT is not relying on extreme momentum to sustain relative strength.
At the same time, the MACD histogram at 2.7221 signals that the underlying impulse has been positive recently, even if RSI has not moved into “strong trend” territory. This combination can occur when a market is grinding higher or stabilizing after a prior decline: MACD responds to changes in trend and slope, while RSI can remain muted if gains are interspersed with consolidation.
Volatility: compressed regime increases level sensitivity
Volatility remains contained with Bollinger Bandwidth at 0.0715, indicating a comparatively tight regime. Compression regimes typically increase the analytical importance of breakout confirmation and false-break risk: the next sustained move often arrives with a bandwidth expansion, but direction is not guaranteed. In this environment, the highest-quality confirmation tends to be alignment between (i) momentum improving beyond neutral and (ii) price accepting above resistance (Section 4), ideally alongside healthier participation signals (Section 5).
Net: momentum and volatility are consistent with a market that is setting conditions for a directional resolution, rather than one that has already exhausted a trend. That is compatible with the bullish ranks, while leaving open the question of whether the technical dashboard’s net-neutral score is an early warning or simply a lagging, diversified cross-check.
4) Support / Resistance zones
Support ~ 392.6200 | Resistance ~ 483.3050
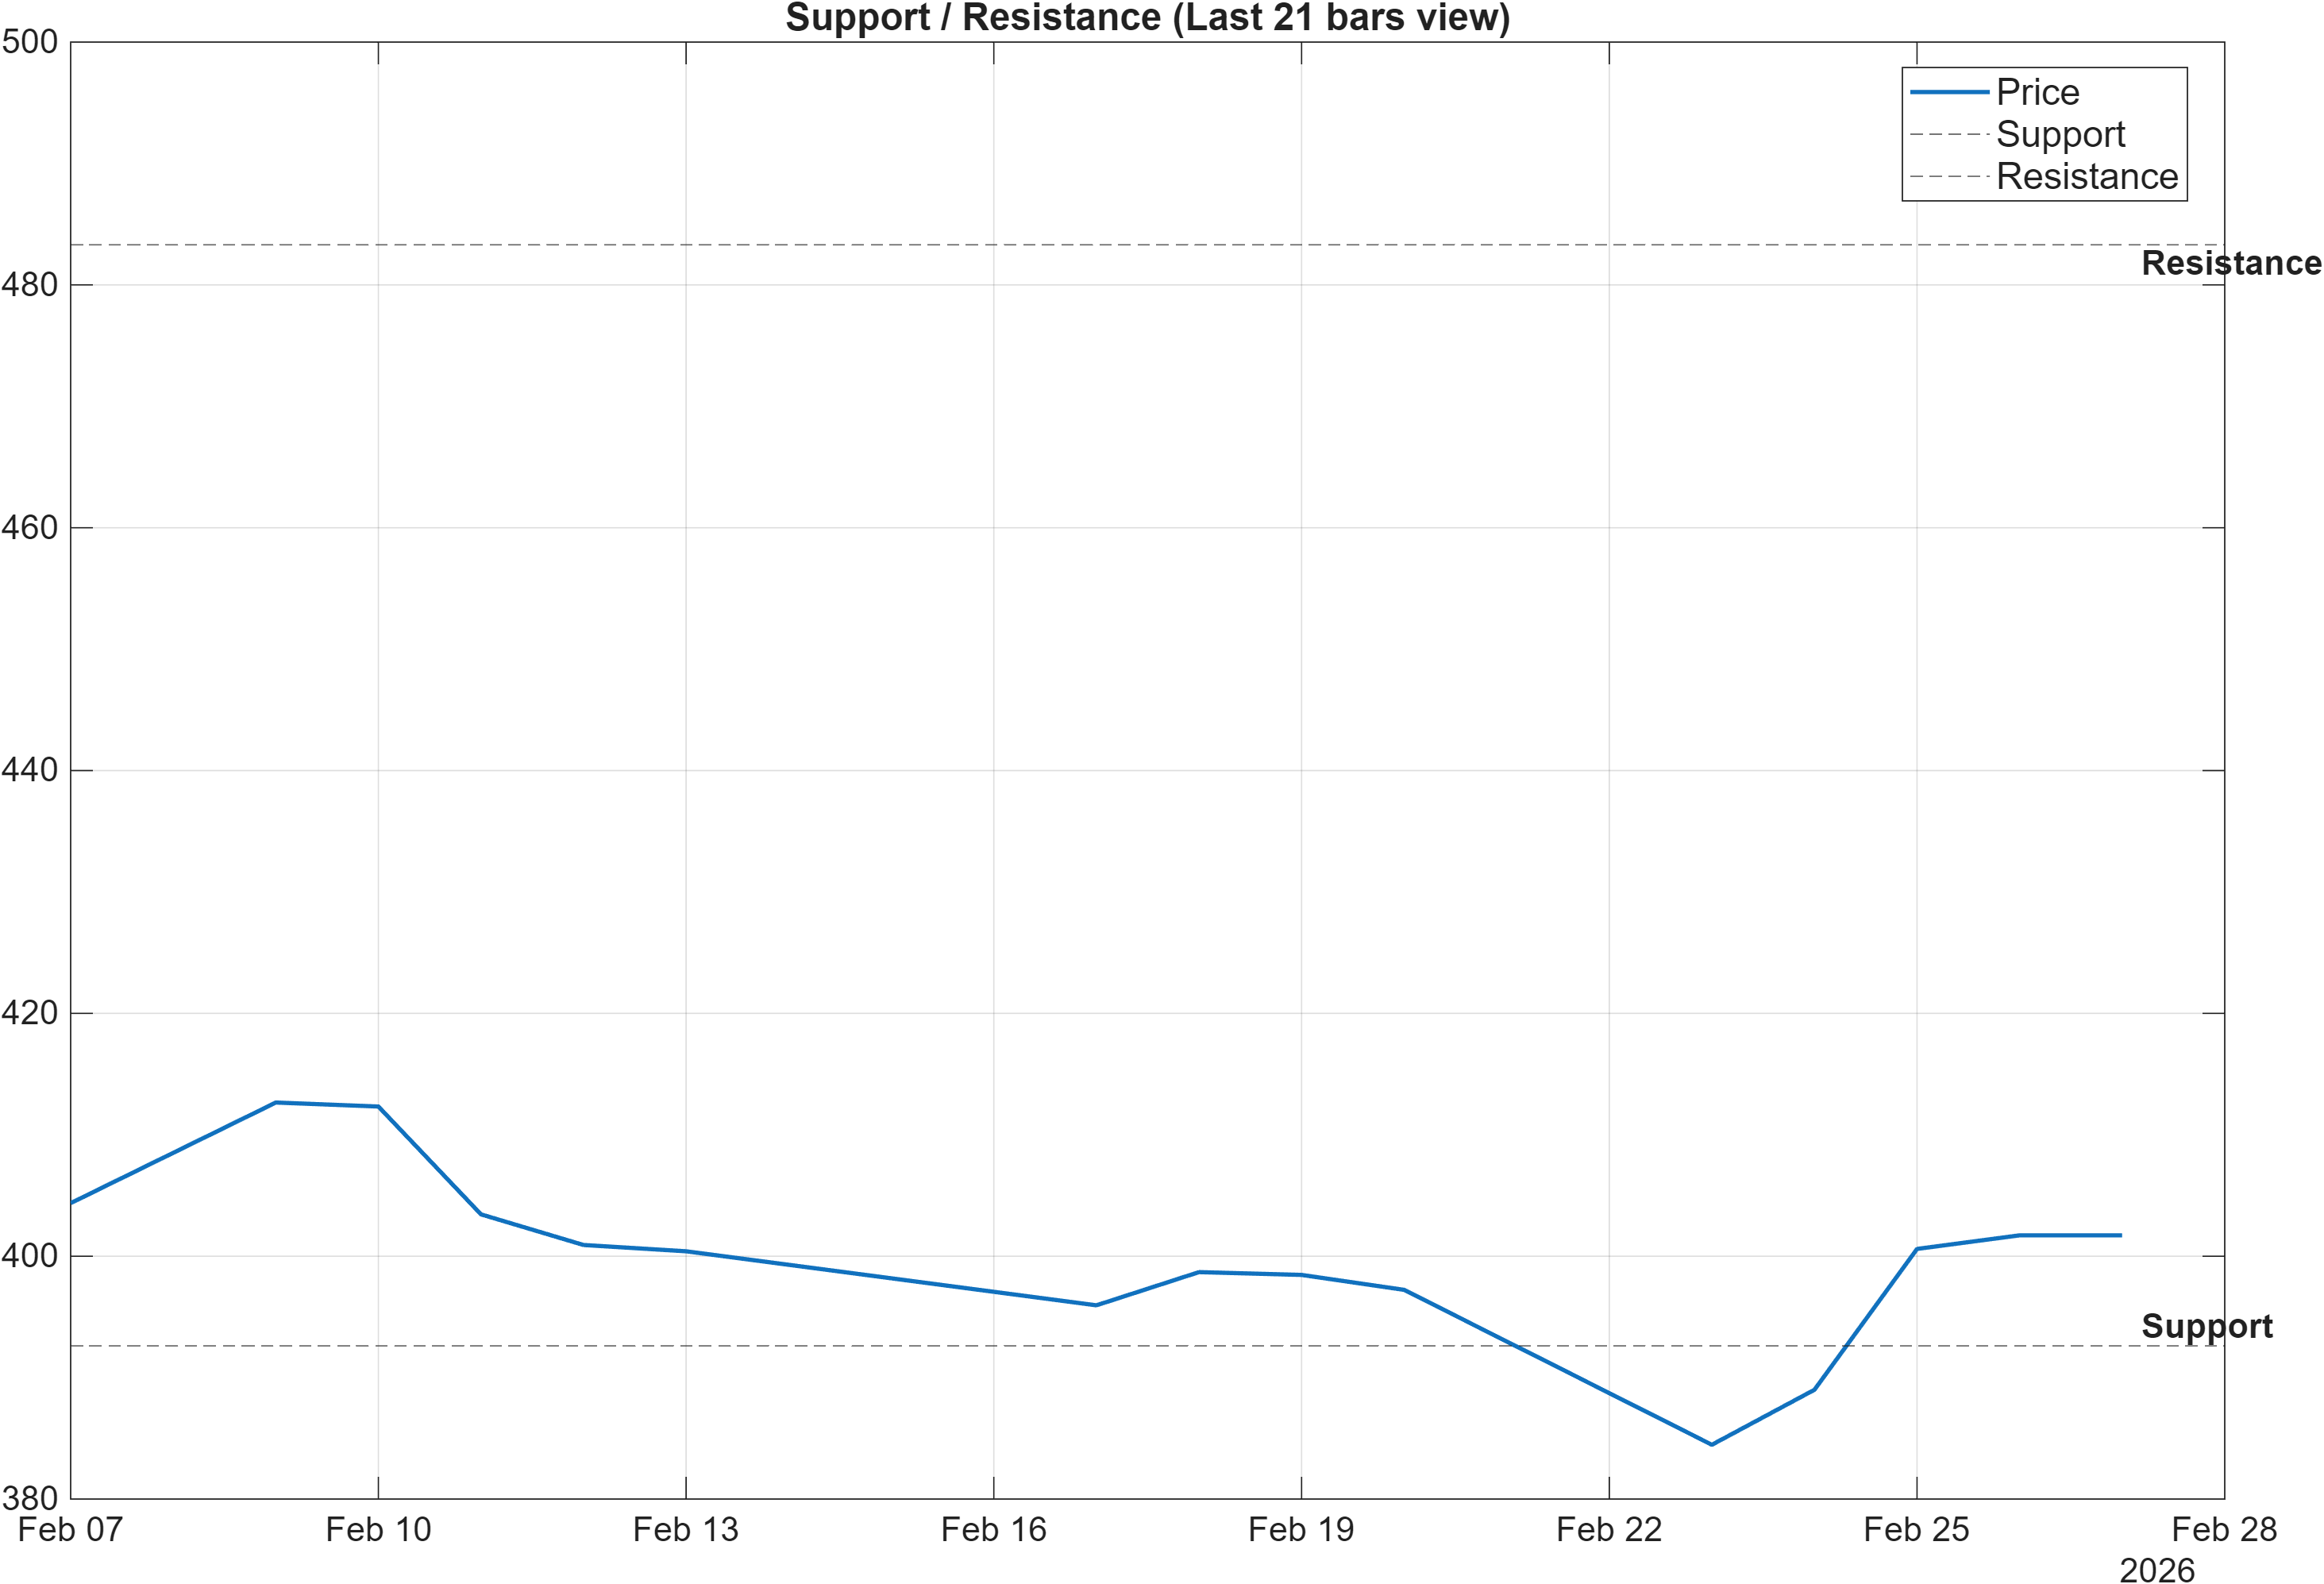
Scenario view: Break above resistance with volume → continuation. Close below support → signal deterioration risk.
Decision zones: defining confirmation vs deterioration
The current structure is framed by two primary probabilistic zones: support near 392.6200 and resistance near 483.3050. With volatility relatively compressed (bandwidth 0.0715) and momentum not extreme (RSI 51.7), these levels become more than simple chart annotations—they are the principal boundaries that can convert the present “mixed-but-improving” condition into a clearer regime classification.
From a continuation perspective, the scenario condition is explicit: a break above 483.3050 with volume. This matters because Section 2 already highlights a trend conflict (bullish close vs MA50, bearish MA50 vs MA200). Breakouts that occur without participation tend to be less durable, especially when the longer moving-average relationship remains bearish. In that sense, volume acts as the gating variable for whether the market is prepared to accept a higher price range rather than merely probing it.
On the downside, a close below 392.6200 is the deterioration trigger. If that occurs, it would also raise the probability that the bullish ranks—such as weekly #155 and monthly #115—begin to drift higher (weaker) as the market re-prices MSFT’s relative behavior. Importantly, the technical dashboard (Section 5) already leans neutral with more bearish than bullish micro-signals; a breakdown would convert that current ambiguity into a more coherent risk signal rather than a mere divergence.
In short, MSFT is operating inside a wide decision corridor where the next decisive move is likely to matter more than small fluctuations. The most informative outcomes are “acceptance” above resistance with participation, or “failure” through support that confirms the dashboard’s bearish microstructure readings.
5) Quant Technical Dashboard (18 Signals)
KGNAI AI Technical Analysis Score (Deep Reinforcement Learning): Rank #1111 out of 2067 (Rank 1 represents the strongest technical positioning and a higher probability of favorable price behavior. As ranks increase toward the maximum, the probability of favorable outcomes weakens and bearish positioning becomes more dominant.) | Label: Neutral | Score: -0.075
18-Signal Technical Confluence Score: -0.167 (Neutral)
Overall Technical Score (18-signal confluence + DRL rank blend): -0.139 (Neutral)
Note: The blended score reflects signal strength weighted against broader AI technical ranking, which may temporarily diverge.
Blended technical score breakdown: -0.139 (Neutral | Bull 5 / Bear 8 / Neutral 5)
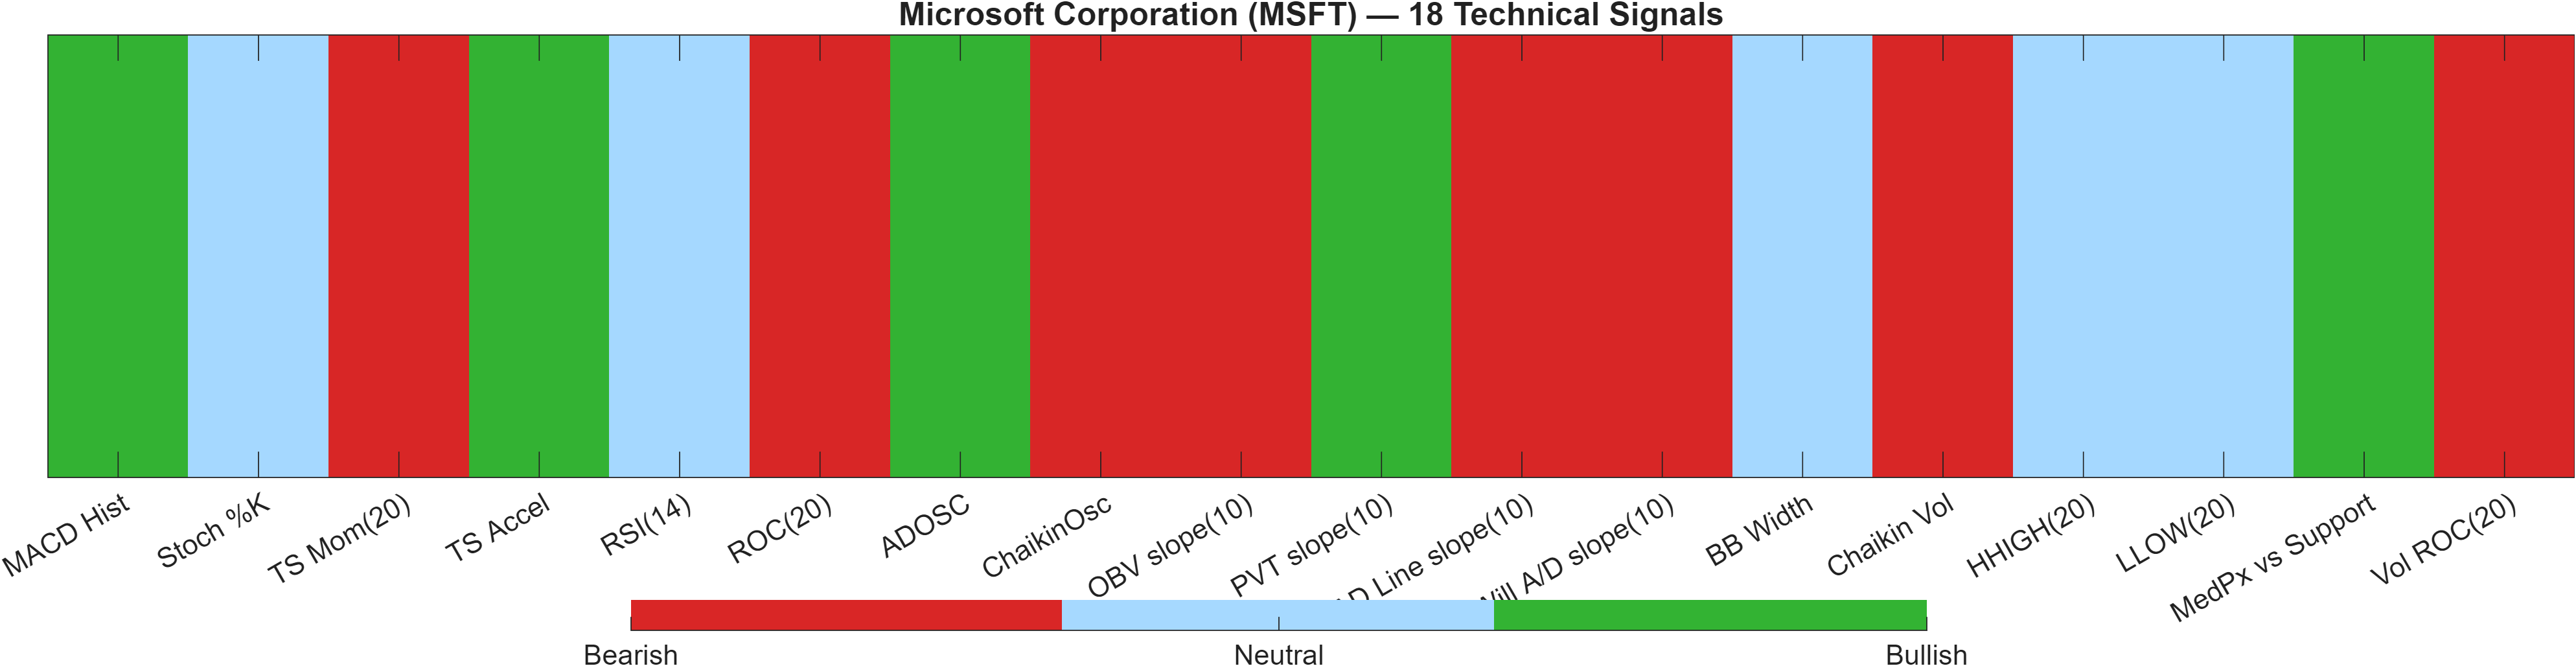
Signal balance: ranks bullish, micro-signals still uneven
The technical layer is notably more cautious than the rank layer. The 18-signal confluence score of -0.167 and the overall technical score of -0.139 both register as Neutral, and the blend count (Bull 5 / Bear 8 / Neutral 5) indicates that bearish micro-signals outnumber bullish ones even though MSFT’s ranks remain bullish across horizons (including 3-month #33).
A core divergence sits between classic momentum and participation/flow measures. Momentum leans constructive—MACD Hist is bullish (with the histogram reported as 2.722 in the table and 2.7221 in the indicator note)—and RSI(14) at 51.7 stays neutral rather than overbought. However, multiple participation proxies lean bearish, including OBV slope(10) and AD Line slope(10), which can imply that price improvement is not uniformly supported by broad accumulation dynamics.
The Deep Reinforcement Learning layer reinforces the neutral stance: DRL technical rank #1111 out of 2067 with a score of -0.075. Relative to MSFT’s bullish cross-horizon ranks (for example, weekly #155 and yearly #107), this suggests the model sees the tape as “good, not clean”—a market that may be advancing but without broad agreement across independent technical families.
What would improve technical alignment?
The most direct path to alignment is not additional indicators—it is resolving the existing tension: improving participation/volume dynamics while preserving bullish price structure above key levels. In a compressed volatility regime (BB Width 0.07152), that alignment often becomes visible quickly once a breakout attempt is either confirmed (through resistance) or rejected.
Signal table (Bull/Bear/Neutral)
| Indicator | Value | Signal |
|---|---|---|
| MACD Hist | 2.722 | Bullish |
| Stoch %K | 77.62 | Neutral |
| TS Mom(20) | -7.727 | Bearish |
| TS Accel | 37.35 | Bullish |
| RSI(14) | 51.7 | Neutral |
| ROC(20) | -1.663 | Bearish |
| ADOSC | 32.91 | Bullish |
| ChaikinOsc | -1.008e+07 | Bearish |
| OBV slope(10) | -4.772e+07 | Bearish |
| PVT slope(10) | 4.659e+05 | Bullish |
| AD Line slope(10) | -5.319e+07 | Bearish |
| Will A/D slope(10) | -8.38 | Bearish |
| BB Width | 0.07152 | Neutral |
| Chaikin Vol | 10.42 | Bearish |
| HHIGH(20) | 423.7 | Neutral |
| LLOW(20) | 381.7 | Neutral |
| MedPx vs Support | 10.5 | Bullish |
| Vol ROC(20) | -28.81 | Bearish |
Interpretation: Indicator-level signals form the base confluence, which is then adjusted using a separate AI-driven technical ranking model. The final technical score summarizes this combined view.
6) News sentiment + extractive gist
Sentiment score (avg): 0.133 | Positive: 64% | Neutral: 36% | Negative: 0%
KGNAI AI News Sentiment Score (normalized -1 to +1): 0.88 (as of 2026-02-27) | Label: Bullish | Overall news score: 0.85
Positive Developments
Recent coverage across major financial outlets indicates a constructive sentiment backdrop for MSFT within broader discussions of cloud marketplaces, ecosystem partnerships, and the ongoing capital cycle tied to AI infrastructure. The sentiment distribution is skewed positive (64% positive, 0% negative), and KGNAI’s normalized reading remains firmly supportive at 0.88, consistent with a risk-on narrative rather than a defensive one. From a market-structure perspective, the positive tone matters most because MSFT’s technical stack is not uniformly bullish: with an overall technical score of -0.139 (Neutral), sentiment can act as an incremental stabilizer for positioning, helping explain why multi-horizon ranks stay bullish even while some participation signals lean bearish. The constructive stream, however, should be interpreted as context—not confirmation—until price resolves key levels and participation metrics improve.
Neutral / Mixed Developments
A meaningful portion of the news flow remains informational and debate-oriented (36% neutral), reflecting that MSFT is often referenced within broader sector reallocations and valuation framing rather than solely company-specific catalysts. That aligns with the report’s mixed technical regime: RSI(14) at 51.7 signals neither crowding nor capitulation, while volatility is relatively contained (bandwidth 0.0715). In this setting, neutral coverage can coincide with consolidation phases where investors digest prior moves and re-price expectations across the mega-cap complex. The implication for traders and allocators is to separate “narrative presence” from “signal quality”: neutral news tone does not inherently weaken the bullish rank stack (e.g., monthly #115), but it does limit the evidentiary value of sentiment as a standalone driver.
Negative / Risk Signals
Although the dataset shows 0% negative in the sentiment breakdown, risk signals still appear through the type of coverage rather than outright negative tone—namely, discussions that highlight elevated market sensitivity to AI-related capex dynamics and episodes of heightened derivatives activity. These are best treated as reflexivity risks: if positioning becomes crowded or if broader tech benchmarks de-risk, MSFT can inherit volatility even without company-specific deterioration. This risk framing also fits the technical divergence already visible: multiple flow/volume-derived signals are bearish within the 18-signal set while ranks stay bullish. In practice, the most actionable risk marker remains price-based: a close below 392.6200 would convert “contextual risk” into a chart-confirmed deterioration pathway.
What to monitor next
- Whether sentiment strength (0.88) is matched by improving participation signals (e.g., OBV/AD slopes stabilizing).
- Any volatility expansion from the compressed regime (bandwidth 0.0715) alongside acceptance above 483.3050.
- Downside validation risk: behavior on retests of 392.6200 in relation to the mixed moving-average structure.
Sources referenced: Reuters, Bloomberg, Yahoo Finance, MarketWatch, Investing.com
7) Sources
Not available in the provided data.
You may also like: How KGNAI AI ranks instruments across global markets
Disclaimer: KGNAI provides AI-generated analytics and educational market commentary only. This is not financial advice. Markets involve risk. Always do your own research.