
NVDA (NVIDIA Corporation) Technical & Sentiment Report — 13-Mar-2026 | Supportive Internals with Neutral Confluence
NVIDIA Corporation (NVDA) enters 13-Mar-2026 with cross-horizon ranks skewed constructive, led by a weekly placement of #14 (top-decile behavior within a 2065-instrument universe). That strength is not perfectly mirrored by the technical stack: the 18-signal confluence score is 0.278 (Neutral), while the blended overall technical view prints 0.371 (Bullish), implying a supportive but not fully synchronized setup. Price structure is defined by a nearby decision band—support ~175.6800 and resistance ~193.6350—with momentum leaning constructive (RSI bias bullish; RSI(14) 60.78) and a positive MACD backdrop (MACD hist 0.2540). Volatility is present but not extreme (Bollinger bandwidth 0.1111), suggesting room for expansion if price resolves the range. News tone is modestly positive by model output (normalized sentiment 0.78), while the distribution remains largely neutral (80% neutral).
Key Takeaways
- Rank stance (Short / Mid / Long): Bullish / Bullish / Neutral (weekly #14; yearly #577).
- Technical confluence label: Neutral (18-signal score 0.278), with blended technical view Bullish at 0.371.
- Key levels: Support 175.6800 | Resistance 193.6350.
- News sentiment bias: Bullish (normalized 0.78) with predominantly neutral article mix (80% neutral).
- Confirmation / invalidation condition: A volume-supported move above 193.6350 supports continuation; a close below 175.6800 increases deterioration risk.
What KGNAI Measures
KGNAI evaluates assets using large cross-sectional datasets built from millions of structured data points. Inputs incorporate fundamental metrics, technical structures, and systematically processed news sentiment. Statistical models, machine learning, and AI frameworks are used to assess relative positioning, signal alignment, and probabilistic behavior across broad universes.
How to Read This Report
- Ranks are comparative across the tracked universe, not absolute price targets.
- Confluence reflects alignment among independent signal groups.
- Support/resistance levels are probabilistic decision zones, not guarantees.
- Sentiment provides contextual bias within the broader analytical framework.
1) KGNAI AI Analysis
Region: USA
Total universe size: 2065 ranked instruments
- Daily rank: #349 out of 2065 — Bullish
- Weekly rank: #14 out of 2065 — Bullish
- Monthly rank: #297 out of 2065 — Bullish
- 3-Monthly rank: #57 out of 2065 — Bullish
- 6-Monthly rank: #62 out of 2065 — Bullish
- Yearly rank: #577 out of 2065 — Neutral
The rank profile is best described as front-end strength with a longer-horizon cool-down. NVDA’s weekly rank of #14 places it in the top decile of the 2065-instrument universe, while the 3-month (#57) and 6-month (#62) ranks remain in the upper tier, indicating that recent relative behavior has been persistent rather than a one-off jump. By contrast, the yearly rank at #577 sits closer to the middle of the universe and is tagged Neutral, a reminder that longer-window tests are not uniformly aligned with the recent acceleration.
The daily rank (#349) adds a useful nuance: short-term positioning is still labeled Bullish, but it is less extreme than the weekly signal. That spread (daily vs weekly) typically appears when near-term noise increases even as the intermediate trend remains constructive. In practice, this tends to shift emphasis from “chasing strength” toward monitoring whether follow-through holds through key levels and whether supportive internals (momentum, volume behavior, and volatility structure) remain consistent with the strong weekly/quarterly rank posture.
Term view remains: Short-term Bullish, Mid-term Bullish, Long-term Neutral. The analytical takeaway is an asymmetric alignment: intermediate horizons carry the strongest evidence, while the longest horizon still requires confirmation from price structure and technical breadth.
Want the full universe and complete rank tables? Unlock full access on KGNAI: https://www.kgnai.com/pricing
2) Price & trend overview
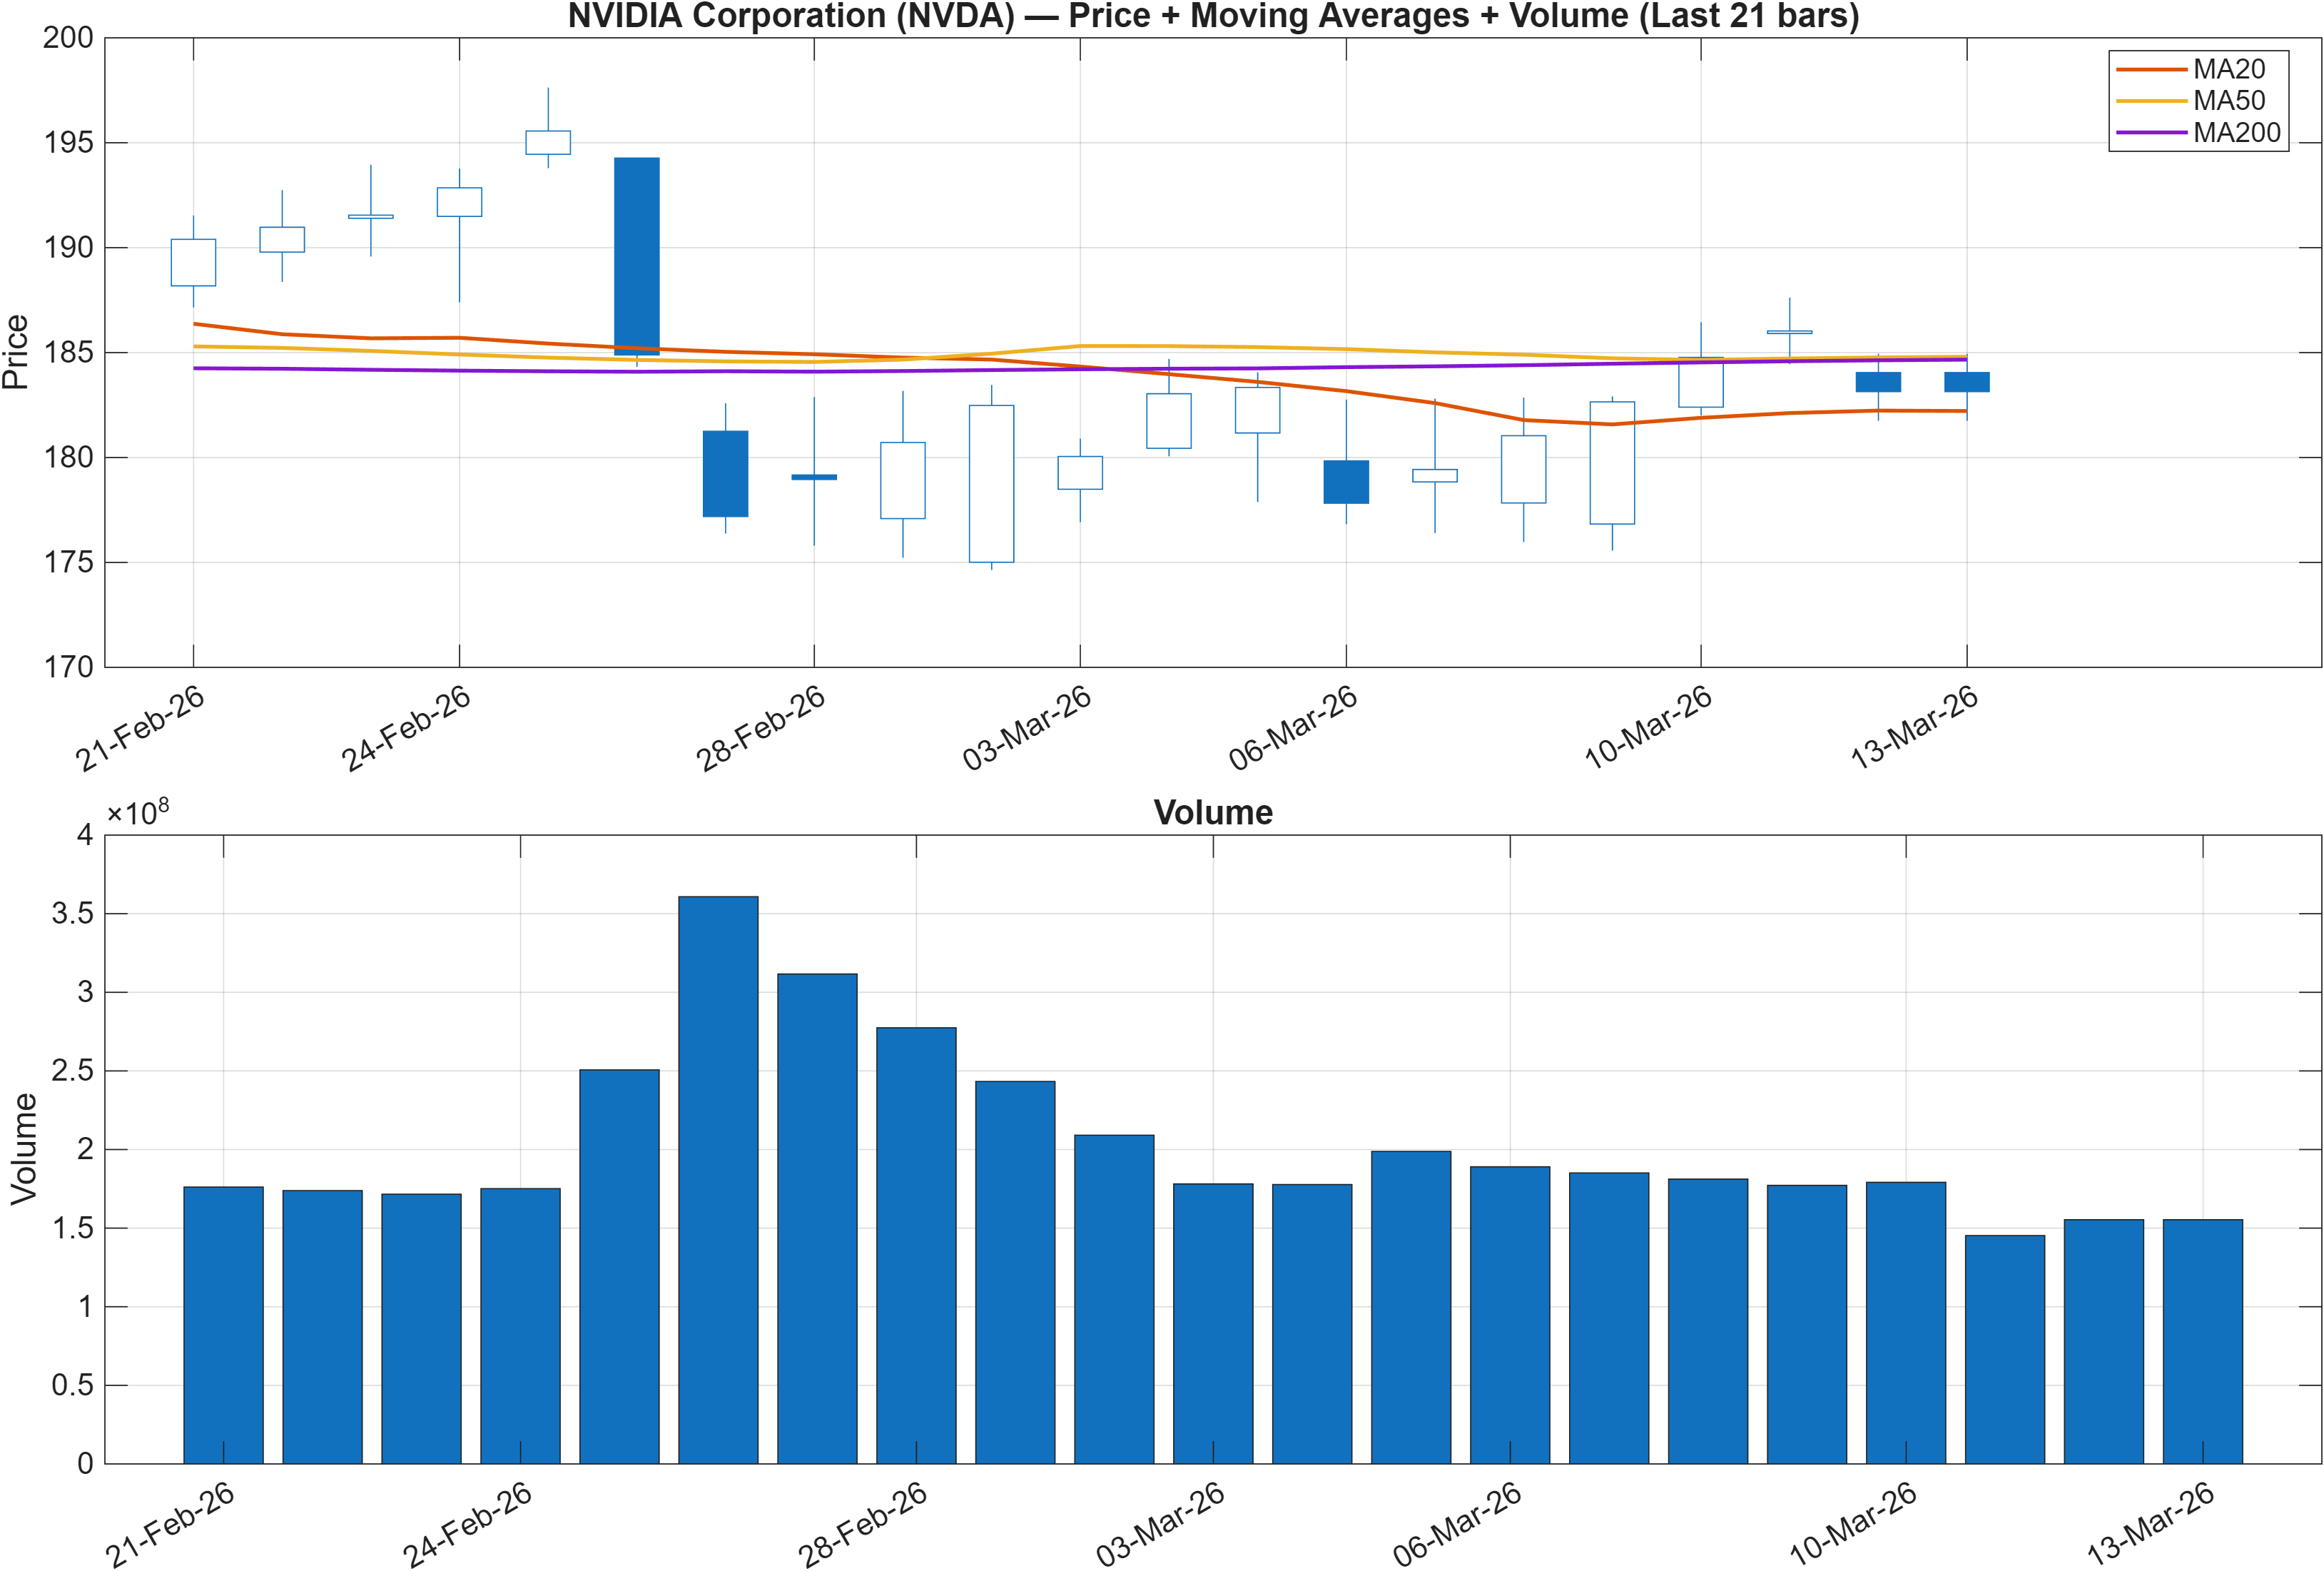
The moving-average structure signals a transition state rather than a clean, single-regime trend. The provided interpretation reads: Close vs MA50 = Bearish, while MA50 vs MA200 = Bullish. That combination often appears when the broader trend remains constructive (a supportive longer-term slope), but the latest price action has slipped below an intermediate trend anchor. In other words, NVDA is behaving as if it is working through a digestion phase inside a still-positive larger structure.
This is where the rank stack matters: a top-decile weekly rank (#14) alongside a bearish close-versus-MA50 reading argues for a setup that depends on re-acceptance above intermediate trend measures rather than relying on the long-term tailwind alone. The market is effectively asking for evidence that buyers can regain control at the “trend maintenance” level, rather than only defending deeper levels.
The trend backdrop should also be read in conjunction with the nearby range boundaries defined elsewhere in the report: 175.6800 as support and 193.6350 as resistance. When price is below the MA50 but the MA50 remains above the MA200, a common failure mode is a range that expands downward if support breaks; conversely, a recovery toward resistance can quickly re-establish trend continuity if accompanied by improving participation. Because the daily rank is positive but not extreme (#349), the evidence leans toward supportive, but conditional—trend continuation is more credible if subsequent price behavior resolves the intermediate weakness without violating key support.
Interpretation: Close vs MA50 = Bearish, MA50 vs MA200 = Bullish.
3) Momentum & volatility dashboard
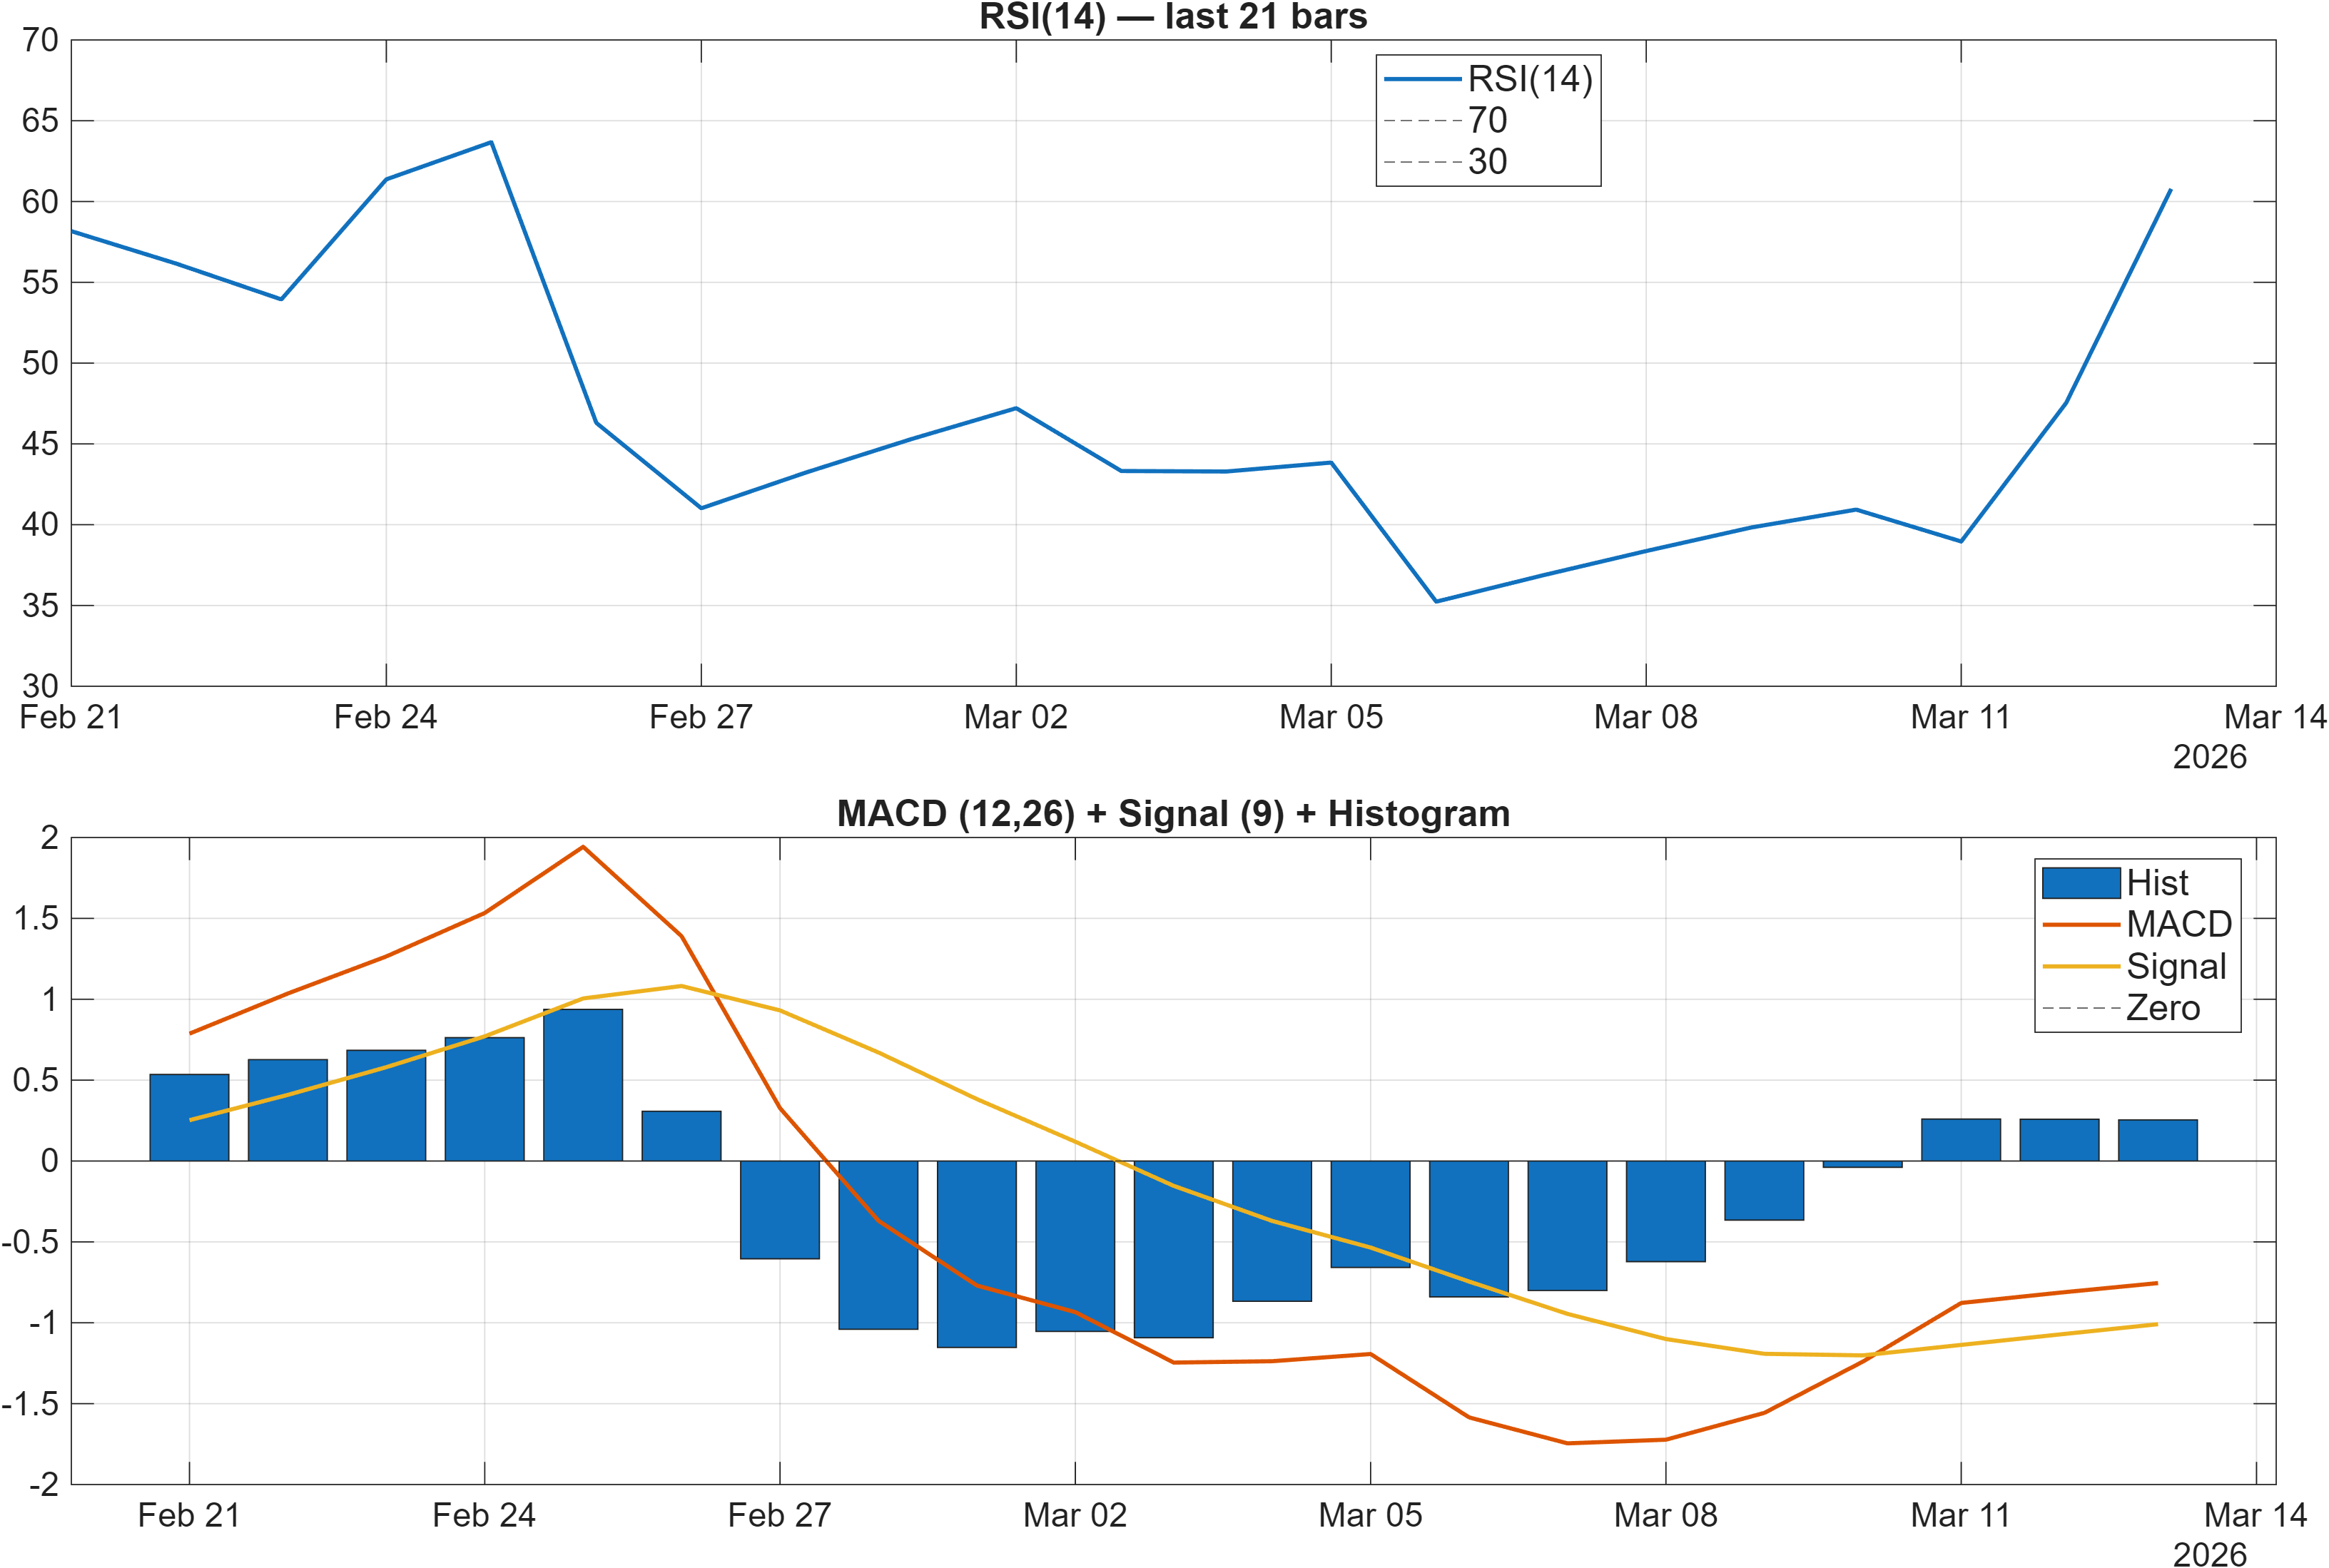
Momentum is constructive but not uniformly strong. The RSI bias is labeled bullish with RSI(14) at 60.78, which typically aligns with a market that is sustaining upside pressure without being in an extreme condition. Meanwhile, the MACD histogram is positive at 0.2540, supporting the view that recent momentum remains net-positive on this measure.
The nuance comes from cross-checking these headline momentum cues against the broader signal mix in the dashboard: several trend-speed components are flagged bearish (for example, TS Mom(20) at -7.833 and TS Accel at -18.47), alongside a bearish rate-of-change reading (ROC(20) at -4.097). This combination often reads as momentum that is positive at the surface (RSI/MACD) but losing thrust in some time-series acceleration metrics—consistent with a market that may be stabilizing rather than strongly advancing.
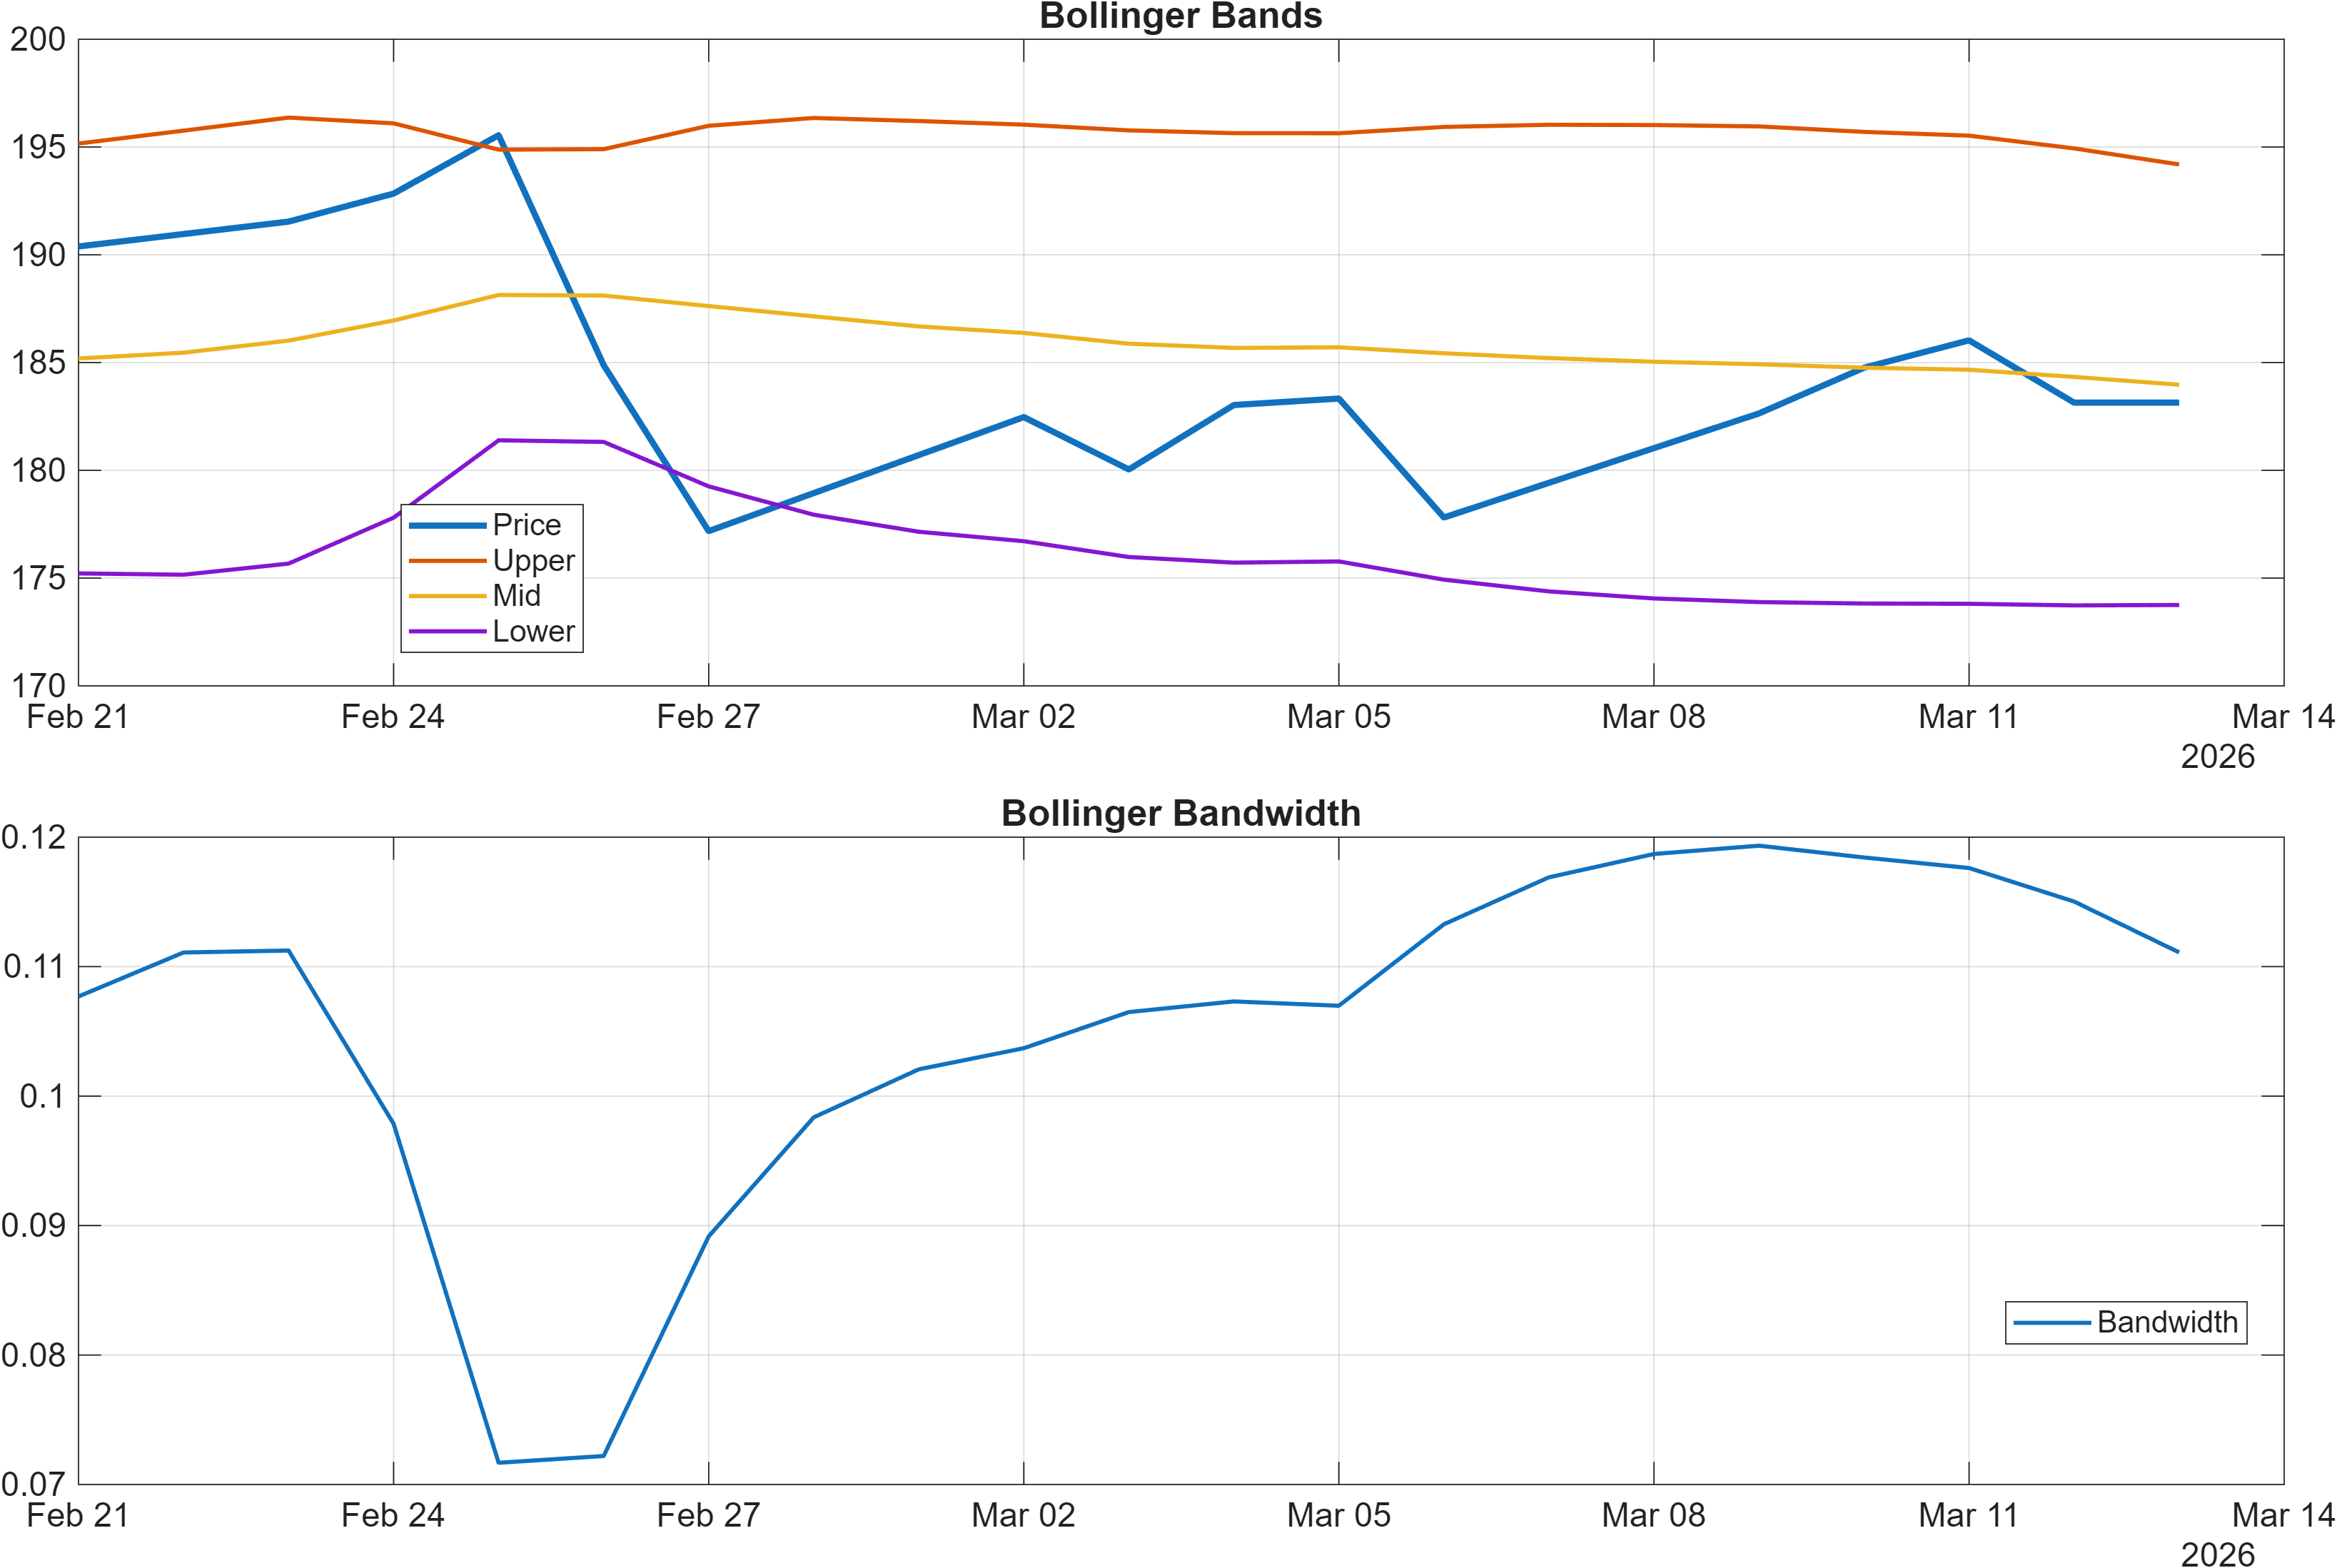
Volatility conditions look contained but responsive, with Bollinger bandwidth at 0.1111. This is not a clear “compression extreme” by itself, but it suggests the market is not operating in a hyper-volatile regime. In this context, a breakout attempt through 193.6350 would be more compelling if accompanied by bandwidth expansion, while a slip toward 175.6800 without volatility expansion may be more consistent with range rotation than a full regime shift.
Interpretation: RSI bias = Bullish, MACD hist = 0.2540.
Interpretation: Bandwidth (volatility regime) latest = 0.1111.
4) Support / Resistance zones
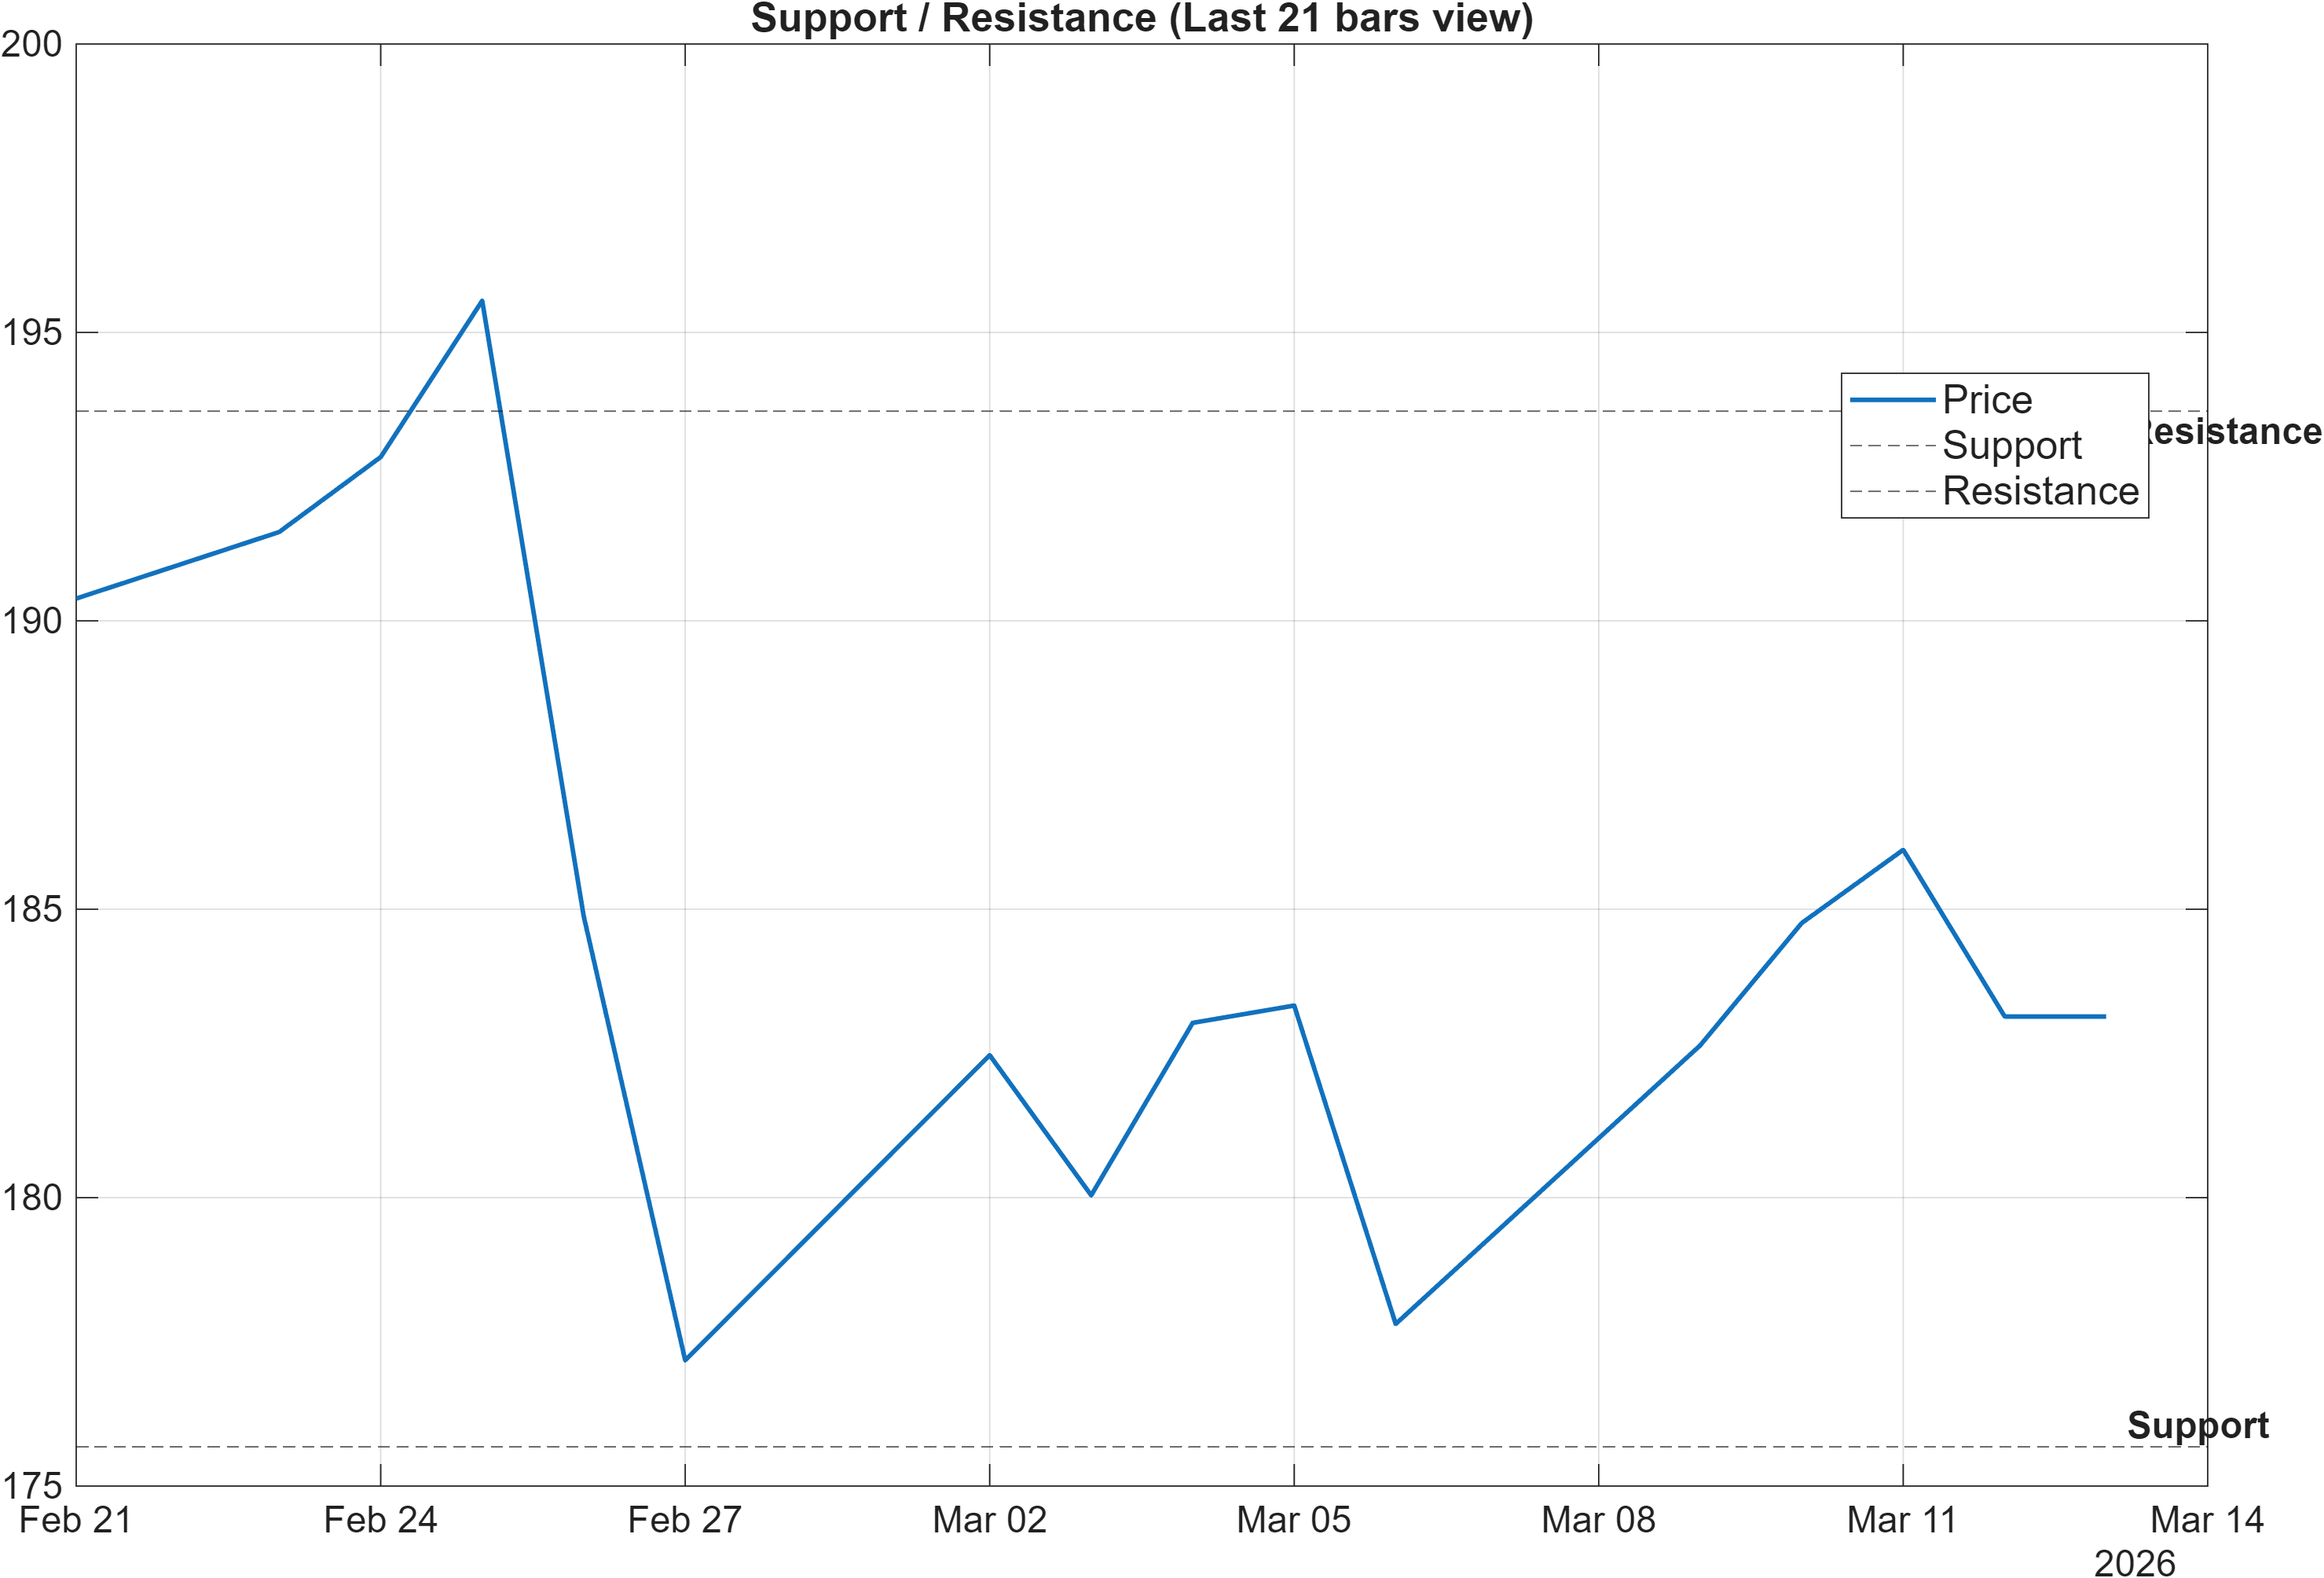
Support and resistance define the current decision framework: support ~ 175.6800 and resistance ~ 193.6350. With trend cues mixed (close below MA50 yet MA50 above MA200), these zones function less like static “targets” and more like validation thresholds for whether the market is resuming a constructive regime or remaining range-bound.
The confluence of indicators reinforces this “zones-first” approach. Several participation/accumulation proxies are bullish—ADOSC 35.74, a bullish OBV slope(10) of 9e+08, and a bullish AD Line slope(10) of 3.212e+08—which tends to be consistent with buyers showing up on balance. That backdrop can support a defense of 175.6800 if price rotates lower, especially if downside pushes fail to produce follow-through.
However, the risk to that constructive reading is that some rate-of-change and volume change measures remain bearish (for example, Vol ROC(20) at -10.65), which can show up as weaker breakout sponsorship near resistance. In practical market-structure terms, a push above 193.6350 that occurs on soft participation can revert quickly into the prior range. Conversely, repeated tests of 175.6800 combined with weakening participation would be more consistent with a transition toward a less favorable regime.
Scenario view: Break above resistance with volume → continuation. Close below support → signal deterioration risk.
5) Quant Technical Dashboard (18 Signals)
KGNAI AI Technical Analysis Score (Deep Reinforcement Learning): Rank #425 out of 2065 (Rank 1 represents the strongest technical positioning and a higher probability of favorable price behavior. As ranks increase toward the maximum, the probability of favorable outcomes weakens and bearish positioning becomes more dominant.) | Label: Neutral | Score: 0.588
18-Signal Technical Confluence Score: 0.278 (Neutral)
Overall Technical Score (18-signal confluence + DRL rank blend): 0.371 (Bullish)
Note: The blended score reflects signal strength weighted against broader AI technical ranking, which may temporarily diverge.
Blended technical score breakdown: 0.371 (Bullish | Bull 9 / Bear 4 / Neutral 5)
The technical read is best summarized as constructive breadth with mixed speed. On the surface, the blended technical score is 0.371 and labeled Bullish, supported by a 9/4/5 split (Bull/Bear/Neutral). Yet the standalone 18-signal confluence score sits at 0.278 and remains Neutral, while the DRL technical rank is #425 (Neutral). That divergence is analytically meaningful: it implies that while many component signals lean positive, the broader pattern recognition / ranking model is less convinced that the setup is in a high-probability technical regime right now.
Looking inside the signals, the “quality” of bullish evidence skews toward participation and accumulation rather than pure price thrust. Examples include ADOSC 35.74 (Bullish) and multiple slope-based measures (OBV and AD Line) flagged bullish, which can support base-building. In contrast, some time-series momentum measures are bearish (TS Mom(20) -7.833, TS Accel -18.47, and ROC(20) -4.097), reflecting deceleration risk—often observed when a market is consolidating below resistance or recovering after a pullback.
Volatility and range signals also reinforce a “wait for resolution” posture: BB Width 0.1111 is neutral, and the 20-day high/low markers (HHIGH(20) 197.6, LLOW(20) 174.6) bracket a trading band that aligns closely with the stated resistance/support region. If bullish breadth persists while speed indicators improve, the blended score can remain supportive; if deceleration persists and price loses 175.6800, the neutral DRL posture becomes more relevant.
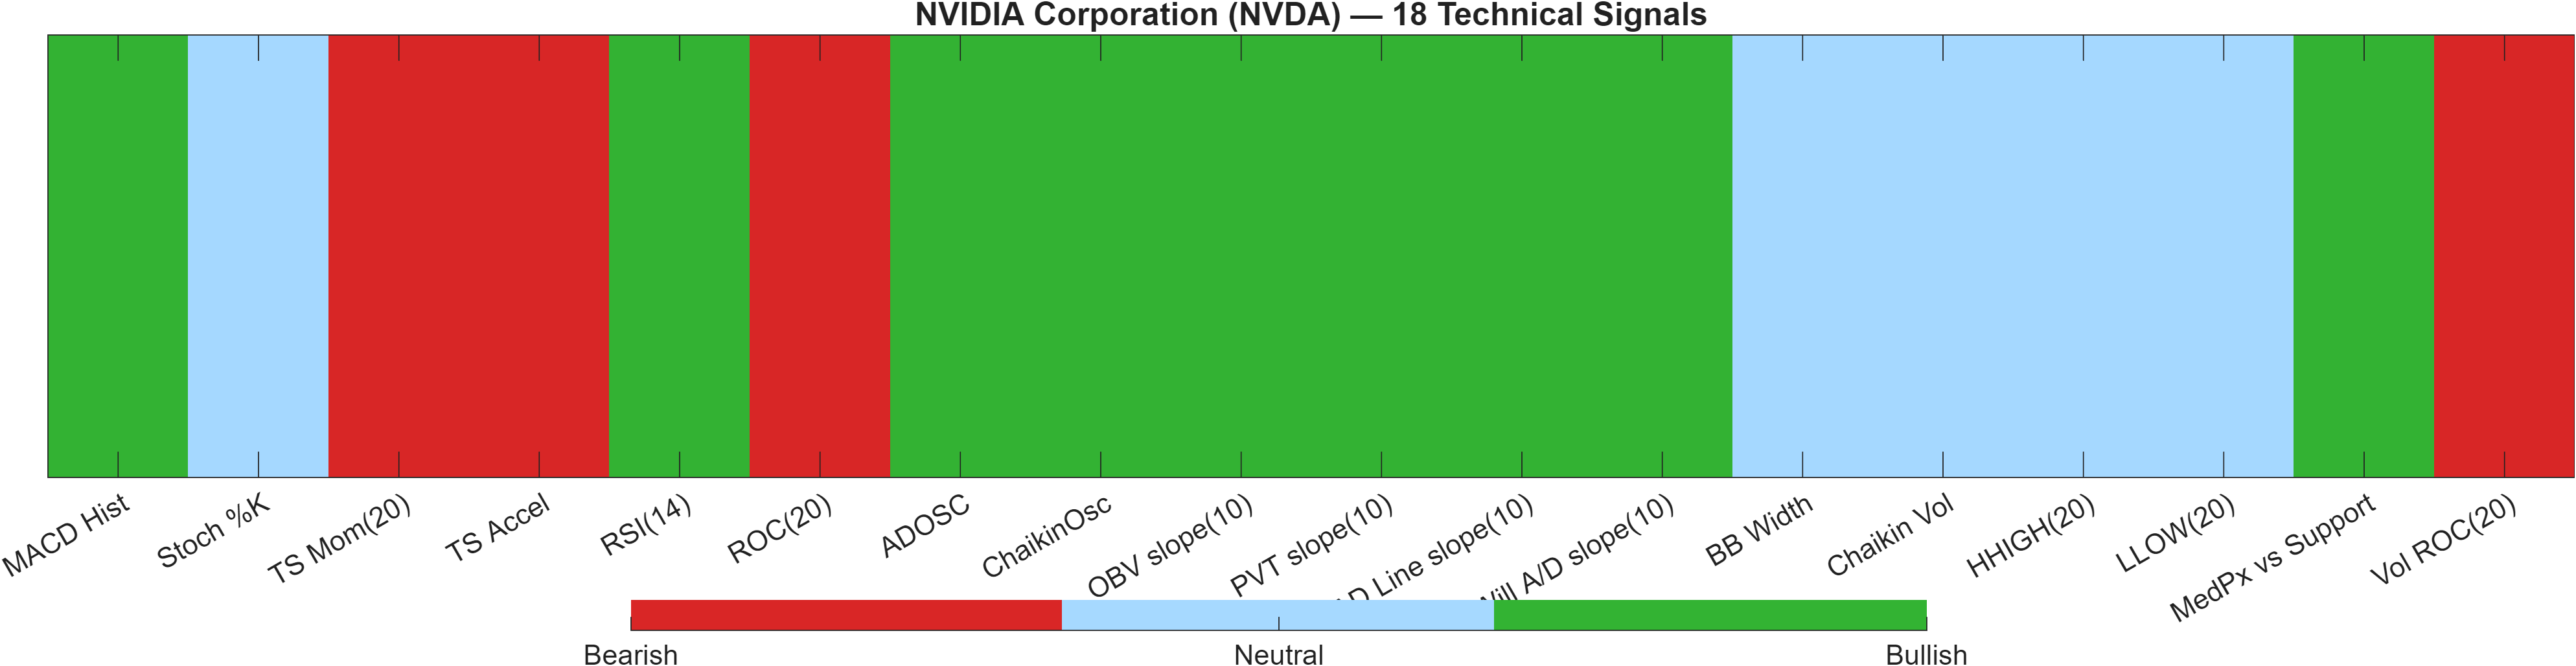
Signal table (Bull/Bear/Neutral)
| Indicator | Value | Signal |
|---|---|---|
| MACD Hist | 0.254 | Bullish |
| Stoch %K | 62.85 | Neutral |
| TS Mom(20) | -7.833 | Bearish |
| TS Accel | -18.47 | Bearish |
| RSI(14) | 60.78 | Bullish |
| ROC(20) | -4.097 | Bearish |
| ADOSC | 35.74 | Bullish |
| ChaikinOsc | 9.846e+07 | Bullish |
| OBV slope(10) | 9e+08 | Bullish |
| PVT slope(10) | 3.12e+06 | Bullish |
| AD Line slope(10) | 3.212e+08 | Bullish |
| Will A/D slope(10) | 19.56 | Bullish |
| BB Width | 0.1111 | Neutral |
| Chaikin Vol | -21.28 | Neutral |
| HHIGH(20) | 197.6 | Neutral |
| LLOW(20) | 174.6 | Neutral |
| MedPx vs Support | 7.665 | Bullish |
| Vol ROC(20) | -10.65 | Bearish |
Interpretation: Indicator-level signals form the base confluence, which is then adjusted using a separate AI-driven technical ranking model. The final technical score summarizes this combined view.
6) News sentiment + extractive gist
Sentiment score (avg): 0.070 | Positive: 20% | Neutral: 80% | Negative: 0%
KGNAI AI News Sentiment Score (normalized -1 to +1): 0.78 (as of 2026-03-13) | Label: Bullish | Overall news score: 0.77
Positive Developments
Recent coverage across major financial outlets indicates a generally constructive narrative around NVIDIA’s ecosystem presence and event-driven visibility. Attention has been oriented toward upcoming developer and partner activity, with commentary emphasizing product showcases, platform capabilities, and the breadth of use-cases associated with AI infrastructure. In parallel, some market commentary places NVDA within broader thematic baskets (for example, industrial digitization and adjacent technology categories), which can support incremental attention even when the reporting itself is not explicitly price-driven. The model output reflects this as a bullish normalized score of 0.78 and an overall news score of 0.77, while still acknowledging that the tone is mostly informational rather than overtly directional. In practical terms, that aligns with a backdrop where sentiment is supportive at the margin, but price confirmation remains the primary arbiter near key levels such as 193.6350.
Neutral / Mixed Developments
The distribution of articles is dominated by neutral coverage (80% neutral vs 20% positive and 0% negative), suggesting the news flow is currently more about context than catalysts. Much of the discussion appears centered on conferences, industry positioning, and ecosystem references rather than discrete firm-specific surprises. This type of “steady narrative” can reduce headline risk while still leaving the stock primarily driven by technical structure and positioning. The reported average sentiment score of 0.070 also fits with a tone that is mildly constructive but not emphatic. For trading and risk framing, this often means that support/resistance behavior—not the news cycle—sets the near-term decision points.
Negative / Risk Signals
Even with 0% negative classification in the supplied distribution, risk signals still exist in the form of expectations management and competitive framing embedded within broader coverage. Event-focused narratives can raise the bar for delivery: as attention concentrates around product and partnership themes, the market may become more sensitive to ambiguity, timing, or perceived competitive pressure. Separately, reports referencing large-scale access to advanced compute can be read as a reminder that demand signals may involve shifting geographic and supply-chain considerations, which can contribute to short-term volatility around narratives rather than fundamentals (not assessed here). Against this backdrop, the more immediate risk anchor remains technical: failure to hold 175.6800 would matter more than incremental news tone, especially given the neutral confluence score (0.278) and the DRL technical label (Neutral).
- Whether sentiment remains supportive if price approaches 193.6350 and volatility (bandwidth 0.1111) expands.
- Any shift in the neutral-heavy mix (80% neutral) toward more polarized tone during event windows.
- Price behavior near 175.6800 if momentum measures (e.g., ROC(20) -4.097) fail to recover.
Sources referenced: Reuters, Bloomberg, Yahoo Finance, MarketWatch, Investing.com
Snapshot: AI Rank (Short–Mid–Long): Mixed (Bullish tilt) (Bullish–Bullish–Neutral) · Technical Confluence: Neutral · Key Levels: Support ~175.68 | Resistance ~193.63 · News Sentiment: Neutral
7) Sources
Not available in the provided data.
You may also like: How KGNAI AI ranks instruments across global markets
Disclaimer: KGNAI provides AI-generated analytics and educational market commentary only. This is not financial advice. Markets involve risk. Always do your own research.