
MP Materials Corp (MP) — 15-Mar-2026 Technical & Rank Report with Cautious Short-Term Stance
MP Materials Corp (MP) shows a split profile across horizons as of 15-Mar-2026: weaker short-term and weekly rank positioning contrasts with a notably strong 3-month cross-sectional rank. Technically, the tape leans defensive with close vs MA50 = Bearish and MA50 vs MA200 = Bearish, while momentum diagnostics remain pressured (RSI bias Bearish and MACD histogram -0.2972). At the same time, volatility context is not extreme, with Bollinger Bandwidth at 0.1244, suggesting a regime that can transition into larger directional moves if a catalyst emerges. Key decision zones are well-defined: support ~54.8488 and resistance ~70.9310. News sentiment in the provided dataset skews constructive (normalized score 0.99), creating a notable sentiment-versus-price/trend tension that warrants confirmation from price and volume rather than inference.
- Rank stance: Short-term Bearish | Mid-term Neutral | Long-term: Not available
- Technical confluence: Overall technical score -0.272 Neutral (with DRL technical rank labeled Bearish)
- Key levels: Support ~54.8488 | Resistance ~70.9310
- News sentiment bias: Bullish (normalized 0.99) with distribution 47% positive / 53% neutral / 0% negative
- Confirmation / invalidation: Confirmation favors a break above 70.9310 with volume; deterioration risk increases on a close below 54.8488.
KGNAI evaluates assets using large cross-sectional datasets built from millions of structured data points. Inputs incorporate fundamental metrics, technical structures, and systematically processed news sentiment. Statistical models, machine learning, and AI frameworks are used to assess relative positioning, signal alignment, and probabilistic behavior across broad universes.
- Ranks are comparative across the tracked universe, not absolute price targets.
- Confluence reflects alignment among independent signal groups.
- Support/resistance levels are probabilistic decision zones, not guarantees.
- Sentiment provides contextual bias within the broader analytical framework.
1) KGNAI AI Analysis
Region: USA
Total universe size: 2064 ranked instruments
- Daily rank: #1923 out of 2064 — Bearish
- Weekly rank: #1673 out of 2064 — Bearish
- Monthly rank: #1177 out of 2064 — Neutral
- 3-Monthly rank: #21 out of 2064 — Bullish
- 6-Monthly rank: Not available for this horizon — Not available
- Yearly rank: Not available for this horizon — Not available
The rank stack for MP is characterized by sharp horizon dispersion. On the shortest windows, the instrument sits in the weaker tail of the 2064-name universe (daily #1923 and weekly #1673), consistent with near-term pressure and reduced relative resilience versus peers. The monthly rank #1177 shifts that picture toward the middle of the distribution, aligning better with a market that may be stabilizing but not yet demonstrating durable leadership.
The key counterpoint is the 3-month rank #21, which places MP among the strongest cohort on that horizon. That contrast often matters: it can represent either (a) a strong prior trend now undergoing a corrective phase, or (b) an early breakdown where shorter-term deterioration is starting to overwhelm the prior regime. With 6-monthly and yearly ranks not available in the provided data, the longer-cycle anchor that could adjudicate between “pause within strength” and “regime change” is absent.
Within KGNAI’s framework, this configuration implies the short-term tape should be treated as Bearish, while the intermediate lens remains Neutral. The analytical burden shifts to technical confirmation—particularly whether price action can reclaim key moving-average structure or, conversely, whether weakness deepens into the defined support zone.
Term view: Short-term: Bearish. Mid-term: Neutral. Long-term: Not available.
Want the full universe and complete rank tables? Unlock full access on KGNAI: https://www.kgnai.com/pricing
2) Price & trend overview
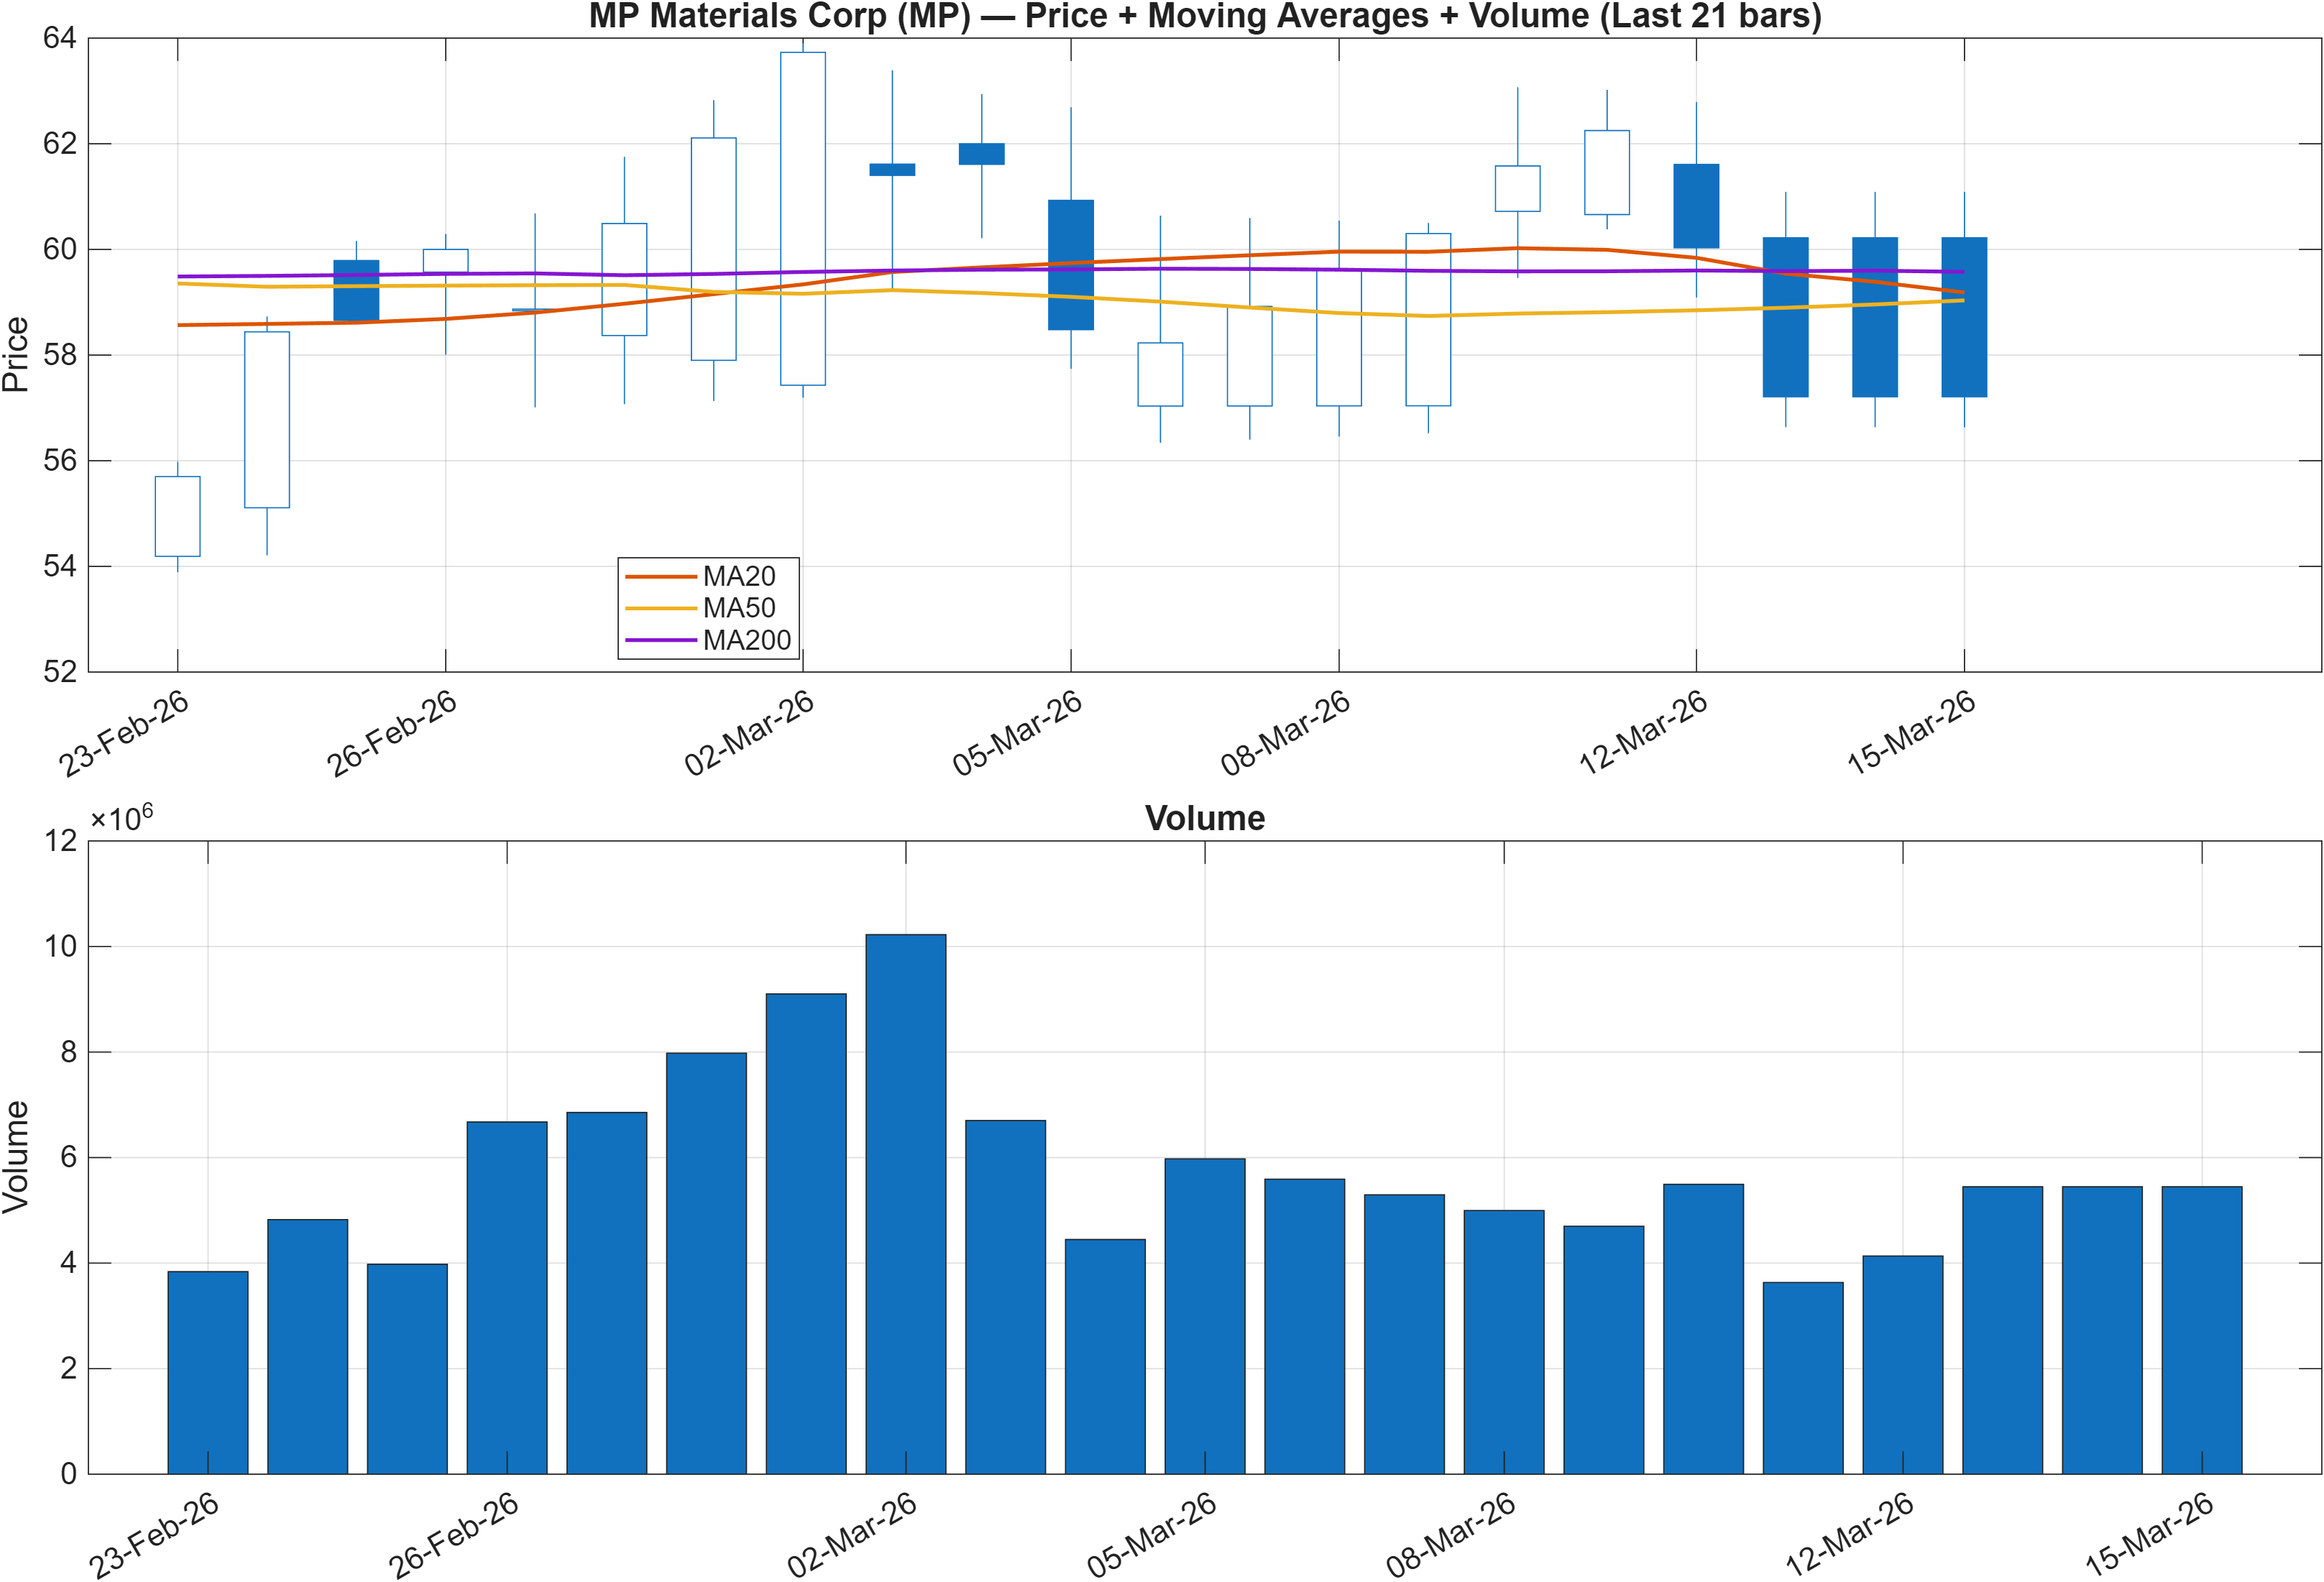
Interpretation: Close vs MA50 = Bearish, MA50 vs MA200 = Bearish.
Trend structure vs. rank dispersion
Trend diagnostics currently reinforce the weaker short-horizon ranks. A bearish close relative to the MA50 indicates that the most commonly watched intermediate trend gauge is acting as overhead supply rather than support. The additional condition—MA50 below MA200 (bearish)—signals the broader moving-average stack remains in a risk-off configuration, commonly associated with reduced trend persistence on the upside until the structure is repaired.
This matters in the context of MP’s 3-month rank strength (#21) versus weaker daily/weekly standings (#1923 / #1673). When a previously strong 3-month regime collides with a bearish moving-average structure, the market is often adjudicating between continuation and mean reversion. In practical terms, a durable recovery typically requires reclaiming the MA50 and then improving the MA50–MA200 relationship over time; absent that, rallies can become tactical rather than trend-defining.
Volume context in the figure should be used as a confirmation layer: if rebounds develop alongside improving participation, they tend to carry more information than price alone. Conversely, if any bounce occurs with muted activity while the MA50 remains overhead, it fits a “relief rally within a bearish structure” profile. Given the defined levels in this report (support 54.8488, resistance 70.9310), trend repair is best evaluated alongside whether price is migrating away from support and toward resistance with constructive follow-through rather than episodic spikes.
3) Momentum & volatility dashboard
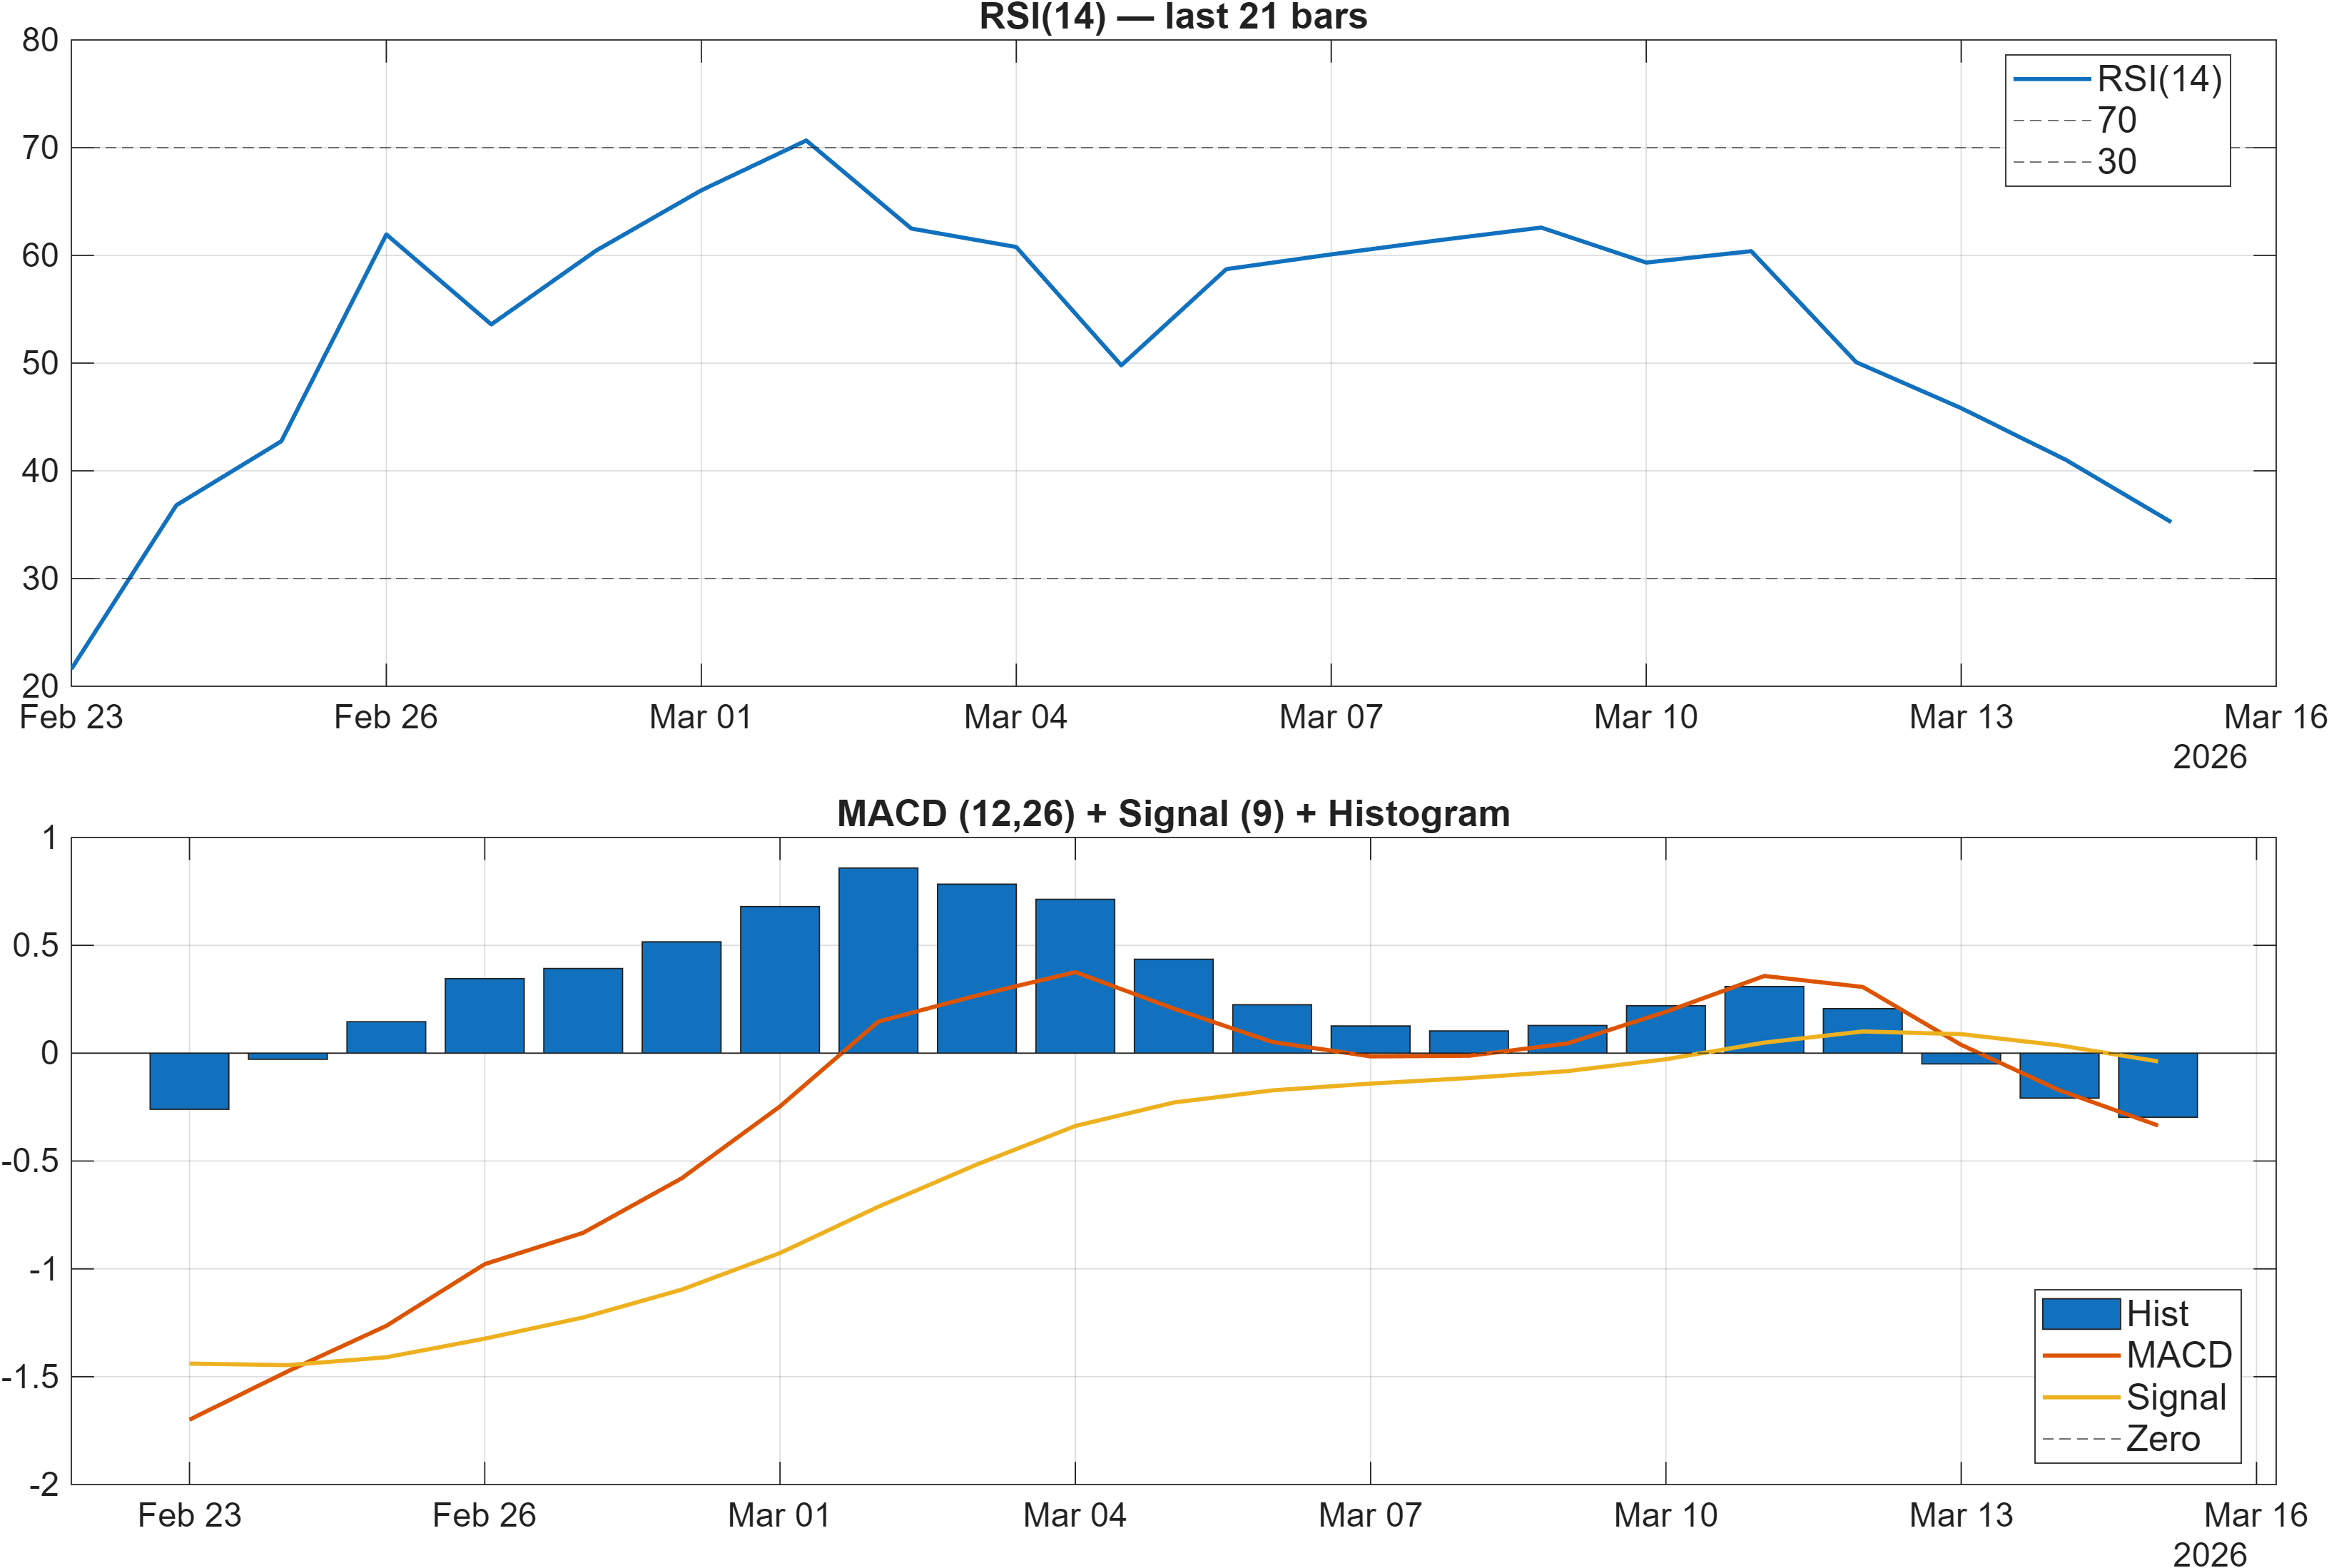
Interpretation: RSI bias = Bearish, MACD hist = -0.2972.
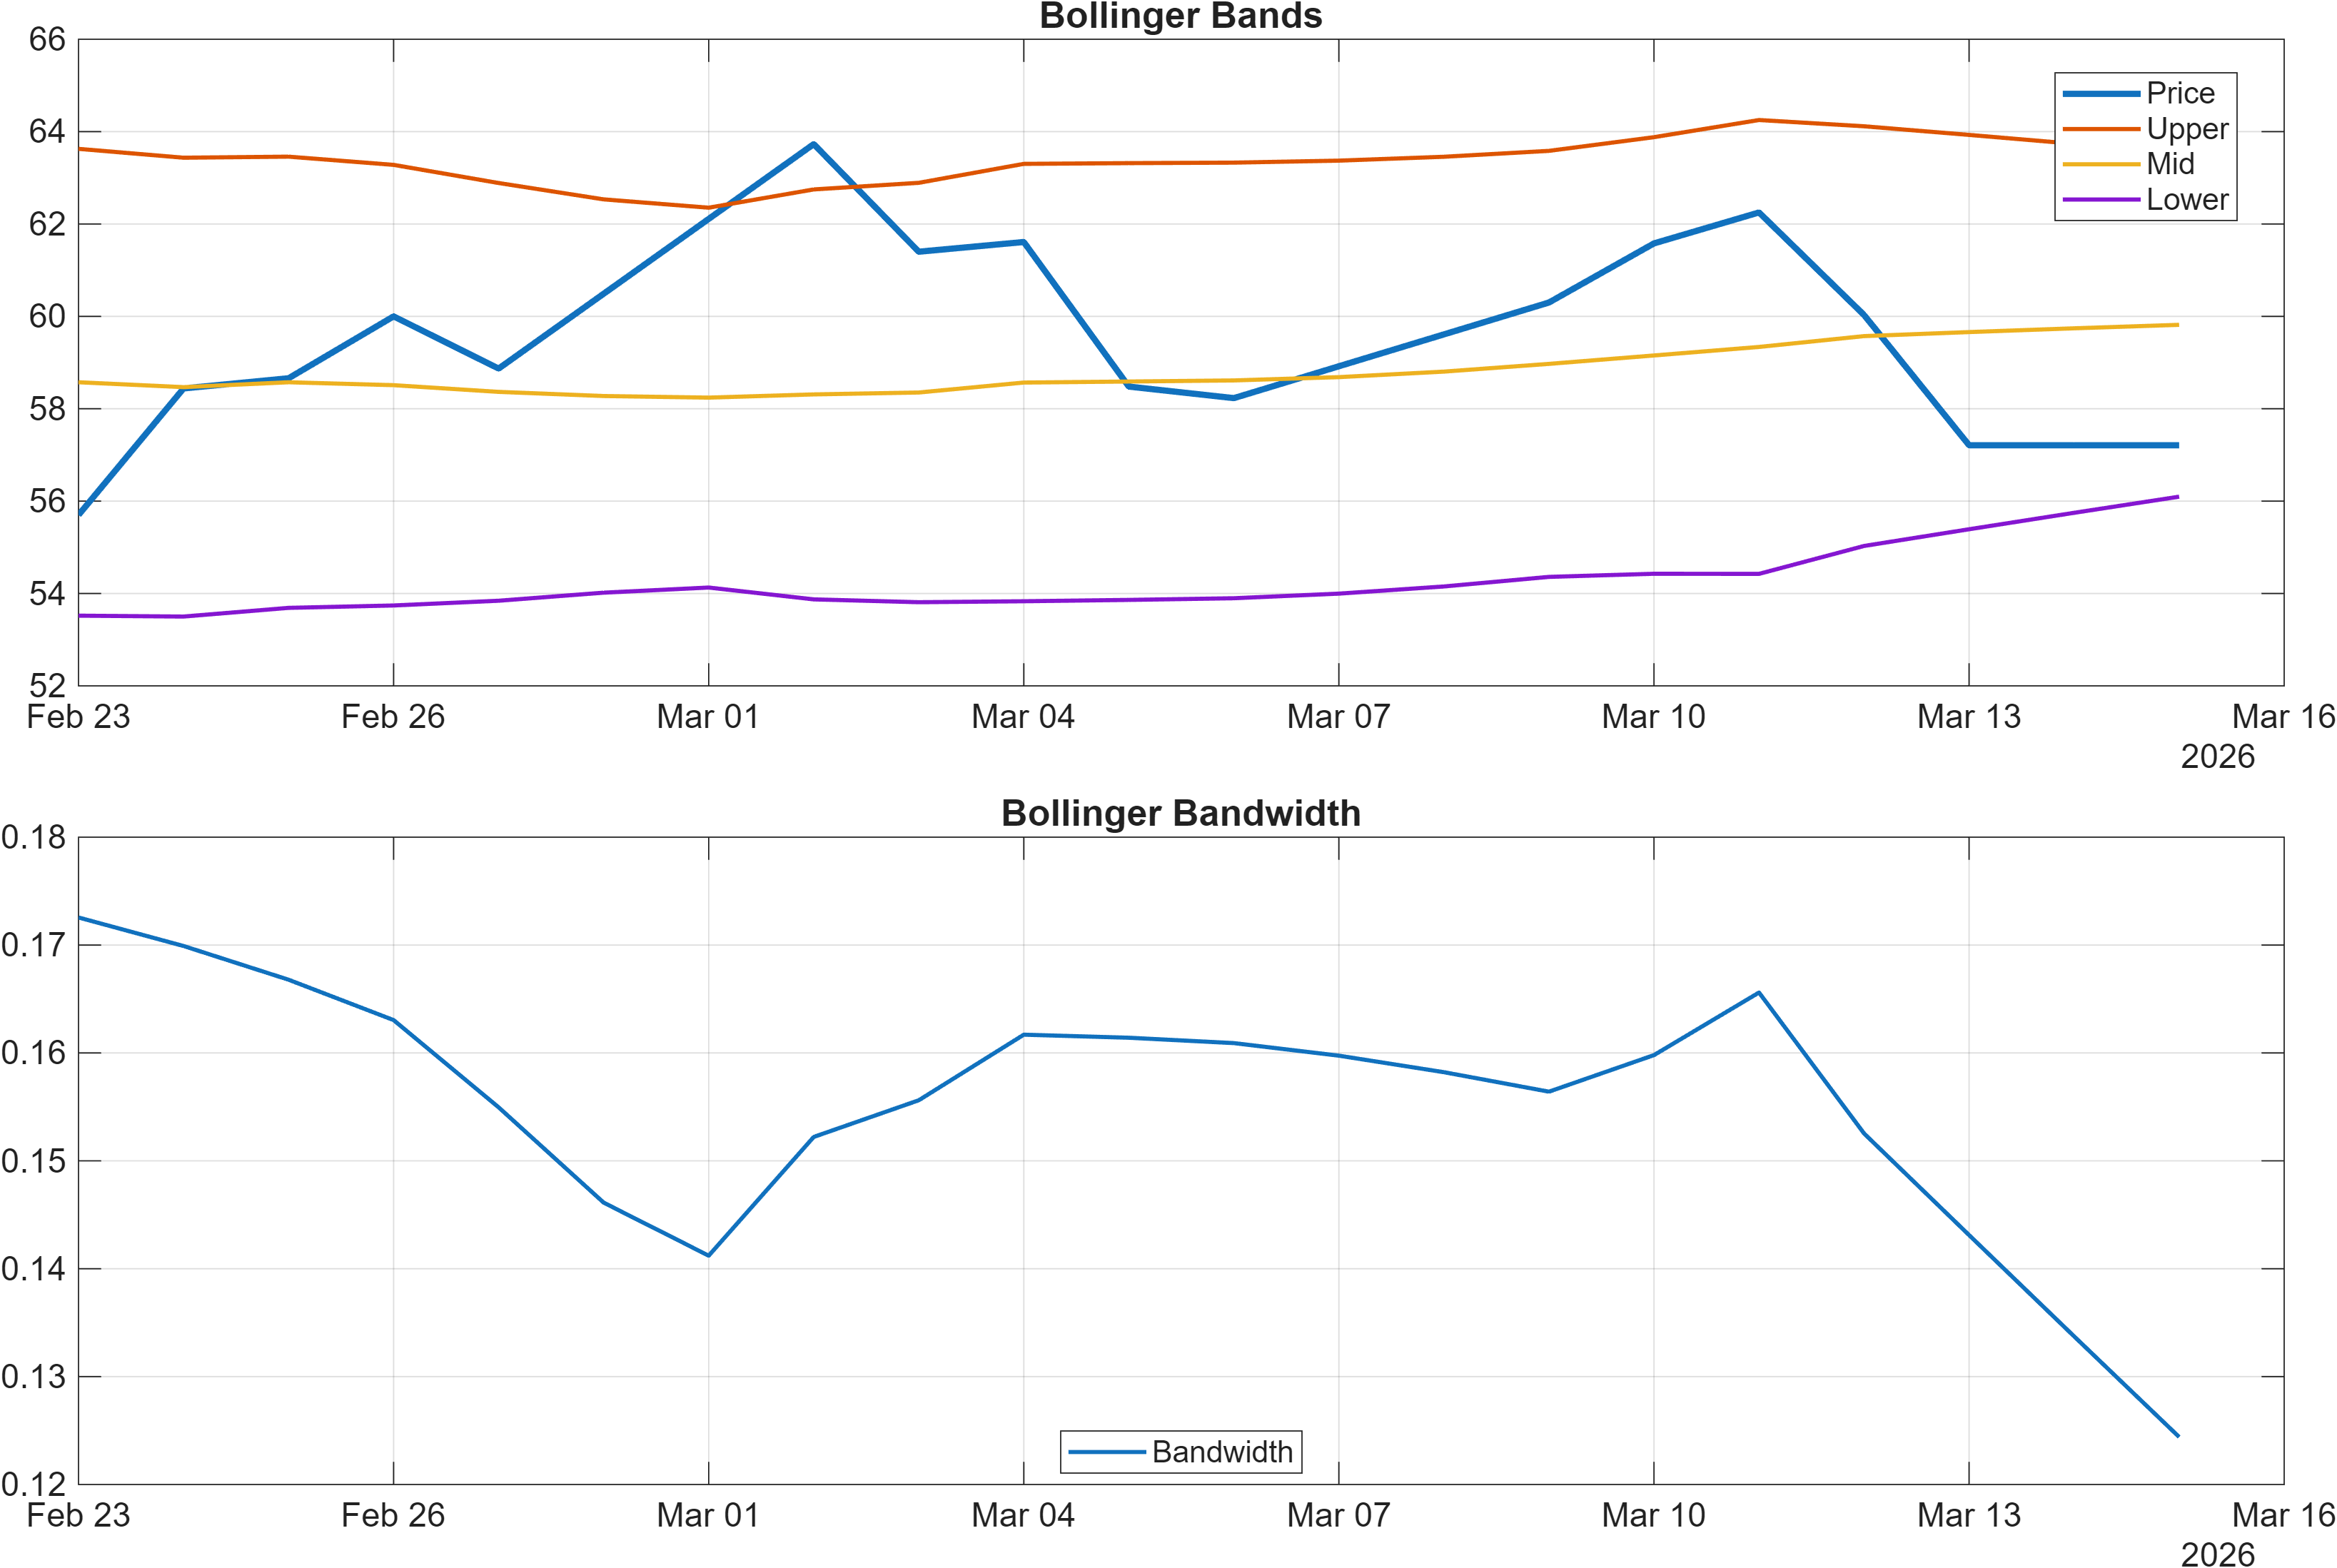
Interpretation: Bandwidth (volatility regime) latest = 0.1244.
Momentum pressure with a non-extreme volatility backdrop
The momentum complex is currently pointed lower. The RSI(14) reading of 35.24 aligns with the stated bearish RSI bias, reflecting persistent downside pressure rather than a balanced, range-bound state. In parallel, the MACD histogram at -0.2972 indicates negative momentum remains embedded, consistent with the bearish moving-average structure seen in the price panel.
The volatility layer adds nuance. Bollinger Bandwidth at 0.1244 does not, by itself, describe direction; it describes the regime in which directional moves can either compress or expand. In the accompanying signal table, BB Width is labeled bullish, which can occur when bandwidth conditions are interpreted as supportive for a future expansion phase rather than signaling immediate upside. The key is that a volatility regime can transition without resolving bullishly—direction is typically confirmed by momentum stabilization (RSI improving from the mid-30s) and MACD histogram moving toward zero.
Internal momentum metrics from the signal set reinforce the pressure: TS Mom(20) is -1.23 and TS Accel is -3.12, a combination consistent with deceleration rather than early-stage acceleration higher. For market structure readers, the constructive counterweights are mostly in select “early-turn” or flow proxies, such as Stoch %K at 12.93 (bullish), which can flag a near-term reset. The analytical posture here is to treat oversold-style signals as potential catalysts, while requiring confirmation from RSI/MACD improvement and progress away from the support zone.
4) Support / Resistance zones
Support ~ 54.8488 | Resistance ~ 70.9310
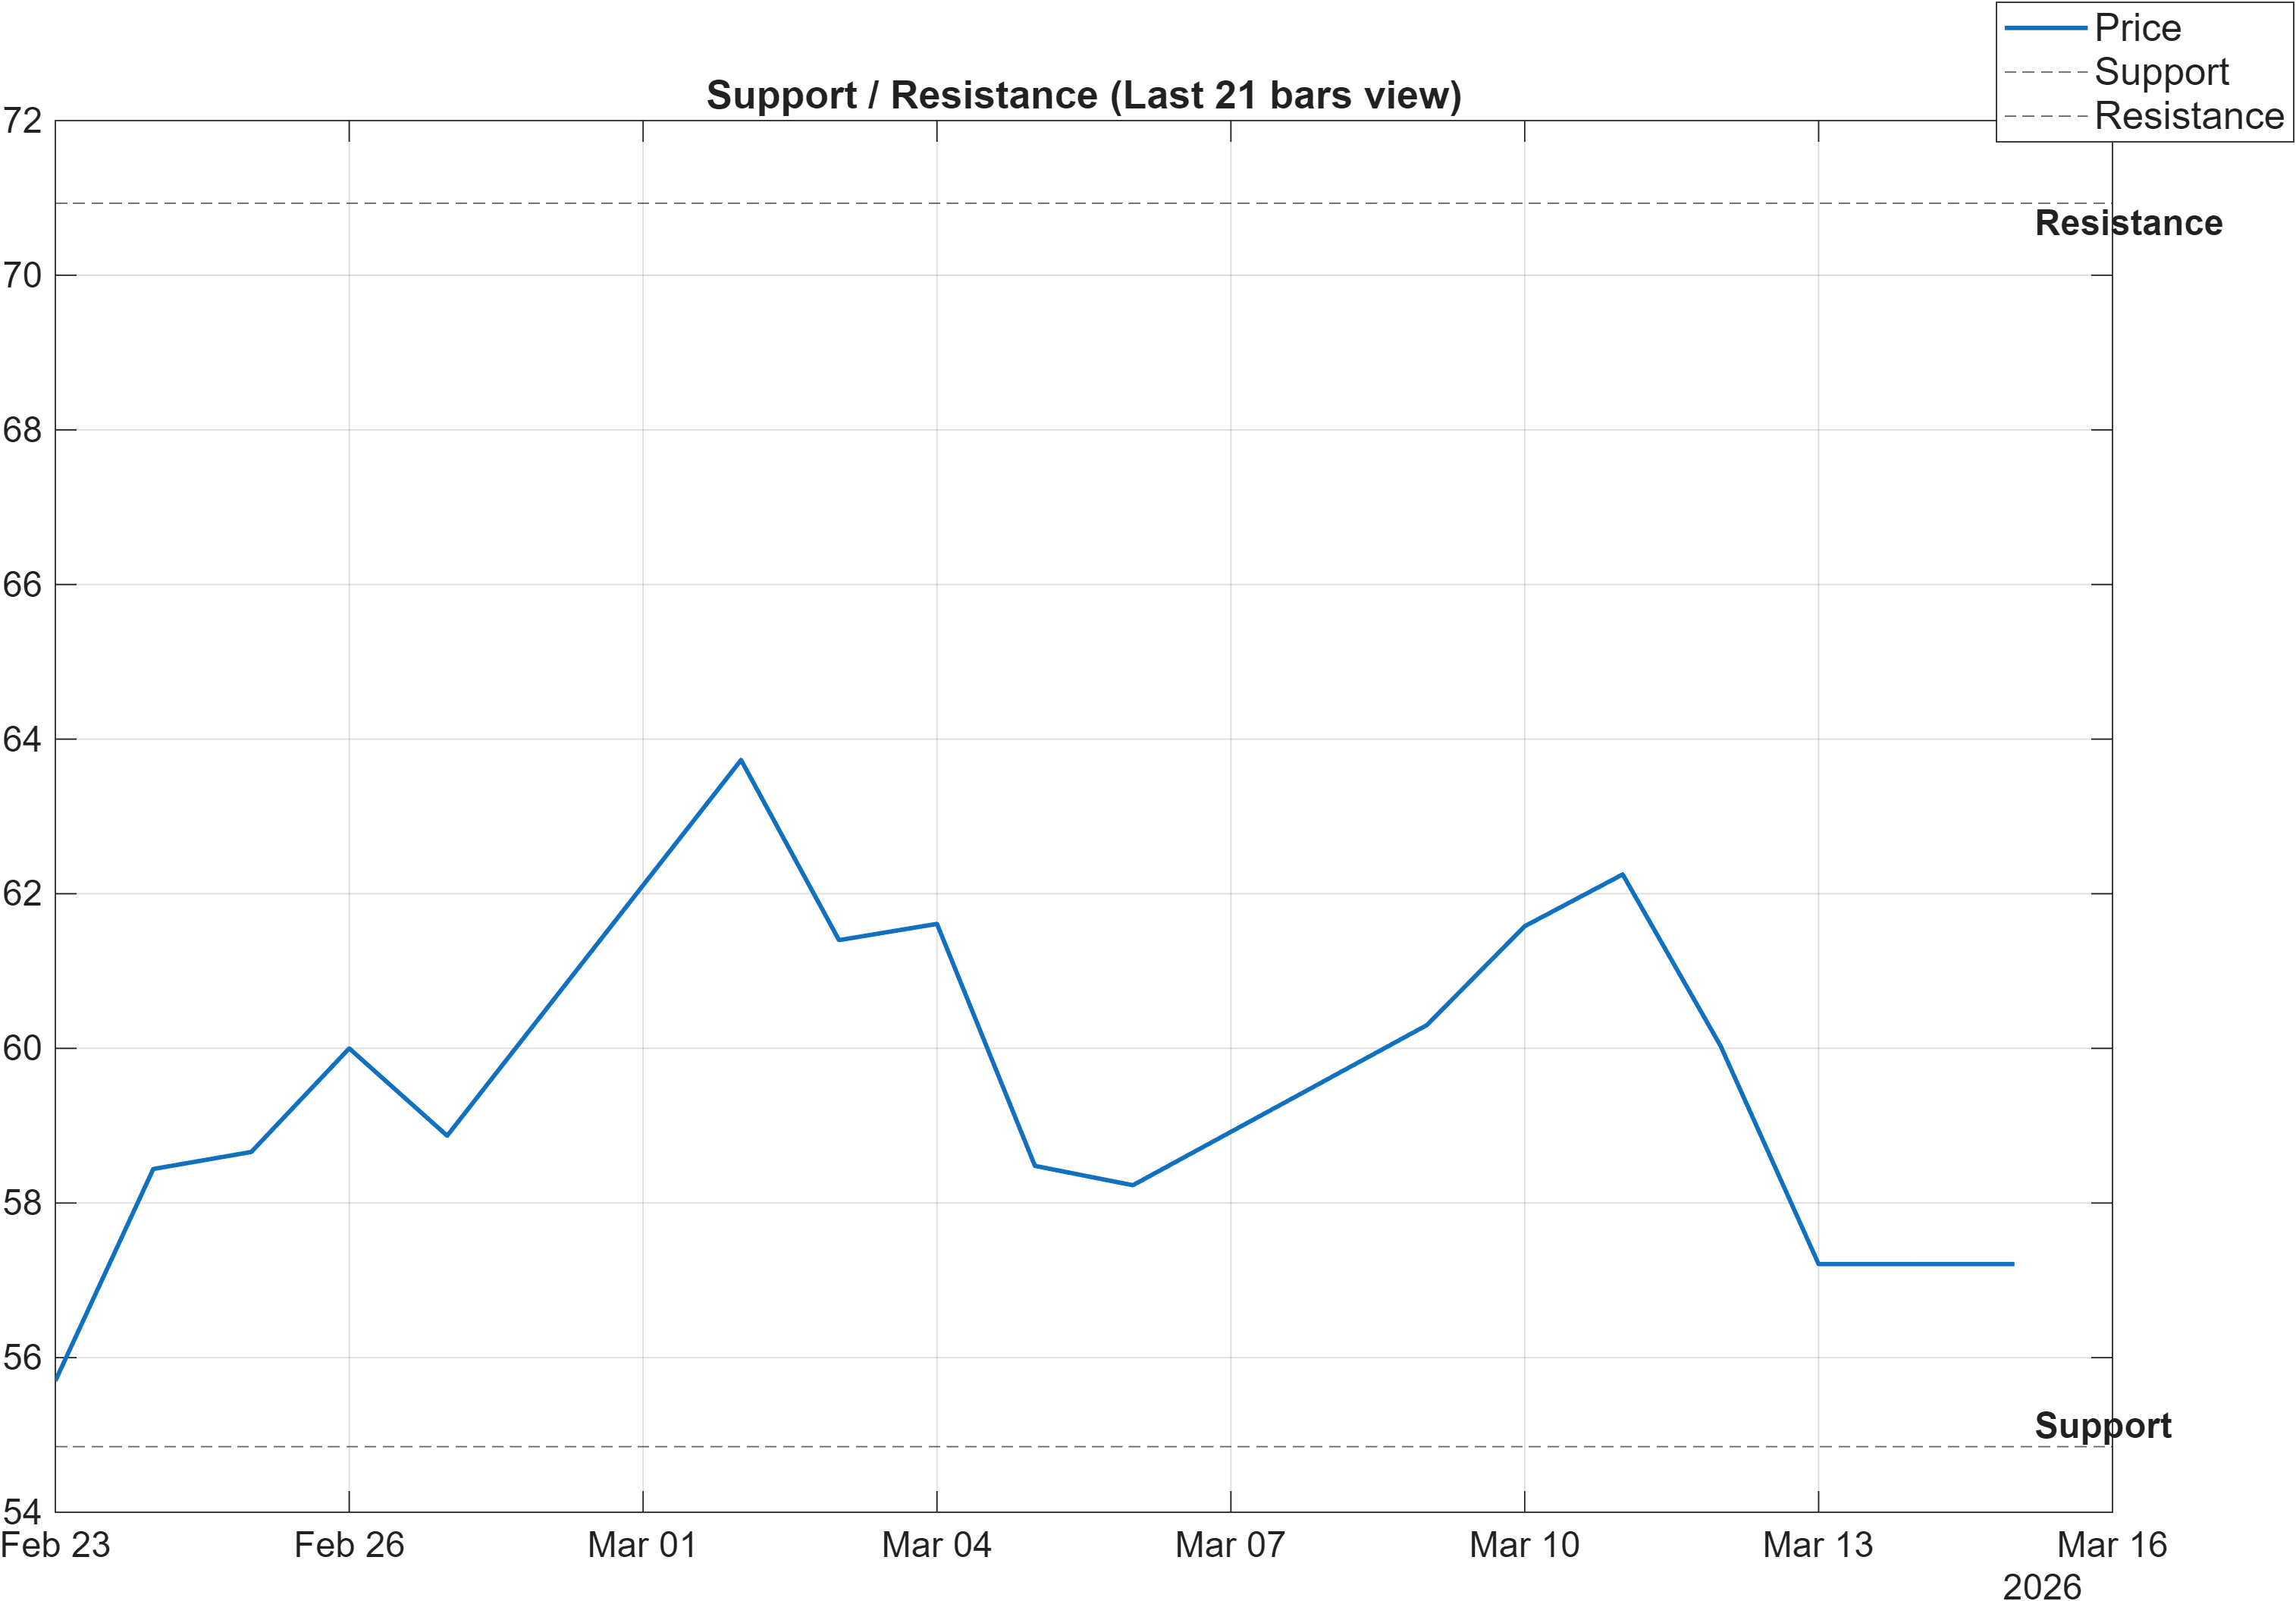
Scenario view: Break above resistance with volume → continuation. Close below support → signal deterioration risk.
Decision zones and asymmetric confirmation
MP’s map is defined by a clean nearby floor and a clearly separated ceiling: 54.8488 as support and 70.9310 as resistance. With short-term ranks in the weaker tail (daily #1923), this framing matters because the market often treats support as the first “risk check” when momentum is negative (MACD histogram -0.2972) and RSI is depressed (35.24).
The support zone tends to serve two different functions depending on confirmation. If price respects support and begins to rotate upward while momentum stabilizes, it can act as a platform for mean reversion toward the upper boundary. If support fails on a closing basis, the stated scenario (“close below support → signal deterioration risk”) becomes a regime signal: it implies downside control has strengthened and reduces the informational value of oversold oscillators such as Stoch %K at 12.93.
On the upside, resistance at 70.9310 is the threshold for a more credible trend continuation signal in the context of the longer-horizon rank strength (3-month #21). Importantly, the report’s own condition requires volume confirmation; this is consistent with the mixed flow readings in the signal table (e.g., OBV slope(10) bullish but PVT slope(10) bearish). In other words, a breakout that lacks participation can be structurally fragile, whereas a breakout with volume can help reconcile bullish sentiment with bearish short-term trend signals.
5) Quant Technical Dashboard (18 Signals)
KGNAI AI Technical Analysis Score (Deep Reinforcement Learning): Rank #1833 out of 2064 (Rank 1 represents the strongest technical positioning and a higher probability of favorable price behavior. As ranks increase toward the maximum, the probability of favorable outcomes weakens and bearish positioning becomes more dominant.) | Label: Bearish | Score: -0.776
18-Signal Technical Confluence Score: -0.056 (Neutral)
Overall Technical Score (18-signal confluence + DRL rank blend): -0.272 (Neutral)
Note: The blended score reflects signal strength weighted against broader AI technical ranking, which may temporarily diverge.
Blended technical score breakdown: -0.272 (Neutral | Bull 7 / Bear 8 / Neutral 3)
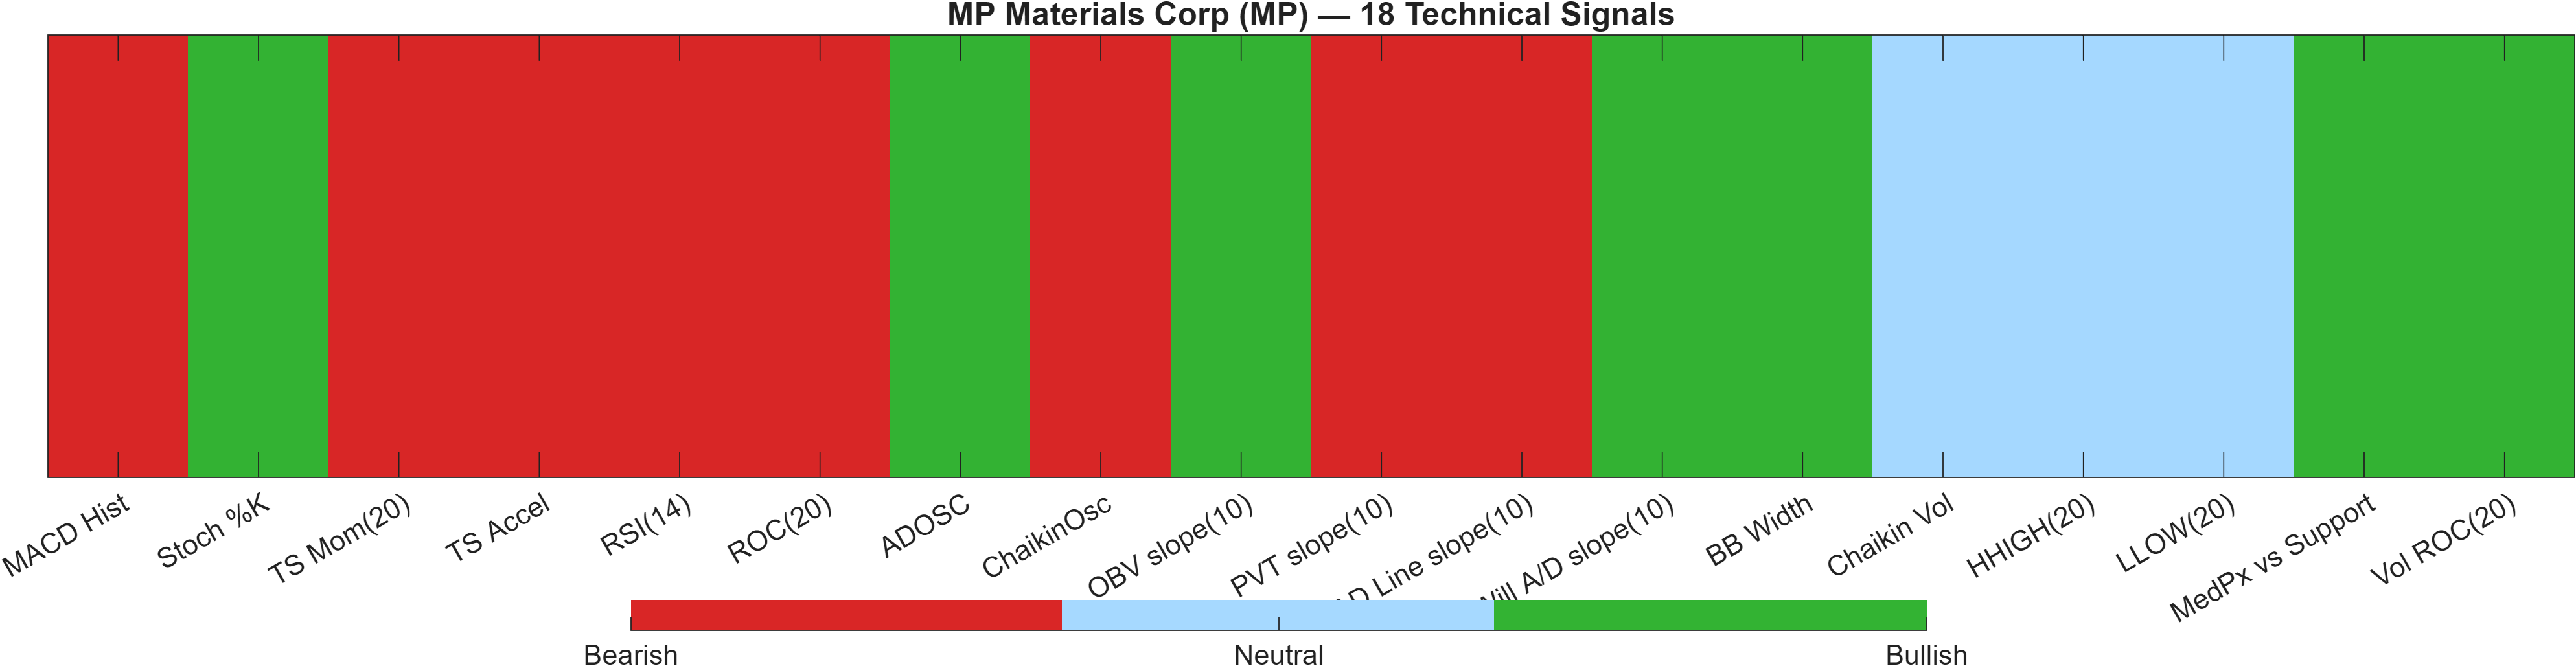
Confluence neutrality masking a bearish model rank
The dashboard is best read as a two-layer system: indicator confluence and an AI technical rank overlay. On pure confluence, the 18-signal score is -0.056, labeled Neutral. However, the DRL technical model places MP at #1833 out of 2064 with a score of -0.776, labeled Bearish. The blend yields an overall technical score of -0.272 (Neutral), explicitly acknowledging divergence between “signals now” and “pattern recognition across the broader universe.”
Signal mix: downside momentum vs selective flow resilience
The breakdown (Bull 7 / Bear 8 / Neutral 3) explains the neutrality: the bears slightly outnumber bulls, but not enough to create a high-conviction negative confluence. The bearish side is anchored in momentum and trend pressure: RSI(14) at 35.24, ROC(20) at -2.105, and MACD histogram -0.2972. These tend to dominate short-term behavior when they align.
Offsetting that, some flow and “early-turn” proxies are constructive: OBV slope(10) is bullish and ADOSC is bullish, while Stoch %K at 12.93 can be consistent with a stretched condition. The mixed picture argues for discipline around the defined price levels (support 54.8488 / resistance 70.9310): the confluence is not decisively bearish, but the model rank suggests the tape is still not behaving like a relative leader in the current short-term regime.
Signal table (Bull/Bear/Neutral)
| Indicator | Value | Signal |
|---|---|---|
| MACD Hist | -0.2972 | Bearish |
| Stoch %K | 12.93 | Bullish |
| TS Mom(20) | -1.23 | Bearish |
| TS Accel | -3.12 | Bearish |
| RSI(14) | 35.24 | Bearish |
| ROC(20) | -2.105 | Bearish |
| ADOSC | 16.22 | Bullish |
| ChaikinOsc | -2.263e+06 | Bearish |
| OBV slope(10) | 8.941e+06 | Bullish |
| PVT slope(10) | -9.547e+04 | Bearish |
| AD Line slope(10) | -4.359e+06 | Bearish |
| Will A/D slope(10) | 4.39 | Bullish |
| BB Width | 0.1244 | Bullish |
| Chaikin Vol | -2.269 | Neutral |
| HHIGH(20) | 63.9 | Neutral |
| LLOW(20) | 54.21 | Neutral |
| MedPx vs Support | 4.014 | Bullish |
| Vol ROC(20) | 12.9 | Bullish |
Interpretation: Indicator-level signals form the base confluence, which is then adjusted using a separate AI-driven technical ranking model. The final technical score summarizes this combined view.
6) News sentiment + extractive gist
Sentiment score (avg): 0.108 | Positive: 47% | Neutral: 53% | Negative: 0%
KGNAI AI News Sentiment Score (normalized -1 to +1): 0.99 (as of 2026-03-15) | Label: Bullish | Overall news score: 0.90
Positive Developments
Recent coverage across major financial outlets indicates a constructive narrative focus around MP’s strategic positioning and the role of domestic supply-chain buildout themes. In the provided sentiment mix, 47% of items register as positive with 0% negative, which helps explain the elevated normalized sentiment score of 0.99. This backdrop can support risk appetite even when technical conditions are not yet repaired. However, sentiment strength is most actionable when it translates into observable market behavior—particularly improved momentum (MACD histogram moving up from -0.2972) and price reclaiming trend references (currently close vs MA50 = Bearish). With resistance defined at 70.9310, constructive news tone becomes more consequential if it coincides with a higher-volume attempt to clear that zone, aligning narrative tailwinds with technical confirmation rather than relying on story-driven extrapolation.
Neutral / Mixed Developments
The distribution also shows a majority 53% neutral share, consistent with informational or analytical coverage that acknowledges both opportunity sets and near-term market cooling. This “mostly neutral, some positive” mix aligns with the average sentiment score of 0.108, which is modest even while the normalized metric is high in the dataset. In market-structure terms, mixed coverage often coincides with consolidation phases where participants are waiting for validation from price. That maps to MP’s current cross-horizon split: a very strong 3-month rank (#21) alongside weak daily/weekly ranks (#1923 / #1673). When news flow is not distinctly negative, the technical levels tend to carry more weight as decision points—support at 54.8488 and resistance at 70.9310—because they convert “wait-and-see” positioning into observable acceptance or rejection.
Negative / Risk Signals
Although the provided news sentiment breakdown shows 0% negative items, risk signals still emerge through price behavior versus narrative tone. The current technical posture—RSI(14) at 35.24 (bearish) and MACD histogram at -0.2972—suggests the market is not fully endorsing the constructive framing. This mismatch can be an early warning that expectations are already embedded, or that incremental positive information is being met by supply. The risk is less about a single negative headline and more about a failure to translate sentiment into breakout behavior. Specifically, repeated inability to clear 70.9310 would keep the instrument in a capped regime, while a close below 54.8488 would formalize deterioration risk per the scenario definition. In that case, even a bullish sentiment reading can become lagging context rather than a tradable edge.
- What to monitor next: Any increase in volume on approaches to 70.9310.
- What to monitor next: Momentum repair signals—MACD histogram improving from -0.2972 and RSI lifting from 35.24.
- What to monitor next: Whether price continues to hold above 54.8488 on closes.
Sources referenced: Reuters, Bloomberg, Yahoo Finance, MarketWatch, Investing.com
Snapshot: AI Rank (Short–Mid–Long): Mixed (Bearish–Neutral–Not available) · Technical Confluence: Neutral · Key Levels: Support ~54.85 | Resistance ~70.93 · News Sentiment: Neutral
7) Sources
The full source list (including links) is available in the original dataset feed. Per editorial format, headline lists and outbound URLs are not reproduced in this section.
You may also like: How KGNAI AI ranks instruments across global markets
Disclaimer: KGNAI provides AI-generated analytics and educational market commentary only. This is not financial advice. Markets involve risk. Always do your own research.