
XP Inc (XP) — 18-Mar-2026 Technical Positioning Remains Weak Despite Positive News Tone
XP Inc (XP) screens as broadly weak on KGNAI’s cross-sectional ranking system as of 18-Mar-2026, with bearish positioning persisting across the short-, mid-, and long-horizon rank set. By contrast, the technical confluence composite sits Neutral, suggesting the sell-side pressure is present but not fully “maximally aligned” across all indicator groups. Momentum readings lean negative—RSI(14) at 37.91 and a MACD histogram of -0.0764 point to subdued trend impulse—while volatility is not extreme, with Bollinger bandwidth at 0.2392. Key decision zones remain clearly defined at support ~18.2618 and resistance ~22.4375, framing the tactical map for risk control. Meanwhile, the news layer tilts constructive with a normalized sentiment score of 1.00, creating a measurable sentiment–price tension that markets often resolve through confirmation at levels and follow-through in volume.
- Rank stance (Short / Mid / Long): Bearish / Bearish / Bearish (deep in the lower tier of the 2065-instrument universe).
- Technical confluence: Neutral (18-signal confluence -0.278; blended overall technical score -0.113).
- Key levels: Support ~18.2618; Resistance ~22.4375.
- News sentiment bias: Bullish (normalized 1.00; avg sentiment 0.180).
- Confirmation / invalidation condition: Acceptance above 22.4375 with volume would improve continuation odds; a close below 18.2618 increases deterioration risk.
KGNAI evaluates assets using large cross-sectional datasets built from millions of structured data points. Inputs incorporate fundamental metrics, technical structures, and systematically processed news sentiment. Statistical models, machine learning, and AI frameworks are used to assess relative positioning, signal alignment, and probabilistic behavior across broad universes.
- Ranks are comparative across the tracked universe, not absolute price targets.
- Confluence reflects alignment among independent signal groups.
- Support/resistance levels are probabilistic decision zones, not guarantees.
- Sentiment provides contextual bias within the broader analytical framework.
1) KGNAI AI Analysis
Region: USA
Total universe size: 2065 ranked instruments
- Daily rank: #1964 out of 2065 — Bearish
- Weekly rank: #2040 out of 2065 — Bearish
- Monthly rank: #2055 out of 2065 — Bearish
- 3-Monthly rank: #1881 out of 2065 — Bearish
- 6-Monthly rank: #1779 out of 2065 — Bearish
- Yearly rank: Not available for this horizon — Not available
XP’s rank profile is consistently positioned near the weakest end of the tracked universe. The daily rank (#1964), weekly rank (#2040), and monthly rank (#2055) cluster in the bottom tail, indicating that—relative to peers—XP currently exhibits characteristics associated with less favorable price behavior across multiple model tests.
The time-horizon shape is also informative: the 3-month rank (#1881) and 6-month rank (#1779) remain bearish, but the six-month reading is modestly less extreme than the monthly endpoint. That pattern can occur when the longer window still retains earlier strength while shorter windows reflect more recent deterioration, or when dispersion across factors increases. In either case, the message is not “one bad print,” but a persistent cross-sectional deficit.
A key discipline point: the universe is large (2065 instruments), so small changes in rank can be noise; the signal here is the consistency of bearish placement across horizons rather than any single rank number. The absence of a yearly rank is also a limitation for regime-level assessment and is therefore Not available in the provided data.
Term view: Short-term: Bearish. Mid-term: Bearish. Long-term: Bearish.
Want the full universe and complete rank tables? Unlock full access on KGNAI: https://www.kgnai.com/pricing
2) Price & trend overview
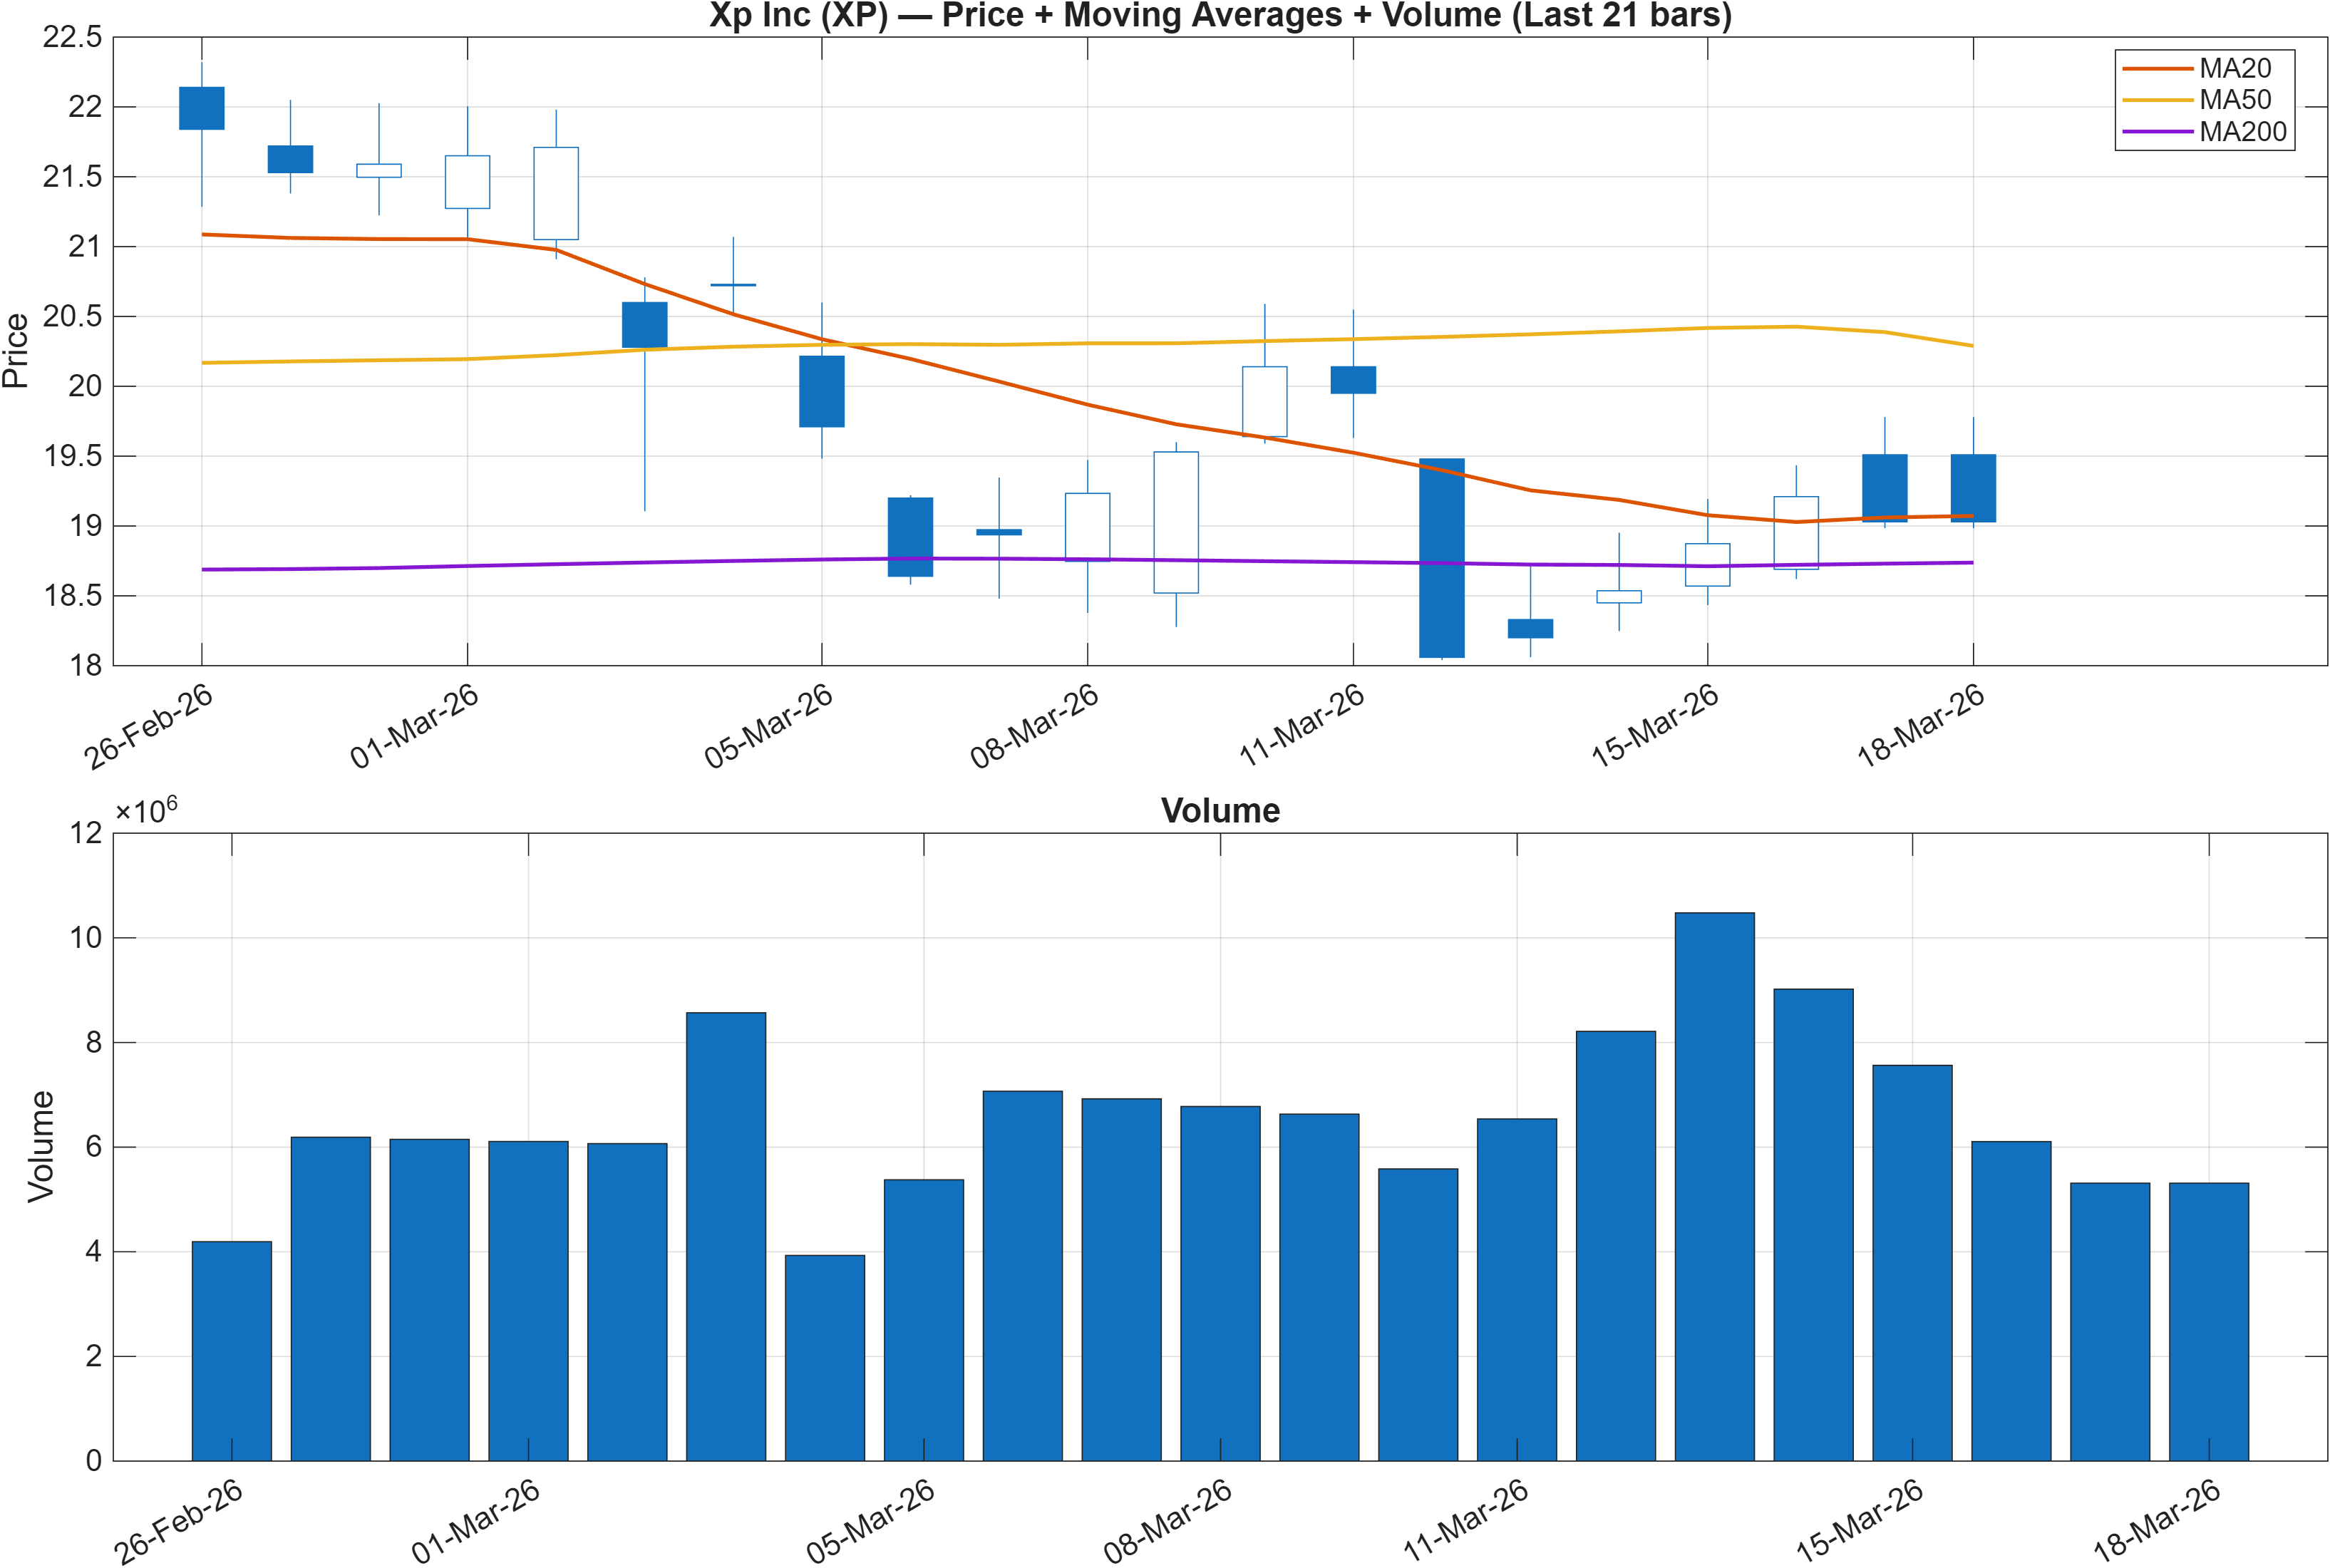
Interpretation: Close vs MA50 = Bearish, MA50 vs MA200 = Bullish.
Trend state: short-term pressure within a longer-term structure
The moving-average configuration is mixed, and that mix matters for regime interpretation. The close below the MA50 (bearish) signals that the nearer-term trend has lost traction, consistent with the weak short-horizon ranks. At the same time, MA50 above MA200 (bullish) indicates the longer-term moving-average structure has not fully inverted, which can correspond to a market that is correcting within a broader up-cycle rather than transitioning into a fully developed downtrend.
This is a classic alignment-versus-divergence setup: short-horizon weakness is evident, yet the longer moving-average relationship suggests the market still retains residual structural support. When this divergence persists, price often becomes more sensitive to nearby levels and incremental changes in participation. That sensitivity is reinforced by the volatility context from the indicator suite (bandwidth 0.2392), which implies movement is meaningful but not “disorderly.”
Practically, the chart should be read as a tug-of-war between mean reversion back toward the MA50 and the possibility that repeated failures below the MA50 eventually pull the MA50 down toward the MA200. The next phase is typically defined less by narratives and more by whether subsequent rebounds can sustain above trend proxies while momentum (RSI, MACD) stabilizes.
3) Momentum & volatility dashboard
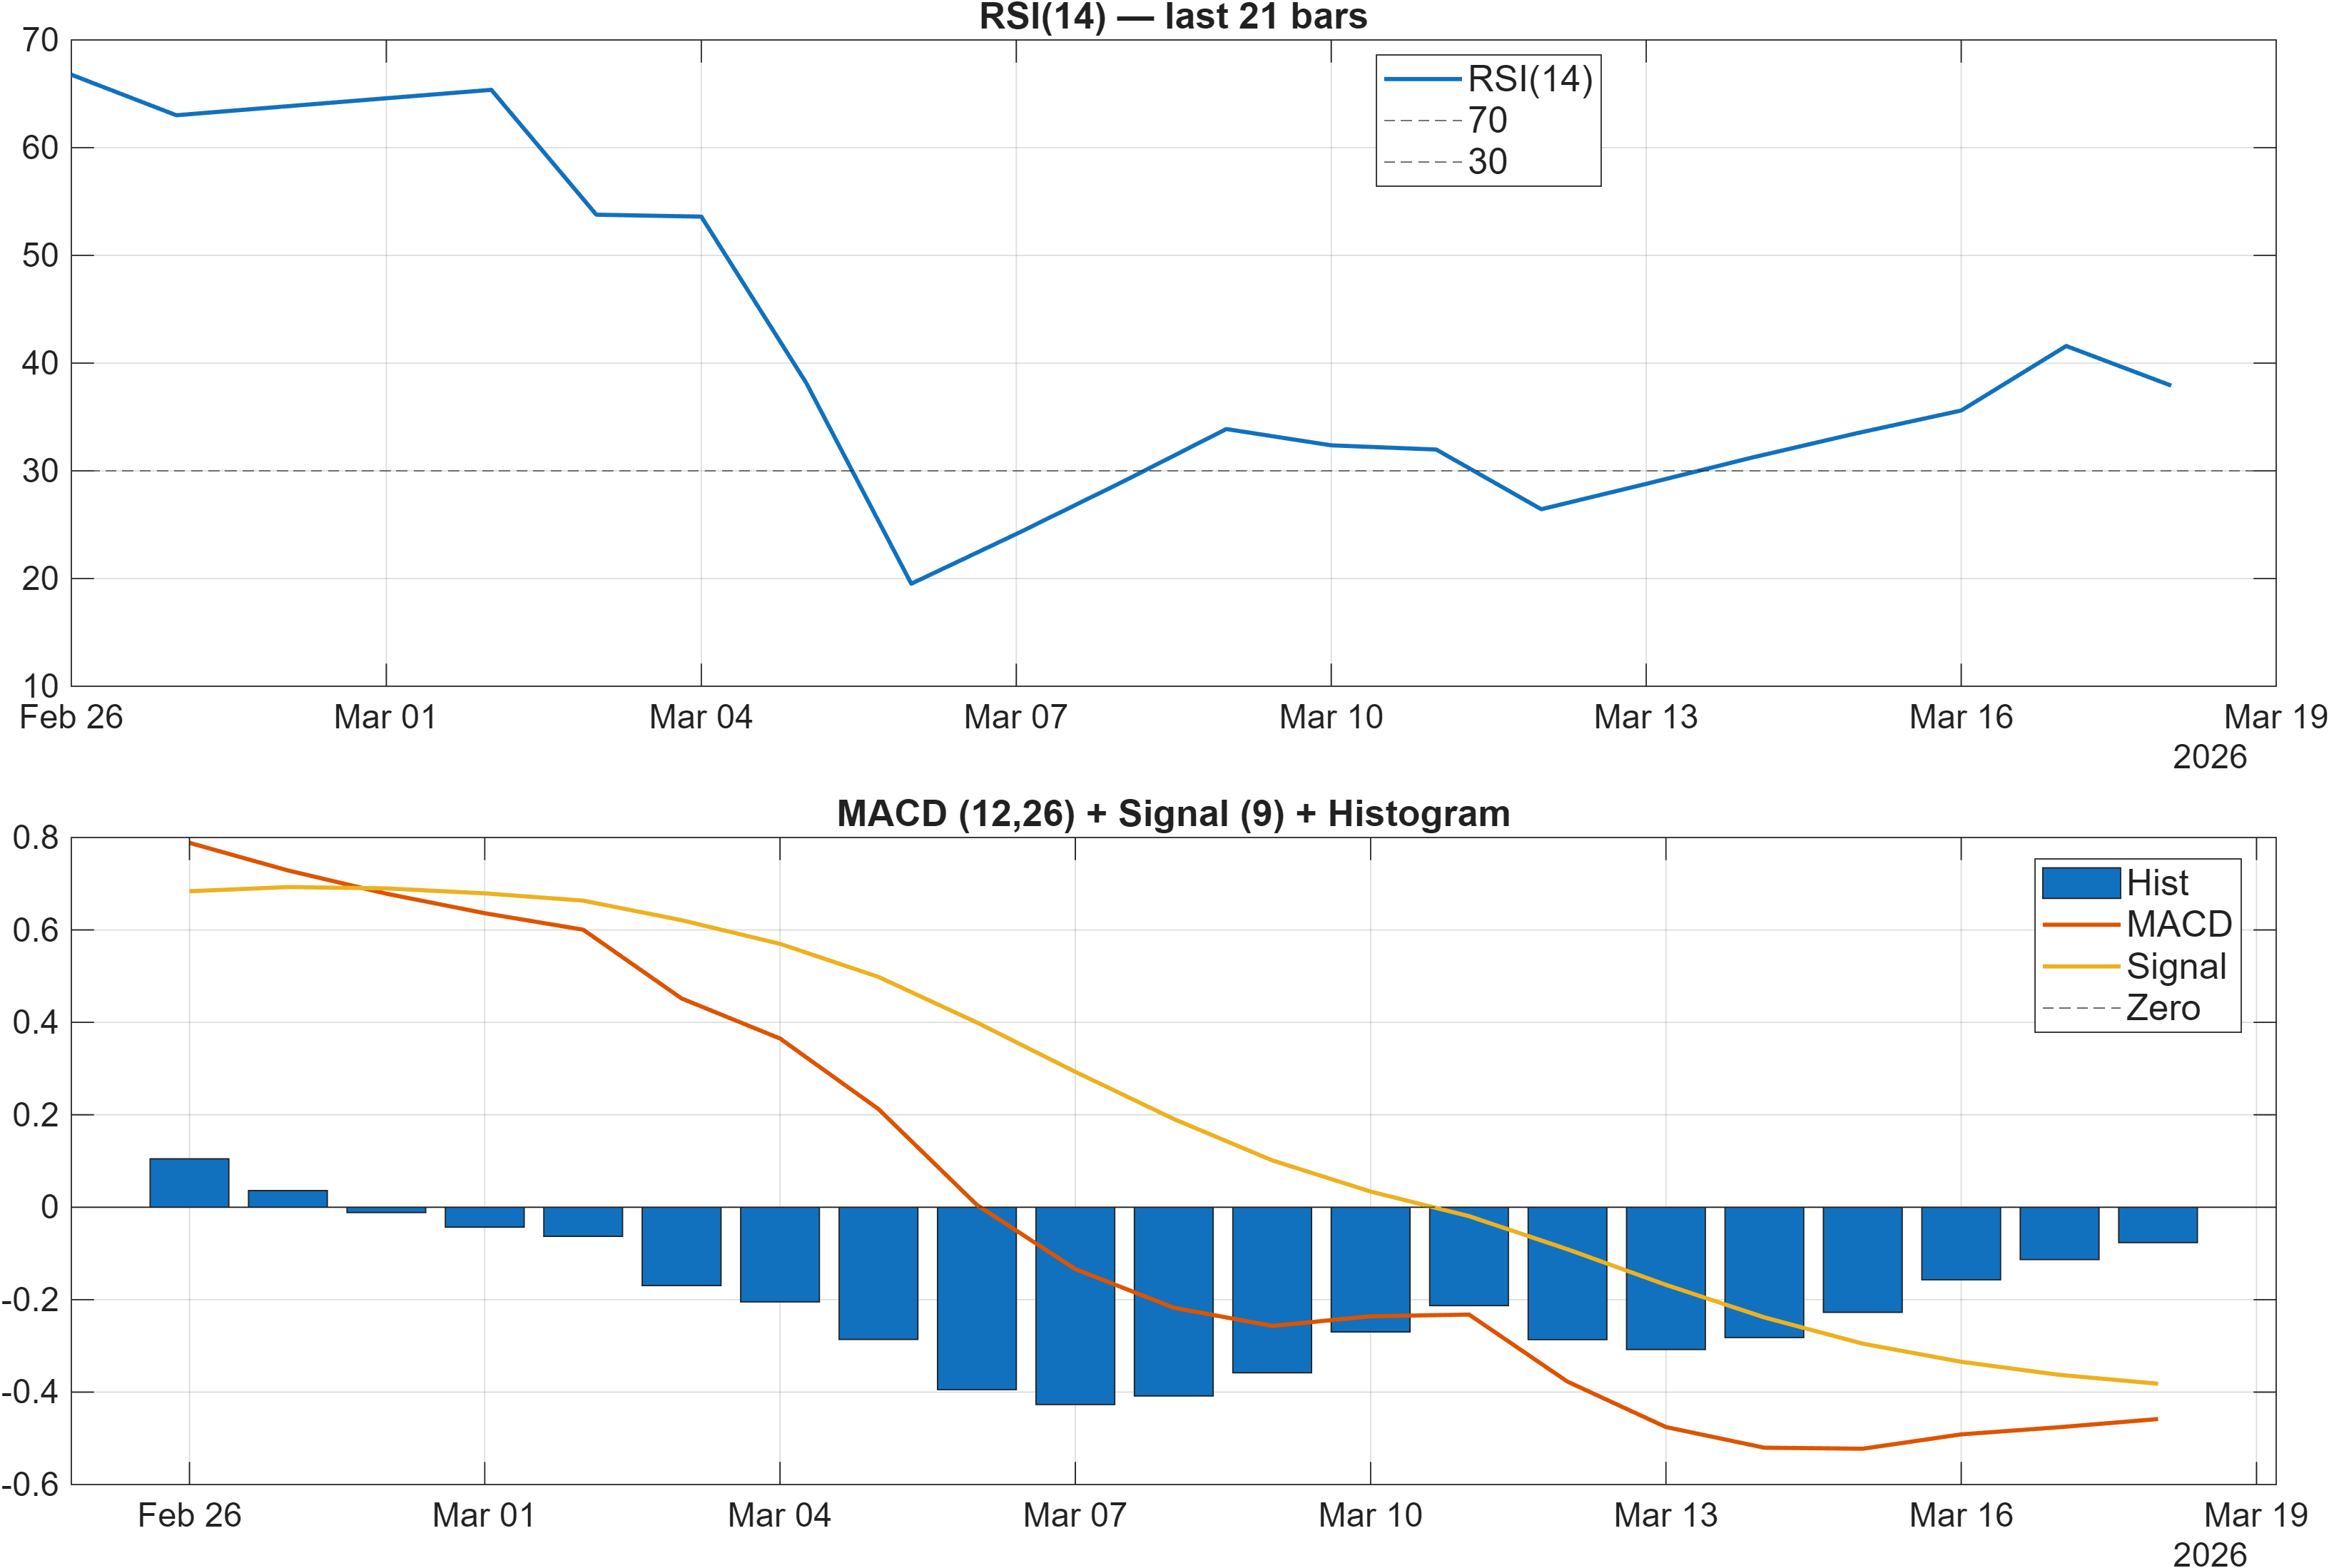
Interpretation: RSI bias = Bearish, MACD hist = -0.0764.
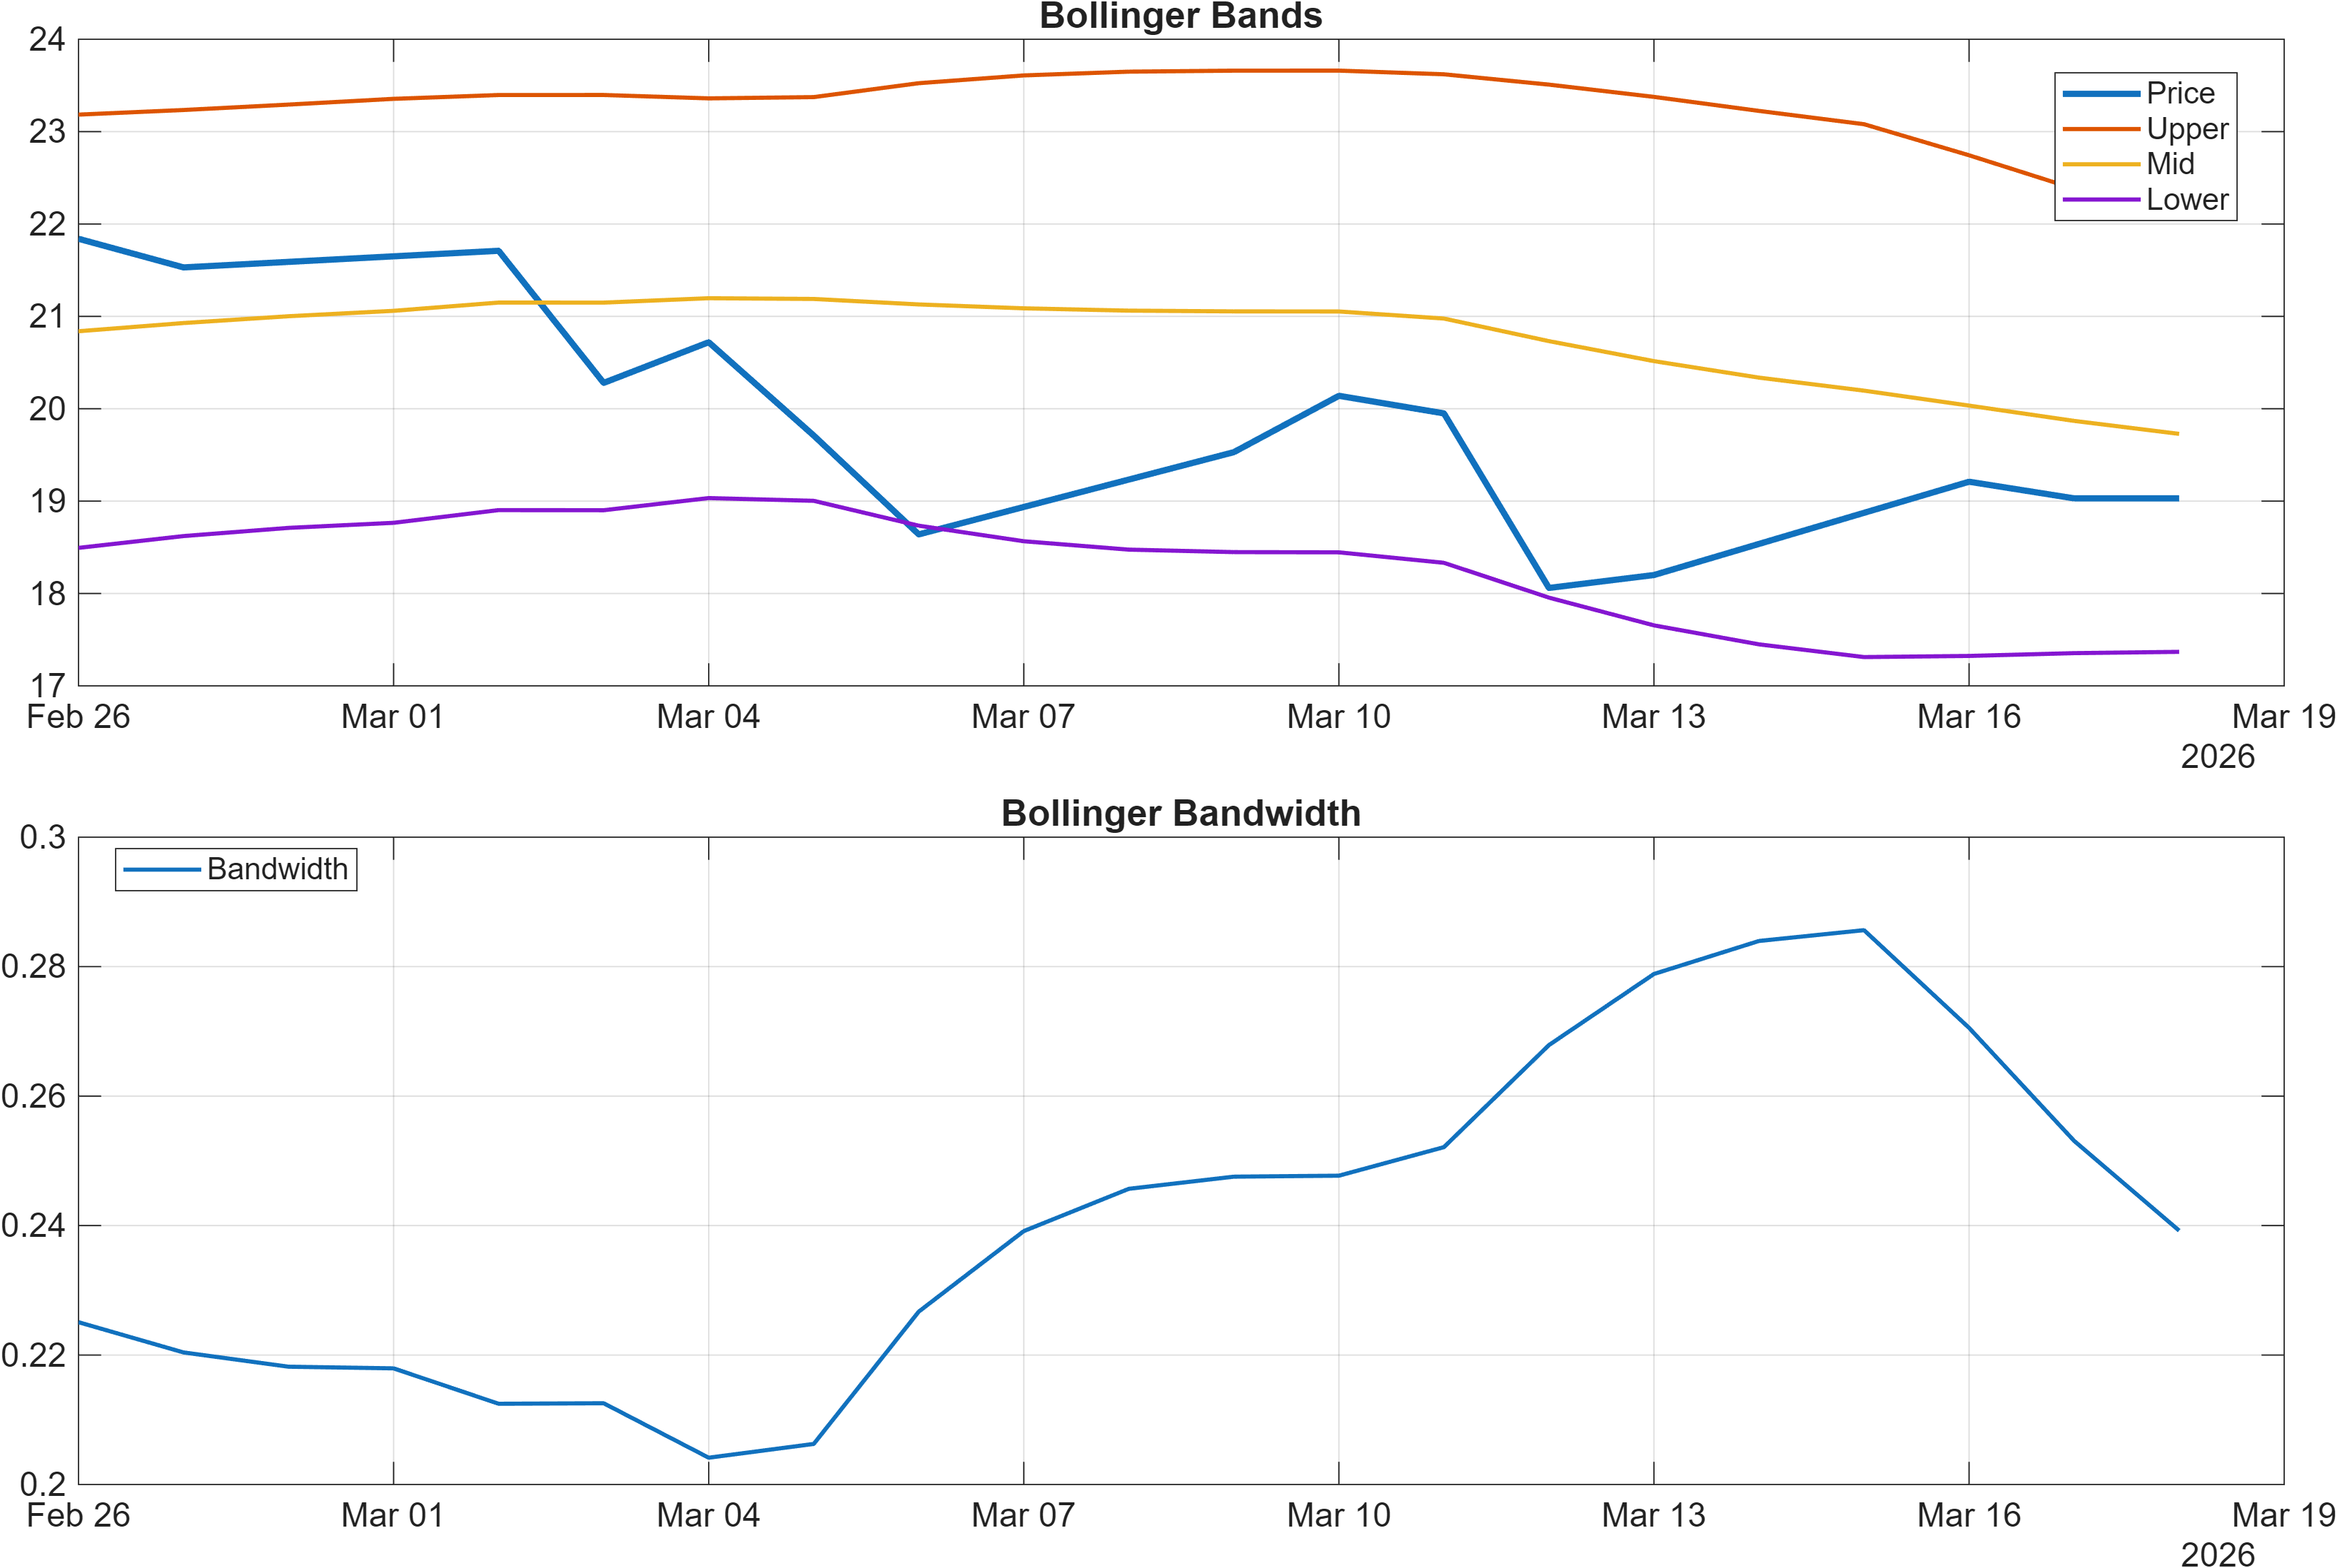
Interpretation: Bandwidth (volatility regime) latest = 0.2392.
Momentum: negative impulse without capitulation
Momentum signals lean bearish with limited ambiguity. The dashboard flags a bearish RSI bias, and the signal table quantifies RSI(14) at 37.91, a level consistent with weak demand and reduced upside follow-through. The MACD histogram at -0.0764 reinforces that downside impulse remains present; importantly, MACD weakness often persists even as price attempts to stabilize, so it is best treated as a “trend pressure” measure rather than a timing trigger.
Volatility regime: room for trend continuation, but not a shock state
Volatility, as proxied by Bollinger bandwidth at 0.2392, is elevated enough to support directional movement, yet it does not read as a volatility shock in isolation. That combination—bearish momentum with a moderate volatility envelope—often describes a market that can continue to grind lower or chop with downward bias rather than snap immediately into a sharp reversal.
Compression vs expansion risk
With momentum negative and volatility not extreme, a key tactical risk is a volatility expansion that arrives after a failed bounce. If bandwidth begins widening while MACD remains negative, downside can accelerate. Conversely, stabilization usually shows up as a less negative MACD histogram alongside RSI recovering from the high-30s toward more neutral territory, with volatility not expanding materially.
4) Support / Resistance zones
Support ~ 18.2618 | Resistance ~ 22.4375
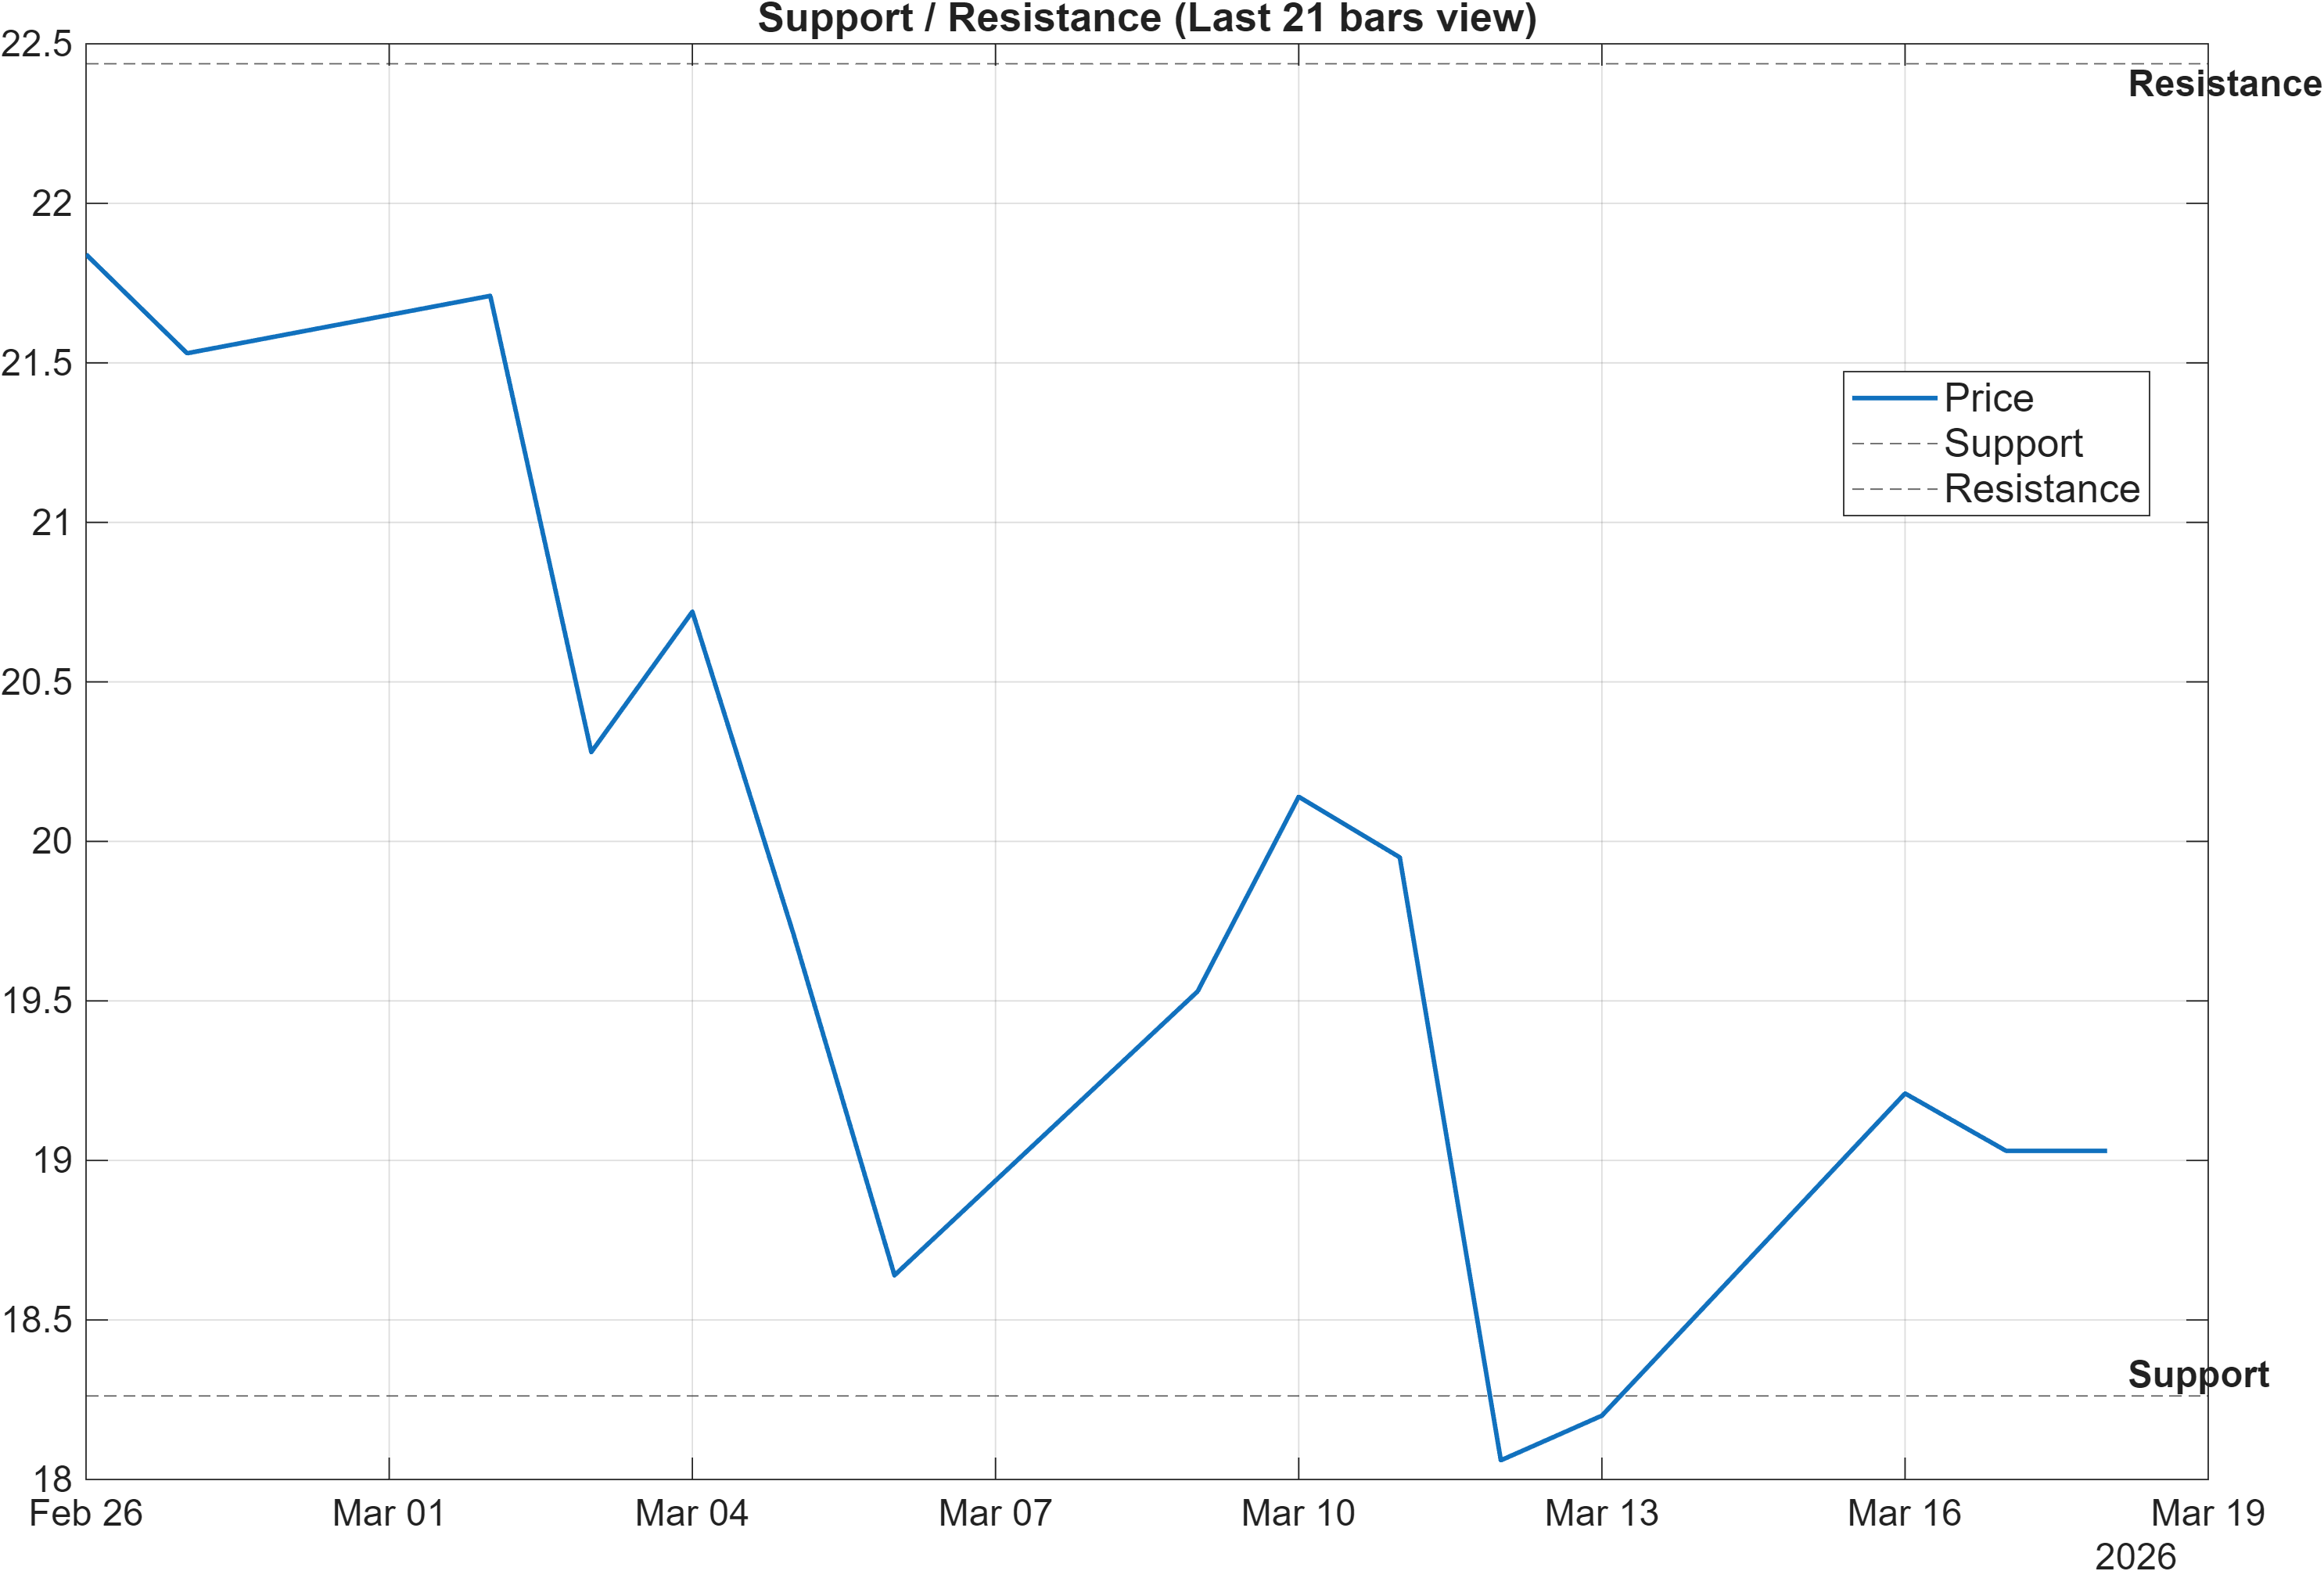
Scenario view: Break above resistance with volume → continuation. Close below support → signal deterioration risk.
Decision zones: mapping confirmation vs invalidation
The support/resistance framework is unusually clean: 18.2618 defines the downside decision zone, while 22.4375 caps the upside. With short-horizon ranks deeply bearish and momentum weak (RSI 37.91; MACD histogram -0.0764), the analytic burden shifts to whether price can prove acceptance above resistance rather than merely touch it intraday.
From a market-structure standpoint, the more times price probes a level, the more informative the reaction becomes. A close below 18.2618 would represent deterioration not because support “must hold,” but because it would align the level break with an already bearish momentum stack. In that case, volatility (bandwidth 0.2392) becomes important: if bandwidth expands during a breakdown, the move tends to be more trend-like; if bandwidth stays contained, the risk shifts toward whipsaw.
On the upside, the stated scenario—break above 22.4375 with volume—functions as a confirmation filter. It would also help reconcile the current sentiment backdrop (news normalized at 1.00) with price behavior by requiring the market to “pay” for optimism through sustained participation. Until then, resistance should be treated as an area where rallies can stall and where positioning risk may concentrate.
5) Quant Technical Dashboard (18 Signals)
KGNAI AI Technical Analysis Score (Deep Reinforcement Learning): Rank #751 out of 2065 (Rank 1 represents the strongest technical positioning and a higher probability of favorable price behavior. As ranks increase toward the maximum, the probability of favorable outcomes weakens and bearish positioning becomes more dominant.) | Label: Neutral | Score: 0.273
18-Signal Technical Confluence Score: -0.278 (Neutral)
Overall Technical Score (18-signal confluence + DRL rank blend): -0.113 (Neutral)
Note: The blended score reflects signal strength weighted against broader AI technical ranking, which may temporarily diverge.
Blended technical score breakdown: -0.113 (Neutral | Bull 4 / Bear 9 / Neutral 5)
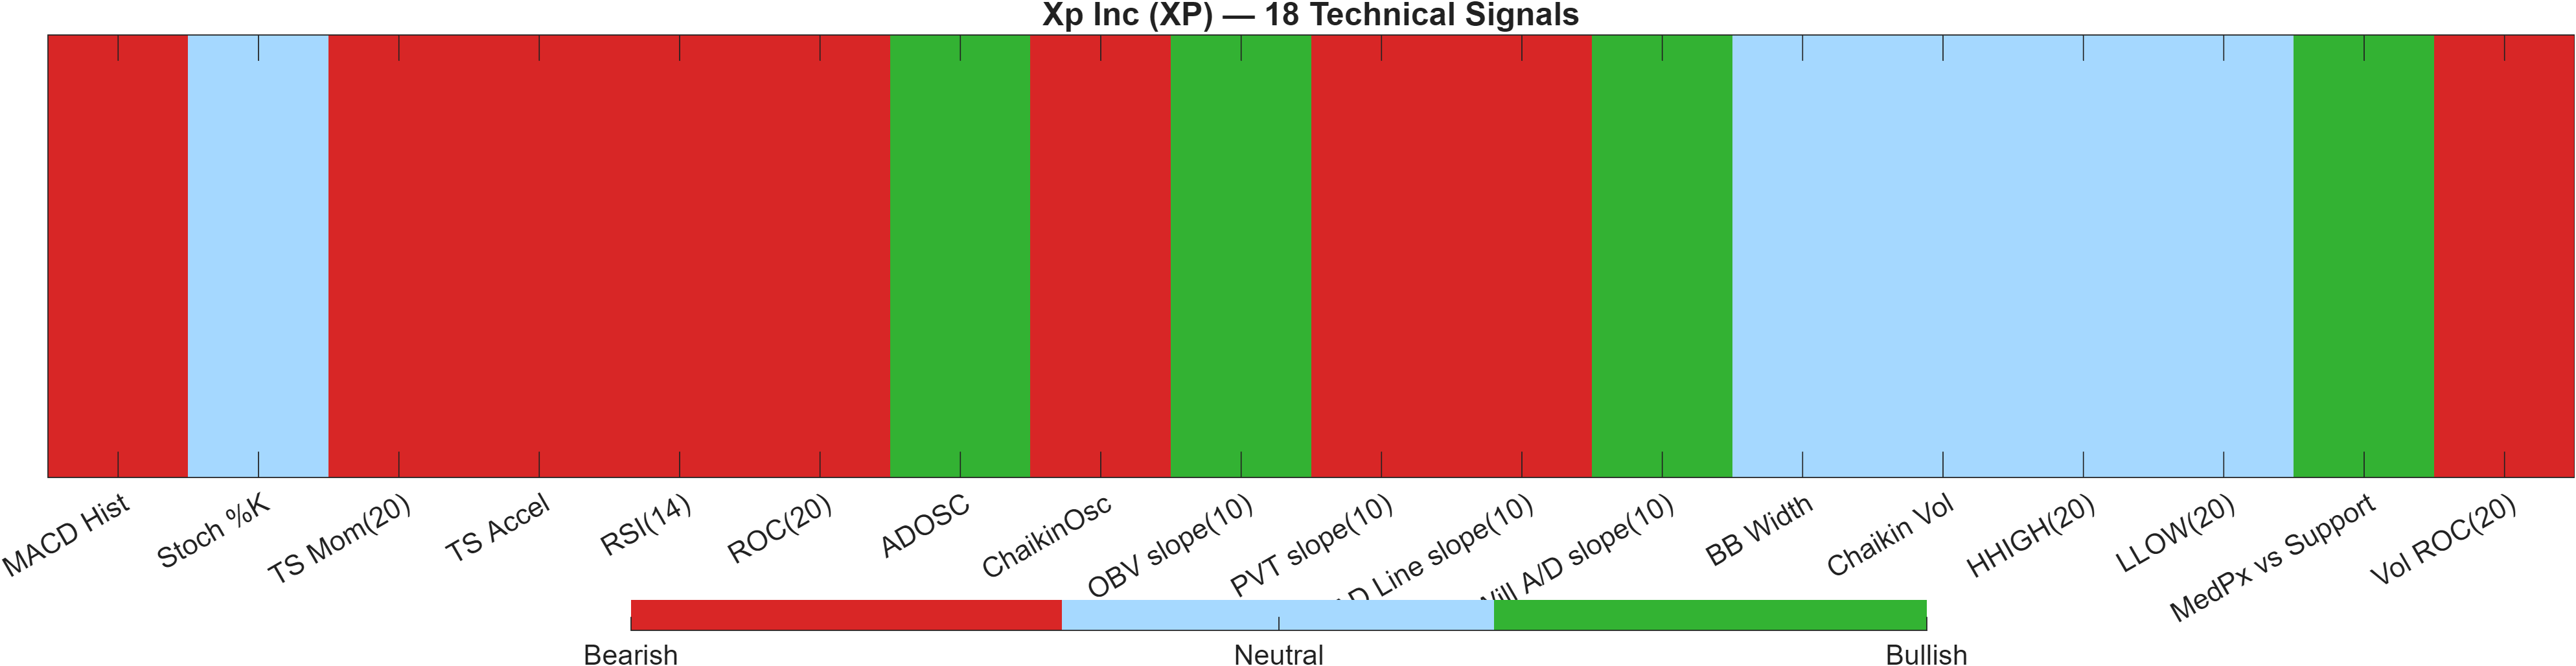
Signal alignment: bearish breadth with neutral aggregation
The technical layer is best described as bearish breadth without a fully bearish composite. The confluence score is -0.278 (Neutral) and the blended overall technical score is -0.113 (Neutral), even though the breakdown shows Bear 9 versus Bull 4. This can happen when bearish signals are present but not uniformly “high-conviction,” or when a subset of indicators offsets the directional message enough to prevent an outright bearish label.
The DRL technical rank at #751 out of 2065 (Neutral, score 0.273) sits closer to the mid-pack than the cross-sectional price-behavior ranks in Section 1. That divergence is analytically useful: it suggests the indicator structure is not as weak as the broader rank system implies, raising the possibility that the market is in a transition phase where the tape is soft but some micro-structure measures are stabilizing.
Where the weakness concentrates
Momentum and rate-of-change measures skew negative (e.g., RSI(14) 37.91, ROC(20) -11.61, and TS Mom(20) -2.5), which tends to suppress rally durability. Volume-related signals are mixed: OBV slope(10) is bullish while Vol ROC(20) -14.19 is bearish, consistent with uneven participation rather than broad accumulation.
Implication: neutral score does not negate bearish risk
In this setup, “Neutral” functions as a warning against overconfidence in either direction. With support at 18.2618 and resistance at 22.4375, the highest-quality confirmation generally comes from level acceptance plus improvement in the bearish momentum cluster rather than from the composite label alone.
Signal table (Bull/Bear/Neutral)
| Indicator | Value | Signal |
|---|---|---|
| MACD Hist | -0.07643 | Bearish |
| Stoch %K | 38.82 | Neutral |
| TS Mom(20) | -2.5 | Bearish |
| TS Accel | -3.913 | Bearish |
| RSI(14) | 37.91 | Bearish |
| ROC(20) | -11.61 | Bearish |
| ADOSC | 19.81 | Bullish |
| ChaikinOsc | -5.39e+06 | Bearish |
| OBV slope(10) | 2.532e+07 | Bullish |
| PVT slope(10) | -1.183e+05 | Bearish |
| AD Line slope(10) | -1.657e+07 | Bearish |
| Will A/D slope(10) | 0.1299 | Bullish |
| BB Width | 0.2392 | Neutral |
| Chaikin Vol | -17.12 | Neutral |
| HHIGH(20) | 22.05 | Neutral |
| LLOW(20) | 18.04 | Neutral |
| MedPx vs Support | 1.121 | Bullish |
| Vol ROC(20) | -14.19 | Bearish |
Interpretation: Indicator-level signals form the base confluence, which is then adjusted using a separate AI-driven technical ranking model. The final technical score summarizes this combined view.
6) News sentiment + extractive gist
Sentiment score (avg): 0.180 | Positive: 42% | Neutral: 58% | Negative: 0%
KGNAI AI News Sentiment Score (normalized -1 to +1): 1.00 (as of 2026-03-17) | Label: Bullish | Overall news score: 0.99
Positive Developments
Recent coverage across major financial outlets indicates a constructive tone around XP, driven largely by screening-based features and positioning narratives. The sentiment mix shows 42% positive and 0% negative, and KGNAI’s normalized sentiment registers at 1.00 (overall news score 0.99). In aggregate, the news flow reads as “supportive context” rather than a single dominant catalyst. This matters because it can reduce headline risk in the near term and improve the odds of orderly price discovery around well-defined technical levels. However, the current market state remains a sentiment–tape mismatch: ranks remain bearish across horizons while news bias is positive. In these conditions, the highest-quality signal tends to be whether price can translate constructive attention into sustained follow-through above resistance rather than brief intraday strength.
Neutral / Mixed Developments
A portion of the coverage is best characterized as informational and comparative—framing XP relative to other tickers, value factors, or broader market discussions. This type of flow can coincide with a 58% neutral classification even when the overall sentiment score remains positive (0.180 average). Neutral coverage often amplifies existing technical behavior rather than changing it: if the chart is weak, informational pieces can accompany continued drift; if the chart stabilizes, the same content can reinforce a base-building phase. Given the current indicator stack (e.g., RSI(14) 37.91 and MACD histogram -0.0764), neutral news is unlikely to dominate price action unless it coincides with a technical confirmation at key levels.
Negative / Risk Signals
Even with 0% negative in the sentiment classification, risk still appears through framing: repeated discussions of pullbacks, valuation sensitivity, and “better value option” comparisons can function as a soft headwind when momentum is already weak. The market’s risk is not necessarily a surge in negative headlines; it is that constructive coverage fails to lift price while bearish ranks persist (e.g., monthly rank #2055). That pattern can indicate that positioning and liquidity dynamics are dominating narrative effects. With support at 18.2618, the key risk signal is technical: a loss of that level would align bearish momentum, weak cross-sectional ranks, and a failure of sentiment to translate into price resilience.
- What to monitor next: Whether price can sustain above 22.4375 with improving momentum (RSI rising from 37.91).
- What to monitor next: Any volatility expansion from bandwidth 0.2392 during a retest of 18.2618.
- What to monitor next: Whether indicator breadth improves beyond the current Bull 4 / Bear 9 / Neutral 5 split.
Sources referenced: Reuters, Bloomberg, Yahoo Finance, MarketWatch, Investing.com
Snapshot: AI Rank (Short–Mid–Long): Bearish (Bearish–Bearish–Bearish) · Technical Confluence: Neutral · Key Levels: Support ~18.26 | Resistance ~22.44 · News Sentiment: Positive
7) Sources
Source URLs are not reproduced in this publication layout. The original draft included multiple syndicated finance items; the consolidated sources line is provided in Section 6.
You may also like: How KGNAI AI ranks instruments across global markets
Disclaimer: KGNAI provides AI-generated analytics and educational market commentary only. This is not financial advice. Markets involve risk. Always do your own research.