
PLMR (Palomar Holdings Inc) — 22-Mar-2026 Neutral stance with short-term stress vs mid-term rank strength
Palomar Holdings Inc (PLMR) enters 22-Mar-2026 with a measurable split between rank-based relative positioning and current chart pressure. Across a 2065-instrument universe, PLMR’s Monthly and 3-Month ranks sit near the top of the distribution (#26 and #21), while the longer lens remains less supportive (Yearly #1316). Technically, the blended 18-signal + DRL framework is Neutral (overall technical score 0.147), but several momentum gauges lean risk-off, including a deeply depressed RSI(14) at 14.81 and a negative MACD histogram of -0.3950. Volatility is not extreme, with Bollinger bandwidth at 0.1178, suggesting pressure may be more directional than chaotic. Key decision zones are well-defined: support ~117.2650 and resistance ~133.6075. News sentiment remains constructive (avg sentiment 0.225; normalized score 0.99), creating a noteworthy sentiment/price tension to monitor.
- Rank stance: Short Neutral · Mid Bullish · Long Neutral
- Technical confluence: Neutral (18-signal confluence -0.111; blended technical 0.147)
- Key levels: Support 117.2650 · Resistance 133.6075
- News sentiment bias: Positive (avg 0.225; normalized 0.99)
- Confirmation / invalidation: A sustained break above 133.6075 with volume supports continuation; a close below 117.2650 increases deterioration risk.
What KGNAI Measures
KGNAI evaluates assets using large cross-sectional datasets built from millions of structured data points. Inputs incorporate fundamental metrics, technical structures, and systematically processed news sentiment. Statistical models, machine learning, and AI frameworks are used to assess relative positioning, signal alignment, and probabilistic behavior across broad universes.
How to Read This Report
- Ranks are comparative across the tracked universe, not absolute price targets.
- Confluence reflects alignment among independent signal groups.
- Support/resistance levels are probabilistic decision zones, not guarantees.
- Sentiment provides contextual bias within the broader analytical framework.
1) KGNAI AI Analysis
Region: USA
Total universe size: 2065 ranked instruments
- Daily rank: #122 out of 2065 — Bullish
- Weekly rank: #475 out of 2065 — Neutral
- Monthly rank: #26 out of 2065 — Bullish
- 3-Monthly rank: #21 out of 2065 — Bullish
- 6-Monthly rank: #975 out of 2065 — Neutral
- Yearly rank: #1316 out of 2065 — Neutral
PLMR’s rank profile is best described as timeframe-fragmented. The short horizon is constructive (Daily #122), but the weekly view sits closer to the middle of the universe (#475), implying that near-term strength has not fully translated into stable intermediate leadership. The strongest evidence of relative positioning appears in the mid-term cluster: the Monthly (#26) and 3-Month (#21) ranks are firmly in the top portion of the 2065-name universe, which typically aligns with favorable cross-sectional behavior versus peers.
The longer arc is less supportive. A 6-Month rank of #975 and Yearly rank of #1316 place PLMR in the broader middle-to-lower range, consistent with a market that has not rewarded the name with sustained trend leadership over the full year. This mix is coherent with the stated term view: Short-term Neutral, Mid-term Bullish, Long-term Neutral. In practical portfolio terms, this structure often behaves like a mean-reversion vs trend debate: the mid-term signal argues for relative resilience, while the long-term ranks caution that any rebound attempts may face overhead supply.
The most decision-relevant takeaway is not any single rank, but the spread across horizons. When Monthly/3-Month strength coexists with weaker Yearly positioning, confirmation usually comes from price structure improving (e.g., reclaiming key moving averages) rather than from ranks alone. Conversely, if price fails at known resistance while longer-term ranks remain muted, the mid-term advantage can compress quickly back toward the pack.
KGNAI ranks each instrument across large universes using multiple proprietary AI tests and statistical models (millions of data points). Lower ranks generally indicate stronger probability of favorable performance behavior, while higher ranks indicate weaker probability and more bearish positioning.
Term view: Short-term: Neutral. Mid-term: Bullish. Long-term: Neutral.
Want the full universe and complete rank tables? Unlock full access on KGNAI: https://www.kgnai.com/pricing
2) Price & trend overview
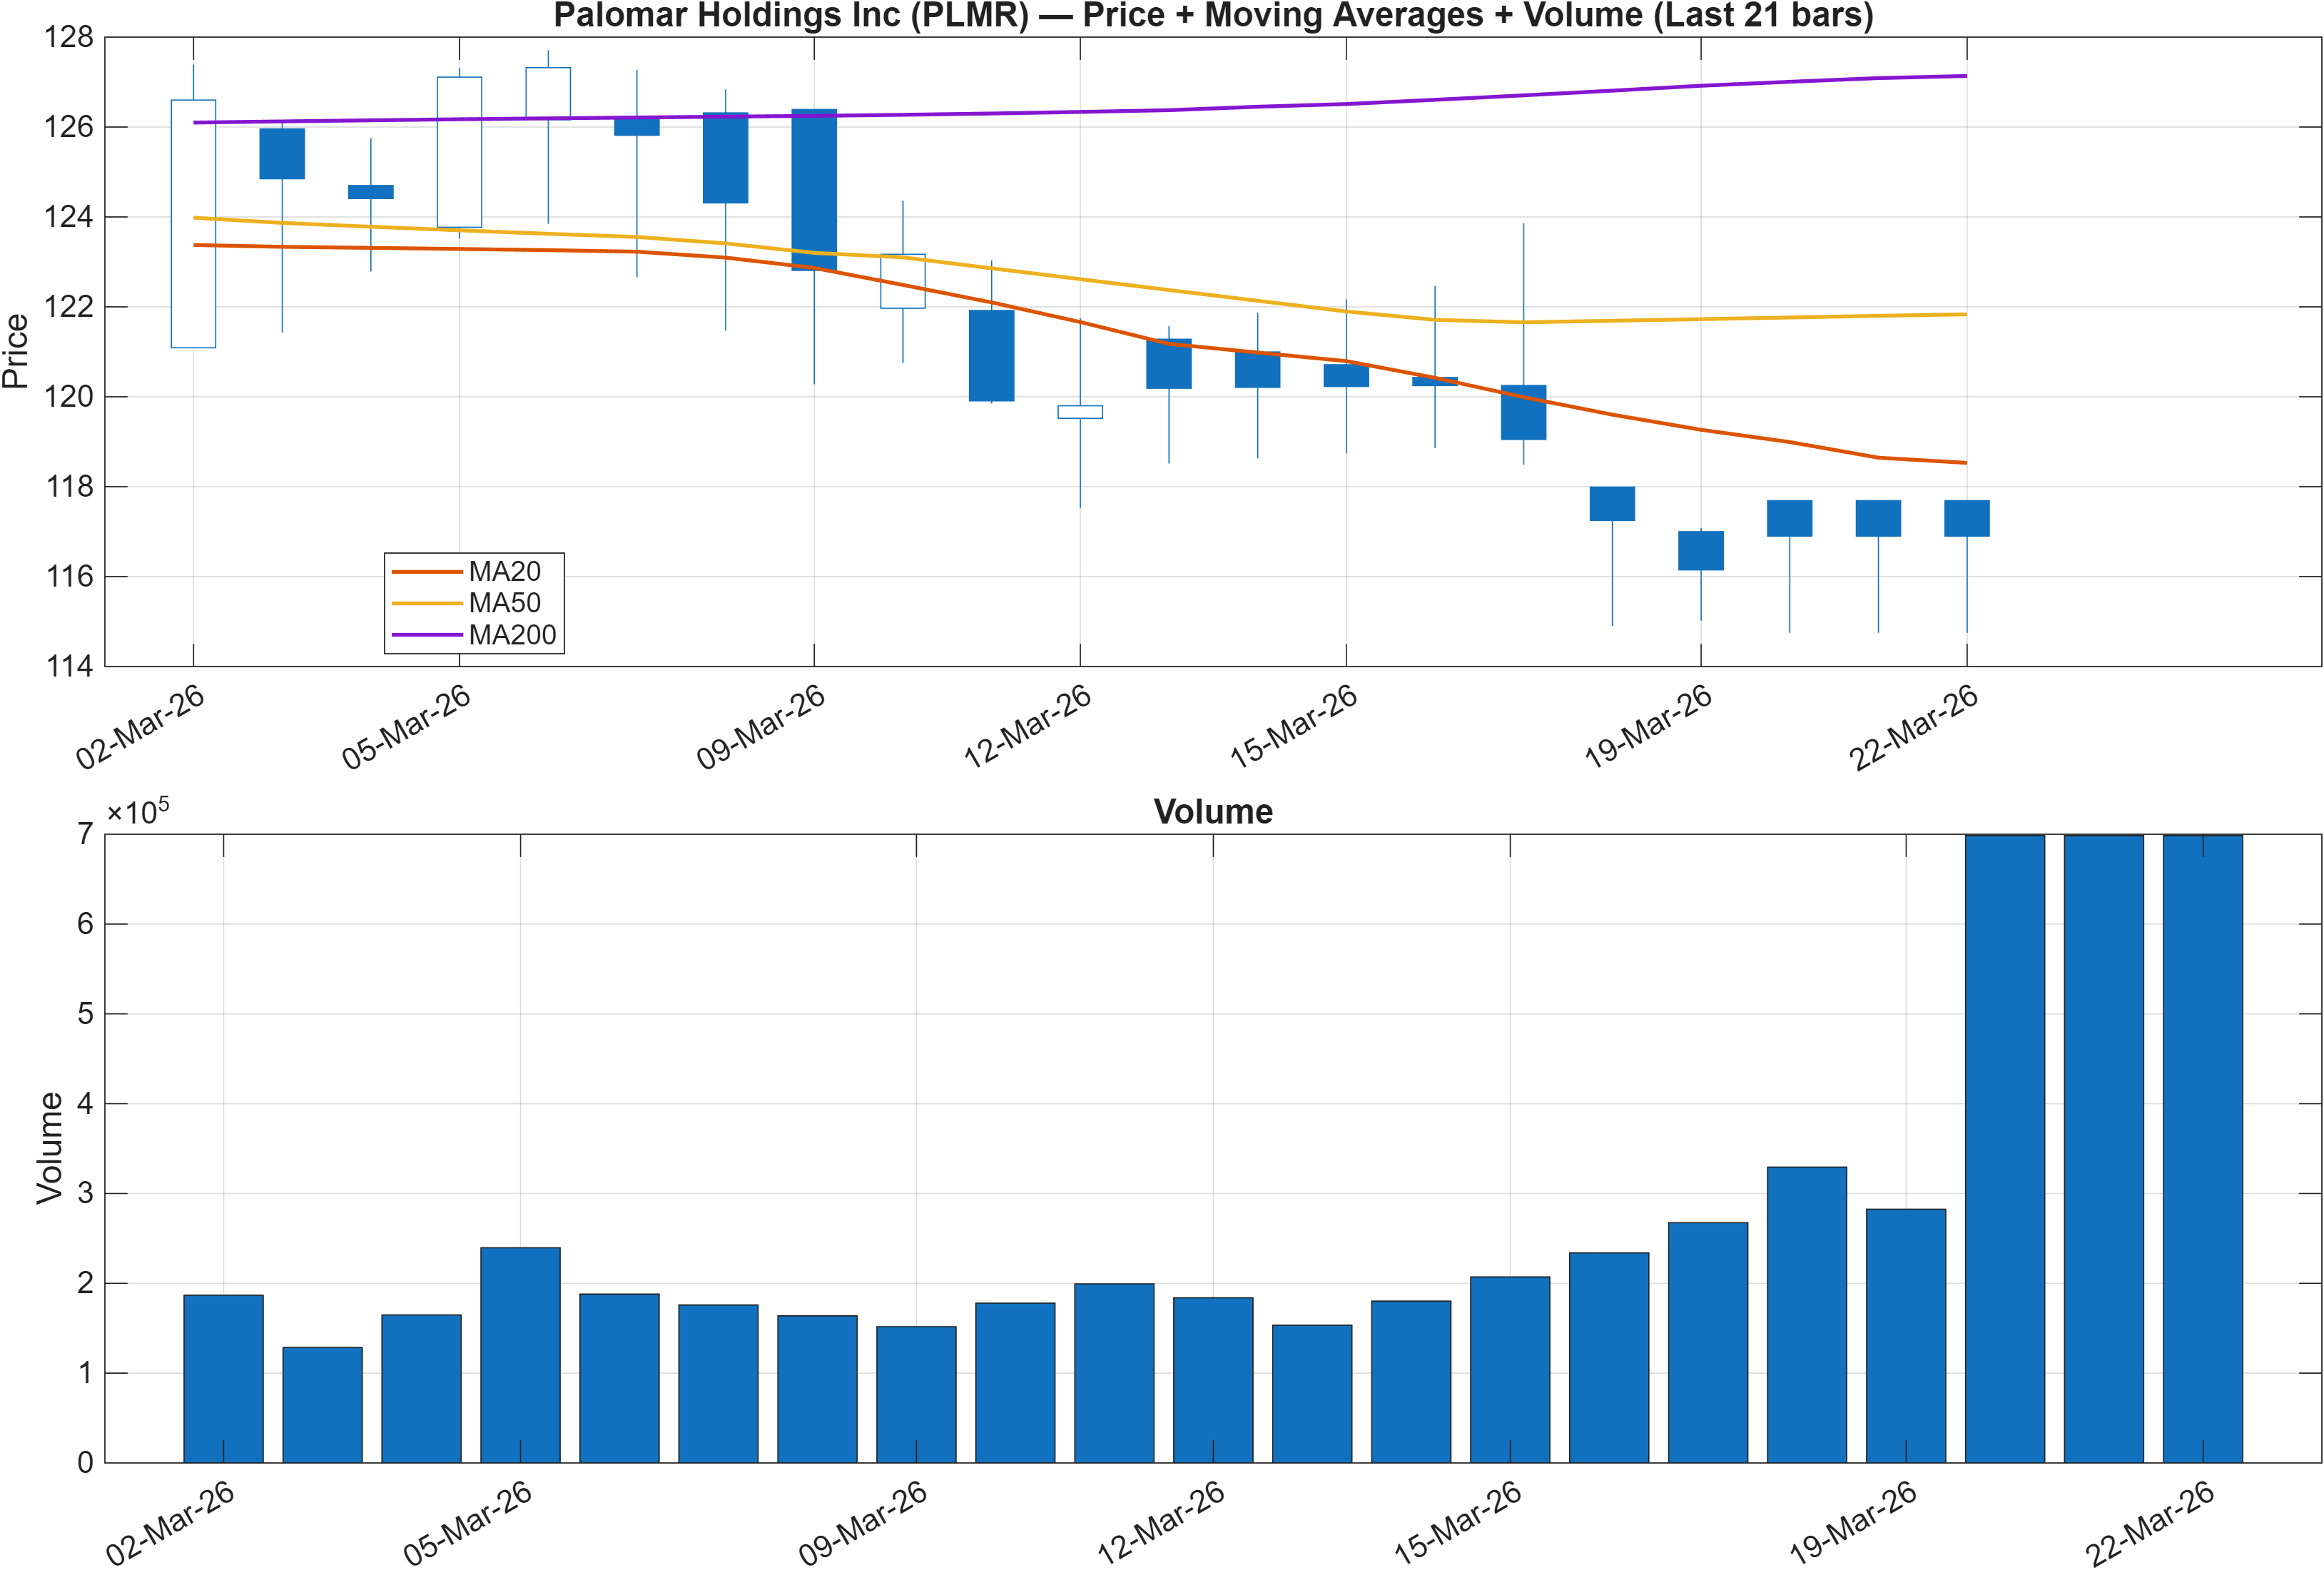
The trend layer is currently defined by moving-average headwinds. The snapshot flags Close vs MA50 as Bearish, and MA50 vs MA200 as Bearish. Together, that combination typically reflects a regime where rallies must prove themselves quickly; absent follow-through, they tend to fade near dynamic resistance created by declining averages.
This is where PLMR’s rank strength over the Monthly and 3-Month windows becomes analytically interesting: the cross-sectional model suggests comparatively favorable behavior, yet the trend template remains pressured. That divergence often produces range-like action until a catalyst (flow, earnings digestion, or volatility expansion) forces resolution. The market is effectively asking whether the asset can re-attach to its MA50 while also improving the MA50/MA200 relationship.
Volume context matters because moving-average breaks without participation frequently fail. While the locked chart provides the visual, the scenario framework later emphasizes “break above resistance with volume → continuation.” That is consistent with a trend structure that needs confirmation through demand rather than incremental drift. From a market-structure perspective, the most actionable observation is that the trend is not yet aligned with the mid-term rank cluster; the burden of proof stays on price to reclaim key reference levels before the rank advantage can express more cleanly.
Interpretation: Close vs MA50 = Bearish, MA50 vs MA200 = Bearish.
3) Momentum & volatility dashboard
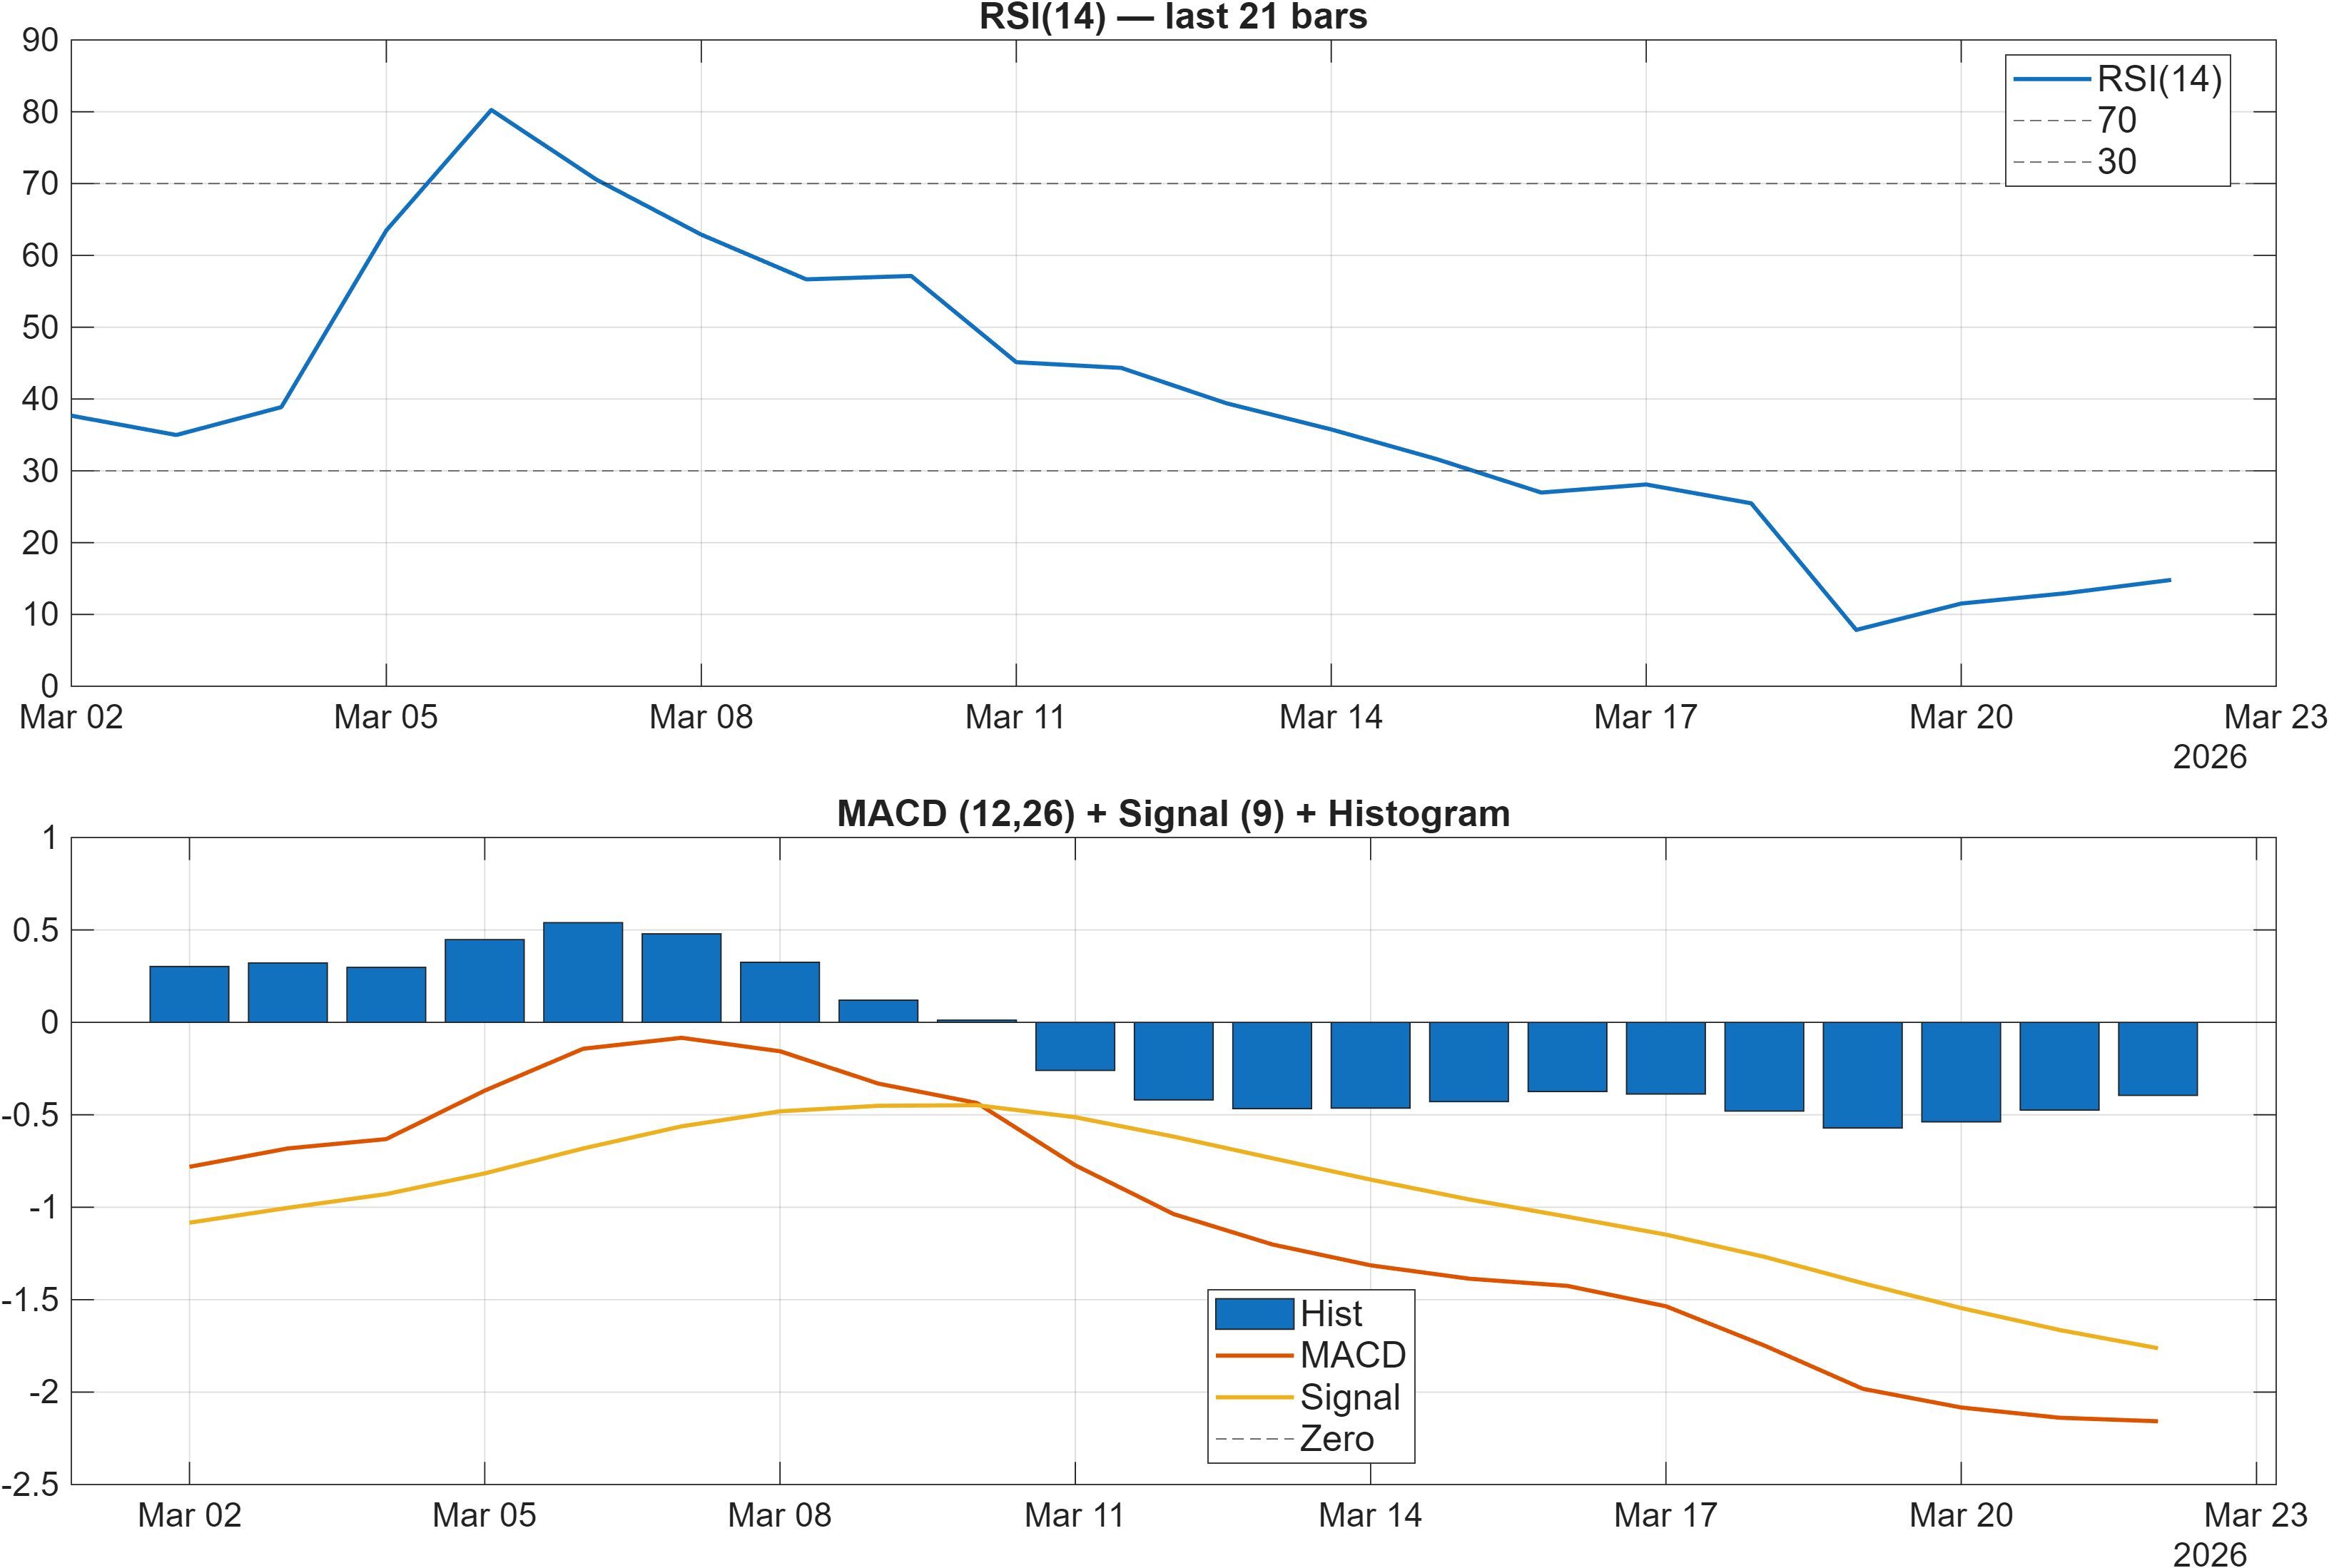
Momentum is presently skewed toward exhaustion-risk rather than trend confirmation. RSI bias is labeled Bearish, with RSI(14) at 14.81 in the signal table—an extreme reading that commonly accompanies sharp selloffs or capitulation-like pressure. Extreme RSI can be consistent with rebound attempts, but it is not, by itself, a durable buy condition without stabilization in price structure and breadth/volume participation.
MACD corroborates weak impulse: the MACD histogram is -0.3950 (also listed as -0.395), keeping the short-to-intermediate momentum slope negative. In this configuration, rallies often behave like countertrend moves until MACD compression and crossover dynamics improve. The time-series momentum measures reinforce that tone (TS Mom(20) -7.95 and TS Accel -5.79), highlighting that the recent path-dependence has been unfavorable and still decelerating.
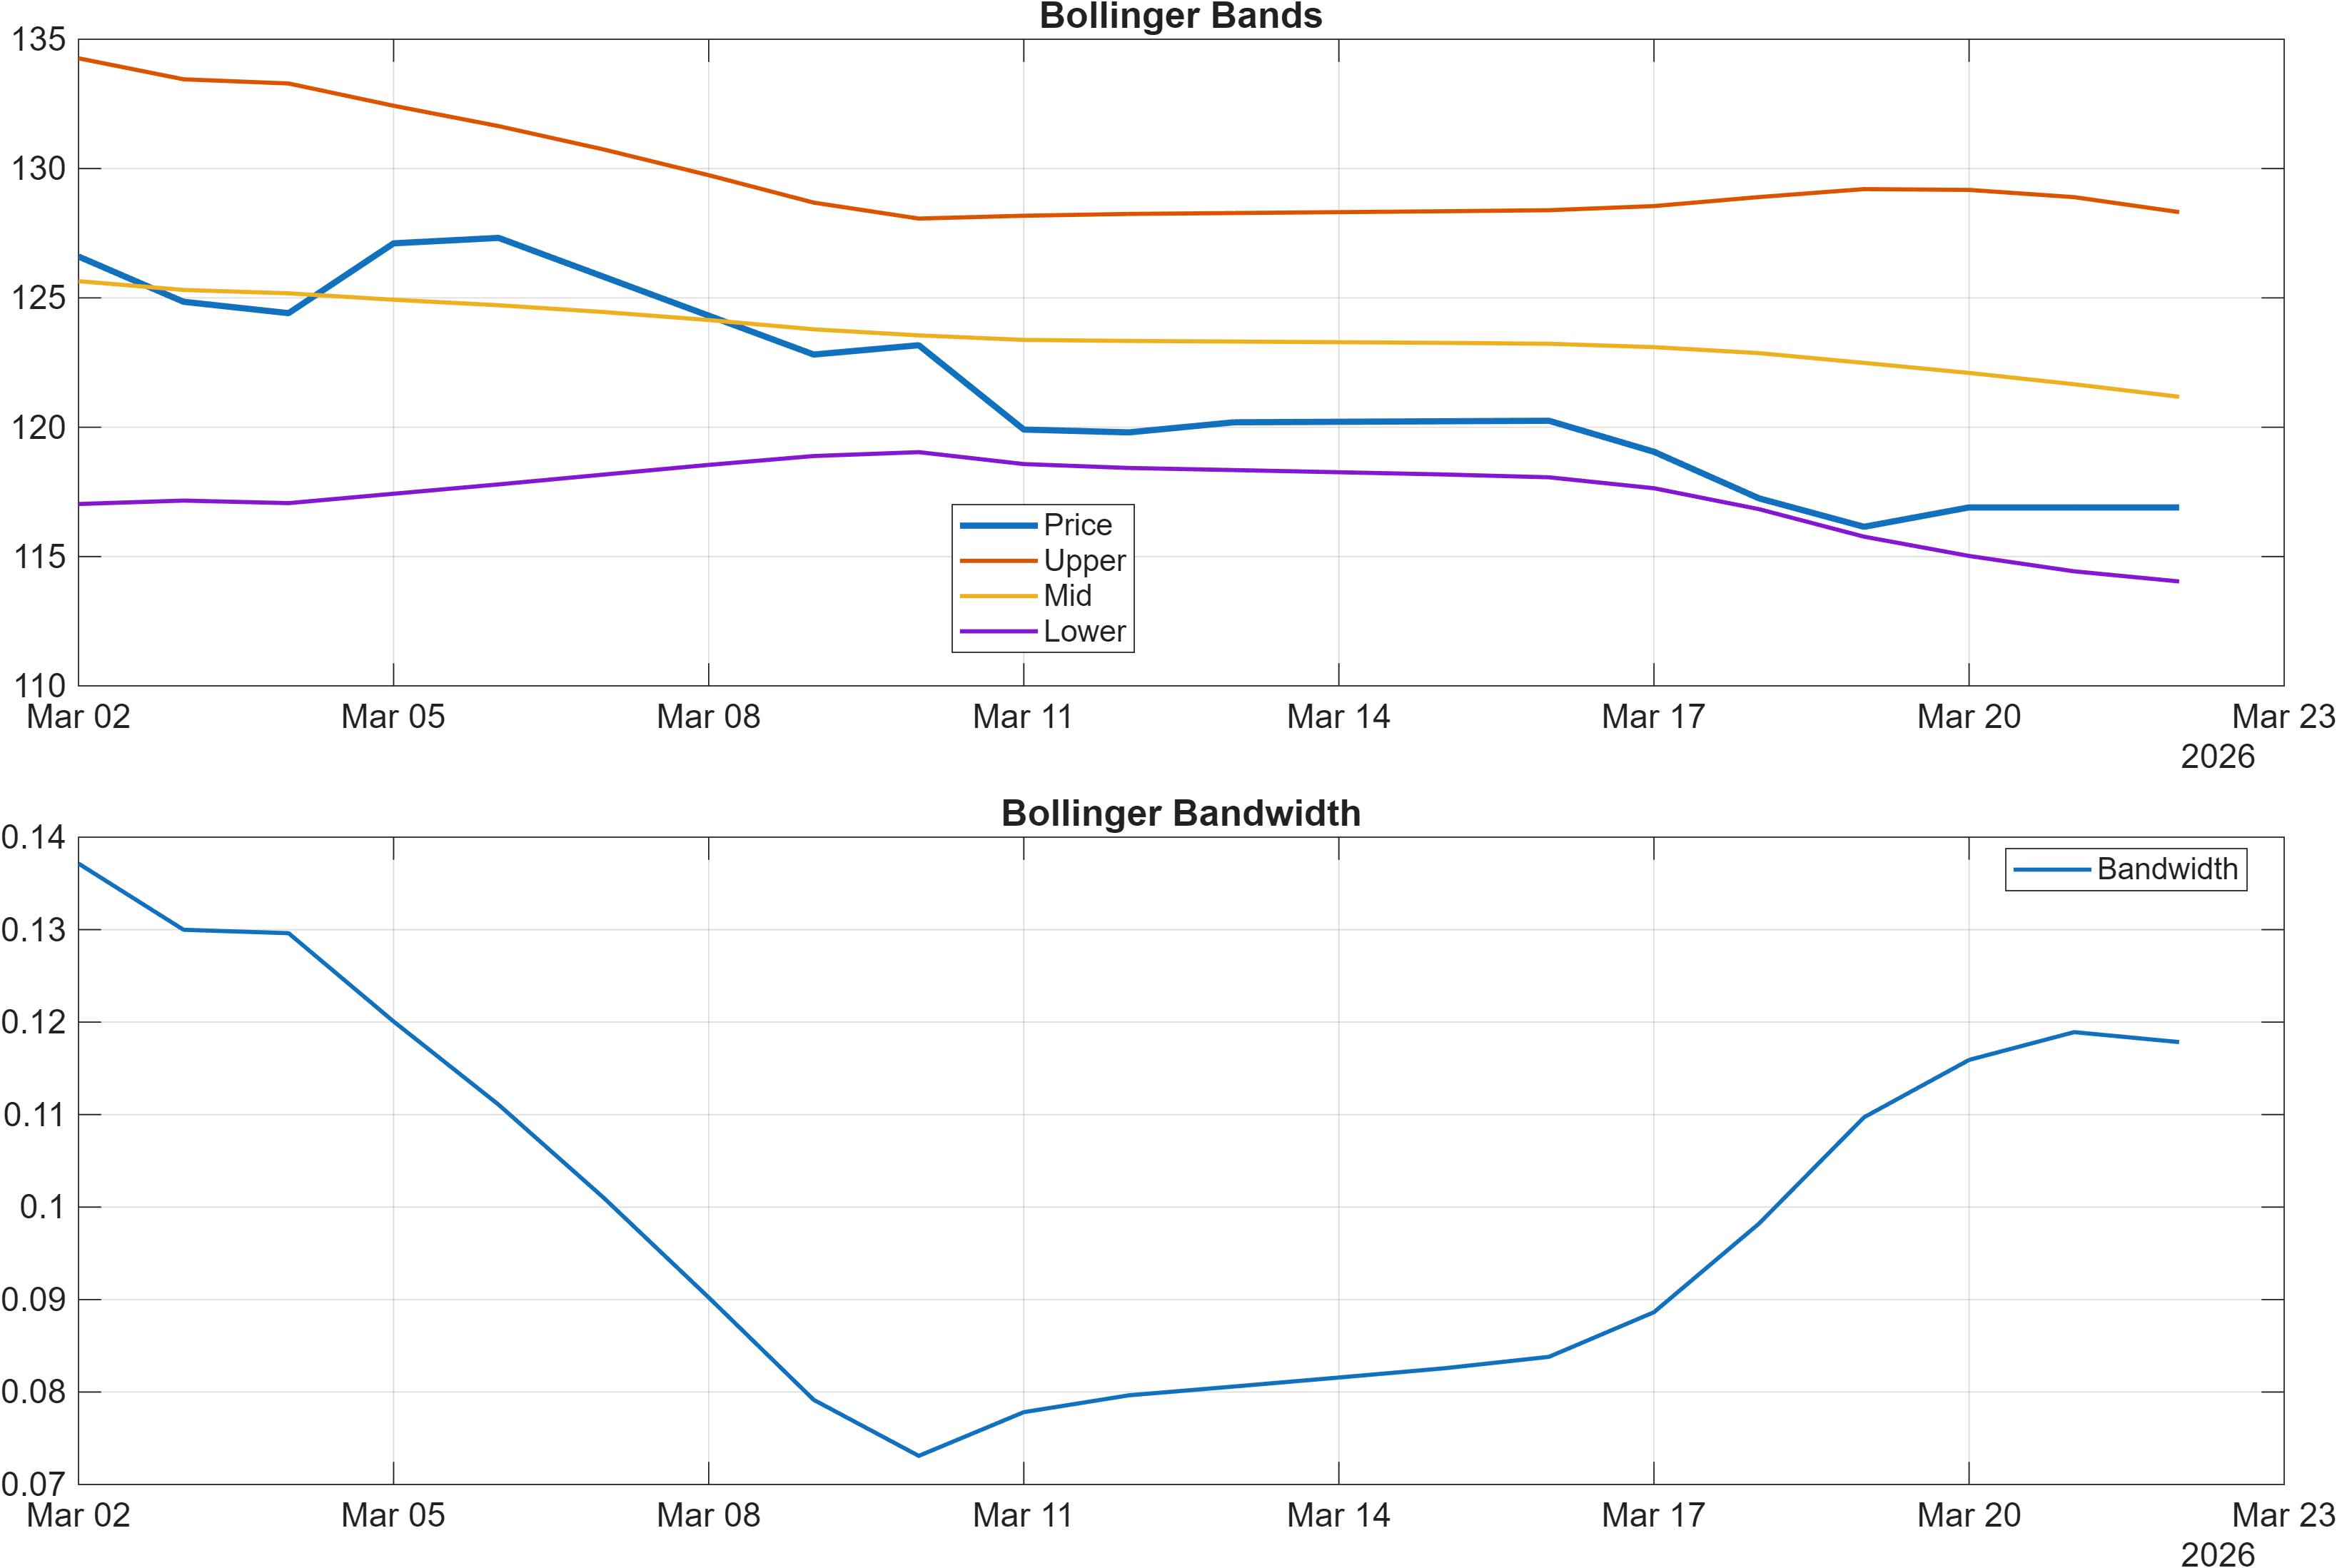
Volatility, however, is not signaling disorder. Bollinger bandwidth at 0.1178 is categorized as Neutral, suggesting the move is not accompanied by an obvious volatility blow-off. This matters: bearish momentum with only neutral volatility often leads to a grinding repair phase (base-building) rather than a rapid V-shaped reversal. A constructive momentum transition would typically show RSI lifting out of extreme levels while MACD histogram trends toward zero, ideally without bandwidth exploding in a way that signals instability.
Interpretation: RSI bias = Bearish, MACD hist = -0.3950.
Interpretation: Bandwidth (volatility regime) latest = 0.1178.
4) Support / Resistance zones
Support ~ 117.2650 | Resistance ~ 133.6075
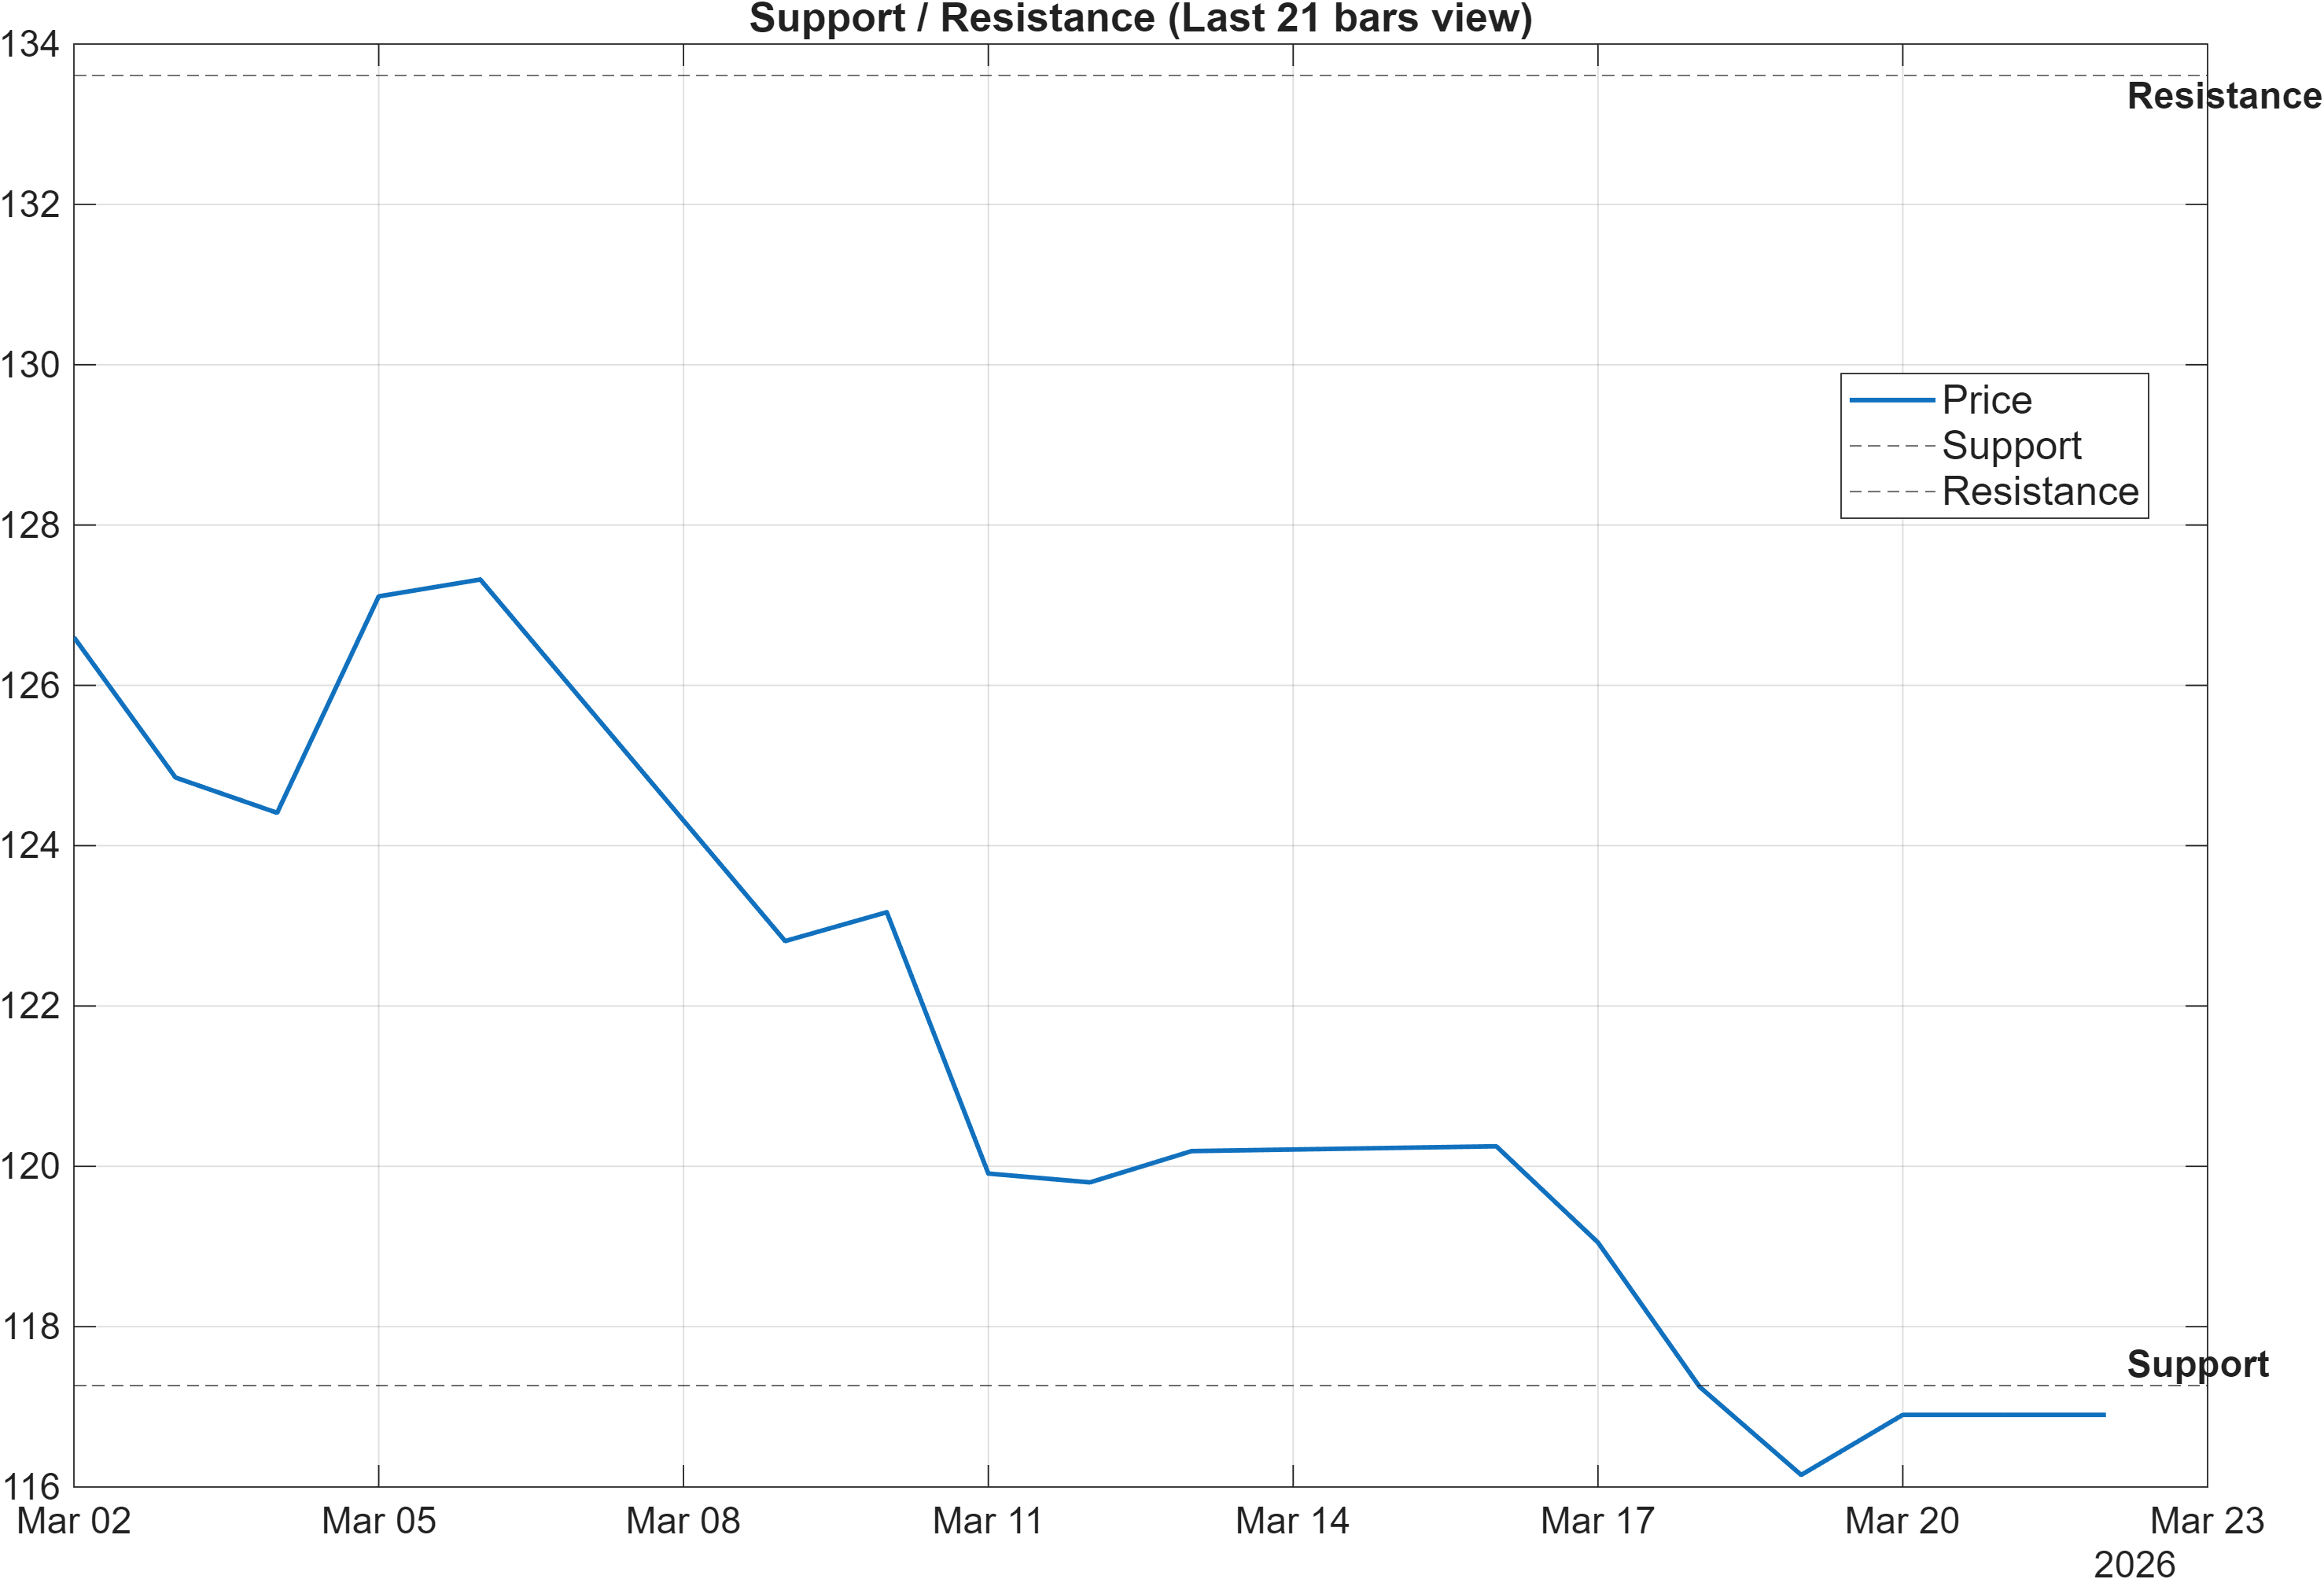
The level structure is relatively clean, which helps separate regime continuation from regime deterioration. The market’s immediate downside reference is 117.2650, a zone that becomes more important given the momentum stress visible in RSI(14) at 14.81 and the negative MACD histogram at -0.3950. When momentum is compressed to that degree, support is less about precision and more about whether selling pressure continues to accept lower prices.
On the upside, 133.6075 is the key barrier that must be reclaimed to shift the conversation from “bounce” to “trend repair.” The scenario logic in the draft is appropriately conditional: a break above resistance with volume implies continuation, while a close below support elevates deterioration risk. This is consistent with a chart where moving-average signals remain bearish (Close vs MA50 and MA50 vs MA200), meaning resistance is likely to be defended unless demand expands.
The distance between the two zones is also informative for positioning discipline. With Bollinger bandwidth at 0.1178 (neutral), price may oscillate rather than trend cleanly, increasing the importance of waiting for confirmation at the boundaries. A constructive setup would be repeated defense above 117.2650 followed by improving momentum metrics—particularly MACD histogram moving toward zero—before attempting to clear 133.6075. Conversely, repeated tests that weaken support often precede a structural reset in both ranks and technical scores.
Scenario view: Break above resistance with volume → continuation. Close below support → signal deterioration risk.
5) Quant Technical Dashboard (18 Signals)
KGNAI AI Technical Analysis Score (Deep Reinforcement Learning): Rank #259 out of 2065 (Rank 1 represents the strongest technical positioning and a higher probability of favorable price behavior. As ranks increase toward the maximum, the probability of favorable outcomes weakens and bearish positioning becomes more dominant.) | Label: Bullish | Score: 0.749
18-Signal Technical Confluence Score: -0.111 (Neutral)
Overall Technical Score (18-signal confluence + DRL rank blend): 0.147 (Neutral)
Note: The blended score reflects signal strength weighted against broader AI technical ranking, which may temporarily diverge.
Blended technical score breakdown: 0.147 (Neutral | Bull 6 / Bear 8 / Neutral 4)
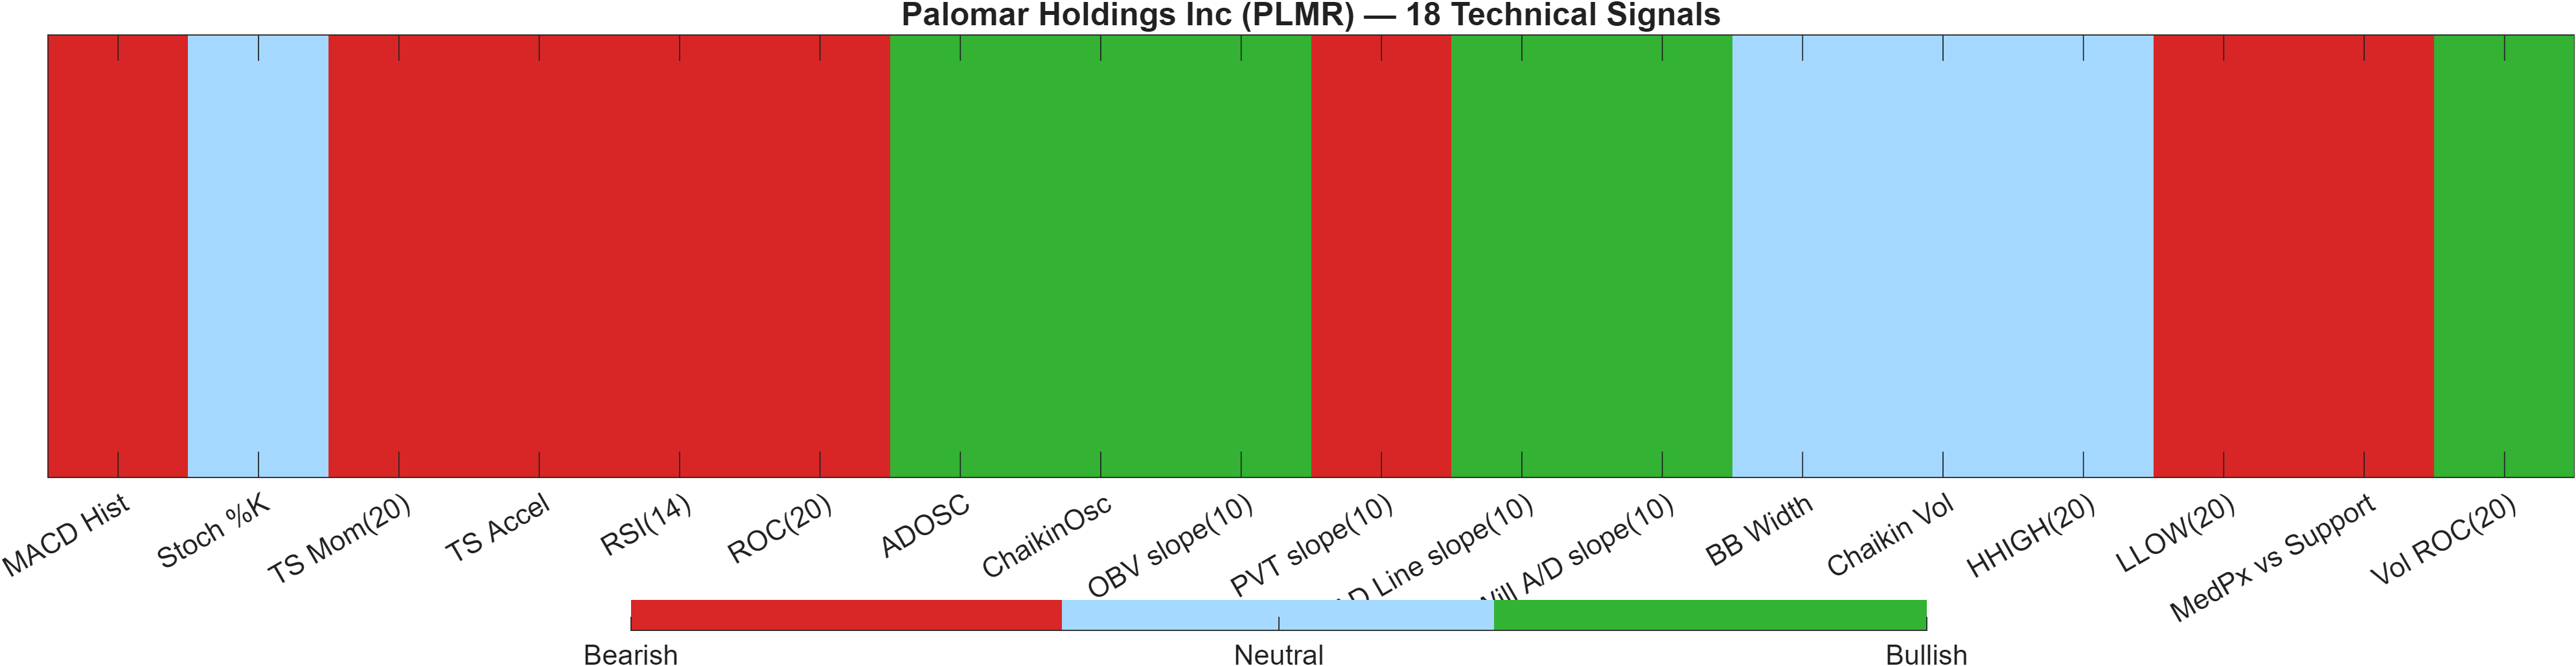
The technical stack is best interpreted as a neutral aggregate with internal disagreement. The Deep Reinforcement Learning technical rank is #259 out of 2065 with a Bullish label and score 0.749, which points to comparatively favorable technical behavior in the broader universe. Yet the 18-signal confluence is -0.111 (Neutral) and the blended overall technical score is 0.147 (Neutral), reflecting that the indicator layer still contains meaningful bearish pressure.
That split is visible in the signal mix (Bull 6 / Bear 8 / Neutral 4): price is not receiving a uniform “risk-on” vote from independent indicators. Momentum and rate-of-change signals tilt negative, including ROC(20) at -6.368 and the already-noted RSI(14) at 14.81. Meanwhile, several accumulation/distribution and volume-derived metrics register supportive behavior (e.g., ADOSC 36.56 and OBV slope(10) 5.937e+05), implying that flow-based measures are not fully aligned with the bearish momentum complex.
This configuration often produces signal compression: momentum remains weak while participation metrics hint at stabilization. If that stabilization is real, the first improvement typically appears as momentum gauges moving from bearish extremes toward neutral (RSI lifting and MACD histogram less negative) without a fresh breakdown of price into support. If stabilization fails, the bearish momentum cluster can dominate, and the “Bullish” DRL rank can lag the downgrade until price action confirms the shift. For PLMR, the most practical reading is that the system is not delivering a unilateral direction; it is identifying a market at an inflection where level integrity (support/resistance) carries more weight than marginal indicator changes.
Signal table (Bull/Bear/Neutral)
| Indicator | Value | Signal |
|---|---|---|
| MACD Hist | -0.395 | Bearish |
| Stoch %K | 23.6 | Neutral |
| TS Mom(20) | -7.95 | Bearish |
| TS Accel | -5.79 | Bearish |
| RSI(14) | 14.81 | Bearish |
| ROC(20) | -6.368 | Bearish |
| ADOSC | 36.56 | Bullish |
| ChaikinOsc | 3.73e+05 | Bullish |
| OBV slope(10) | 5.937e+05 | Bullish |
| PVT slope(10) | -5187 | Bearish |
| AD Line slope(10) | 8.858e+05 | Bullish |
| Will A/D slope(10) | 0.57 | Bullish |
| BB Width | 0.1178 | Neutral |
| Chaikin Vol | -19.75 | Neutral |
| HHIGH(20) | 127.7 | Neutral |
| LLOW(20) | 114.8 | Bearish |
| MedPx vs Support | -1.045 | Bearish |
| Vol ROC(20) | 443.2 | Bullish |
Interpretation: Indicator-level signals form the base confluence, which is then adjusted using a separate AI-driven technical ranking model. The final technical score summarizes this combined view.
6) News sentiment + extractive gist
Sentiment score (avg): 0.225 | Positive: 63% | Neutral: 37% | Negative: 0%
KGNAI AI News Sentiment Score (normalized -1 to +1): 0.99 (as of 2026-03-21) | Label: Bullish | Overall news score: 0.97
Positive Developments
Recent coverage across major financial outlets indicates a broadly constructive narrative around Palomar, which is consistent with the strongly positive news scoring (normalized 0.99, overall news score 0.97). The distribution is notably one-sided—63% positive, 37% neutral, and 0% negative—suggesting the news flow is not currently supplying incremental downside catalysts. The tone of the positive items is centered on operational progress and investor framing rather than market stress, which can help stabilize expectations even while the chart is under pressure. This sets up an important context: when sentiment remains supportive while momentum indicators (e.g., MACD hist -0.3950) stay negative, markets often move into a “wait for confirmation” posture where price needs to validate the narrative through reclaimed levels and improved trend structure.
Neutral / Mixed Developments
The neutral stream is largely comparative and interpretive, focusing on positioning versus peers and post-event digestion. With the average sentiment still positive (0.225), the “mixed” element is less about overt negativity and more about uncertainty around timing—how quickly the stock can translate constructive business discussion into improved price behavior. This is relevant given the current technical state: moving-average signals remain bearish (Close vs MA50 and MA50 vs MA200), implying that even neutral commentary can coincide with choppy trading as market participants reconcile fundamentals narrative with trend signals. In short, the news tone does not resolve the trade; it mostly frames the backdrop while price tests decision levels.
Negative / Risk Signals
Even with 0% negative in the aggregate breakdown, risk signals still exist in the form of price-action underperformance discussed in recent coverage and the market’s sensitivity to valuation framing after mixed share performance. The primary risk is not a negative headline impulse, but a sentiment/price conflict: constructive news alongside weak momentum (e.g., RSI(14) 14.81) can become fragile if support fails. If PLMR closes below 117.2650, the absence of negative headlines may not prevent technical de-risking, and the narrative can lag the market. Conversely, if resistance 133.6075 is reclaimed with volume, the existing positive sentiment can more easily reinforce follow-through rather than merely offset weakness.
- Whether price holds above 117.2650 as momentum attempts to lift from extreme readings (RSI(14) 14.81).
- Any evidence of improving impulse: MACD histogram moving upward from -0.3950 toward zero.
- A decisive test of 133.6075 and whether a breakout attempt is accompanied by volume.
Sources referenced: Reuters, Bloomberg, Yahoo Finance, MarketWatch, Investing.com
7) Sources
Not available in the provided data.
You may also like: How KGNAI AI ranks instruments across global markets
Disclaimer: KGNAI provides AI-generated analytics and educational market commentary only. This is not financial advice. Markets involve risk. Always do your own research.