
Charles Schwab Corp (SCHW) Technical & Sentiment Outlook — 20-Mar-2026 (Neutral, range-bound bias)
Charles Schwab (SCHW) is currently characterized by neutral cross-horizon ranks, a mixed technical stack, and a constructive news-sentiment backdrop that has not yet translated into a clean trend signal. In the KGNAI universe of 2065 ranked instruments, SCHW’s positioning remains mostly mid-pack, with the daily rank at #1359 contrasting against comparatively firmer intermediate readings such as the monthly rank at #438. Price structure is not fully aligned with trend filters: the snapshot flags Close vs MA50 = Bearish and MA50 vs MA200 = Bearish, indicating overhead moving-average friction. Momentum indicators are similarly split—MACD histogram 0.2112 is constructive while RSI(14) 42.29 sits on the softer side of neutral. With support ~92.0883 and resistance ~105.5000, the near-term setup reads as a decision zone: confirmation depends on whether price can reclaim trend structure rather than relying on sentiment alone.
Key Takeaways
- Rank stance (Short / Mid / Long): Neutral / Neutral / Neutral (e.g., daily #1359, weekly #563, yearly #726 out of 2065).
- Technical confluence label: Neutral (18-signal confluence 0.167; overall technical score 0.299).
- Key levels: Support 92.0883 vs resistance 105.5000 frames the current range.
- News sentiment bias: Net constructive tilt with sentiment score (avg) 0.104 and normalized score 0.97 (Bullish label).
- Confirmation / invalidation: A sustained push above 105.5000 with volume supports continuation; a close below 92.0883 increases deterioration risk.
What KGNAI Measures
KGNAI evaluates assets using large cross-sectional datasets built from millions of structured data points. Inputs incorporate fundamental metrics, technical structures, and systematically processed news sentiment. Statistical models, machine learning, and AI frameworks are used to assess relative positioning, signal alignment, and probabilistic behavior across broad universes.
How to Read This Report
- Ranks are comparative across the tracked universe, not absolute price targets.
- Confluence reflects alignment among independent signal groups.
- Support/resistance levels are probabilistic decision zones, not guarantees.
- Sentiment provides contextual bias within the broader analytical framework.
1) KGNAI AI Analysis
Region: USA | Total universe size: 2065 ranked instruments
- Daily rank: #1359 out of 2065 — Neutral
- Weekly rank: #563 out of 2065 — Neutral
- Monthly rank: #438 out of 2065 — Neutral
- 3-Monthly rank: #939 out of 2065 — Neutral
- 6-Monthly rank: #651 out of 2065 — Neutral
- Yearly rank: #726 out of 2065 — Neutral
The rank profile is broadly neutral across timeframes, but the distribution contains a meaningful internal spread. The monthly rank (#438) places SCHW closer to the upper quartile of the tracked universe, while the daily rank (#1359) sits in the lower third, implying weaker short-horizon behavior versus peers. This type of configuration often reflects a market that has not resolved a directional choice: intermediate positioning can remain respectable while near-term flows degrade.
The weekly rank (#563) and 6-month rank (#651) are both mid-pack, suggesting the security is neither persistently leading nor persistently lagging within the universe. Importantly, the label remains Neutral across all horizons—so the model is not signaling a regime-level shift; rather, it is describing incomplete alignment among the inputs used for ranking.
Within KGNAI’s framework, this “neutral-but-dispersed” rank structure tends to be most sensitive to confirmation from independent groups—particularly trend filters and participation/volume measures—because those inputs can quickly pull short-term ranks toward intermediate ranks (or vice versa). As of this snapshot, the term view is explicitly Neutral for short-, mid-, and long-term, reinforcing that the model sees a balancing of positives and negatives rather than a dominant edge.
Term view: Short-term: Neutral. Mid-term: Neutral. Long-term: Neutral.
2) Price & trend overview
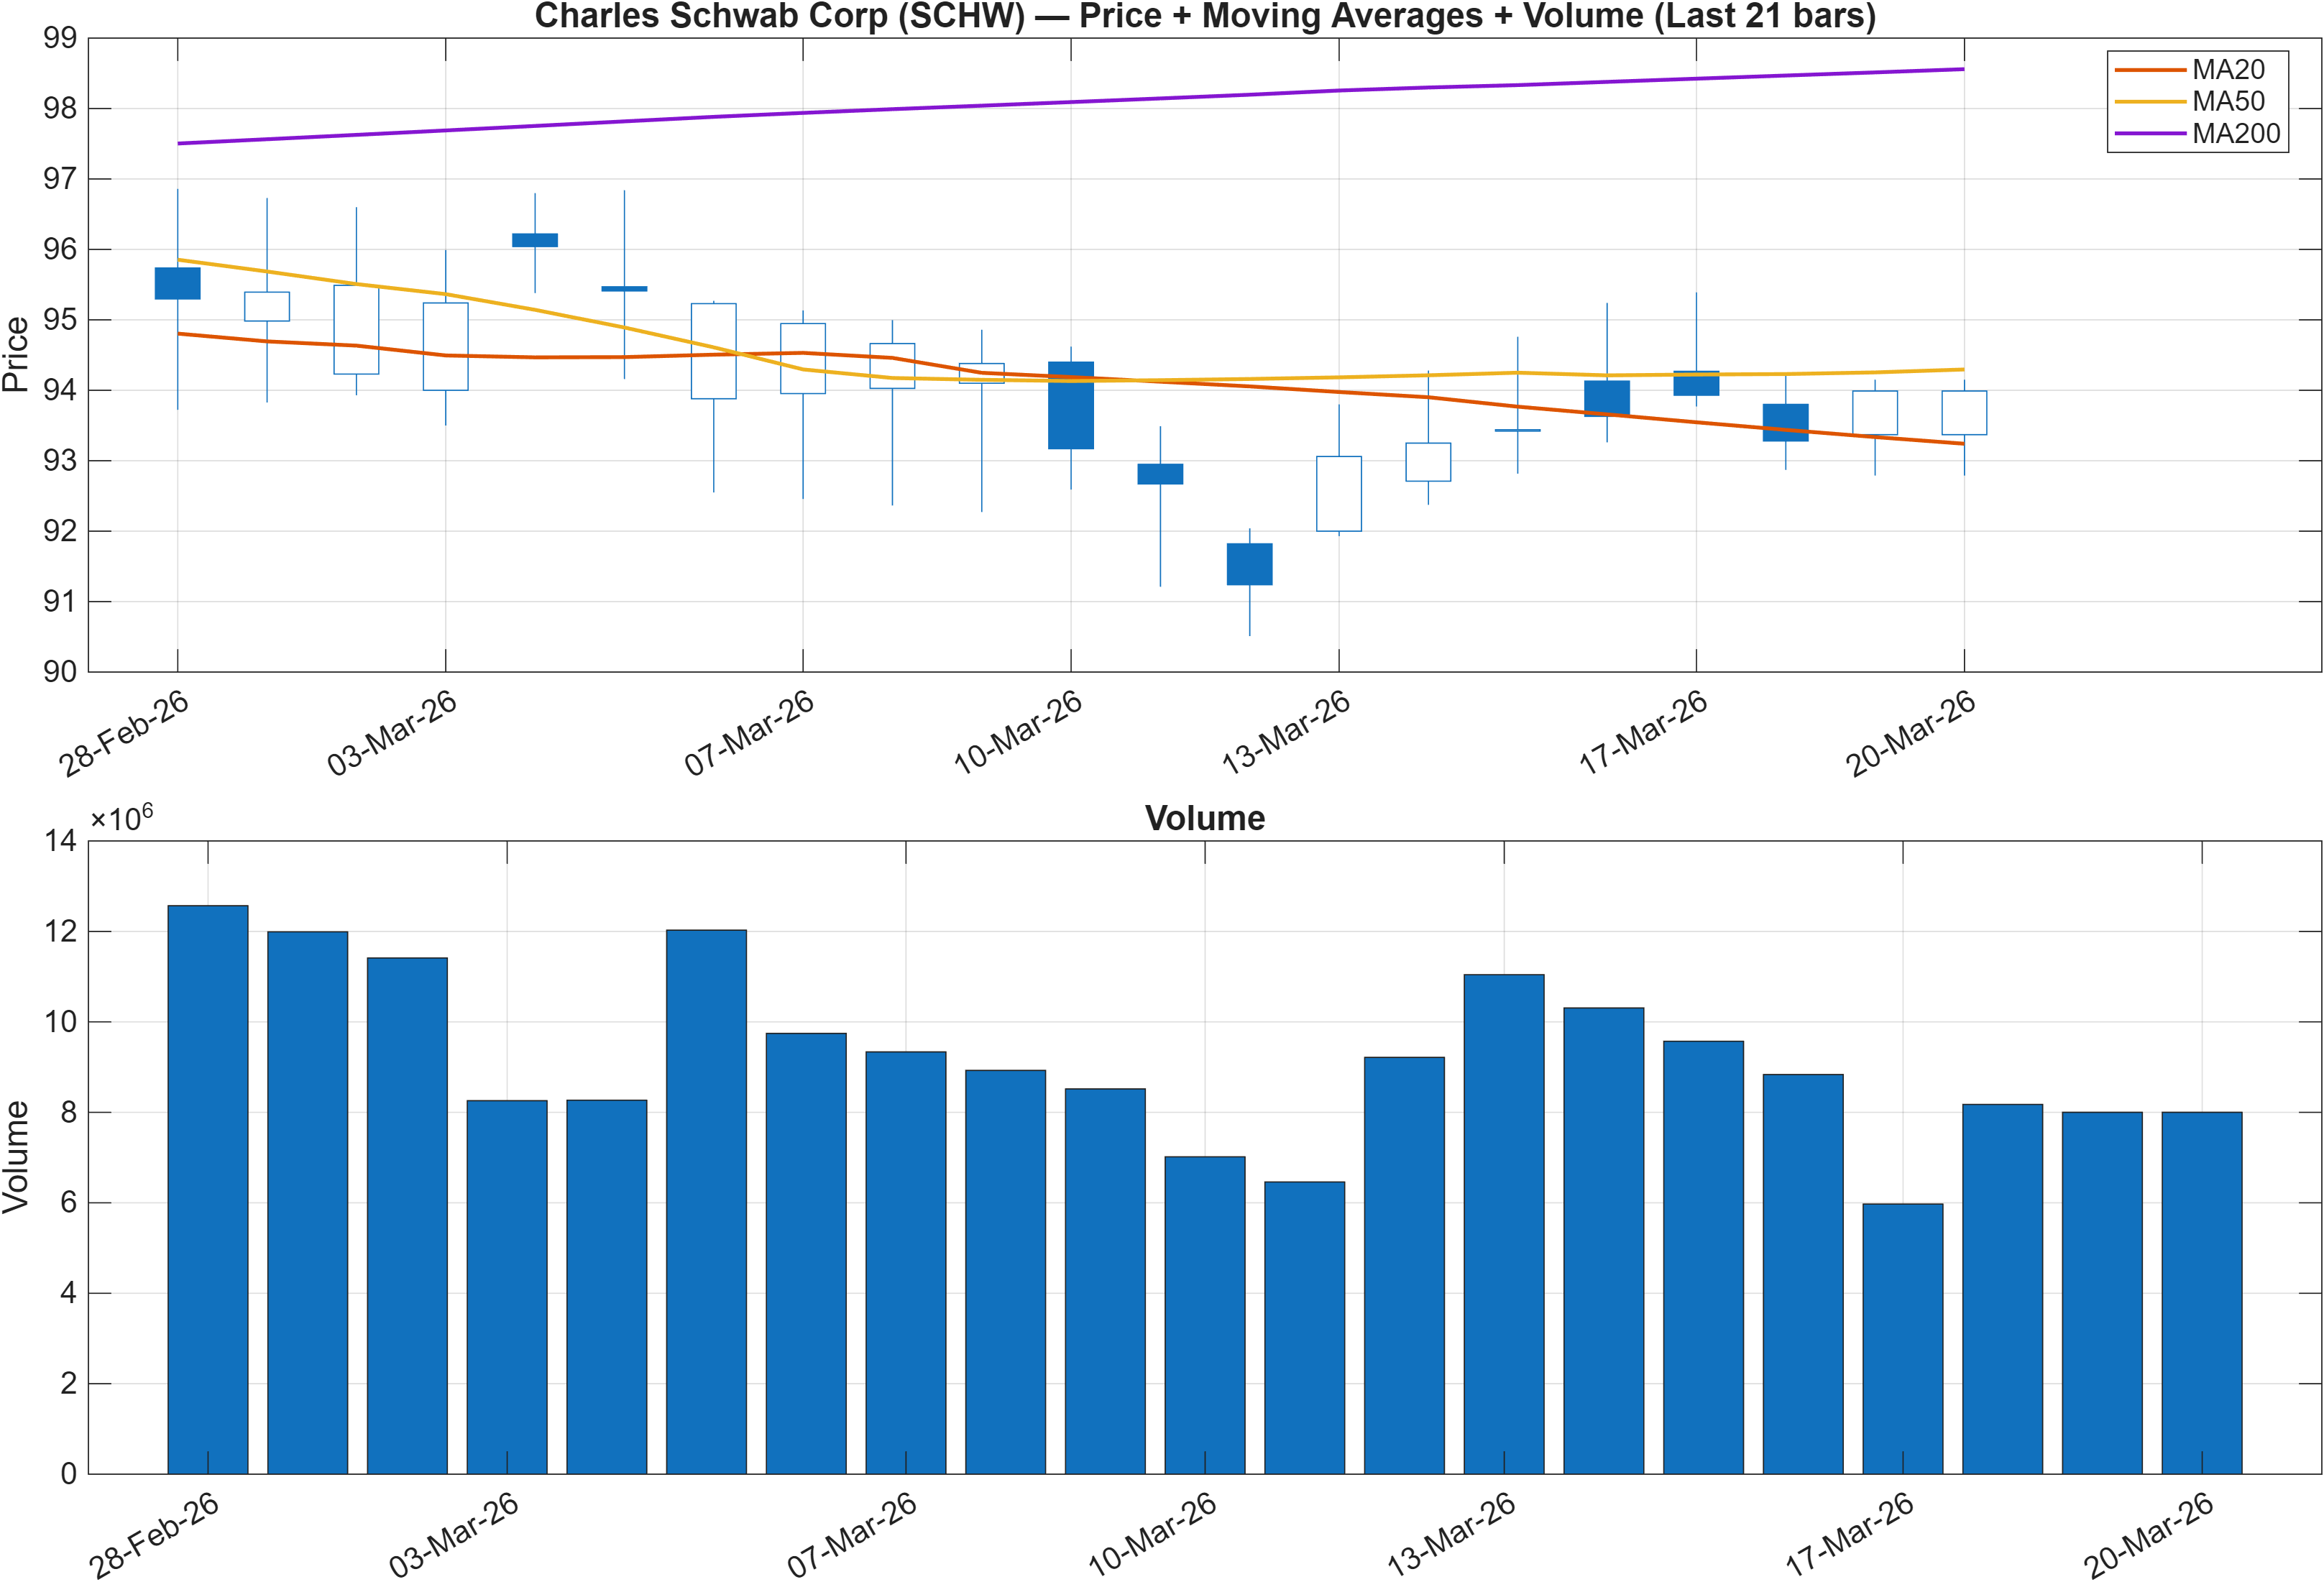
Trend structure is presently constrained by moving-average alignment. The snapshot flags Close vs MA50 = Bearish and MA50 vs MA200 = Bearish, a combination typically consistent with a market trading below intermediate trend while the intermediate trend remains below the longer-term baseline. In practical market-structure terms, rallies can face systematic selling pressure near the MA50 until price reclaims and holds that level.
What makes this setup analytically interesting is the conflict with other evidence in the report. The intermediate KGNAI rank (notably the monthly rank at #438) is stronger than the short-horizon rank (daily #1359), which can occur when the instrument is transitioning—either stabilizing after weakness or failing to extend after strength. Without introducing new levels beyond the provided 92.0883 support and 105.5000 resistance, the trend view can be framed as a range with a bearish trend overlay: directional conviction is limited until price re-engages the moving averages.
Participation is also relevant because the range boundaries only become actionable when accompanied by credible follow-through. The report’s later signal set includes Vol ROC(20) at -33.27 (Bearish), which is consistent with decelerating activity. When volume fades, breakouts and breakdowns become harder to validate, increasing the odds of mean reversion back into the range.
Current trend takeaway: the moving-average stack argues for caution on upside attempts until a sustained improvement is visible, while the broad neutral ranks suggest the market is still searching for direction rather than trending cleanly.
3) Momentum & volatility dashboard
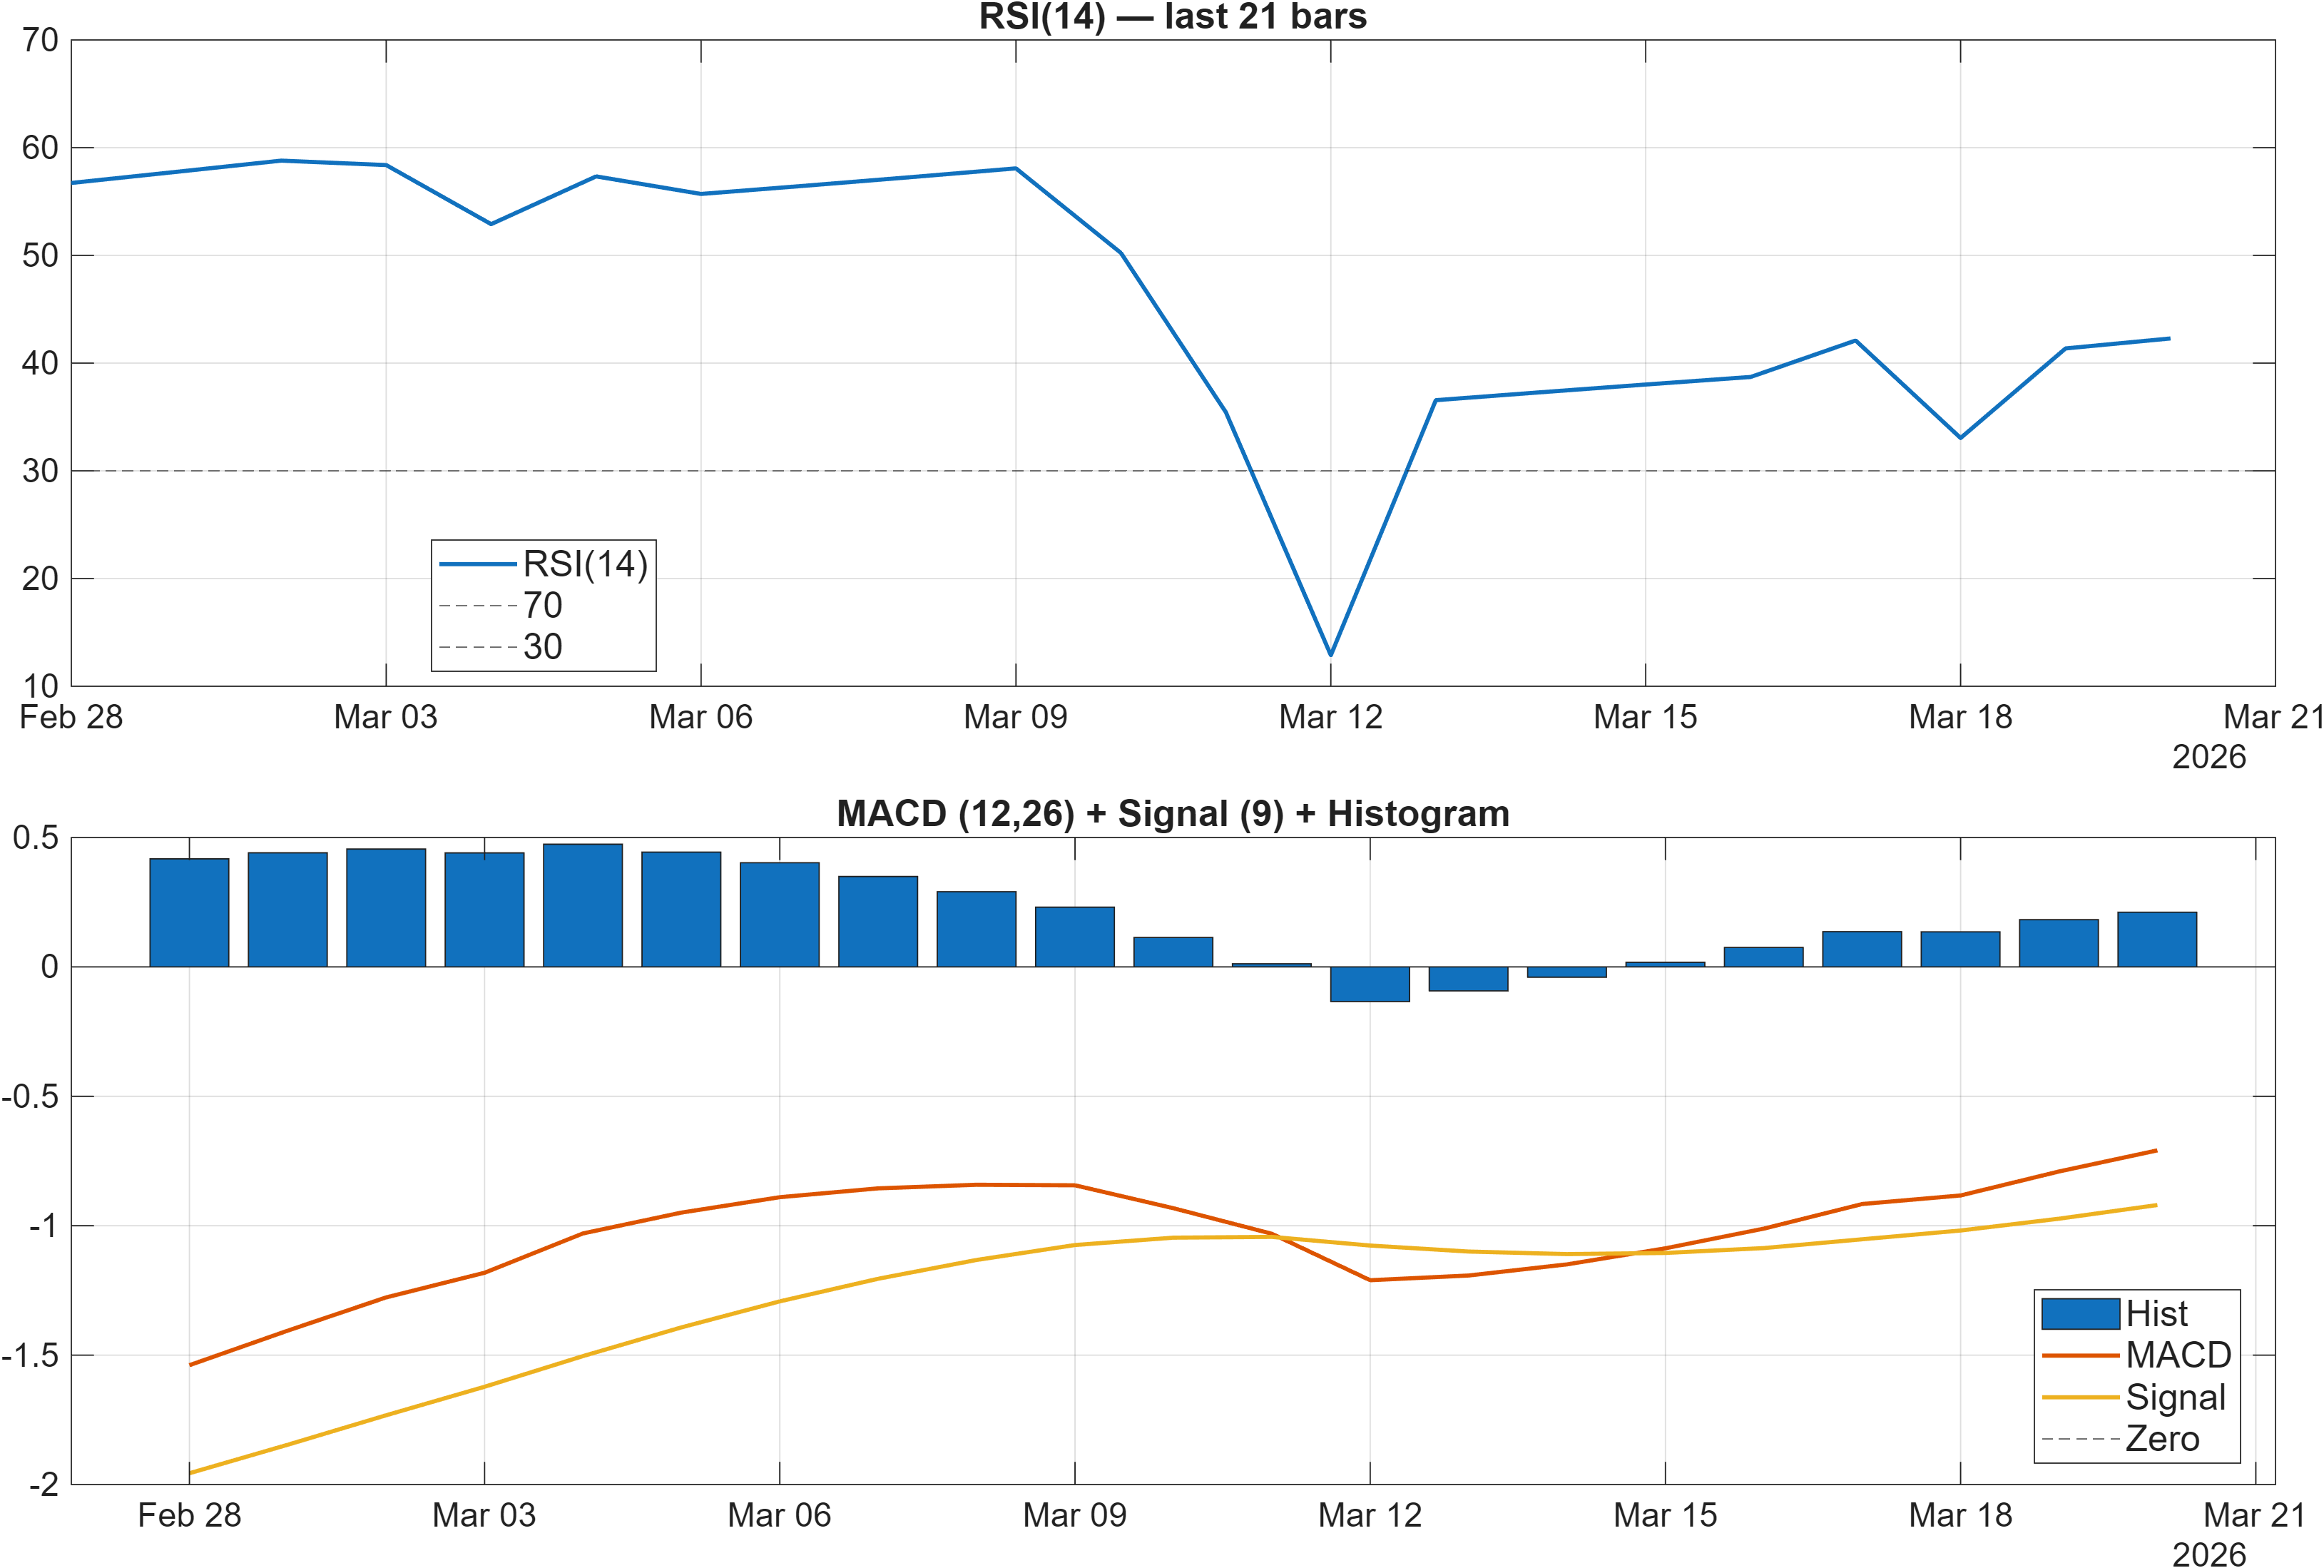
Momentum is best described as split rather than synchronized. RSI bias is labeled Neutral, but the underlying RSI(14) reading is 42.29 (Bearish in the signal table), which typically sits below the comfort zone associated with sustained uptrends. At the same time, the MACD histogram is 0.2112 and is tagged Bullish—often consistent with improving short-cycle momentum even when broader trend filters remain heavy.
This mismatch—MACD improving while RSI remains subdued—often maps to an early-stage recovery attempt inside a larger downtrend or range. Supporting that interpretation, the signal table shows TS Accel at 2.453 (Bullish) against TS Mom(20) at -1.403 (Bearish) and ROC(20) at -1.471 (Bearish). Acceleration positive with negative momentum can indicate a market that is losing downside force but has not yet regained positive drift.
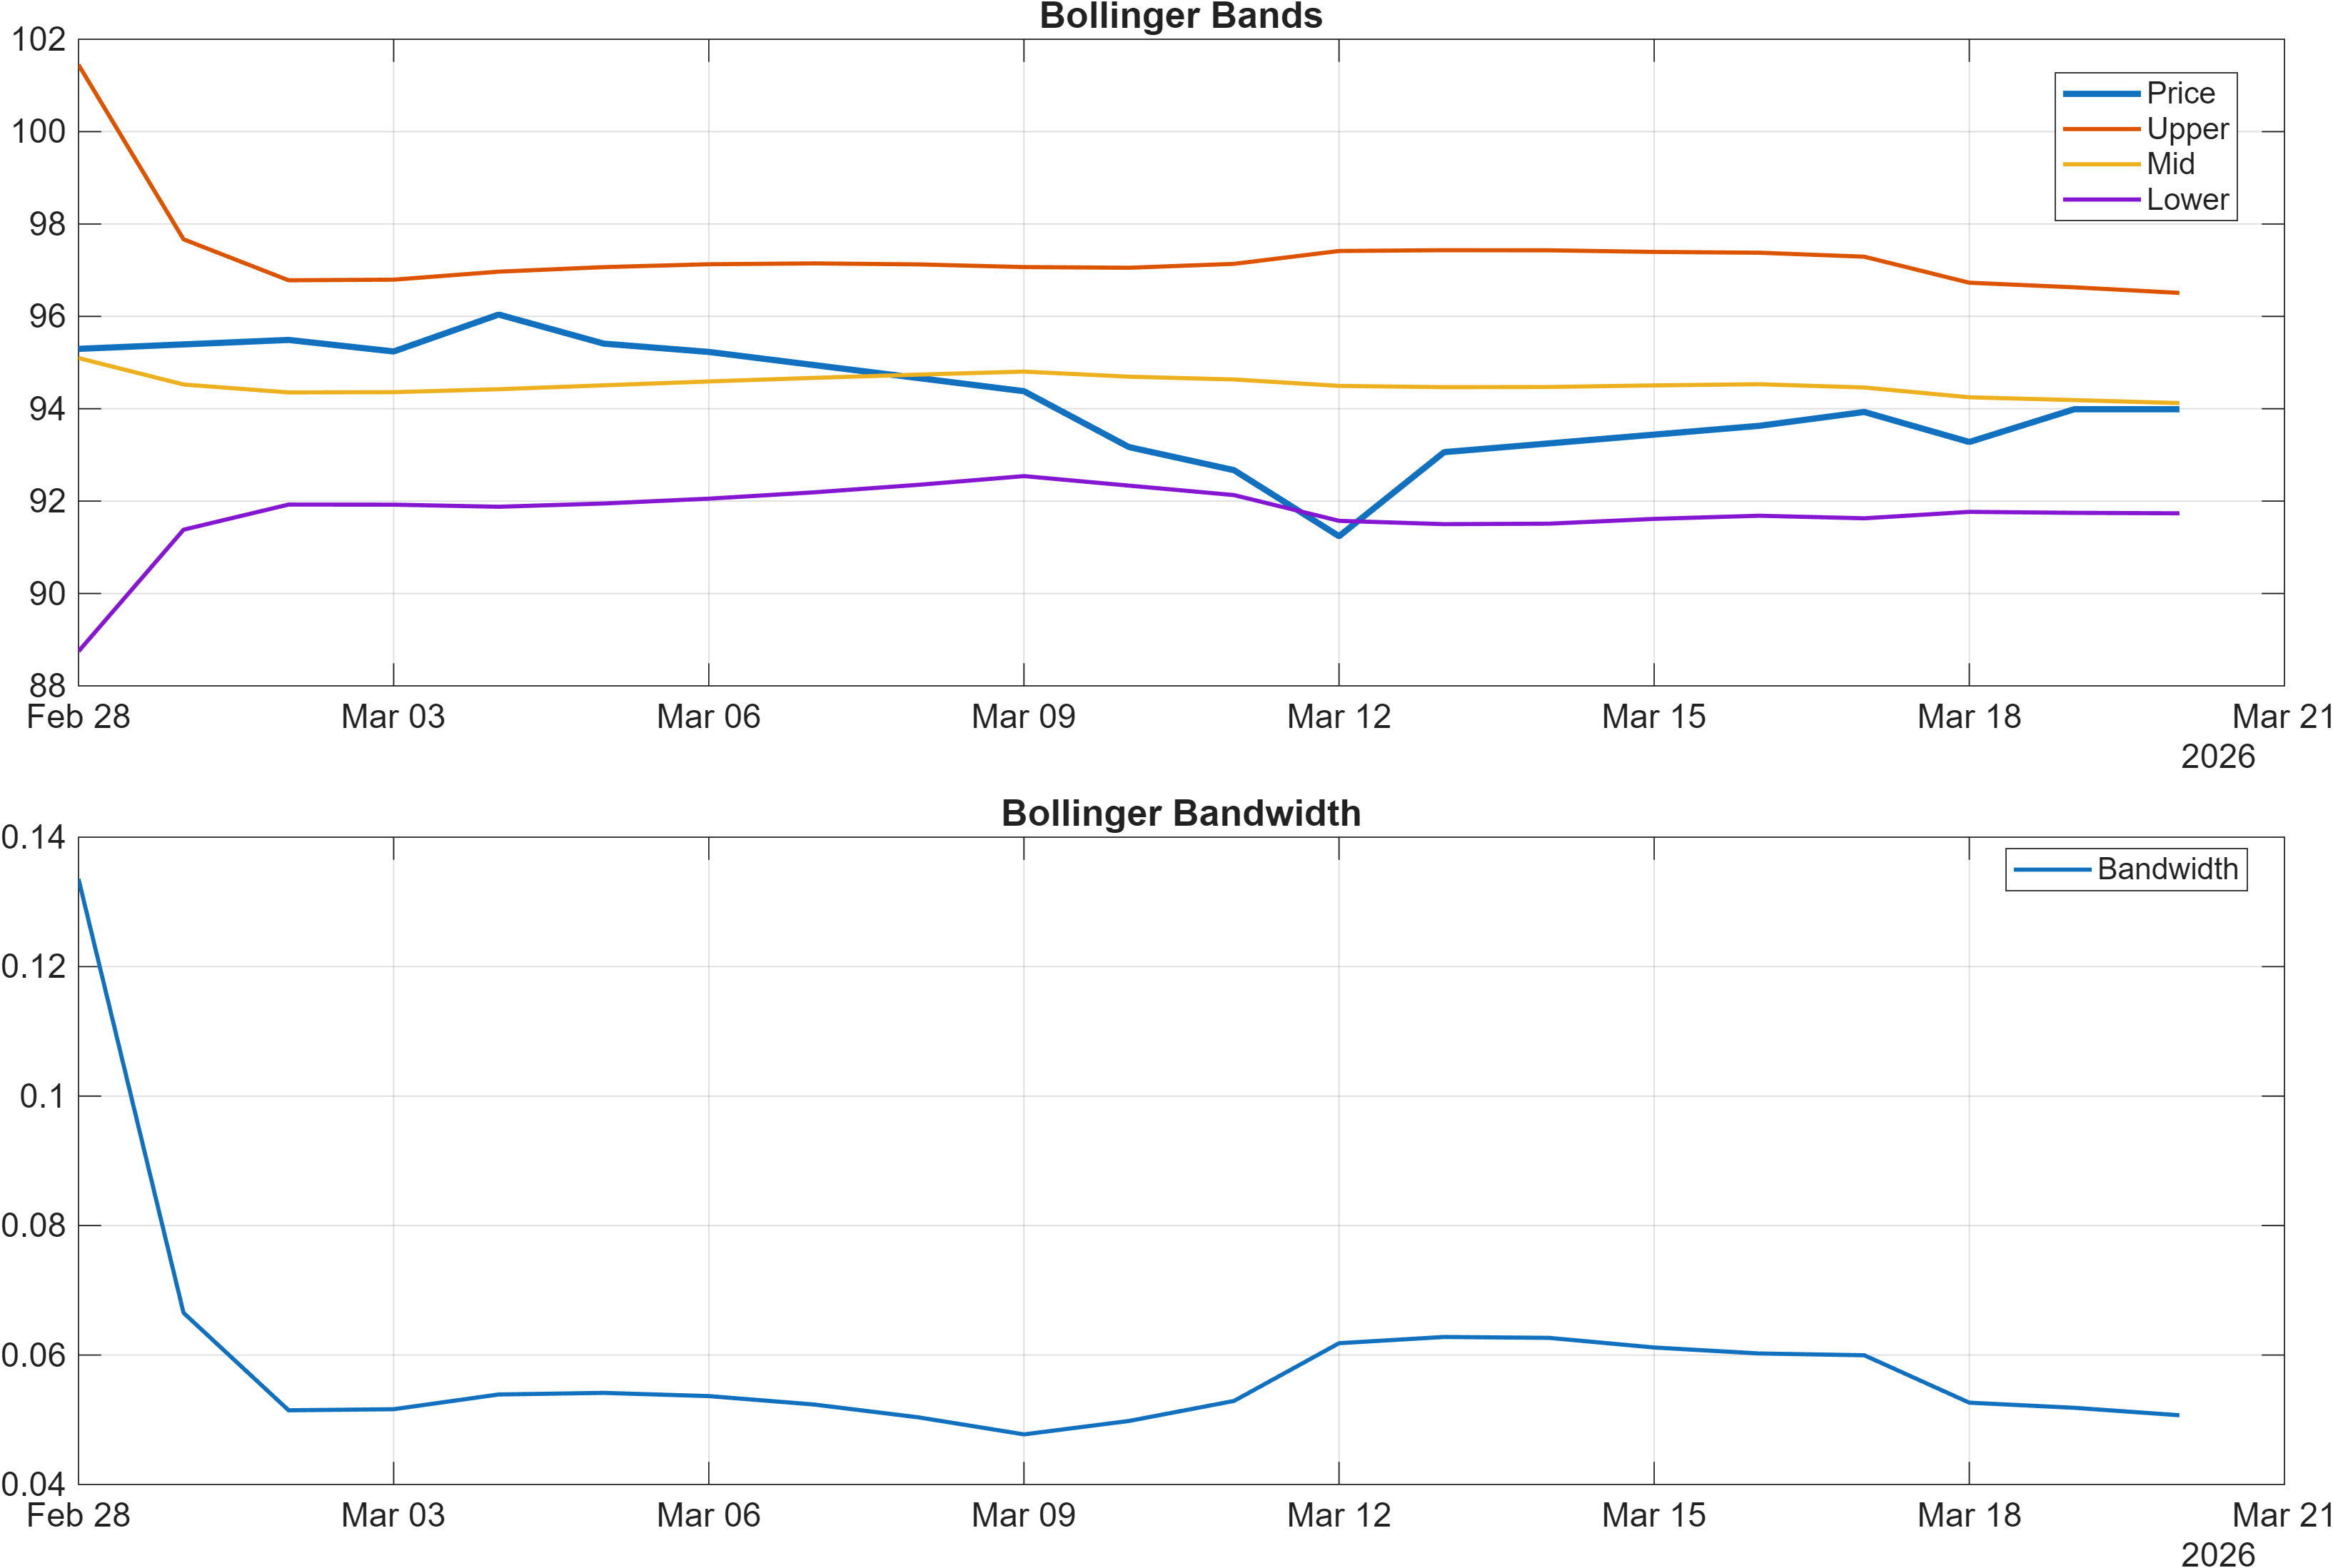
Volatility conditions are relatively contained. The latest Bollinger bandwidth is 0.0507, which points to a compressed regime versus more expansive, trend-friendly environments. Compression can precede expansion, but timing is uncertain; analytically, it elevates the importance of the provided boundary levels (92.0883 / 105.5000) because tighter volatility can make those zones more “decisive” once a break is confirmed.
Net: momentum is attempting to improve in parts of the stack, but the volatility regime and RSI posture suggest the market still needs confirmation before treating the move as durable.
4) Support / Resistance zones
Support ~ 92.0883 | Resistance ~ 105.5000
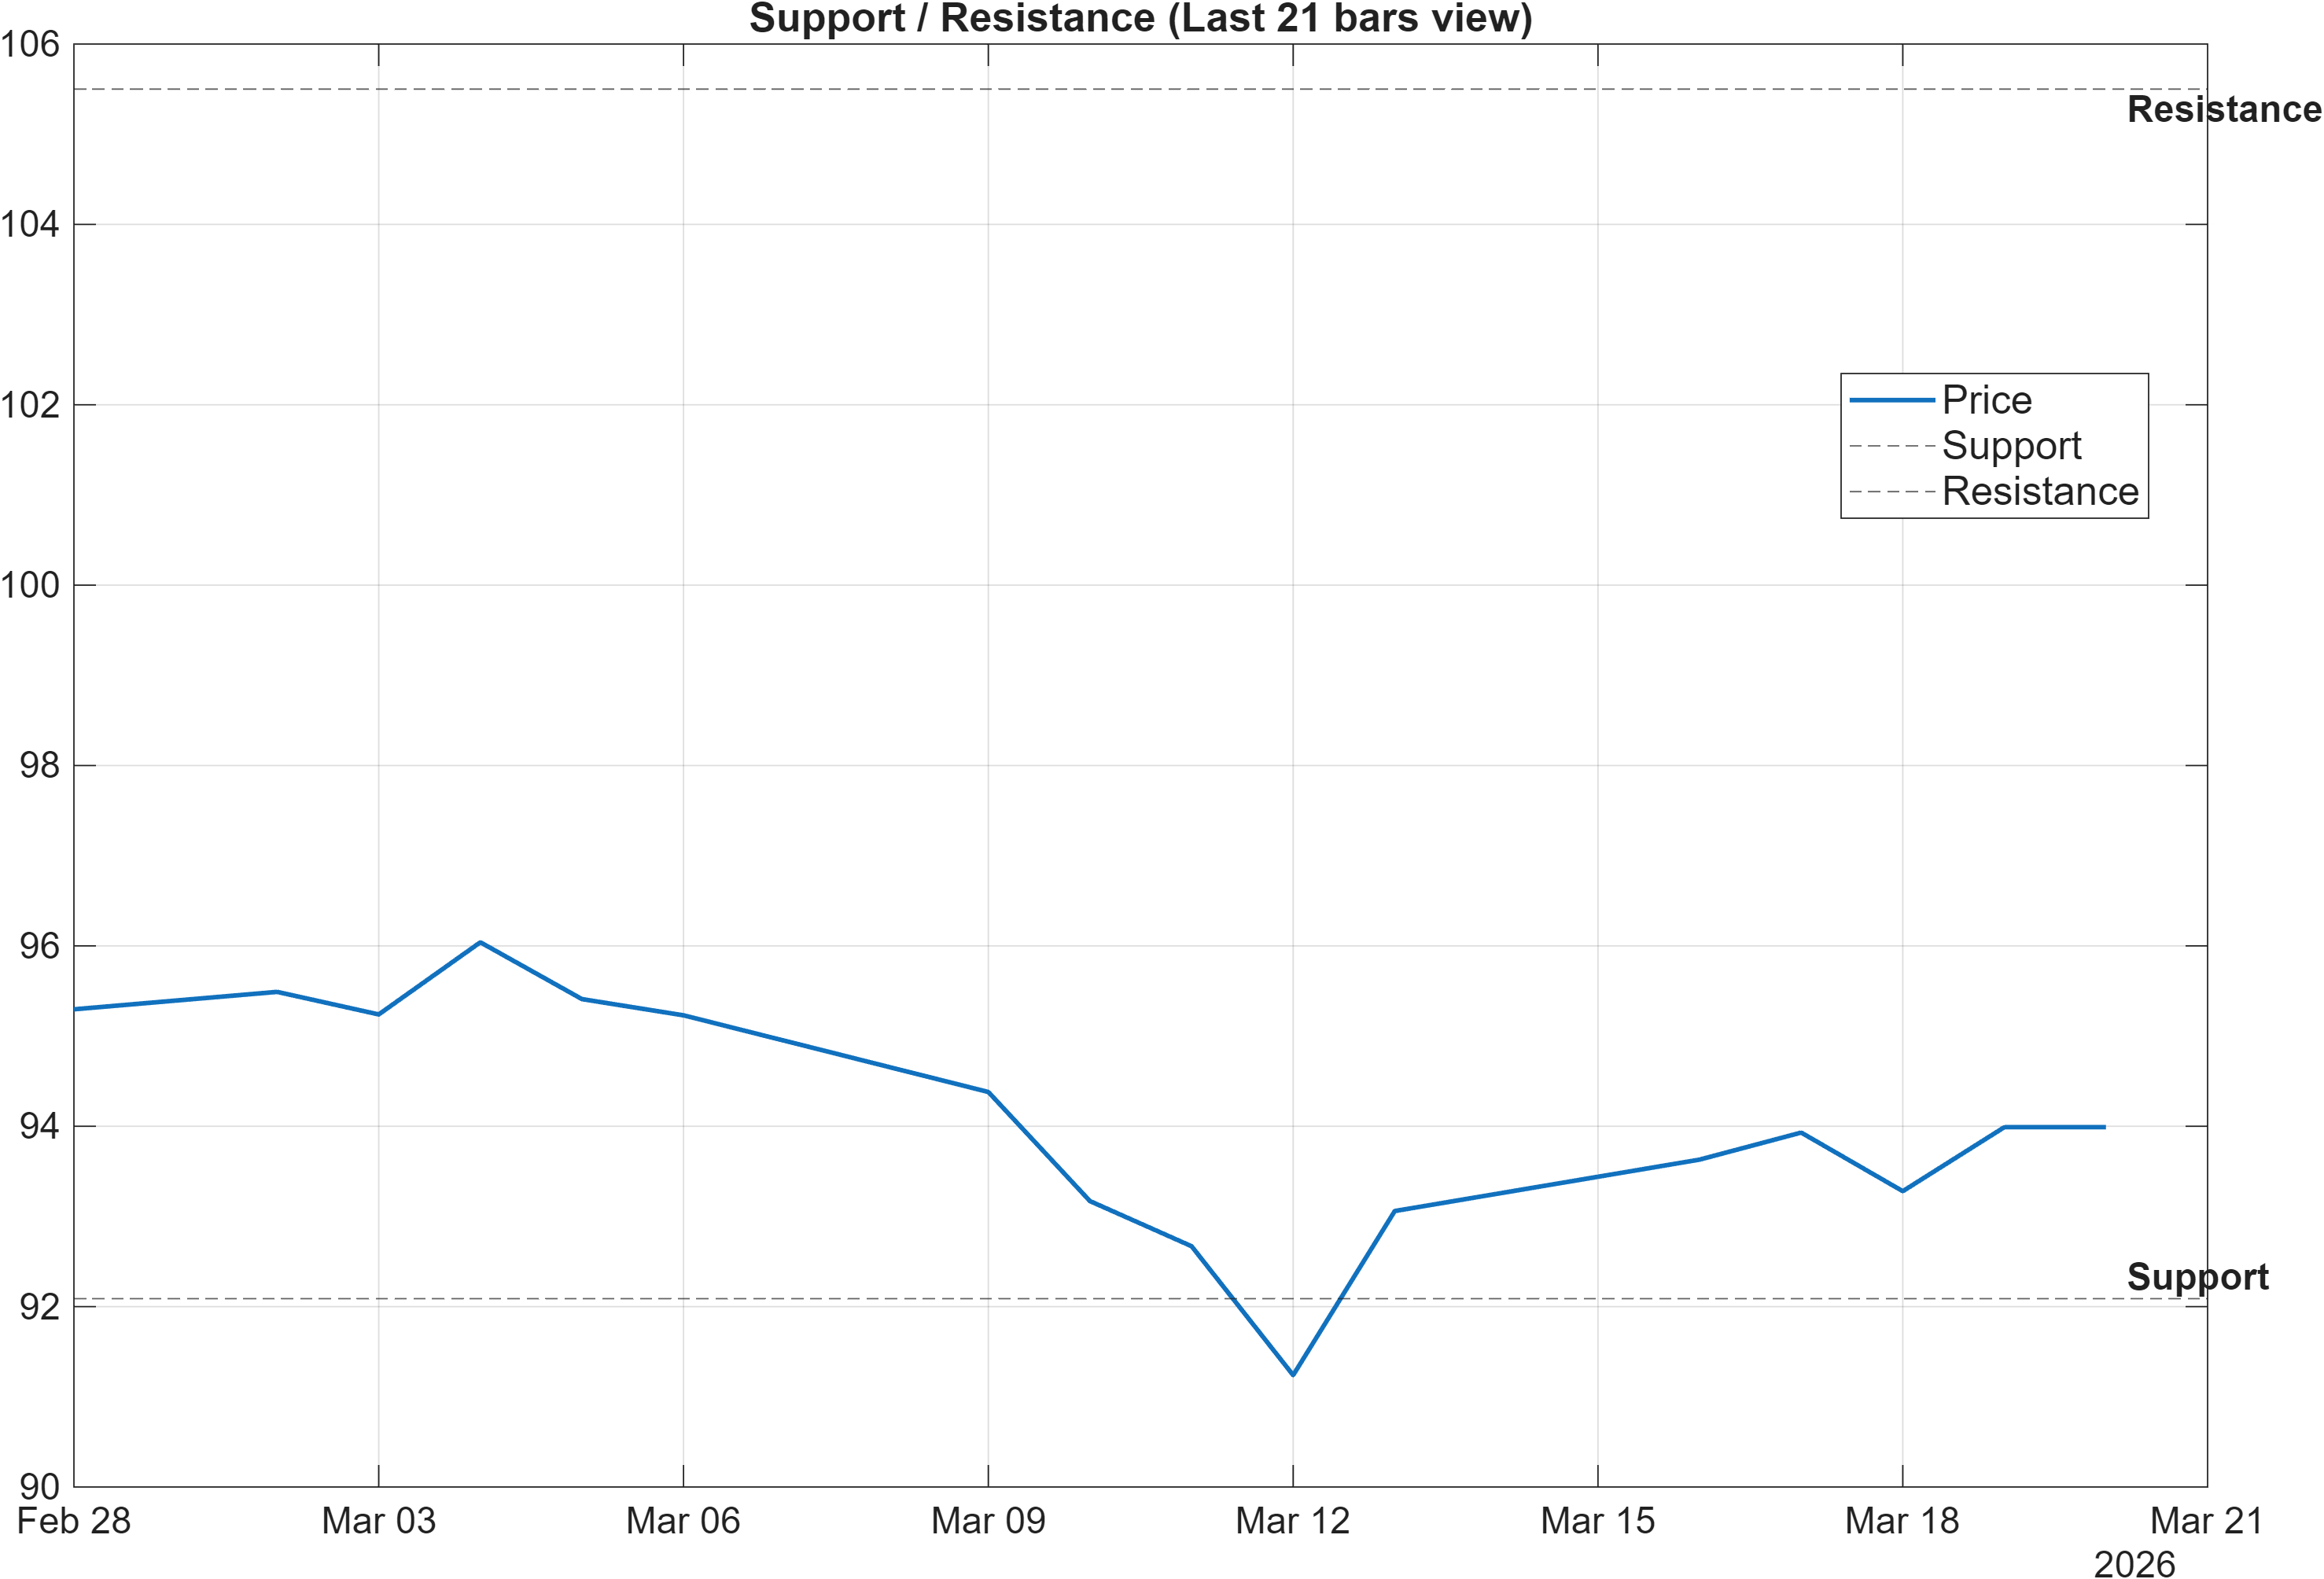
The level structure frames SCHW as a two-sided trade location rather than a one-direction trend. The range is clearly defined by 92.0883 on the downside and 105.5000 on the upside, and the scenario logic in the snapshot is correspondingly conditional: “break above resistance with volume → continuation” versus “close below support → signal deterioration risk.” In a neutral-rank environment, this conditionality is central—signals are more sensitive to how price behaves at decision zones than to mid-range noise.
Several signals add nuance to how those zones may behave. The table shows MedPx vs Support at 1.382 (Bullish), suggesting price is not pinned directly on support and may have some buffer. However, trend filters from Section 2 remain bearish (Close vs MA50 and MA50 vs MA200), which can make the resistance region more influential as an “overhead supply” area.
Volatility context matters as well: with Bollinger bandwidth at 0.0507, a level break—if it occurs—has the potential to coincide with a volatility expansion. Conversely, the bearish Vol ROC(20) of -33.27 warns that participation may not yet be strong enough to validate a breakout without a clear pickup.
Practical interpretation within this report’s constraints: treat 92.0883 as the primary “risk line” for deterioration and 105.5000 as the primary “proof line” for trend rehabilitation, with volume behavior acting as the credibility filter.
5) Quant Technical Dashboard (18 Signals)
KGNAI AI Technical Analysis Score (Deep Reinforcement Learning): Rank #405 out of 2065 (Rank 1 represents the strongest technical positioning and a higher probability of favorable price behavior. As ranks increase toward the maximum, the probability of favorable outcomes weakens and bearish positioning becomes more dominant.) | Label: Bullish | Score: 0.608
18-Signal Technical Confluence Score: 0.167 (Neutral)
Overall Technical Score (18-signal confluence + DRL rank blend): 0.299 (Neutral)
Note: The blended score reflects signal strength weighted against broader AI technical ranking, which may temporarily diverge.
Blended technical score breakdown: 0.299 (Neutral | Bull 8 / Bear 5 / Neutral 5)
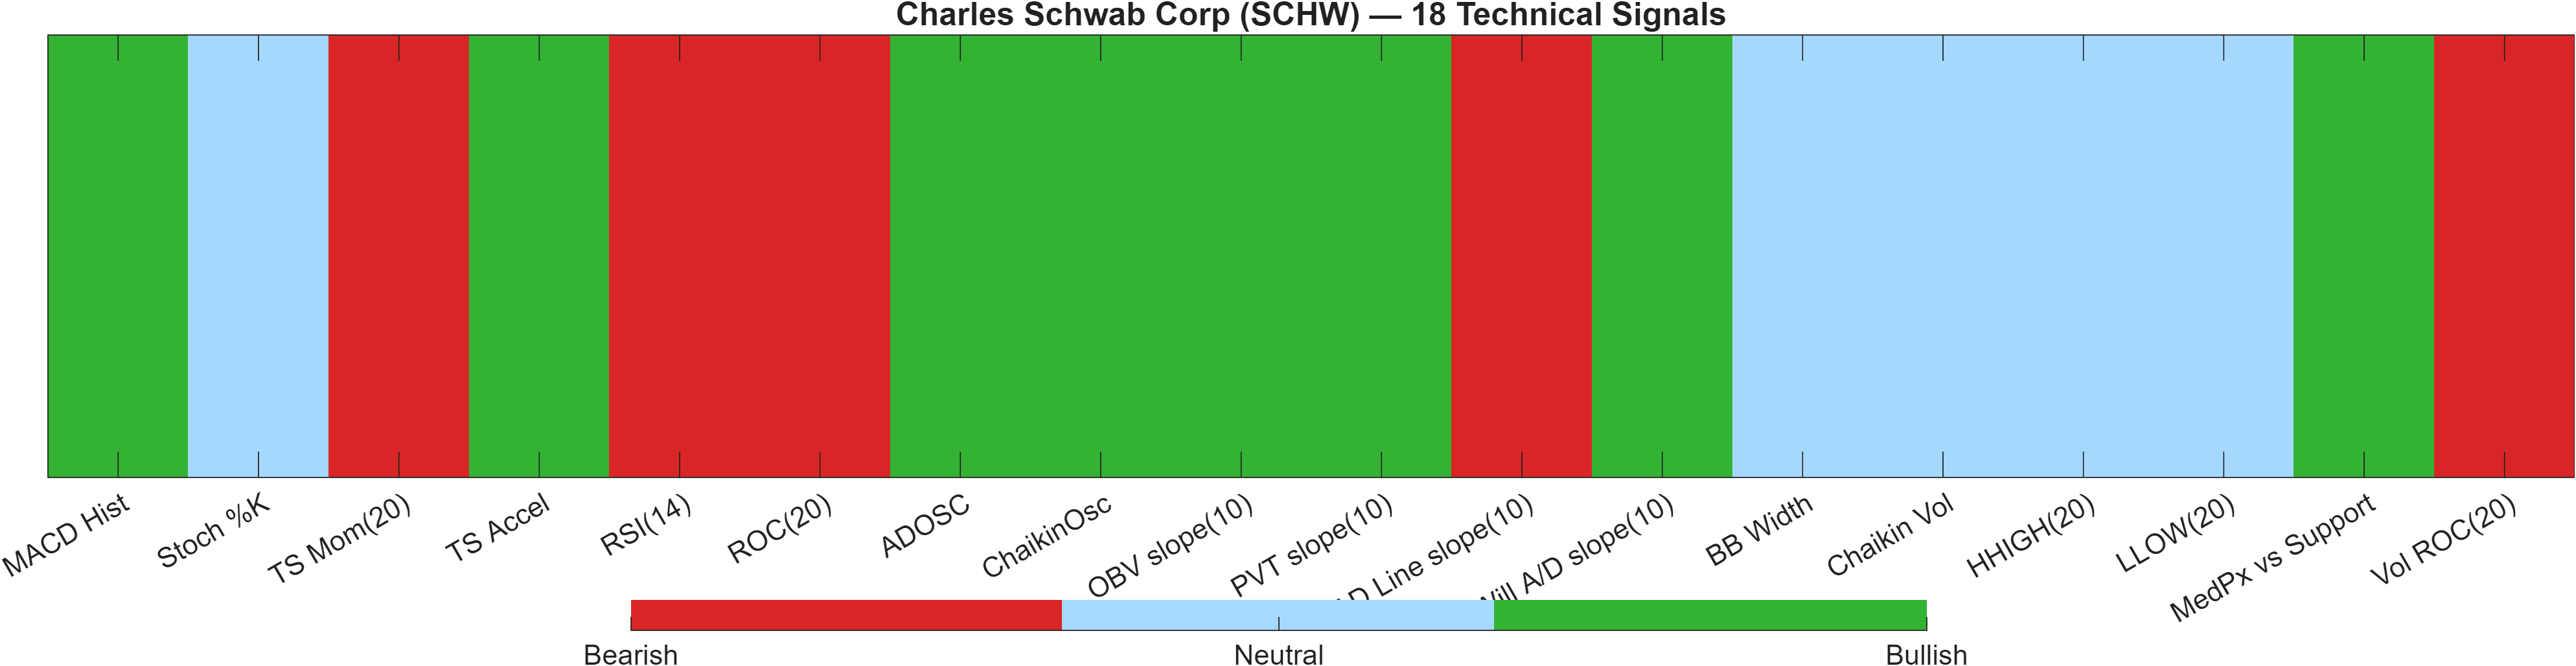
The technical dashboard highlights a key internal tension: the DRL technical rank is #405 with a Bullish label and score 0.608, while the broader 18-signal confluence remains 0.167 (Neutral) and the blended overall technical score is 0.299 (Neutral). This configuration can occur when a learning-based model identifies improving pattern geometry earlier than classical indicators fully rotate.
At the component level, there is a visible split between momentum/participation positives and trend/impulse negatives. For example, MACD Hist 0.2112, ADOSC 72.79, and a positive OBV slope(10) of 2.988e+07 all lean constructive, consistent with buying pressure or accumulation characteristics in parts of the tape. Against that, RSI(14) 42.29, ROC(20) -1.471, and TS Mom(20) -1.403 anchor the bearish side, suggesting the recovery impulse has not yet overpowered the prior drift.
The blended score breakdown—Bull 8 / Bear 5 / Neutral 5—supports the idea of a market in transition rather than one with a dominant regime. Additionally, volatility inputs are not sending a strong directional message: BB Width 0.0507 is neutral and consistent with consolidation rather than trend acceleration.
Overall, the dashboard reads as “improving under the surface, but not yet resolved.” For allocation decisions, that typically shifts emphasis toward confirmation at the range boundary rather than extrapolating from any single favorable signal.
Signal table (Bull/Bear/Neutral)
| Indicator | Value | Signal |
|---|---|---|
| MACD Hist | 0.2112 | Bullish |
| Stoch %K | 71.31 | Neutral |
| TS Mom(20) | -1.403 | Bearish |
| TS Accel | 2.453 | Bullish |
| RSI(14) | 42.29 | Bearish |
| ROC(20) | -1.471 | Bearish |
| ADOSC | 72.79 | Bullish |
| ChaikinOsc | 7.576e+05 | Bullish |
| OBV slope(10) | 2.988e+07 | Bullish |
| PVT slope(10) | 1.254e+05 | Bullish |
| AD Line slope(10) | -1.864e+06 | Bearish |
| Will A/D slope(10) | 2 | Bullish |
| BB Width | 0.0507 | Neutral |
| Chaikin Vol | -29.75 | Neutral |
| HHIGH(20) | 96.84 | Neutral |
| LLOW(20) | 90.51 | Neutral |
| MedPx vs Support | 1.382 | Bullish |
| Vol ROC(20) | -33.27 | Bearish |
Interpretation: Indicator-level signals form the base confluence, which is then adjusted using a separate AI-driven technical ranking model. The final technical score summarizes this combined view.
6) News sentiment + extractive gist
Sentiment score (avg): 0.104 | Positive: 25% | Neutral: 75% | Negative: 0%
KGNAI AI News Sentiment Score (normalized -1 to +1): 0.97 (as of 2026-03-19) | Label: Bullish | Overall news score: 0.91
Positive Developments
Recent coverage across major financial outlets indicates a generally constructive narrative around Schwab’s operating momentum and client activity. The dominant positive theme centers on client asset gathering and engagement, with figures cited such as US$32.50 billion in core net new assets (and US$50.00 billion on an adjusted basis) alongside 395,000 new brokerage accounts. Commentary also references an updated view pointing to an estimated ~16% first-quarter revenue growth acceleration year over year, reinforcing the idea that platform scale and client participation are supporting near-term business cadence. As a sentiment input, this aligns with the model’s strong normalized score (0.97) and helps explain why the news layer is markedly more constructive than the otherwise neutral technical blend (0.299).
Neutral / Mixed Developments
A second cluster of items is informational rather than directional, including corporate scheduling and valuation-oriented commentary. The announcement of a Spring Business Update (scheduled for Thursday, April 16th) tends to be interpreted as a transparency and communications event, but it does not, by itself, resolve the technical question implied by bearish moving-average alignment. Separately, the valuation and performance discussion highlights that price behavior has been mixed across different windows, which is consistent with the report’s neutral rank posture across horizons (e.g., weekly #563 versus daily #1359). In aggregate, this “informational” category supports a contextual bias without providing a decisive catalyst signal.
Negative / Risk Signals
Despite the absence of explicitly negative items in the sentiment distribution (Negative: 0%), the risk framing in coverage still acknowledges uneven share performance and the possibility of expectation-sensitive reactions around upcoming communications. When news tone is constructive but price remains constrained by trend filters (Close vs MA50 = Bearish; MA50 vs MA200 = Bearish), the primary risk is a sentiment–price disconnect: optimistic narratives can fade if price fails to confirm through resistance (105.5000) or if participation does not improve (e.g., Vol ROC(20) -33.27). From a market-structure standpoint, the most relevant “negative” signal is not a headline, but the potential for disappointment if improving narratives do not translate into follow-through at the key levels.
- Whether price can sustain acceptance above 105.5000 with improving participation.
- Whether downside probes hold above 92.0883 (range integrity).
- Whether momentum improves with RSI recovering from 42.29 while MACD hist remains positive (0.2112).
Sources referenced: Reuters, Bloomberg, Yahoo Finance, MarketWatch, Investing.com
7) Sources
Source links are provided in the original data feed. This report aggregates the news layer into a structured sentiment digest and does not reproduce headline lists.
Snapshot: AI Rank (Short–Mid–Long): Neutral (Neutral–Neutral–Neutral) · Technical Confluence: Neutral · Key Levels: Support ~92.09 | Resistance ~105.50 · News Sentiment: Neutral
You may also like: How KGNAI AI ranks instruments across global markets
Disclaimer: KGNAI provides AI-generated analytics and educational market commentary only. This is not financial advice. Markets involve risk. Always do your own research.