
VRSK (Verisk Analytics Inc) — 12-Apr-2026 Technicals Diverge From Longer-Horizon Ranks
Verisk Analytics Inc (VRSK) enters 12-Apr-2026 with a notable cross-signal split: KGNAI’s longer-horizon positioning remains strong (including a 3-month rank of #21 and a 6-month rank of #31 out of 2063), while the near-term technical stack is skewed bearish. The moving-average structure is negative (Close vs MA50 = Bearish; MA50 vs MA200 = Bearish), and momentum metrics show downside pressure with RSI(14) at 16.91 and MACD histogram at -1.9498. Volatility, however, is not extreme: Bollinger bandwidth is 0.1941, consistent with a market that may be in a transitional phase rather than a resolved trend. Key decision zones are well-defined at support ~175.4300 and resistance ~215.1550. News sentiment is constructive in aggregate (avg 0.120; 45% positive; 3% negative), adding a mild positive bias but not replacing price confirmation.
- Rank stance: Short-term Bearish | Mid-term Bullish | Long-term Bullish
- Technical confluence: Overall Technical Score -0.610 Bearish (Bear 13 / Neutral 2 / Bull 3)
- Key levels: Support ~175.4300 | Resistance ~215.1550
- News sentiment bias: Mildly constructive (avg 0.120) with a bullish normalized score of 1.00 (as of 2026-04-09)
- Confirmation / invalidation: A break above 215.1550 with volume supports continuation; a close below 175.4300 raises deterioration risk.
KGNAI evaluates assets using large cross-sectional datasets built from millions of structured data points. Inputs incorporate fundamental metrics, technical structures, and systematically processed news sentiment. Statistical models, machine learning, and AI frameworks are used to assess relative positioning, signal alignment, and probabilistic behavior across broad universes.
- Ranks are comparative across the tracked universe, not absolute price targets.
- Confluence reflects alignment among independent signal groups.
- Support/resistance levels are probabilistic decision zones, not guarantees.
- Sentiment provides contextual bias within the broader analytical framework.
1) KGNAI AI Analysis
Region: USA
Total universe size: 2063 ranked instruments
- Daily rank: #49 out of 2063 — Bullish
- Weekly rank: #1945 out of 2063 — Bearish
- Monthly rank: #95 out of 2063 — Bullish
- 3-Monthly rank: #21 out of 2063 — Bullish
- 6-Monthly rank: #31 out of 2063 — Bullish
- Yearly rank: #45 out of 2063 — Bullish
VRSK’s rank profile is best described as timeframe-fragmented. On one side, the multi-month and yearly ranks sit in the upper decile of the 2063-name universe (notably #21 at 3 months, #31 at 6 months, and #45 yearly), which is consistent with persistent longer-horizon strength versus peers. On the other side, the weekly rank at #1945 places the stock in the lower tail, flagging near-term behavior that has deteriorated materially relative to the same universe.
The daily rank (#49) and monthly rank (#95) returning to bullish territory suggests the recent weakness has not fully displaced the broader relative positioning. Still, the gap between weekly (#1945) and 3-month (#21) is large enough to treat current conditions as a regime test rather than a clean continuation. In KGNAI terms, that often appears when short-term flow/positioning pressures collide with more stable medium-term factors that had previously supported relative performance.
The provided term view frames this explicitly: Short-term Bearish against Mid-term Bullish and Long-term Bullish. For decision-making, this configuration typically places more weight on confirmation from price structure and breadth-style signals (e.g., volume behavior) before assuming the longer-horizon ranks will reassert control. Absent confirmation, the weekly rank warns that near-term distribution can still dominate day-to-day outcomes even while longer-horizon ranks remain constructive.
KGNAI ranks each instrument across large universes using multiple proprietary AI tests and statistical models (millions of data points). Lower ranks generally indicate stronger probability of favorable performance behavior, while higher ranks indicate weaker probability and more bearish positioning.
Term view: Short-term: Bearish. Mid-term: Bullish. Long-term: Bullish.
Want the full universe and complete rank tables? Unlock full access on KGNAI: https://www.kgnai.com/pricing
2) Price & trend overview
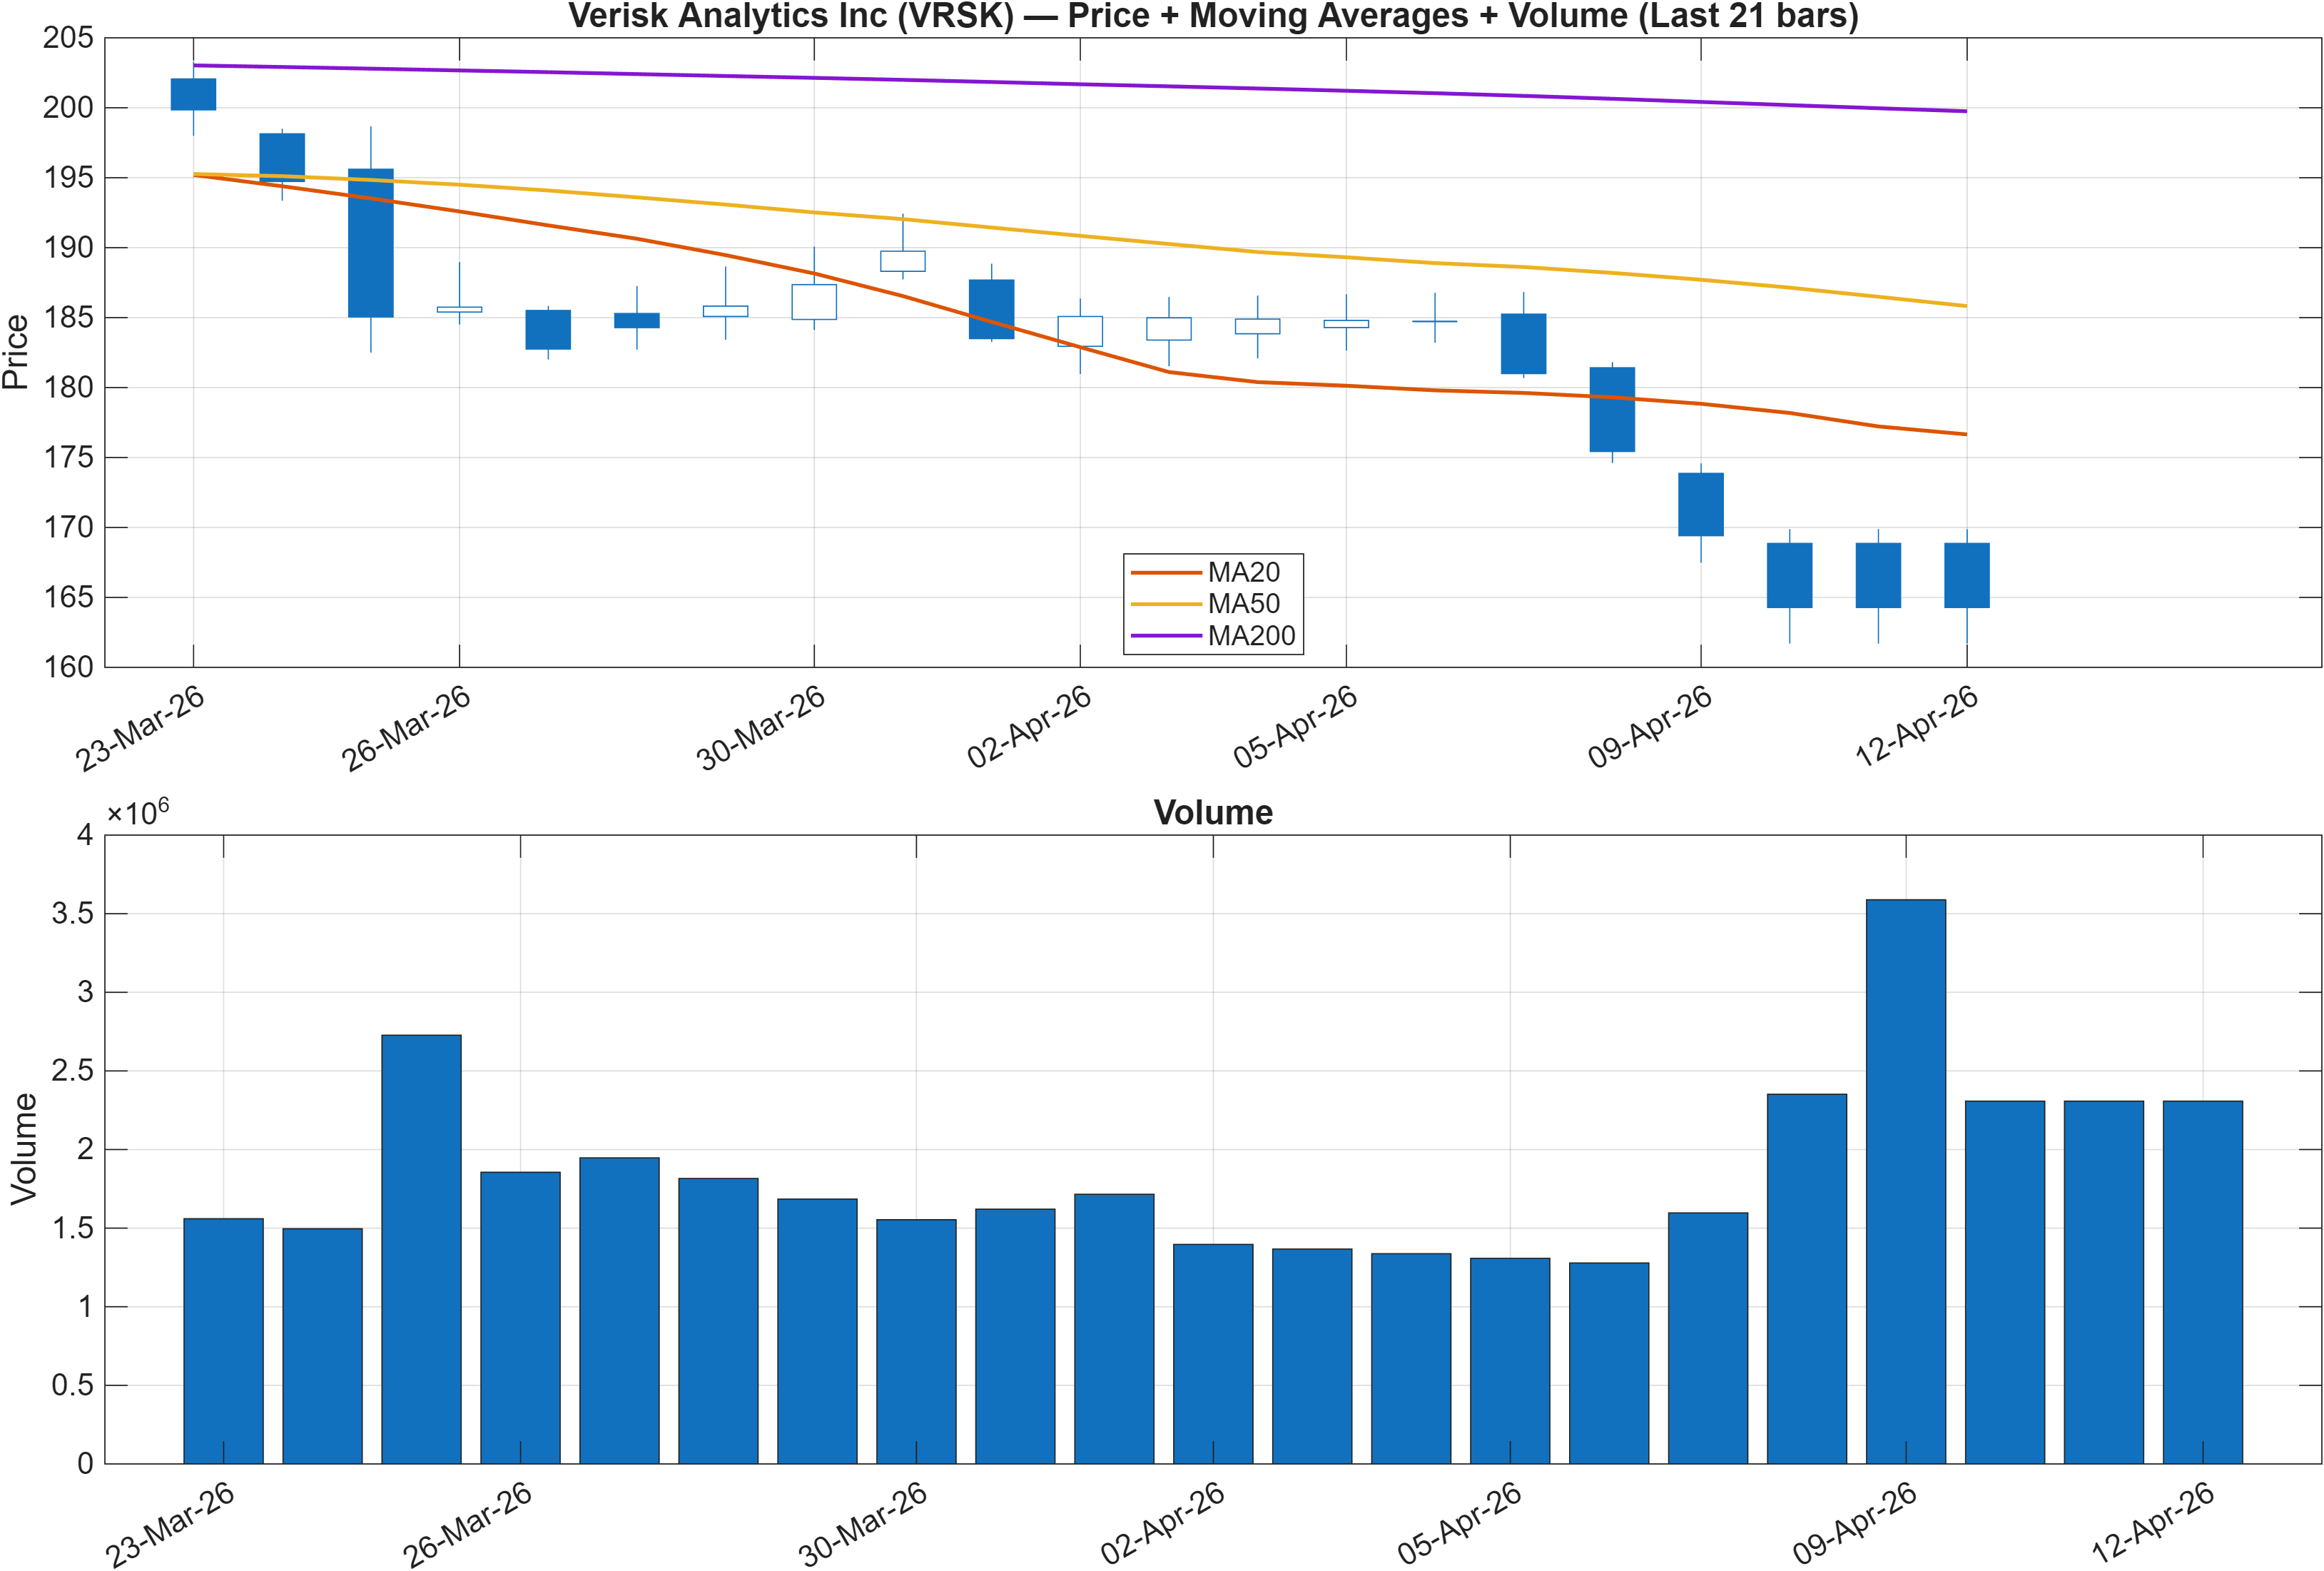
The trend stack is currently positioned as a headwind rather than support. The read-through from the chart is unambiguous: Close vs MA50 = Bearish and MA50 vs MA200 = Bearish. This combination typically indicates that recent price action remains below an intermediate trend measure while the intermediate trend is also below the longer-term benchmark—an arrangement associated with trend fragility and slower mean reversion.
Importantly, this bearish moving-average structure coexists with strong longer-horizon KGNAI ranks (e.g., #21 at 3 months and #45 yearly). That divergence suggests the market is not simply “risk-off” for the asset on all horizons; instead, the price trend has weakened enough that it can temporarily mask—or delay—the expression of the longer-horizon relative positioning. In practice, this makes timing the central issue: without a reclaim of the MA50 (implied by the close/MA50 relationship turning), longer-horizon ranks may remain supportive but not immediately actionable.
The scenario language elsewhere in the report reinforces the same concept using levels: a break above 215.1550 is framed as continuation, while a close below 175.4300 increases deterioration risk. With the moving averages already bearish, the market generally demands clear evidence of reversal—either through a breakout above resistance, or through repeated defenses of support accompanied by improved momentum (covered in the RSI/MACD panel).
In short, the current trend map places VRSK in a recovery attempt context rather than an already-established uptrend. That distinction matters because it increases sensitivity to confirmation signals (volume, momentum stabilization) and reduces tolerance for failed rallies back into overhead supply near the 215.1550 zone.
Interpretation: Close vs MA50 = Bearish, MA50 vs MA200 = Bearish.
3) Momentum & volatility dashboard
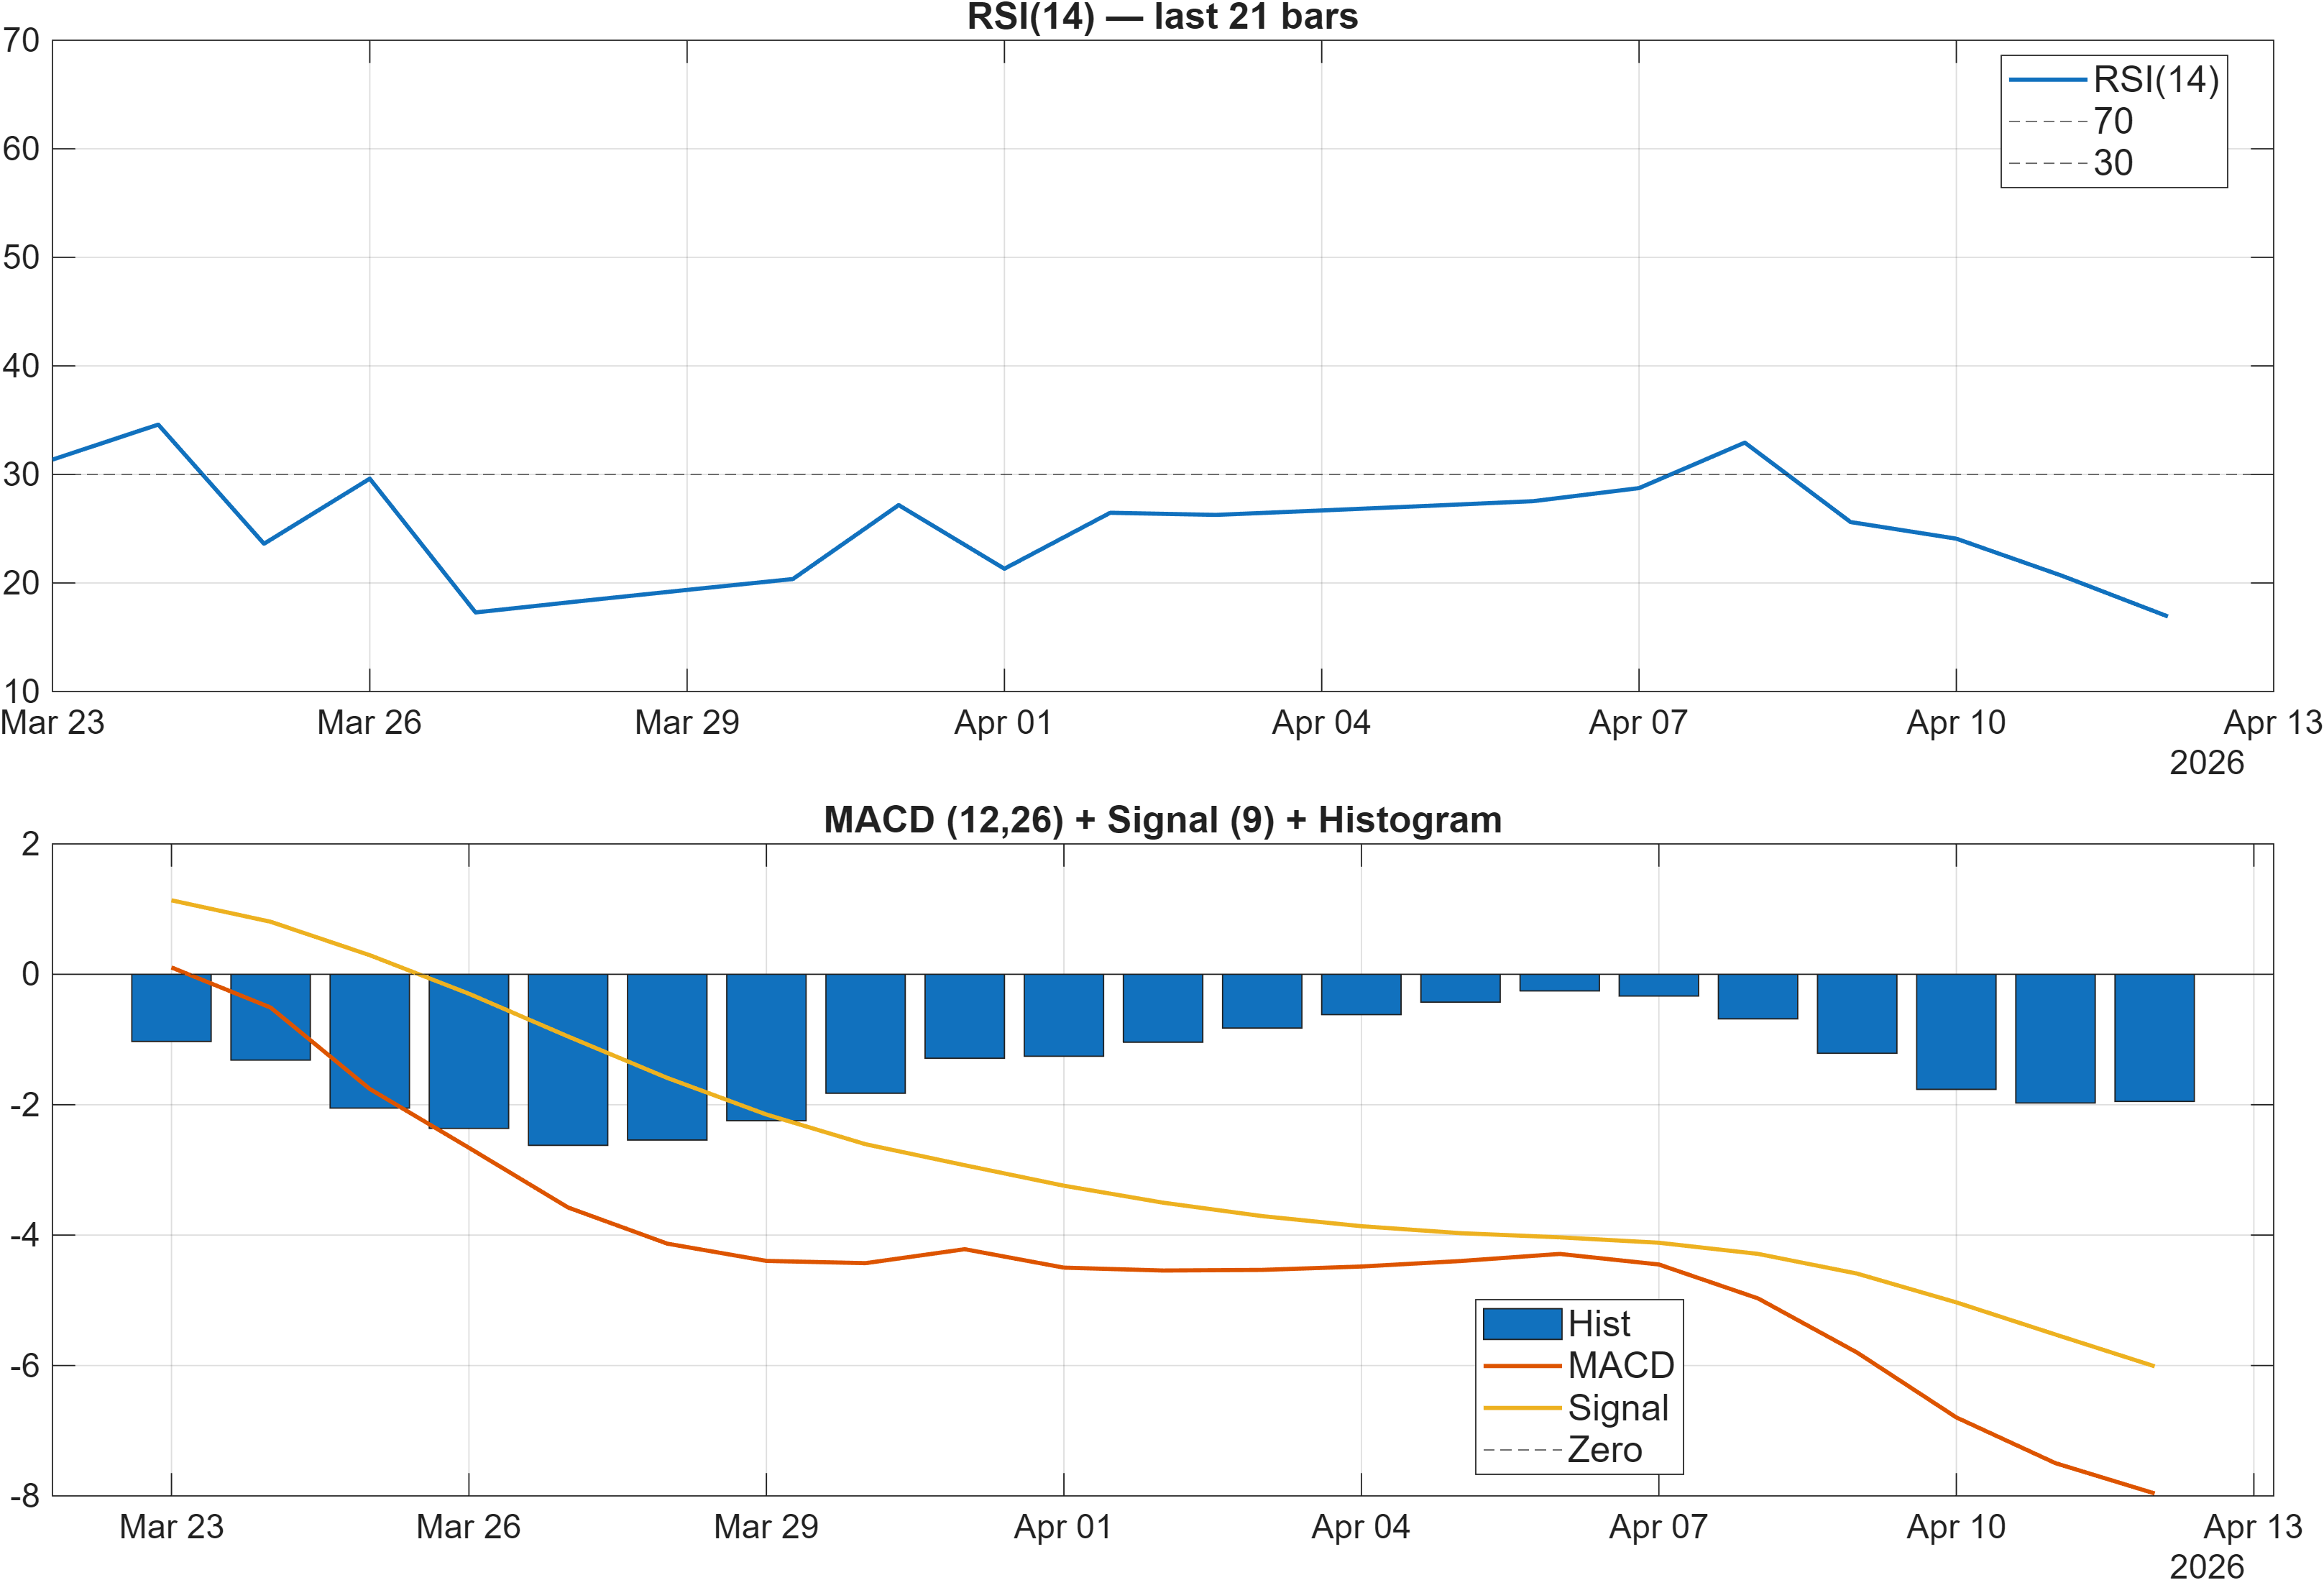
Momentum is the clearest point of weakness in the current snapshot. RSI bias is labeled bearish, and the specific reading of RSI(14) = 16.91 sits at a deeply depressed level, consistent with sharp downside momentum and limited immediate bullish traction. At the same time, the MACD histogram at -1.9498 indicates negative momentum persists on a trend-following basis, reinforcing that downside pressure has not yet resolved into a stable base.
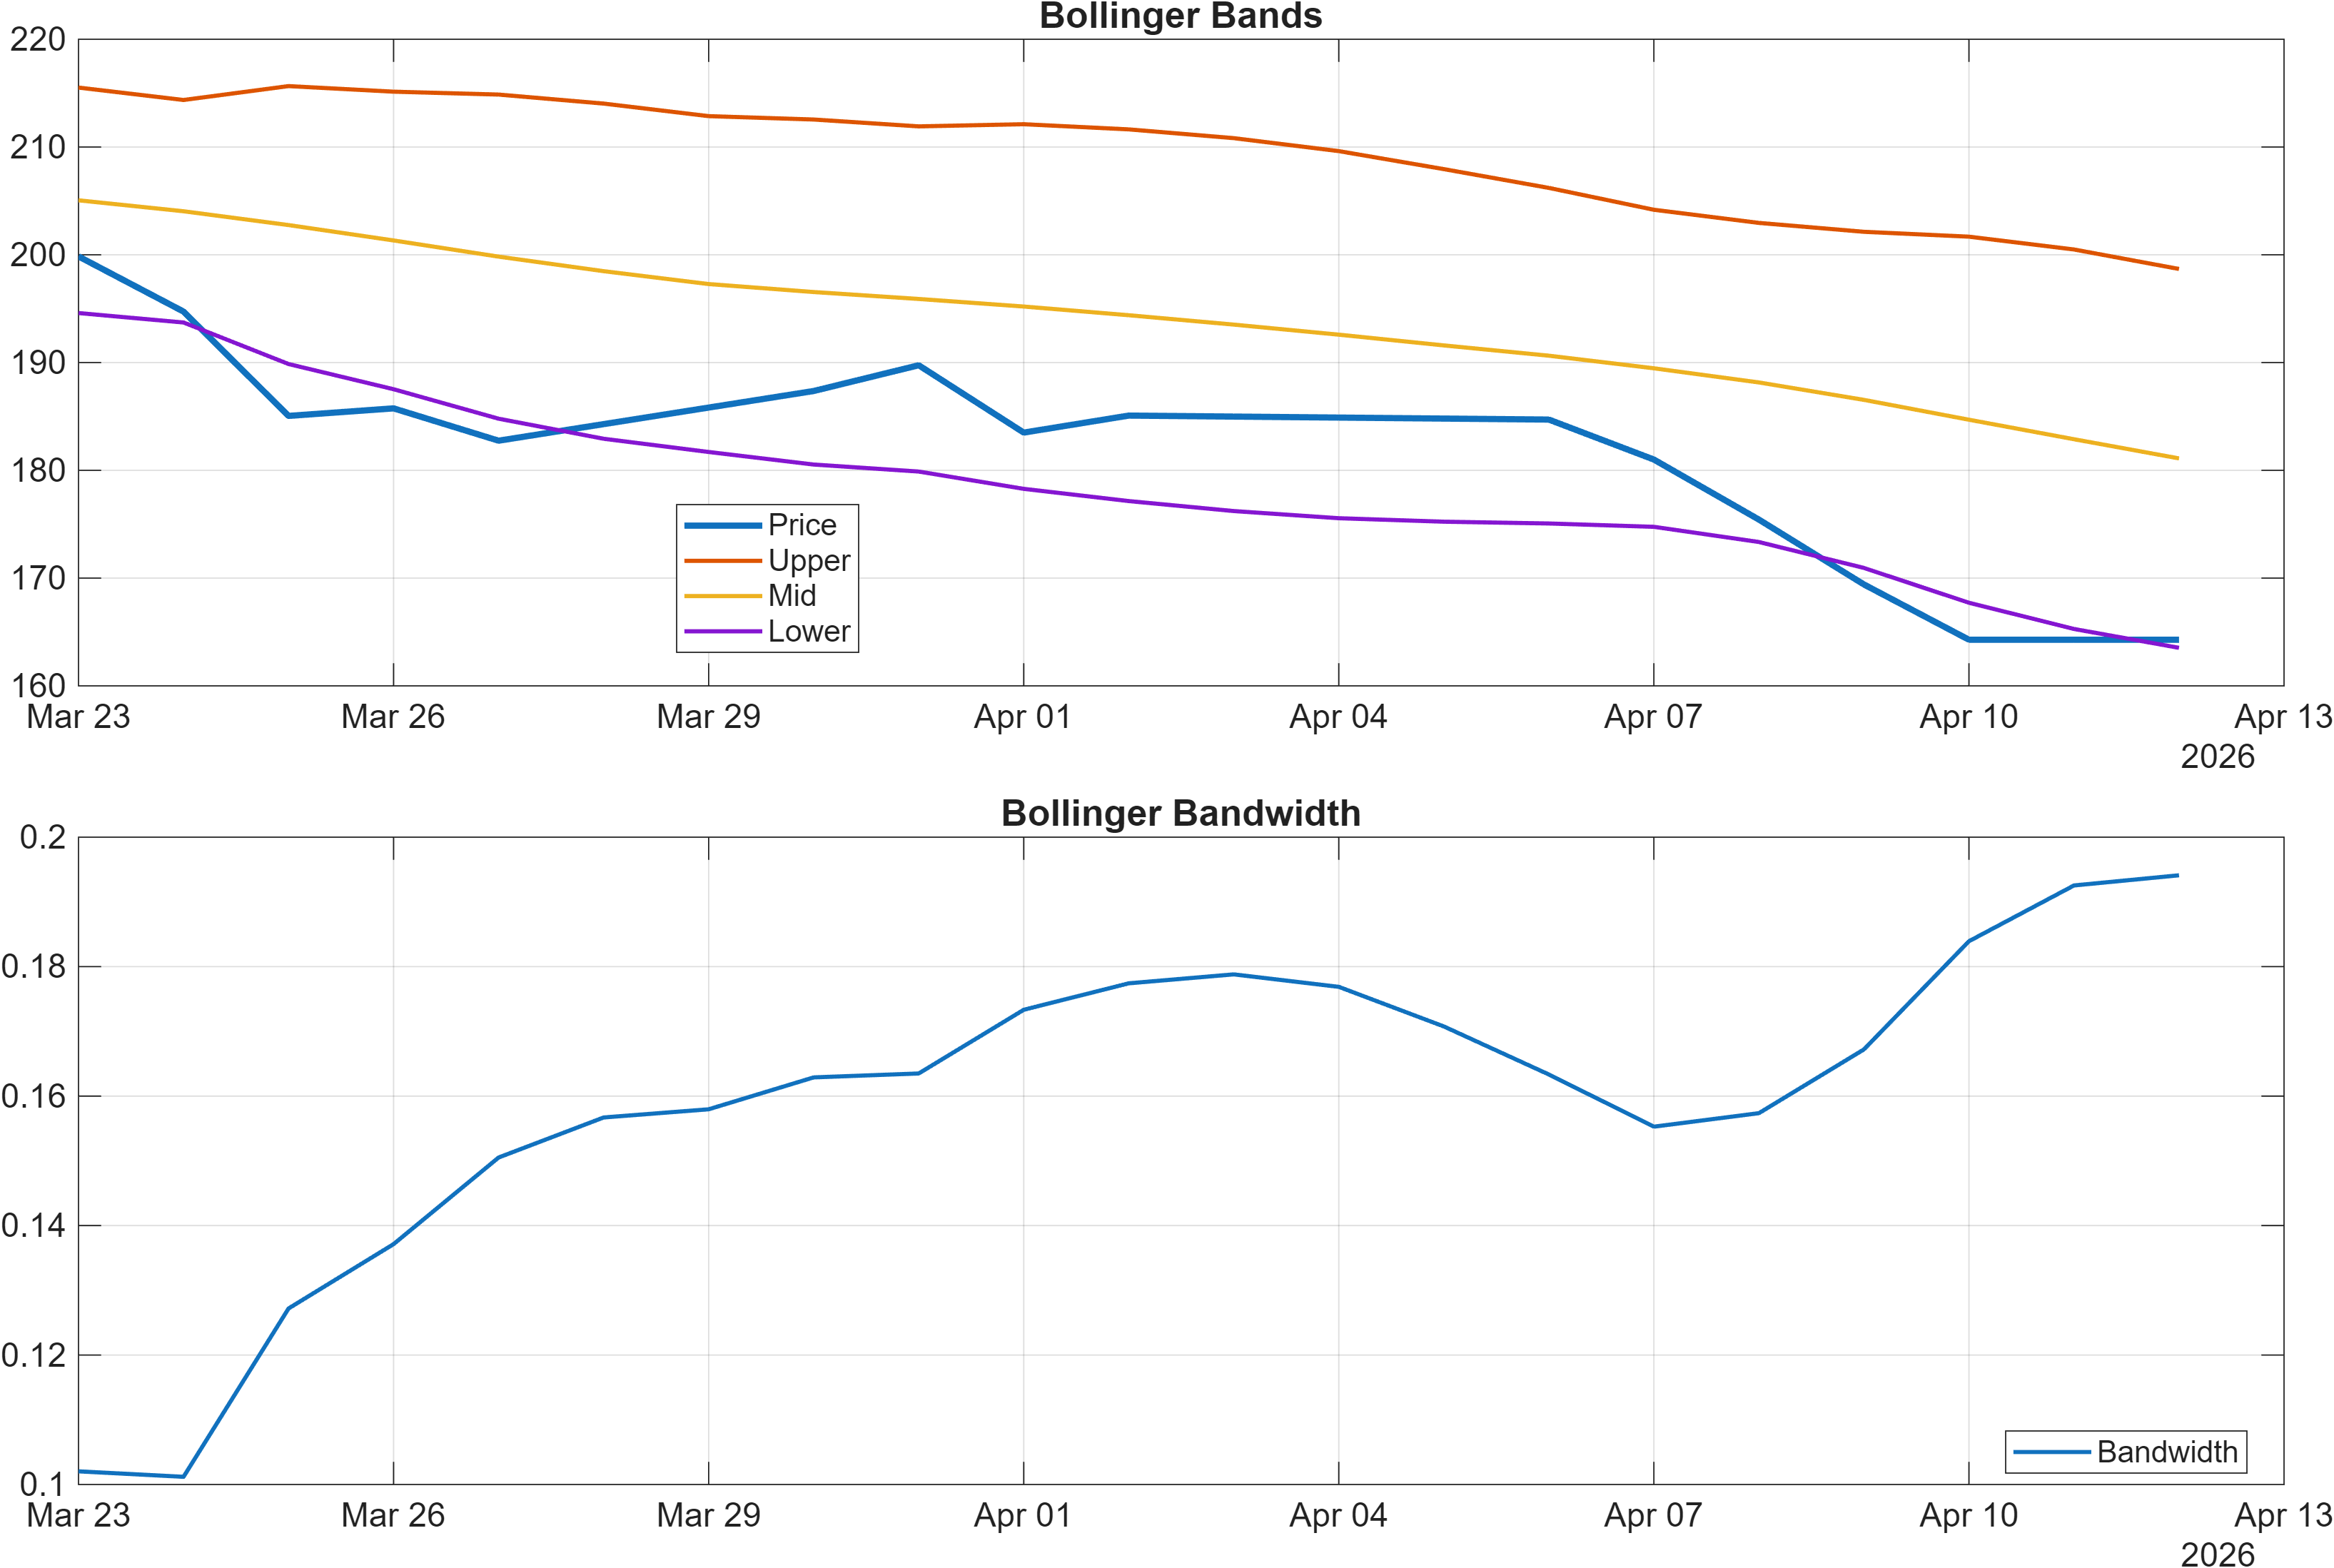
The interaction between RSI and MACD matters. An extremely low RSI can coincide with late-stage selling pressure, but without improvement in MACD histogram, conditions can remain “oversold” longer than expected. This is where volatility context becomes critical: Bollinger bandwidth is 0.1941, and the bandwidth signal is not flagged as an extreme expansion regime. That suggests the market is not necessarily in a fully panicked volatility state; rather, momentum weakness is present inside a volatility profile that may still allow for mean-reversion attempts—provided price can hold structure.
A secondary detail from the 18-signal dashboard aligns with this view: Stoch %K = 10.26 is flagged bullish, which often occurs when short-cycle oscillators begin to bottom even while broader momentum remains negative. In isolation that is insufficient, but as a timing input it can indicate the early phases of stabilization—especially if accompanied by improving volume behavior or repeated defenses of nearby support.
Net: momentum is still pointing down (RSI 16.91; MACD hist -1.9498), but volatility is not presenting as an uncontrolled expansion (bandwidth 0.1941). That combination usually raises the bar for declaring a reversal while leaving room for a rebound attempt if subsequent sessions confirm with stronger breadth and price reclaiming key levels.
Interpretation: RSI bias = Bearish, MACD hist = -1.9498.
Interpretation: Bandwidth (volatility regime) latest = 0.1941.
4) Support / Resistance zones
Support ~ 175.4300 | Resistance ~ 215.1550
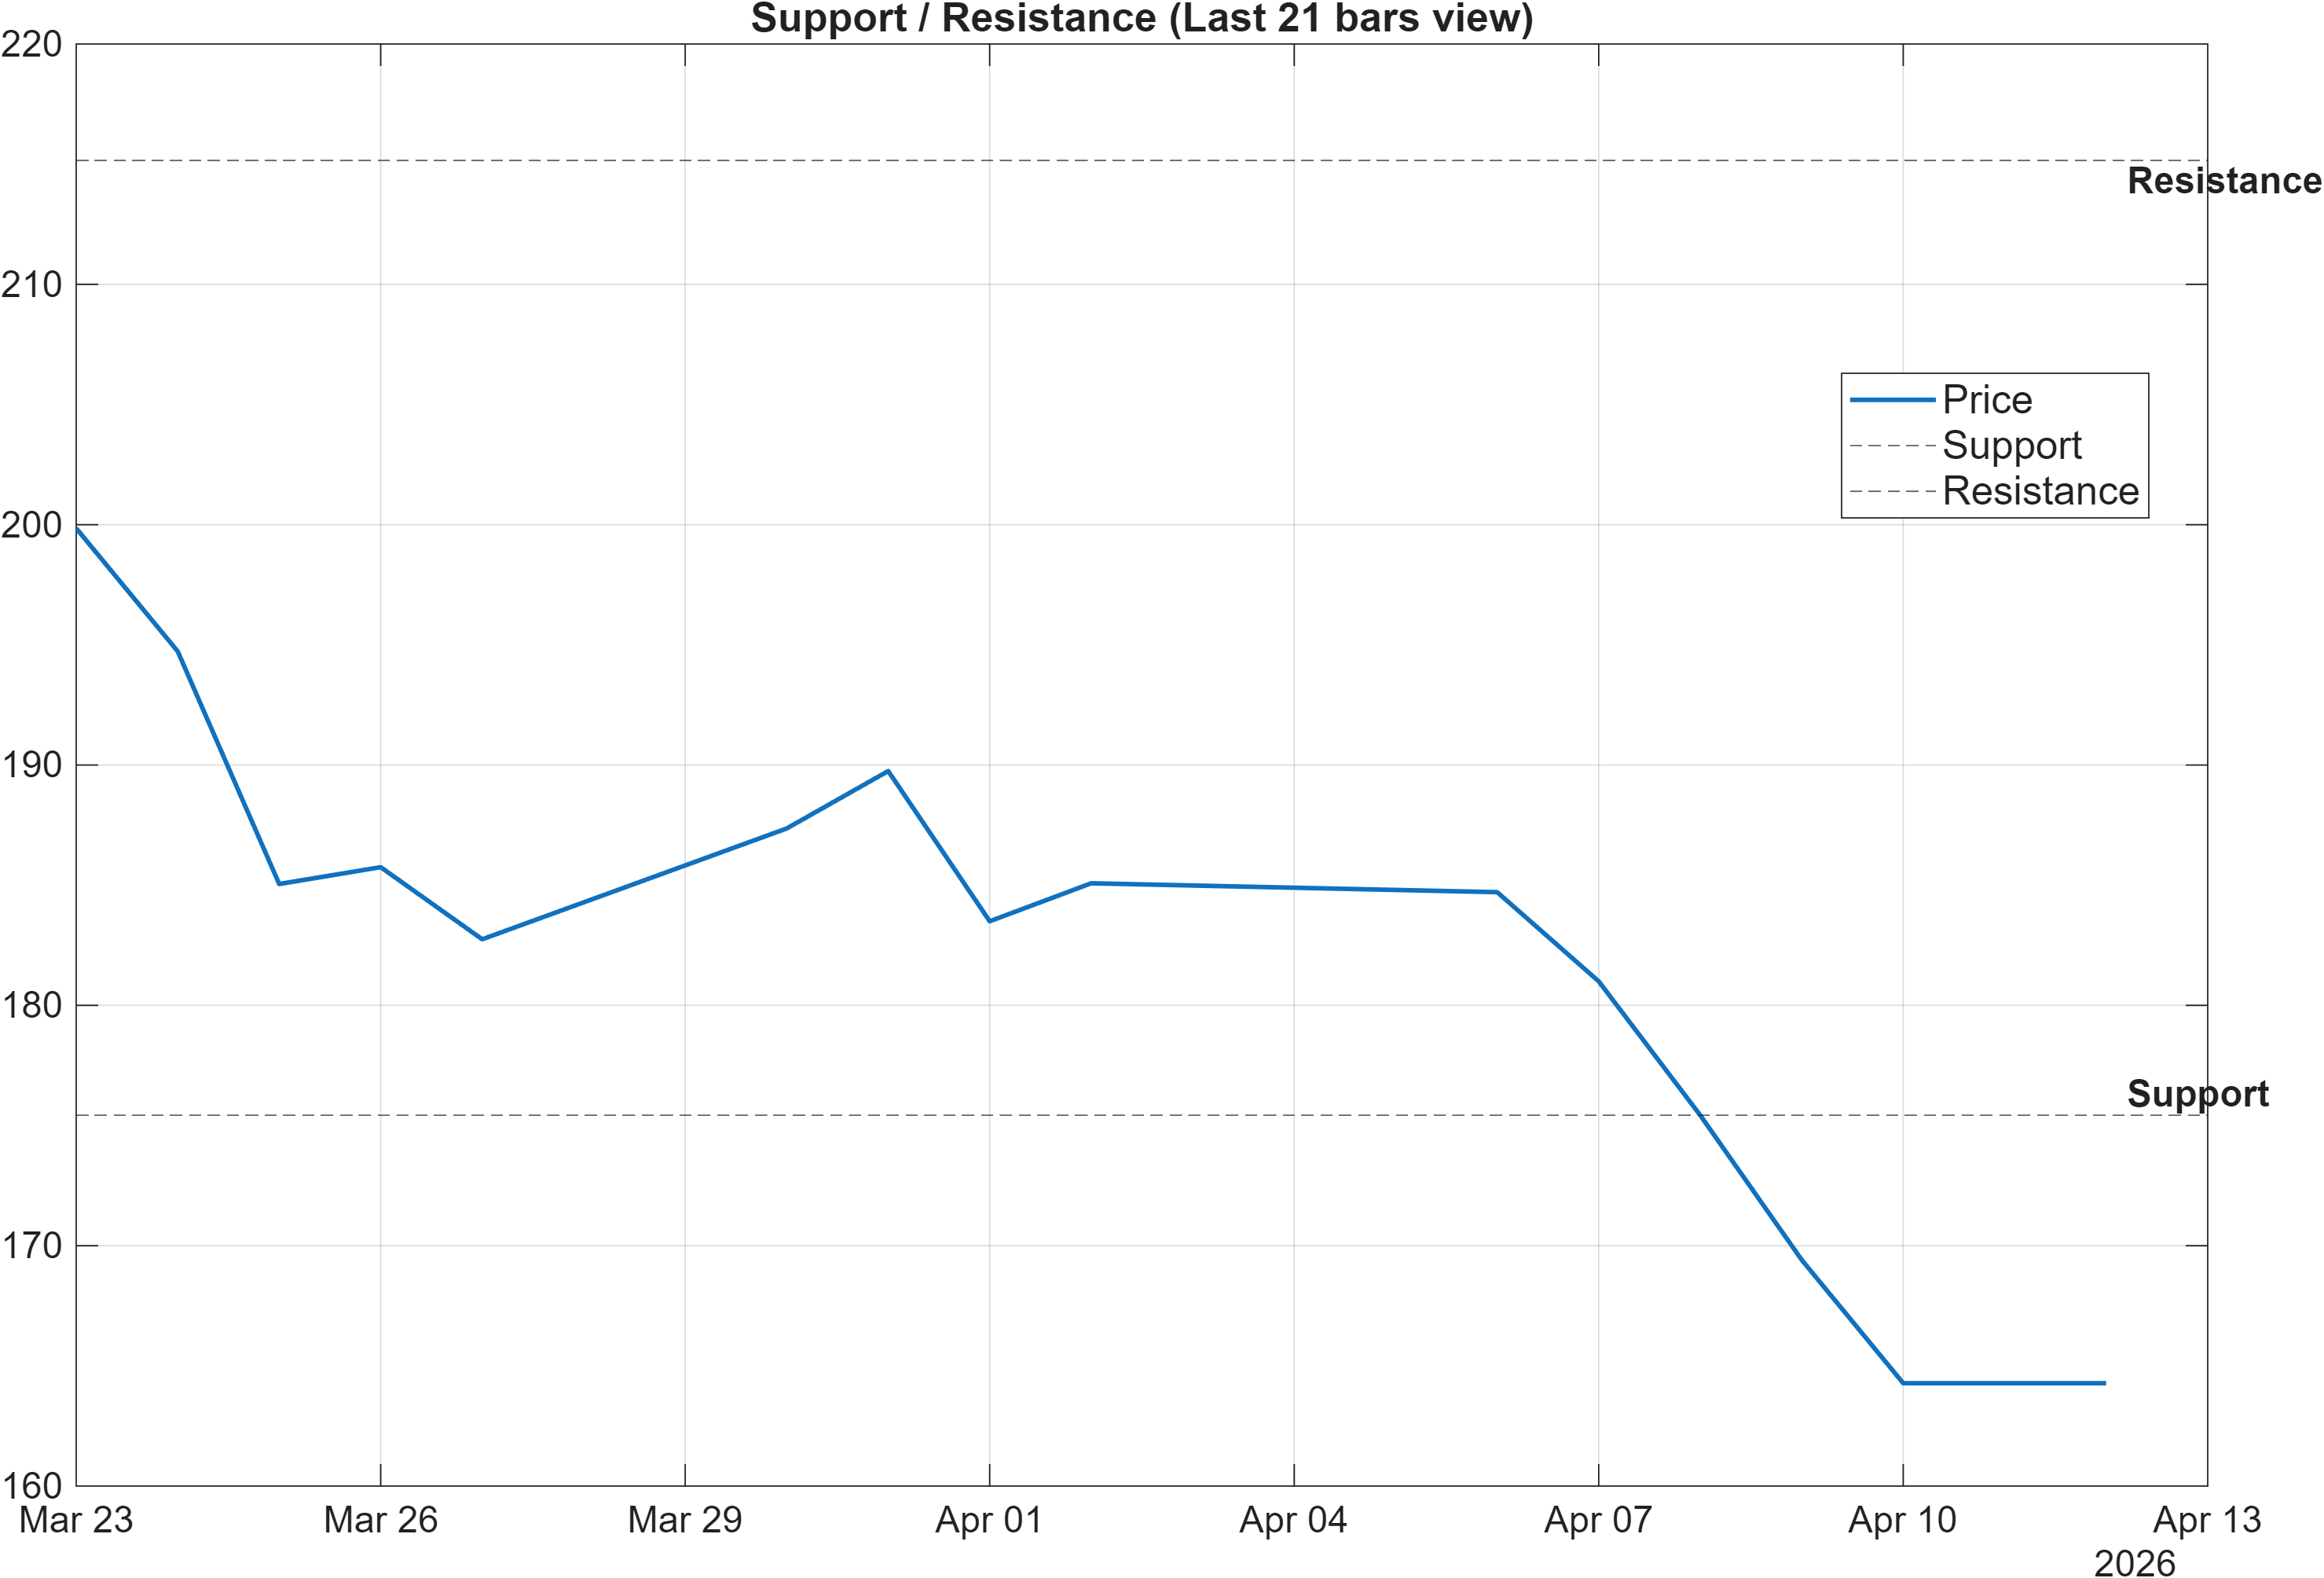
The current level map is clean and widely spaced: 175.4300 is the key support reference, while 215.1550 defines the primary resistance ceiling. With moving averages bearish and momentum depressed (RSI 16.91; MACD histogram -1.9498), these zones take on added importance because they offer objective checkpoints for distinguishing stabilization from further trend damage.
Support at 175.4300 functions as the nearer-term “risk boundary.” A close below that level is explicitly framed as deterioration risk, which is consistent with the broader dashboard: the 18-signal blend is already bearish (overall technical score -0.610), so losing support would align price structure with the bearish confluence and could reduce the relevance of the otherwise strong 3–12 month ranks. In other words, a support break would resolve the current divergence in the bearish direction.
Conversely, resistance at 215.1550 acts as the “re-acceptance” threshold for the bullish longer-horizon thesis. The scenario view indicates that a break above resistance with volume supports continuation. That conditional phrasing is important: the signal table includes a bullish Vol ROC(20) = 54.27, implying volume dynamics have shown recent acceleration, but multiple accumulation/distribution slopes remain bearish (e.g., OBV slope and AD line slope are flagged bearish). As a result, the market likely requires not just a price move above 215.1550, but confirmation that participation quality has improved.
With Bollinger bandwidth at 0.1941 (not extreme), the most actionable framing is that VRSK is currently defined by range-based decision geometry: downside invalidation at 175.4300, upside confirmation at 215.1550, and a large “in-between” area where indicator conflict can persist. Until one of these zones is resolved, the signal set remains mixed by construction.
Scenario view: Break above resistance with volume → continuation. Close below support → signal deterioration risk.
5) Quant Technical Dashboard (18 Signals)
KGNAI AI Technical Analysis Score (Deep Reinforcement Learning): Rank #1792 out of 2063 (Rank 1 represents the strongest technical positioning and a higher probability of favorable price behavior. As ranks increase toward the maximum, the probability of favorable outcomes weakens and bearish positioning becomes more dominant.) | Label: Bearish | Score: -0.737
18-Signal Technical Confluence Score: -0.556 (Bearish)
Overall Technical Score (18-signal confluence + DRL rank blend): -0.610 (Bearish)
Note: The blended score reflects signal strength weighted against broader AI technical ranking, which may temporarily diverge.
Blended technical score breakdown: -0.610 (Bearish | Bull 3 / Bear 13 / Neutral 2)
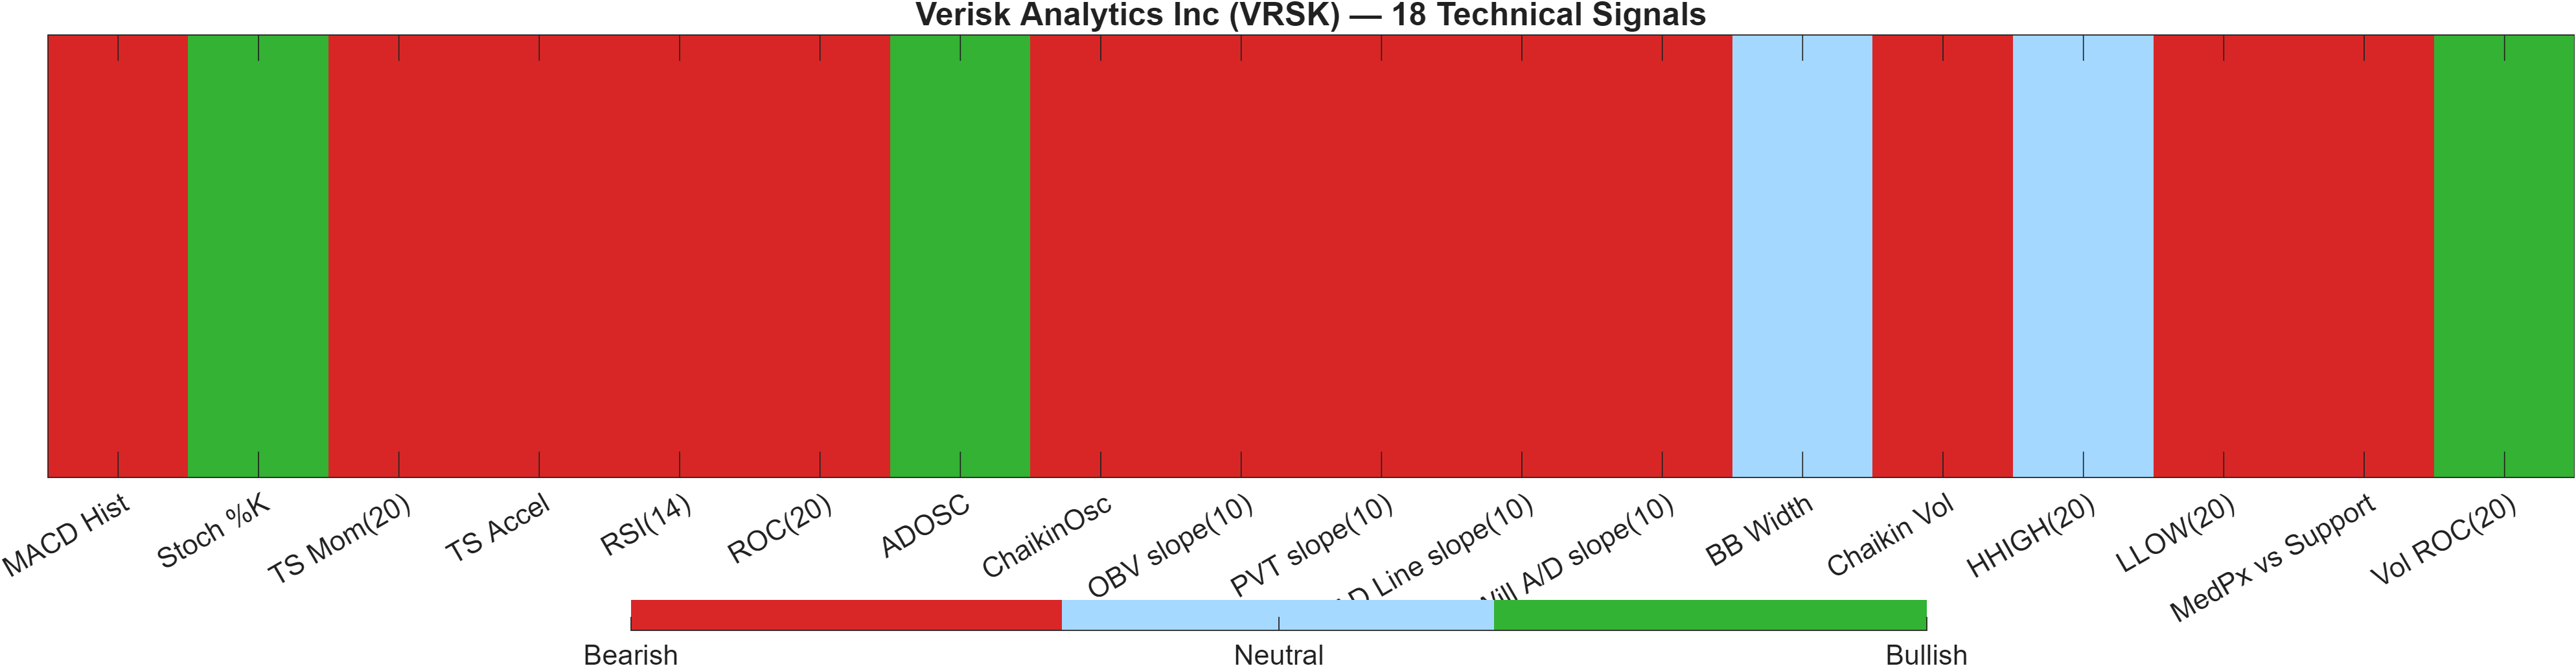
The dashboard consolidates two independent technical viewpoints: an 18-signal confluence layer and a Deep Reinforcement Learning (DRL) technical rank. Both are currently aligned to the downside. The DRL technical rank is #1792 out of 2063 with a score of -0.737, placing VRSK in the weaker segment of the universe on this specific technical model. The 18-signal confluence score is -0.556, and the blended overall technical score is -0.610—also bearish.
Breadth across indicators is the key message: 13 bearish signals versus 3 bullish and 2 neutral. That skew suggests the bearish call is not being driven by a single outlier; it is distributed across multiple categories (trend/momentum, rate-of-change, and several volume-derived measures). The signal table offers a few representative anchors: MACD Hist = -1.95 and RSI(14) = 16.91 align with negative momentum; TS Mom(20) = -30.45 and ROC(20) = -15.64 are consistent with weak medium-short lookback performance.
Signal balance: where the disagreement sits
The bullish subset is concentrated in more tactical inputs: Stoch %K = 10.26 (bullish), ADOSC = 22 (bullish), and Vol ROC(20) = 54.27 (bullish). This is a common pattern during attempted bottoms—early-cycle oscillators and select volume impulses improve before broader trend/momentum measures flip. However, several volume/accumulation slopes remain bearish, indicating that participation quality may not yet be consistently supportive.
The two neutral readings—BB Width = 0.1941 and HHIGH(20) = 198.7—suggest volatility is not offering a strong directional tell and that recent highs are not acting as a clear bullish trigger. With the blended score at -0.610 and the DRL rank deep in the lower portion of the universe, the technical picture remains bearish until price behavior meaningfully improves relative to resistance and/or the momentum suite begins to normalize.
Signal table (Bull/Bear/Neutral)
| Indicator | Value | Signal |
|---|---|---|
| MACD Hist | -1.95 | Bearish |
| Stoch %K | 10.26 | Bullish |
| TS Mom(20) | -30.45 | Bearish |
| TS Accel | -13.96 | Bearish |
| RSI(14) | 16.91 | Bearish |
| ROC(20) | -15.64 | Bearish |
| ADOSC | 22 | Bullish |
| ChaikinOsc | -2.767e+06 | Bearish |
| OBV slope(10) | -1.514e+07 | Bearish |
| PVT slope(10) | -3.001e+05 | Bearish |
| AD Line slope(10) | -6.666e+06 | Bearish |
| Will A/D slope(10) | -30.96 | Bearish |
| BB Width | 0.1941 | Neutral |
| Chaikin Vol | 24.61 | Bearish |
| HHIGH(20) | 198.7 | Neutral |
| LLOW(20) | 161.7 | Bearish |
| MedPx vs Support | -9.64 | Bearish |
| Vol ROC(20) | 54.27 | Bullish |
Interpretation: Indicator-level signals form the base confluence, which is then adjusted using a separate AI-driven technical ranking model. The final technical score summarizes this combined view.
6) News sentiment + extractive gist
Sentiment score (avg): 0.120 | Positive: 45% | Neutral: 52% | Negative: 3%
KGNAI AI News Sentiment Score (normalized -1 to +1): 1.00 (as of 2026-04-09) | Label: Bullish | Overall news score: 0.94
Positive Developments
Recent coverage across major financial outlets indicates a moderately constructive news backdrop for Verisk Analytics, with the data showing 45% positive items versus only 3% negative. The normalized KGNAI news sentiment score registers 1.00 (as of 2026-04-09) and the overall news score is 0.94, implying that the language tone and extracted context have leaned supportive. The themes appearing in coverage are consistent with capital-allocation and positioning narratives (including commentary around buyback activity) and routine company-event visibility (such as scheduled reporting communications). From a market-structure perspective, this type of sentiment profile often acts as a stabilizer when technicals are weak: it can reduce the probability of persistent negative drift if incremental headlines remain benign. Still, sentiment is best treated as contextual bias rather than a timing tool, particularly while the technical confluence remains bearish at -0.610.
Neutral / Mixed Developments
The distribution is dominated by neutral coverage (52%), which suggests the information flow is currently more about updates, comparisons, and calendar items than new directional catalysts. In this environment, price tends to lean more heavily on technical structure—moving averages and momentum—than on narrative repricing. That matters for VRSK because the near-term technical state is already pressured (RSI(14) 16.91; MACD histogram -1.9498), so neutral news may not be sufficient to reverse the tape on its own. The best interpretation is that the news stream is not adding material incremental stress, but it is also not clearly providing a decisive offset to the bearish multi-signal technical stack.
Negative / Risk Signals
The negative share of coverage is low (3%), yet the risk lens remains relevant because the current market picture contains internal contradictions: longer-horizon KGNAI ranks are strong (3-month #21; yearly #45) while the technical dashboard is weak (DRL technical rank #1792; overall technical score -0.610). In such cases, even a small amount of adverse or valuation-focused commentary can have outsized effect if it coincides with technical breakdowns—particularly around the defined support at 175.4300. Another practical risk is event sensitivity: scheduled communications can increase volatility around a stock that is already showing compressed-to-moderate bandwidth (0.1941) and fragile momentum. The key is whether the news flow remains consistent with the current constructive bias, or shifts toward risk framing while price remains below major overhead resistance (215.1550).
- Whether sentiment stays constructive (avg 0.120) as the stock approaches key decision zones (175.4300 / 215.1550).
- Any shift in tone that coincides with momentum stabilization (watch RSI and MACD histogram behavior).
- Whether coverage transitions from informational to risk-focused while the technical score remains -0.610.
Snapshot: AI Rank (Short–Mid–Long): Mixed (Bullish tilt) (Bearish–Bullish–Bullish) · Technical Confluence: Bearish · Key Levels: Support ~175.43 | Resistance ~215.16 · News Sentiment: Neutral
Sources referenced: Reuters, Bloomberg, Yahoo Finance, MarketWatch, Investing.com
7) Sources
- Data & Business Process Services Stocks Q4 Teardown: Verisk (NASDAQ:VRSK) Vs The Rest — https://finance.yahoo.com/markets/stocks/articles/data-business-process-services-stocks-223747329.html?.tsrc=rss
- Verisk to Announce Fiscal First-Quarter 2026 Results on April 29, 2026 — https://finance.yahoo.com/markets/stocks/articles/verisk-announce-fiscal-first-quarter-123000375.html?.tsrc=rss
- What Verisk Analytics (VRSK)'s Written-Consent Fight Amid AI Push and Cost Concerns Means For Shareholders — https://finance.yahoo.com/markets/stocks/articles/verisk-analytics-vrsk-written-consent-190901927.html?.tsrc=rss
- Recurring Subscription Revenues & Buyouts Aid Verisk Amid High Debt — https://finance.yahoo.com/markets/stocks/articles/recurring-subscription-revenues-buyouts-aid-141500237.html?.tsrc=rss
- Zacks Industry Outlook Highlights Verisk Analytics, TransUnion and FactSet Research — https://finance.yahoo.com/markets/stocks/articles/zacks-industry-outlook-highlights-verisk-091800642.html?.tsrc=rss
- 3 Stocks to Watch From the Booming Business Information Industry — https://finance.yahoo.com/markets/stocks/articles/3-stocks-watch-booming-business-173700664.html?.tsrc=rss
- FDS vs. VRSK: Which Stock Is the Better Value Option? — https://finance.yahoo.com/markets/stocks/articles/fds-vs-vrsk-stock-better-154004706.html?.tsrc=rss
- Strong 2025 Underwriting Income Masks Persistent Property/Casualty Insurance Pressures — https://finance.yahoo.com/sectors/healthcare/articles/strong-2025-underwriting-income-masks-121500344.html?.tsrc=rss
You may also like: How KGNAI AI ranks instruments across global markets
Disclaimer: KGNAI provides AI-generated analytics and educational market commentary only. This is not financial advice. Markets involve risk. Always do your own research.