
Expro Group Holdings NV (XPRO) — 22-Apr-2026 Technical & Rank Review with Bearish Tilt
XPRO enters 22-Apr-2026 with a bearish rank profile across most horizons despite a more mixed, near-term technical blend. Within KGNAI’s 2058-instrument universe, the daily rank sits in the lower half of the distribution (Neutral), while the weekly and monthly ranks remain materially weaker, consistent with sustained relative underperformance pressure. Technically, the picture is less uniform: price action remains bearish versus the MA50, yet the longer-term moving-average regime still reads constructive (MA50 above MA200). Momentum confirms the cautionary tone, with RSI(14) at 37.28 and a negative MACD histogram (-0.0225) pointing to limited upside follow-through. Volatility is contained, with Bollinger bandwidth at 0.0908, implying a market that may be consolidating rather than trending aggressively. News analytics skew constructive at the model level (normalized score 1.00 as of 2026-04-14), but the price/rank framework suggests sentiment has not yet translated into stronger relative positioning.
- Rank stance (Short / Mid / Long): Bearish / Bearish / Bearish (daily is Neutral, but weekly–yearly remain Bearish).
- Technical confluence label: Neutral (18-signal confluence -0.167; blended technical score -0.004).
- Key levels: Support ~ 15.8017 | Resistance ~ 18.2150.
- News sentiment bias: Slightly constructive/neutral in composition (avg 0.050; 73% neutral) with model-level Bullish normalization (1.00).
- Confirmation / invalidation condition: A volume-backed push above 18.2150 improves continuation odds; a sustained close below 15.8017 increases deterioration risk.
What KGNAI Measures
KGNAI evaluates assets using large cross-sectional datasets built from millions of structured data points. Inputs incorporate fundamental metrics, technical structures, and systematically processed news sentiment. Statistical models, machine learning, and AI frameworks are used to assess relative positioning, signal alignment, and probabilistic behavior across broad universes.
How to Read This Report
- Ranks are comparative across the tracked universe, not absolute price targets.
- Confluence reflects alignment among independent signal groups.
- Support/resistance levels are probabilistic decision zones, not guarantees.
- Sentiment provides contextual bias within the broader analytical framework.
1) KGNAI AI Analysis
Region: USA
Total universe size: 2058 ranked instruments
- Daily rank: #1536 out of 2058 — Neutral
- Weekly rank: #1880 out of 2058 — Bearish
- Monthly rank: #1872 out of 2058 — Bearish
- 3-Monthly rank: #1882 out of 2058 — Bearish
- 6-Monthly rank: #1760 out of 2058 — Bearish
- Yearly rank: #1724 out of 2058 — Bearish
Cross-horizon ranking shows persistent weakness in XPRO’s relative profile. The daily reading (#1536) is less negative than the intermediate windows, but it remains far from the upper-quartile territory typically associated with broad-based strength. The weekly and monthly ranks (both in the high-1800s out of 2058) indicate that any short-term stabilization has not yet repaired the mid-horizon probability balance embedded in the model’s cross-sectional tests.
The 6-month rank (#1760) and yearly rank (#1724) are modestly better than the weekly/monthly levels, which introduces a subtle time-scale divergence: longer windows are still bearish, but not as extreme as the mid-horizon cluster. That pattern often aligns with markets that have already repriced meaningfully and are now oscillating, rather than accelerating cleanly in the same direction. In other words, the model does not identify XPRO as improving; it identifies it as less deteriorating at the longest horizon than at the intermediate one.
KGNAI’s stated term view remains Bearish across short-, mid-, and long-term. For positioning discipline, the practical implication is that any tactical rebound signals should be evaluated as counter-trend unless multiple horizons begin migrating toward materially lower (stronger) rank numbers. As long as the weekly–3M regime stays near the bottom of the universe, the model framework treats upside as lower-confidence and more dependent on confirmation from price structure, momentum repair, and liquidity behavior.
Term view: Short-term: Bearish. Mid-term: Bearish. Long-term: Bearish.
Want the full universe and complete rank tables? Unlock full access on KGNAI: https://www.kgnai.com/pricing
2) Price & trend overview
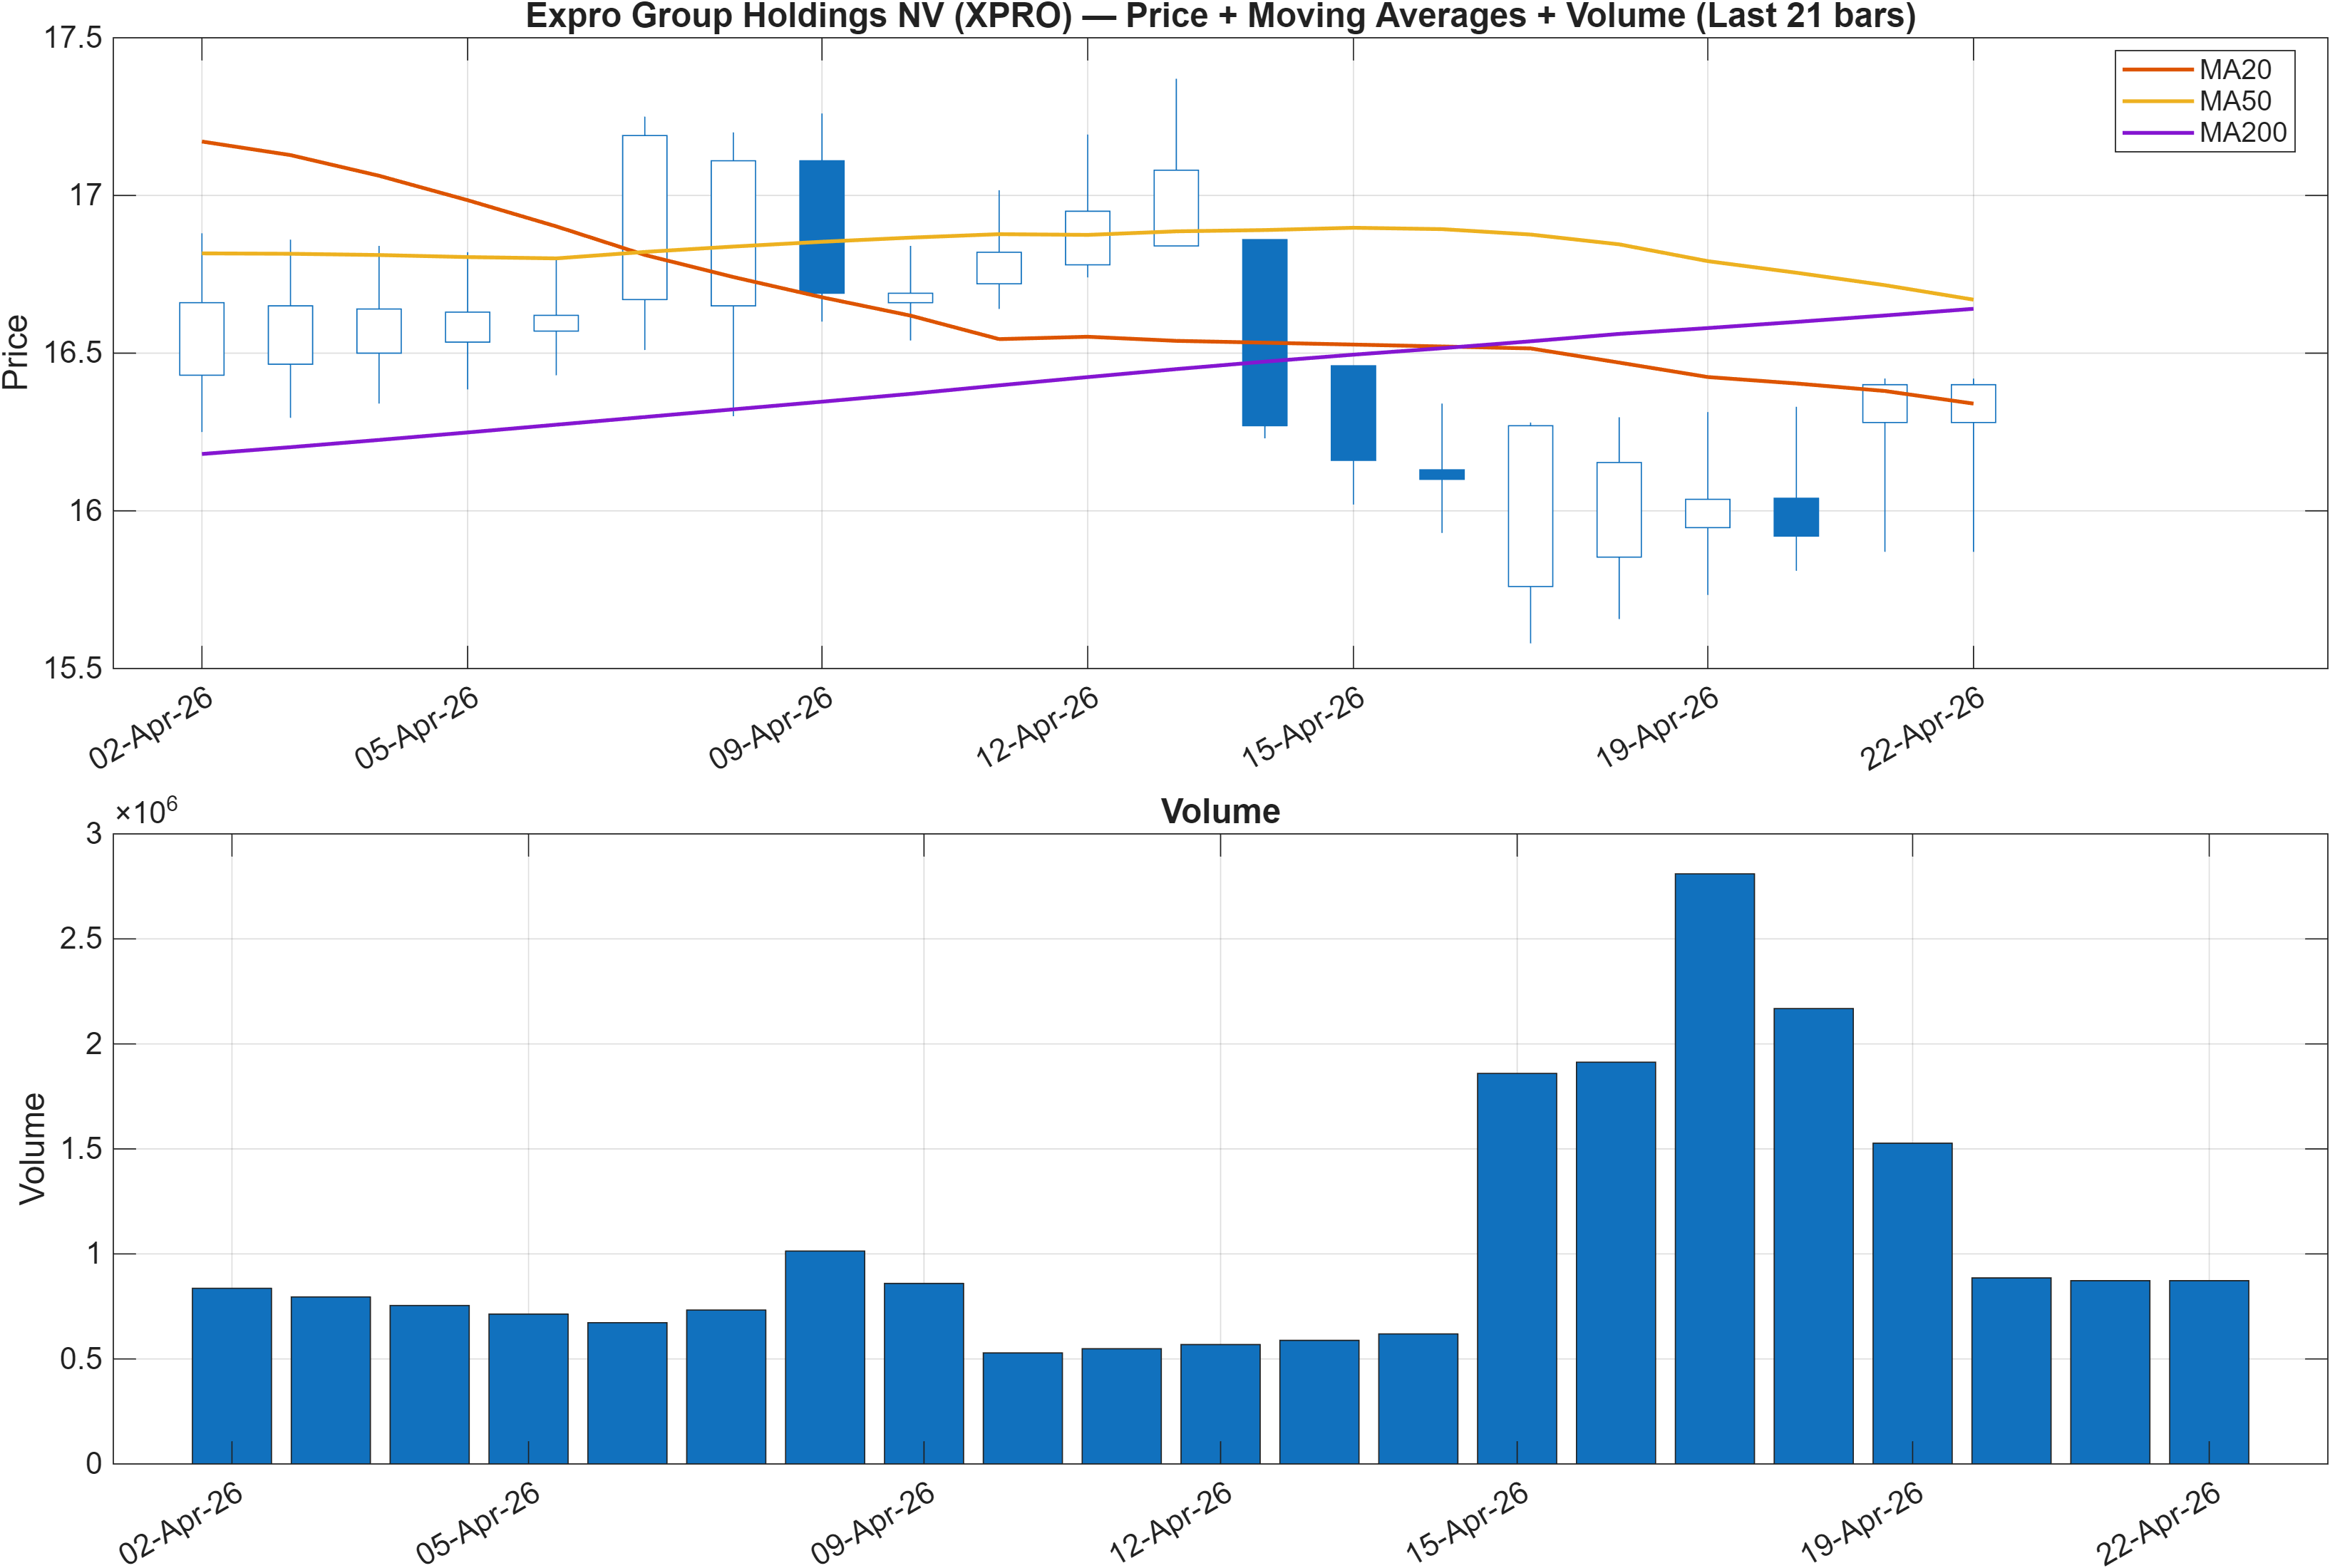
Interpretation: Close vs MA50 = Bearish, MA50 vs MA200 = Bullish.
XPRO’s trend state is best described as a split-regime setup. The close trading below the MA50 keeps the near-term bias defensive and aligns with the weaker weekly/monthly ranks. At the same time, MA50 above MA200 implies the longer trend backbone has not fully rolled over—often a signature of a market that is correcting within a broader up-cycle rather than trending in a clean, persistent downtrend.
That divergence matters for execution: markets can remain below the MA50 for extended periods during consolidations while still preserving a positive long moving-average slope. In those cases, breakouts and failures frequently occur around intermediate levels rather than at the extremes. This is consistent with the broader report structure: the technical blend later resolves as Neutral (-0.004) even while the rank framework stays bearish.
Volume context is provided in the moving-average figure, and the scenario language elsewhere in the report emphasizes breakout validation via volume. Given the daily rank is Neutral (#1536) while the weekly rank remains Bearish (#1880), the most analytically consistent interpretation is that recent price action may be attempting to stabilize, but it has not yet demonstrated trend persistence strong enough to improve the intermediate probability regime. Until price reclaims the MA50 with follow-through, the MA structure argues for treating rallies as tests of overhead supply rather than confirmed trend resumption.
3) Momentum & volatility dashboard
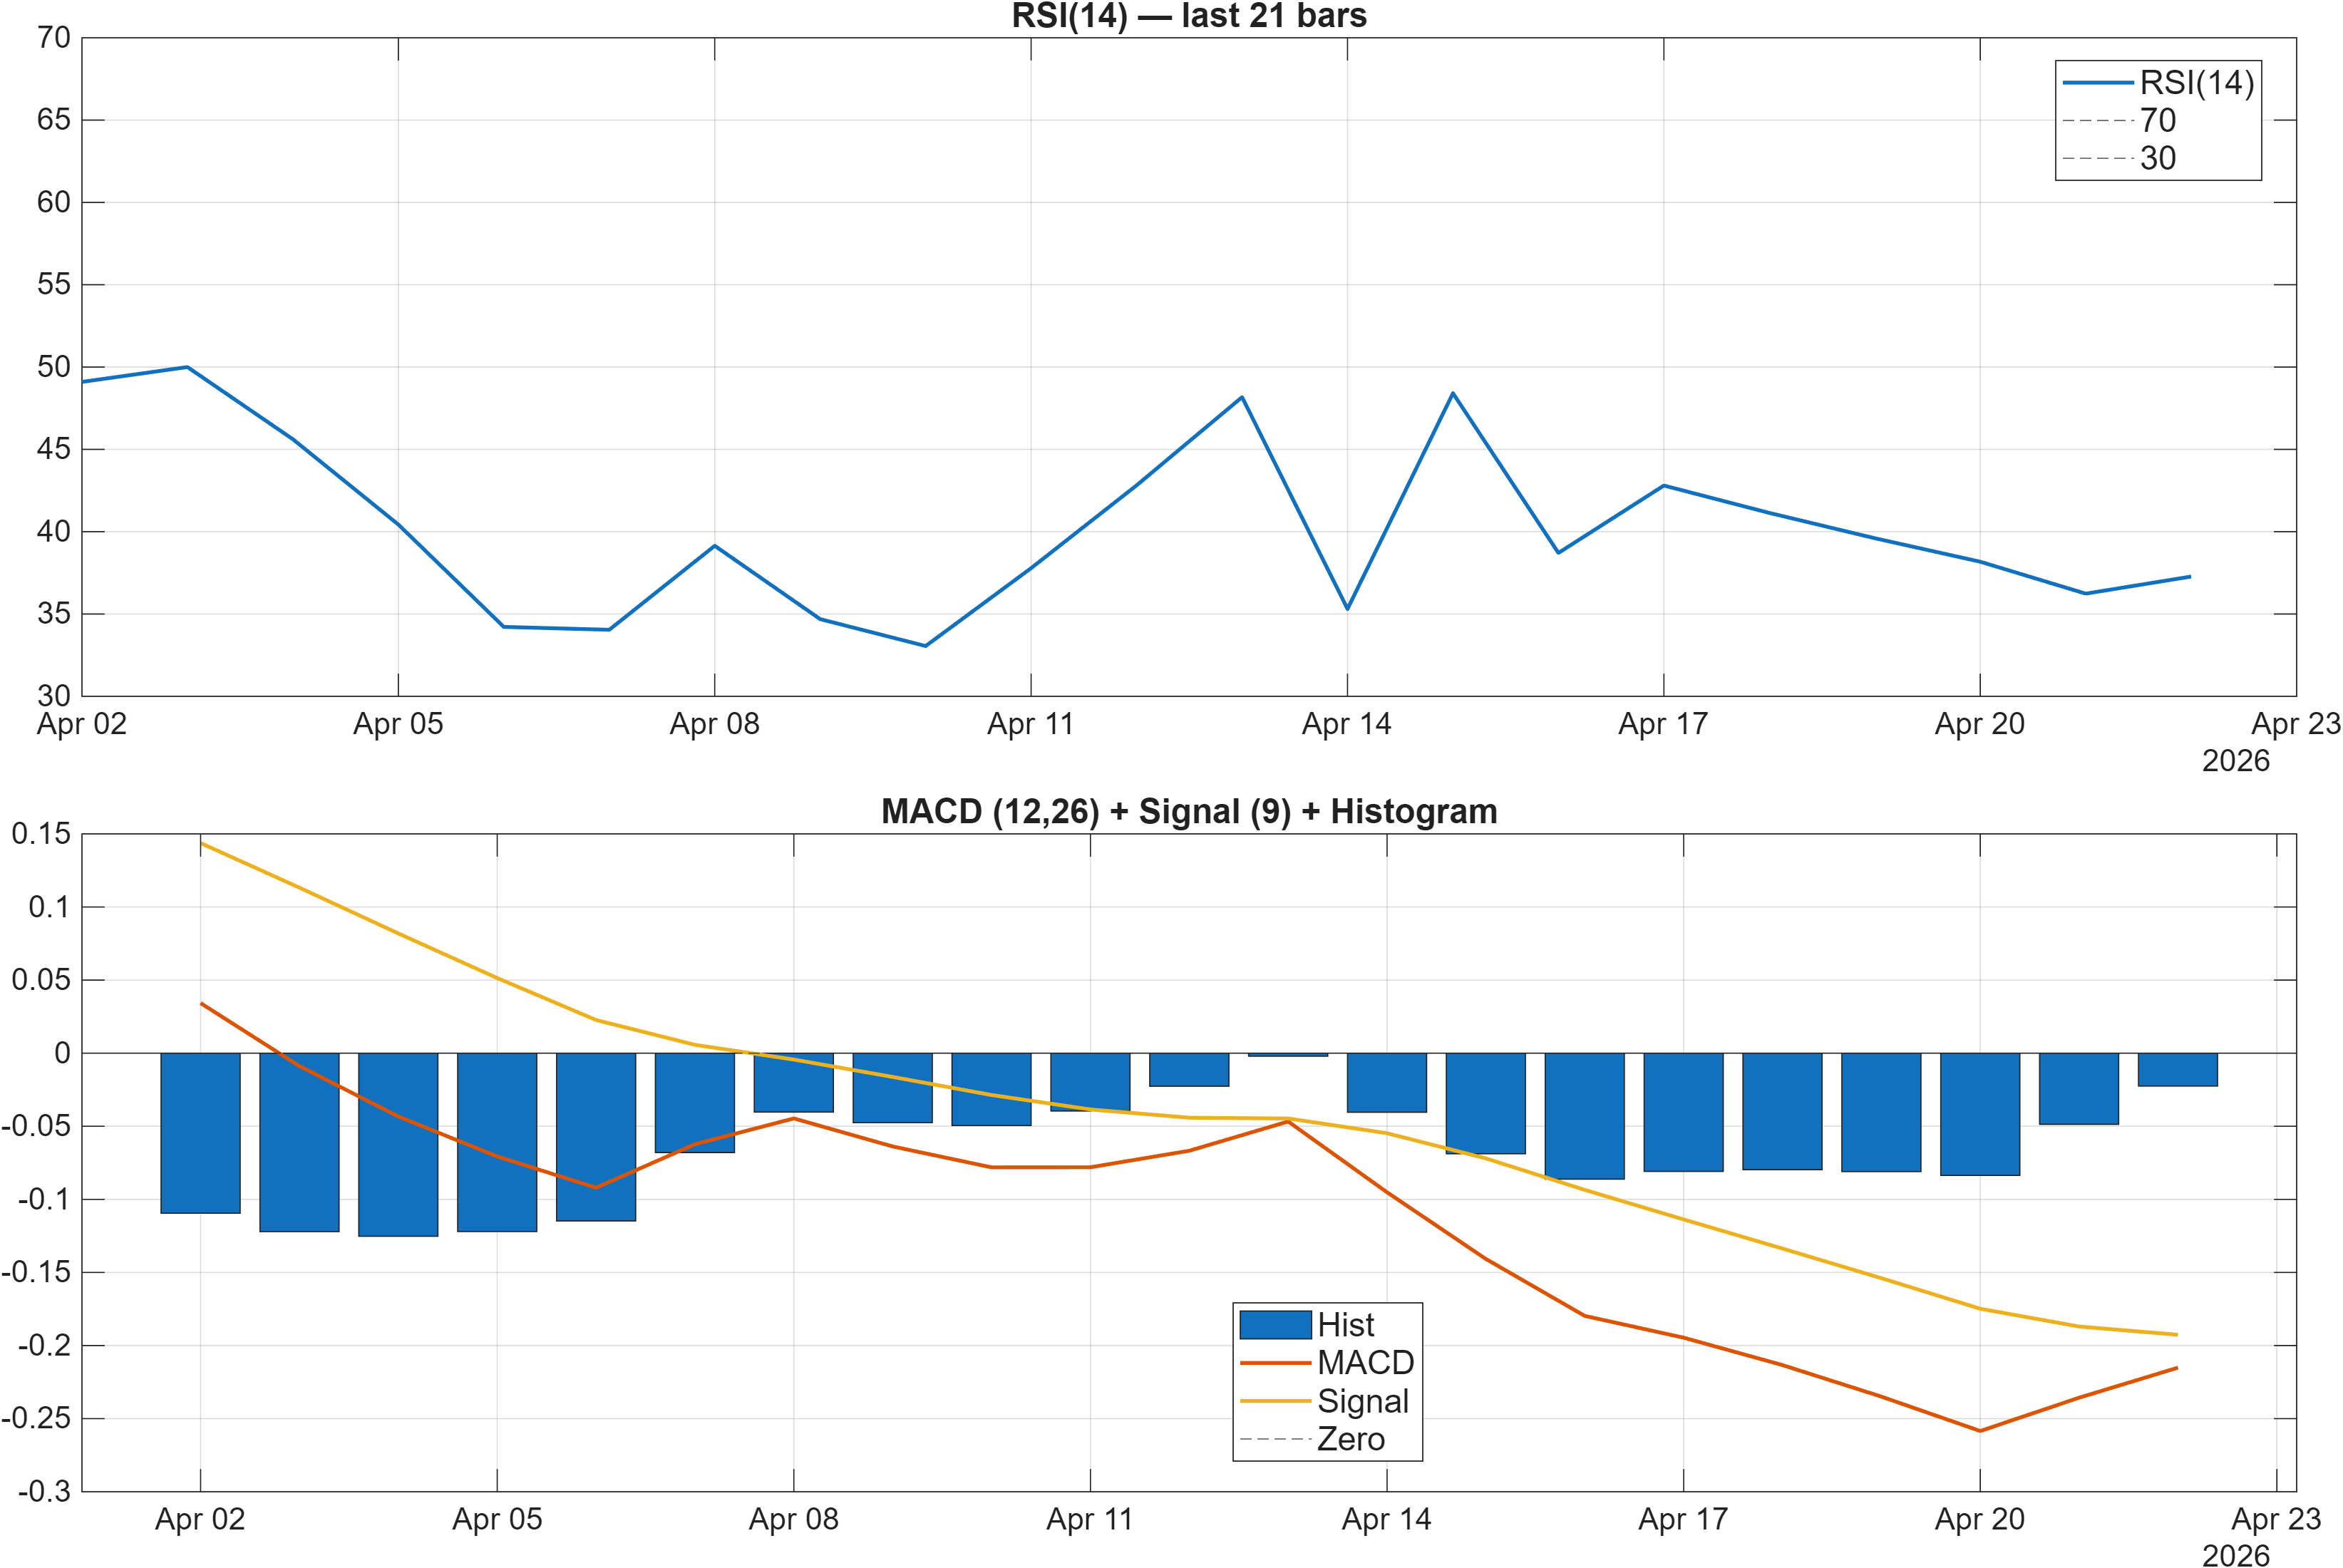
Interpretation: RSI bias = Bearish, MACD hist = -0.0225.
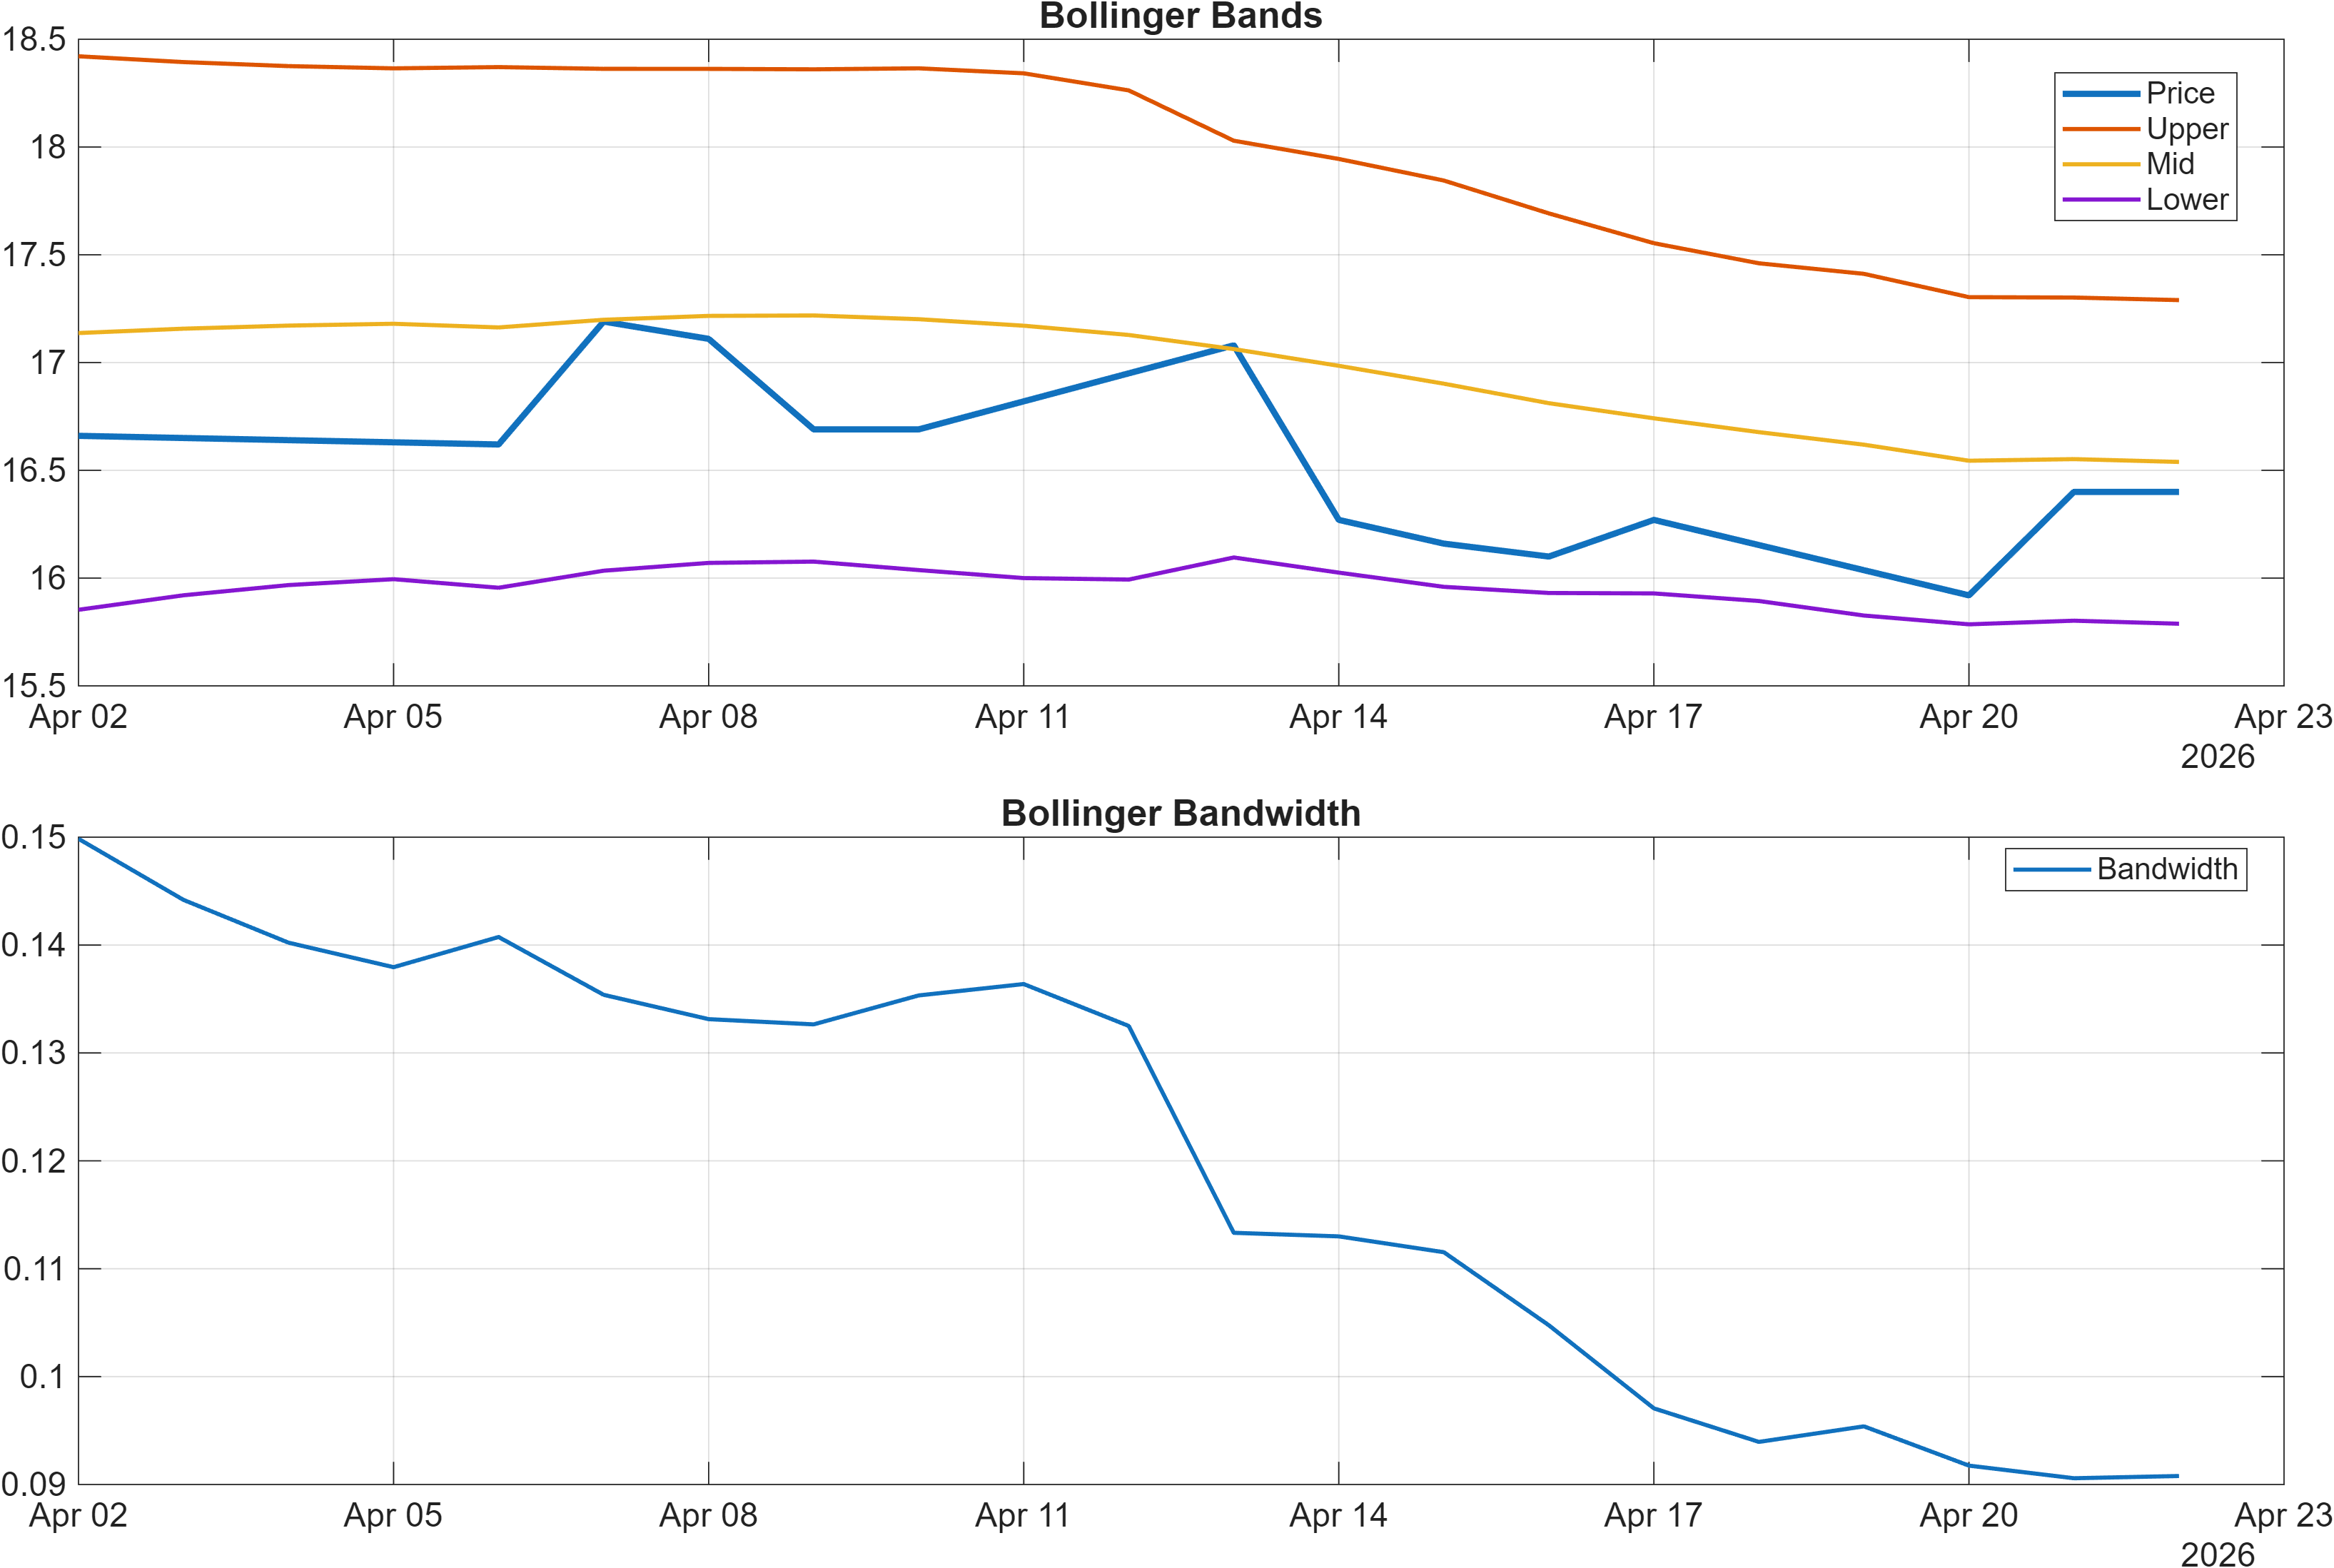
Interpretation: Bandwidth (volatility regime) latest = 0.0908.
Momentum diagnostics lean defensive. RSI(14) at 37.28 places the oscillator below the midline and consistent with the report’s RSI bias reading as bearish. While RSI is not a timing tool on its own, levels in the high-30s frequently coincide with markets that struggle to sustain multi-day upside without a structural catalyst, especially when the price is also below the MA50.
The MACD histogram at -0.0225 adds a second layer of evidence that upside impulse remains constrained. In many consolidation regimes, MACD may hover near zero; here it remains negative, which favors the interpretation of weak or failing rebounds rather than an early-stage momentum turn. This aligns with the broader signal table where MACD Hist is explicitly classified Bearish.
Volatility, however, is not expanding aggressively. The Bollinger bandwidth reading of 0.0908 points to a relatively contained regime, suggesting the market may be compressing rather than trending with urgency. Compression environments can produce sharp directional resolution, but direction is not implied by compression alone; it requires confirmation from trend and momentum. With RSI subdued and MACD negative, volatility containment currently reads less like an upside coil and more like stalling after downside pressure.
Netting these together, the dashboard suggests momentum exhaustion has not yet clearly flipped into momentum recovery. For a more constructive momentum interpretation, the report’s own framing implies looking for RSI repair (away from 37.28) and MACD histogram improvement (toward or above zero) alongside trend confirmation in the price/MA structure.
4) Support / Resistance zones
Support ~ 15.8017 | Resistance ~ 18.2150
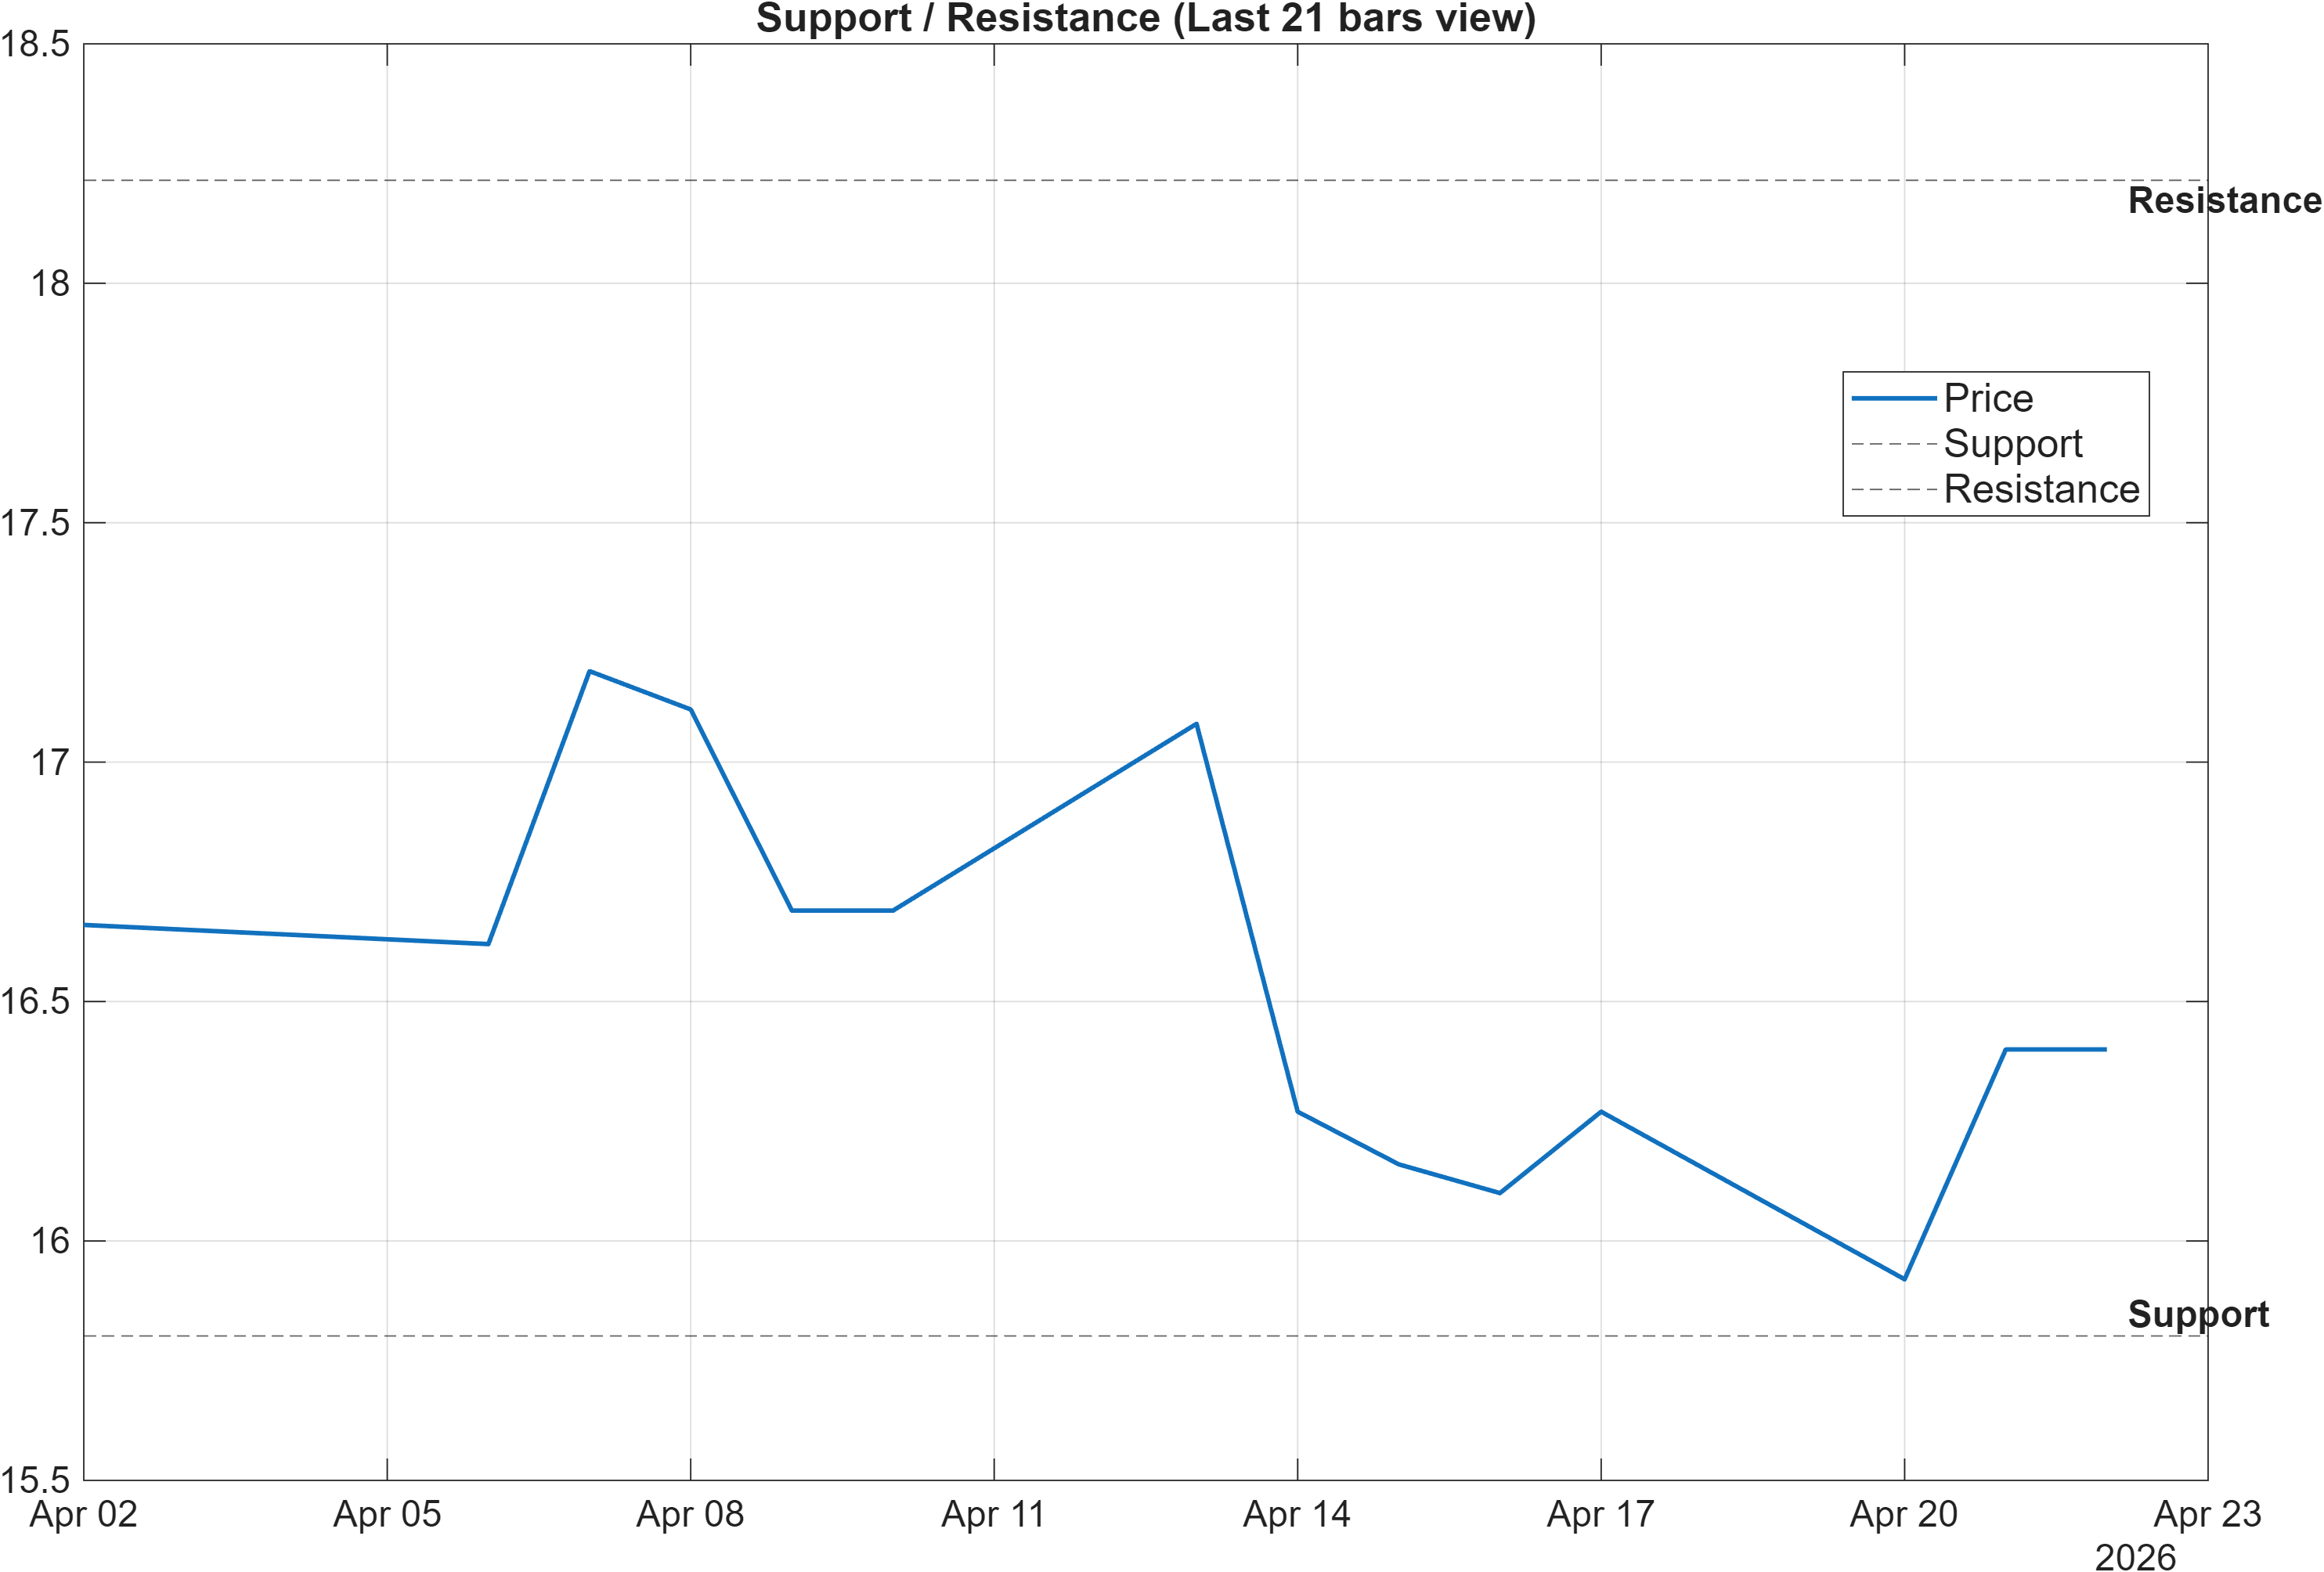
Scenario view: Break above resistance with volume → continuation. Close below support → signal deterioration risk.
The defined zones—15.8017 as support and 18.2150 as resistance—create a clear decision frame for XPRO’s current regime. Given the broader context (weekly/monthly ranks in the high-1800s and price below MA50), resistance should be treated as a validation checkpoint: the market needs to demonstrate it can absorb supply at that level with sufficient participation.
The scenario language explicitly ties a move above 18.2150 to volume-backed continuation. In practice, this is a way to avoid false positives in a neutral-volatility environment (bandwidth 0.0908) where price can drift into levels without follow-through. A successful breakout would also help reconcile the current divergence between longer-term MA structure (MA50 vs MA200 bullish) and weaker intermediate ranks by providing an observable improvement in price behavior.
On the downside, a close below 15.8017 is framed as deterioration risk. That aligns with momentum conditions already leaning bearish (RSI 37.28, MACD histogram -0.0225). When momentum is weak, support levels are more vulnerable to breakdowns because rebound attempts often fail to generate enough distance from the floor to reduce retest probability.
Within this range, behavior near the boundaries carries more informational value than noise in the middle. With the technical confluence labeled Neutral, these zones function as the most practical way to separate stabilization from renewed weakness without relying on any single indicator.
5) Quant Technical Dashboard (18 Signals)
KGNAI AI Technical Analysis Score (Deep Reinforcement Learning): Rank #642 out of 2057 (Rank 1 represents the strongest technical positioning and a higher probability of favorable price behavior. As ranks increase toward the maximum, the probability of favorable outcomes weakens and bearish positioning becomes more dominant.) | Label: Neutral | Score: 0.376
18-Signal Technical Confluence Score: -0.167 (Neutral)
Overall Technical Score (18-signal confluence + DRL rank blend): -0.004 (Neutral)
Note: The blended score reflects signal strength weighted against broader AI technical ranking, which may temporarily diverge.
Blended technical score breakdown: -0.004 (Neutral | Bull 6 / Bear 9 / Neutral 3)
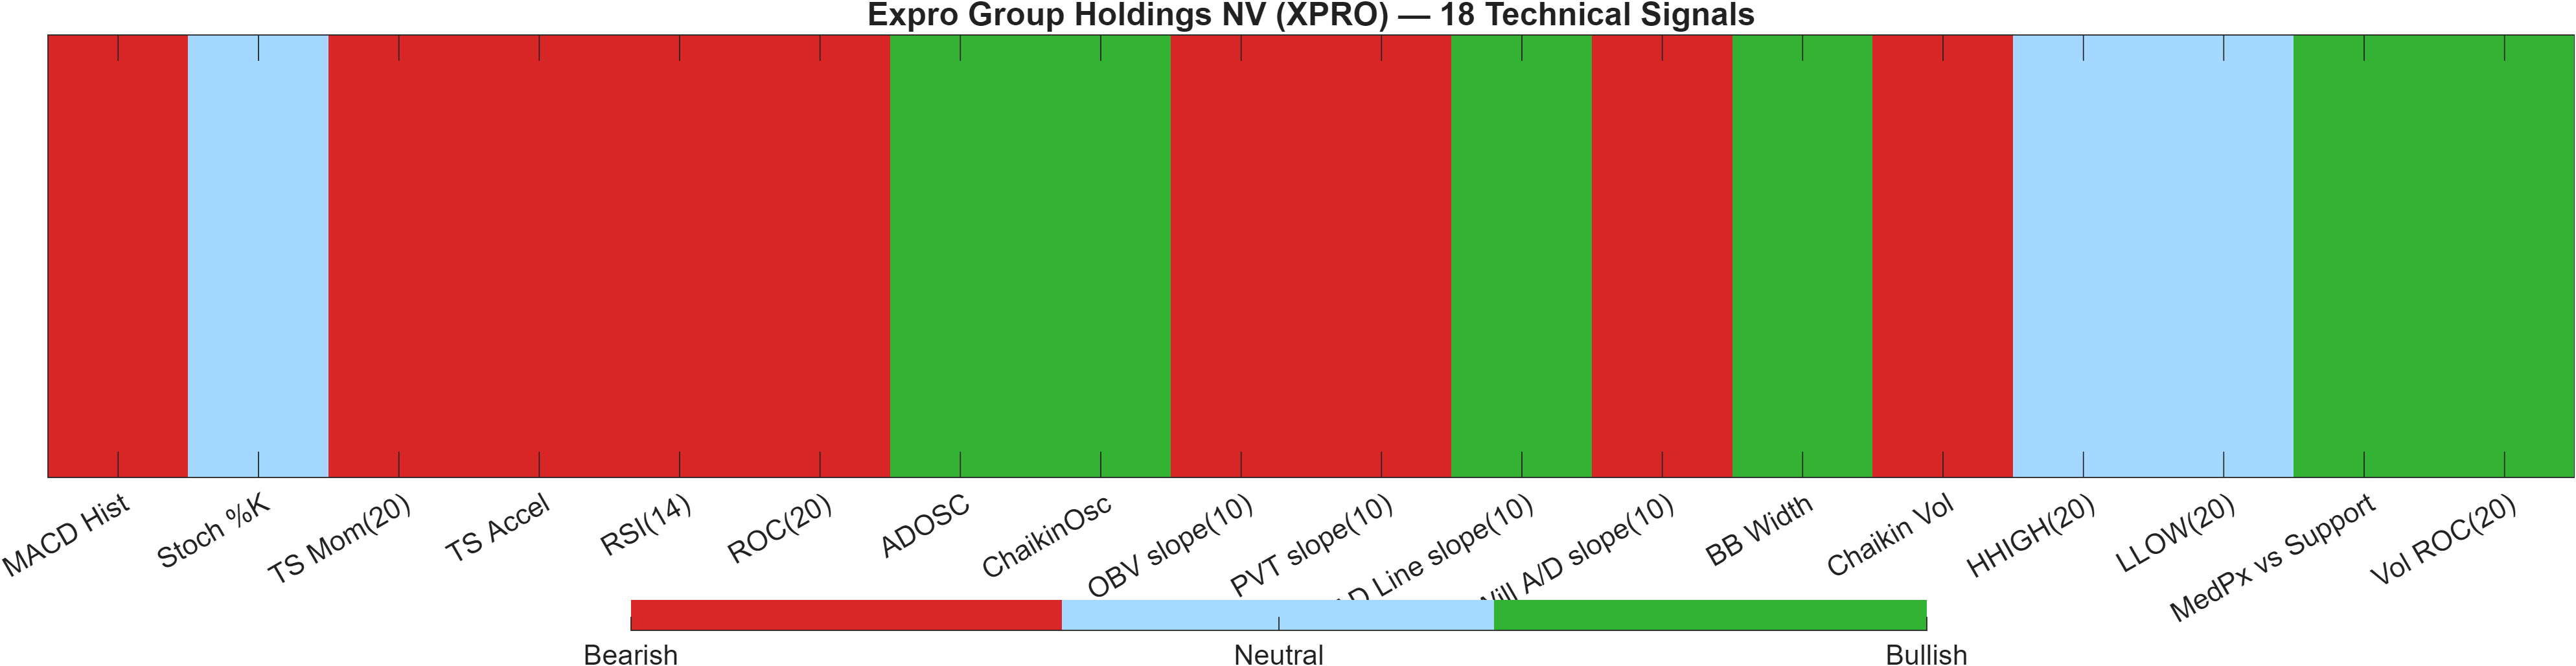
Signal table (Bull/Bear/Neutral)
| Indicator | Value | Signal |
|---|---|---|
| MACD Hist | -0.02249 | Bearish |
| Stoch %K | 45.81 | Neutral |
| TS Mom(20) | -0.25 | Bearish |
| TS Accel | -0.5467 | Bearish |
| RSI(14) | 37.28 | Bearish |
| ROC(20) | -1.502 | Bearish |
| ADOSC | 60.92 | Bullish |
| ChaikinOsc | 1.287e+06 | Bullish |
| OBV slope(10) | -4.702e+06 | Bearish |
| PVT slope(10) | -2.156e+04 | Bearish |
| AD Line slope(10) | 3.508e+06 | Bullish |
| Will A/D slope(10) | -0.72 | Bearish |
| BB Width | 0.09079 | Bullish |
| Chaikin Vol | 1.992 | Bearish |
| HHIGH(20) | 17.37 | Neutral |
| LLOW(20) | 15.58 | Neutral |
| MedPx vs Support | 0.3431 | Bullish |
| Vol ROC(20) | 9.718 | Bullish |
Interpretation: Indicator-level signals form the base confluence, which is then adjusted using a separate AI-driven technical ranking model. The final technical score summarizes this combined view.
XPRO’s dashboard resolves into a neutral aggregate despite a higher count of bearish components. The confluence score sits at -0.167 (Neutral), while the blended overall technical score is essentially flat at -0.004 (Neutral). This is consistent with a tape that is not exhibiting clean trend strength, but also not delivering an unambiguous breakdown across independent signal groups.
Two layers help explain the neutrality. First, the DRL technical rank is #642 out of 2057 with a score of 0.376—not top-tier leadership, but also not consistent with the weakest cohort. Second, the 18-signal breakdown shows Bull 6 / Bear 9 / Neutral 3, which indicates bearish breadth, but not total dominance. In practical terms, bearish signals such as RSI(14) at 37.28 and MACD hist at -0.02249 are being partially offset by liquidity/participation signals that are not uniformly negative.
This internal mix often appears when a market is transitioning: either attempting to stabilize after a drawdown or failing to convert longer-term trend support into renewed upside momentum. The OBV slope being bearish alongside some bullish accumulation-style readings is a reminder that money-flow proxies can disagree depending on lookback and construction; the model’s role is to aggregate rather than overfit to a single line item.
Given the broader rank picture remains bearish (e.g., weekly #1880), the neutral technical blend should be treated as a non-confirmation of trend strength—not a bullish reversal signal. The technically consistent pathway to improvement would be a shift where momentum indicators stop classifying as bearish while trend measures regain alignment (price back above MA50, and strength through resistance).
6) News sentiment + extractive gist
Sentiment score (avg): 0.050 | Positive: 19% | Neutral: 73% | Negative: 8%
KGNAI AI News Sentiment Score (normalized -1 to +1): 1.00 (as of 2026-04-14) | Label: Bullish | Overall news score: 0.97
Positive Developments
Recent coverage across major financial outlets indicates a constructive narrative cluster around corporate updates and business positioning, with the model’s normalized sentiment reading at 1.00 (as of 2026-04-14) and an overall news score of 0.97. The positive tilt appears to be driven by discussion of operational performance themes and company-specific initiatives that are framed as supportive for execution. Importantly, the headline-level sentiment bias is not mirrored one-for-one in market-based analytics: XPRO’s weekly and monthly KGNAI ranks remain deep in bearish territory (e.g., #1880 weekly). That gap suggests the market is still demanding technical confirmation before re-pricing the narrative into stronger cross-sectional positioning. From a process standpoint, constructive news flow can help stabilize risk perception, but the report’s framework requires confirmation via trend and momentum repair (RSI and MACD) rather than sentiment alone.
Neutral / Mixed Developments
A large share of the news set is categorized as neutral (73%), consistent with informational items and scheduled corporate communications rather than new, directionally decisive inputs. This neutral weighting matters because it can sustain attention without necessarily altering price behavior, especially in a lower-volatility regime (Bollinger bandwidth 0.0908). In this context, the average sentiment score of 0.050 reads only mildly positive, reinforcing that most items are being processed as context rather than catalysts. The result is a backdrop where the market may remain range-bound between the defined levels (15.8017 support and 18.2150 resistance) until price action provides clearer evidence of continuation or breakdown.
Negative / Risk Signals
The explicitly negative share of coverage is limited (8%), but risk signals still emerge through framing around valuation discipline, analyst posture, and the possibility that favorable narratives are already reflected in prior price behavior. In a market where momentum is already soft (RSI 37.28, MACD histogram -0.0225), even a small negative news fraction can have asymmetric impact if it coincides with technical fragility near support. The key risk from the report’s standpoint is not a single story but timing misalignment: constructive sentiment while ranks remain bearish can create conditions where rallies fade unless they are validated by participation and a decisive move above 18.2150. Conversely, a close below 15.8017 would increase sensitivity to incremental negative framing.
- Whether price acceptance improves above 18.2150 alongside volume confirmation.
- Whether momentum repairs (RSI lifting from 37.28 and MACD histogram improving from -0.0225).
- Whether the weekly/monthly ranks begin migrating meaningfully away from the high-1800s.
Sources referenced: Reuters, Bloomberg, Yahoo Finance, MarketWatch, Investing.com
7) Sources
- Assessing Expro Group Holdings (XPRO) Valuation After A Strong One Year Share Price Return — https://finance.yahoo.com/markets/stocks/articles/assessing-expro-group-holdings-xpro-030725975.html?.tsrc=rss
- Expro Group Holdings N.V. Schedules First Quarter 2026 Earnings Release and Conference Call — https://finance.yahoo.com/markets/stocks/articles/expro-group-holdings-n-v-211500117.html?.tsrc=rss
- 3 Reasons to Avoid XPRO and 1 Stock to Buy Instead — https://finance.yahoo.com/markets/stocks/articles/3-reasons-avoid-xpro-1-194001614.html?.tsrc=rss
- Is Expro (XPRO) Using Its Cayman Shift and Geothermal Pivot to Redefine Its Risk Profile? — https://finance.yahoo.com/markets/stocks/articles/expro-xpro-using-cayman-shift-002154332.html?.tsrc=rss
- California Resources, Expro, RPC, HighPeak Energy, and Nabors Industries Shares Are Falling, What You Need To Know — https://finance.yahoo.com/sectors/energy/articles/california-resources-expro-rpc-highpeak-012726571.html?.tsrc=rss
- Expro Announces Proposed Redomicile to the Cayman Islands — https://finance.yahoo.com/markets/stocks/articles/expro-announces-proposed-redomicile-cayman-212600923.html?.tsrc=rss
- Q4 Earnings Outperformers: Expro (NYSE:XPRO) And The Rest Of The Oilfield Services Stocks — https://finance.yahoo.com/sectors/energy/articles/q4-earnings-outperformers-expro-nyse-202919242.html?.tsrc=rss
- Expro to Deliver Geothermal Well Testing Services for Groundbreaking Lionheart Project in Germany — https://finance.yahoo.com/sectors/energy/articles/expro-deliver-geothermal-well-testing-103000585.html?.tsrc=rss
You may also like: How KGNAI AI ranks instruments across global markets
Disclaimer: KGNAI provides AI-generated analytics and educational market commentary only. This is not financial advice. Markets involve risk. Always do your own research.