
Linde PLC(UK) (0M2B.LSE) — 08-May-2026 Technical–Rank Alignment Stays Constructive, but Near-Term Signals Are Mixed
KGNAI’s cross-sectional ranking framework places Linde PLC(UK) (0M2B.LSE) in a broadly constructive posture across time horizons, with longer-horizon ranks clustering in the strongest tier of the 1419-instrument Europe universe. At the same time, the market’s near-term technical picture is more nuanced: the close relative to the MA50 is flagged as bearish while the MA50 vs MA200 configuration remains bullish, a common “pullback within trend” setup that requires confirmation. Momentum readings also show tension—RSI(14) at 25.79 indicates oversold conditions, yet MACD histogram at -1.2123 remains negative, suggesting downside pressure has not fully cleared. Volatility is relatively contained with Bollinger bandwidth near 0.0500, which can either precede consolidation continuation or a directional expansion. Key decision levels are defined by support near 414.5000 and resistance near 436.5333, framing where continuation vs deterioration becomes observable.
- Short / Mid / Long rank stance: Bullish / Bullish / Bullish (with Yearly rank #11 indicating top-tier longer-horizon positioning).
- Technical confluence label: Neutral (18-signal confluence 0.056; blended technical score -0.206).
- Key support / resistance: Support ~ 414.5000 | Resistance ~ 436.5333.
- News sentiment bias: Neutral (avg 0.000; 88% neutral; overall news score 0.00).
- Confirmation / invalidation condition: A break above 436.5333 with volume supports continuation; a close below 414.5000 raises deterioration risk.
What KGNAI Measures
KGNAI evaluates assets using large cross-sectional datasets built from millions of structured data points. Inputs incorporate fundamental metrics, technical structures, and systematically processed news sentiment. Statistical models, machine learning, and AI frameworks are used to assess relative positioning, signal alignment, and probabilistic behavior across broad universes.
How to Read This Report
- Ranks are comparative across the tracked universe, not absolute price targets.
- Confluence reflects alignment among independent signal groups.
- Support/resistance levels are probabilistic decision zones, not guarantees.
- Sentiment provides contextual bias within the broader analytical framework.
1) KGNAI AI Analysis
Region: EUROPE
Total universe size: 1419 ranked instruments
- Daily rank: #181 out of 1419 — Bullish
- Weekly rank: #215 out of 1419 — Bullish
- Monthly rank: #178 out of 1419 — Bullish
- 3-Monthly rank: #23 out of 1419 — Bullish
- 6-Monthly rank: #21 out of 1419 — Bullish
- Yearly rank: #11 out of 1419 — Bullish
The rank profile is notable for its time-horizon consistency. While the daily and weekly readings (#181 and #215) sit in the upper portion of the universe, the signal strengthens meaningfully as the lookback extends: the 3-month, 6-month, and yearly ranks (#23, #21, and #11) place 0M2B.LSE in the top decile of the 1419-instrument set. This pattern typically characterizes instruments where the broader trend or underlying factor exposure remains supportive, even if short-run noise introduces tactical drawdowns.
Cross-horizon alignment vs. near-term friction
The key analytical point is not that every horizon is identical, but that dispersion is controlled. The monthly rank (#178) remains bullish despite being less aggressive than the 3–12 month readings, indicating the intermediate window is not contradicting the longer regime. In practice, that limits the likelihood that the longer-horizon ranks are “stale” while acknowledging that the near-term tape can still be choppy.
What the ranks do (and do not) imply
KGNAI ranks are designed to capture relative positioning—how this instrument compares to peers—rather than to provide absolute upside targets. With a universe size of 1419, a yearly rank of #11 is a high bar for persistence, but the actionable question becomes whether the price/technical layer (Sections 2–5) confirms that the market is currently cooperating with that longer-horizon statistical backdrop.
Term view: Short-term: Bullish. Mid-term: Bullish. Long-term: Bullish.
2) Price & trend overview
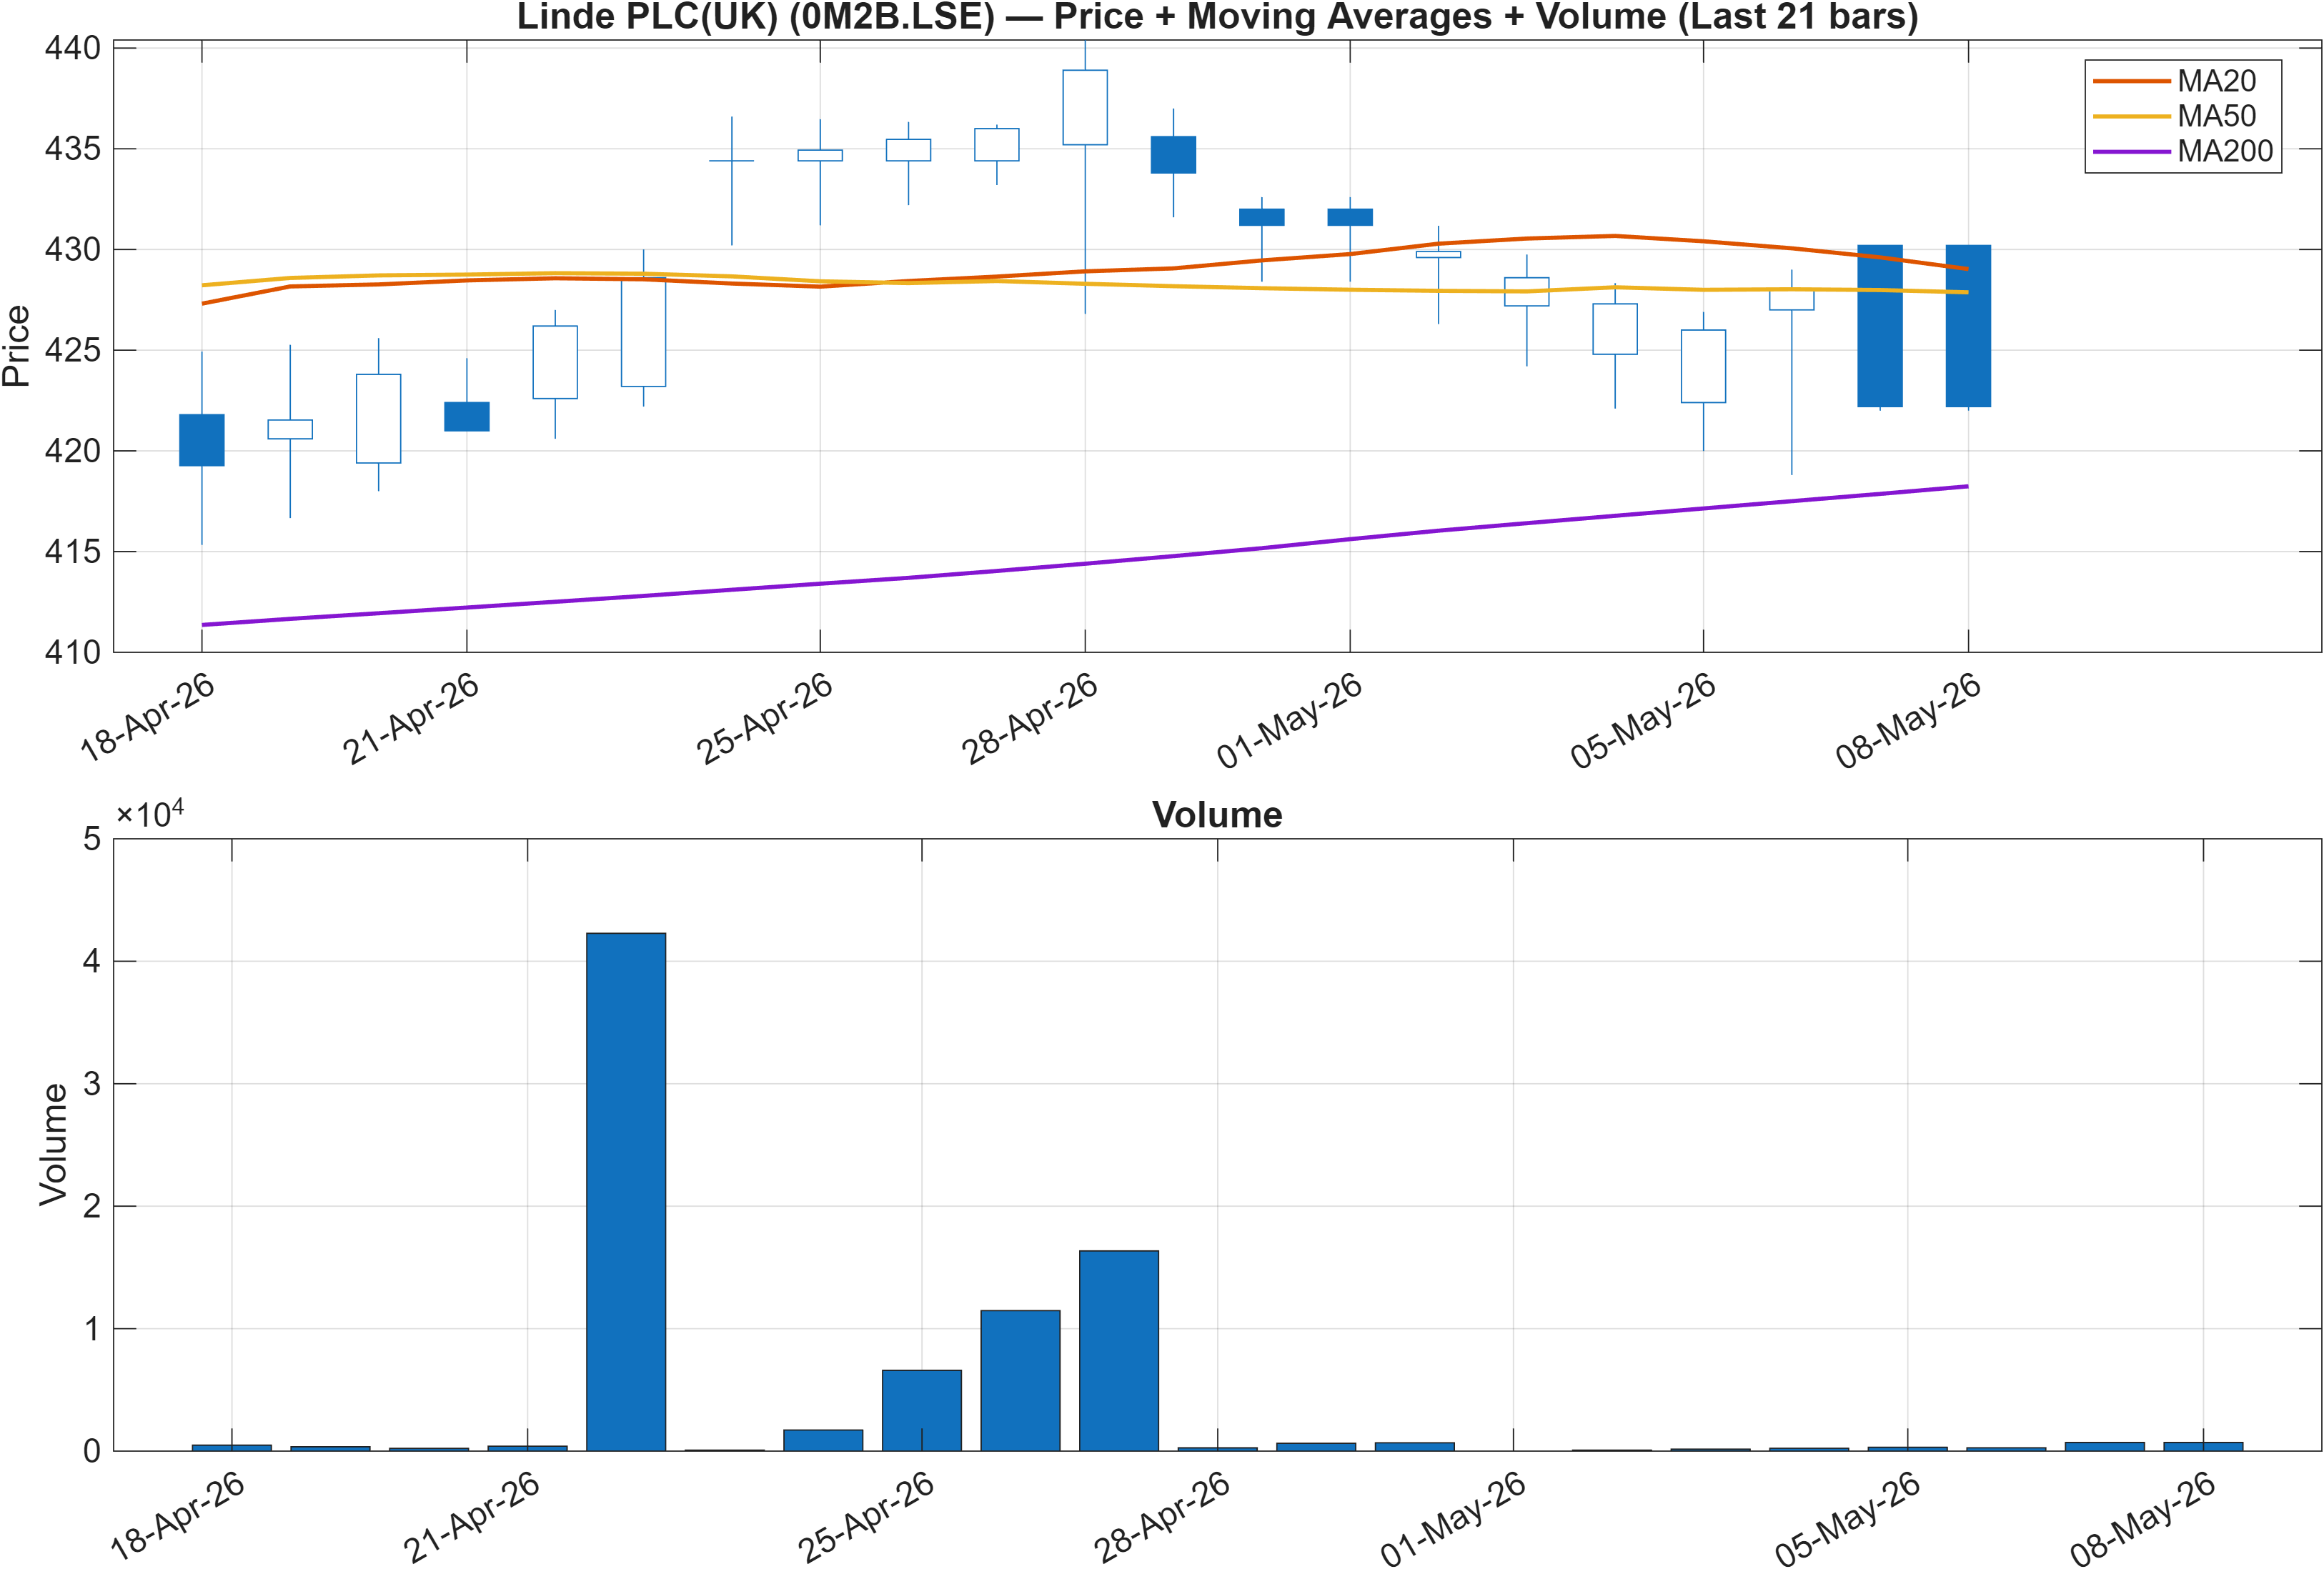
Interpretation: Close vs MA50 = Bearish, MA50 vs MA200 = Bullish.
Regime framing: trend structure positive, execution timing less clean
The moving-average read is a classic mixed trend state: the MA50 vs MA200 remains Bullish, while the close relative to the MA50 is Bearish. In institutional terms, this often maps to a longer-horizon uptrend that is experiencing a mean-reversion phase or a pullback that has not yet repaired back above the intermediate trend proxy (MA50).
Alignment vs divergence with the rank layer
This is where the rank structure matters: longer-horizon ranks such as #11 yearly and #21 six-month suggest the broader regime is supportive, but the price/MA read highlights that positioning can still be vulnerable to further consolidation before the trend reasserts. That divergence is not inherently bearish; it is a timing constraint that typically resolves either through a reclaim of the MA50 (trend re-acceleration) or a deeper drawdown that begins to threaten the broader structure.
Volume context and what to watch on the chart
Figure 1 provides the practical overlay: if the market transitions from “below MA50” back into a constructive alignment, continuation setups tend to improve when the move is validated by participation rather than thin trading. The rest of this report tightens that picture via momentum (RSI/MACD), volatility (Bollinger bandwidth), and probabilistic decision zones (support/resistance at 414.5000 and 436.5333).
3) Momentum & volatility dashboard
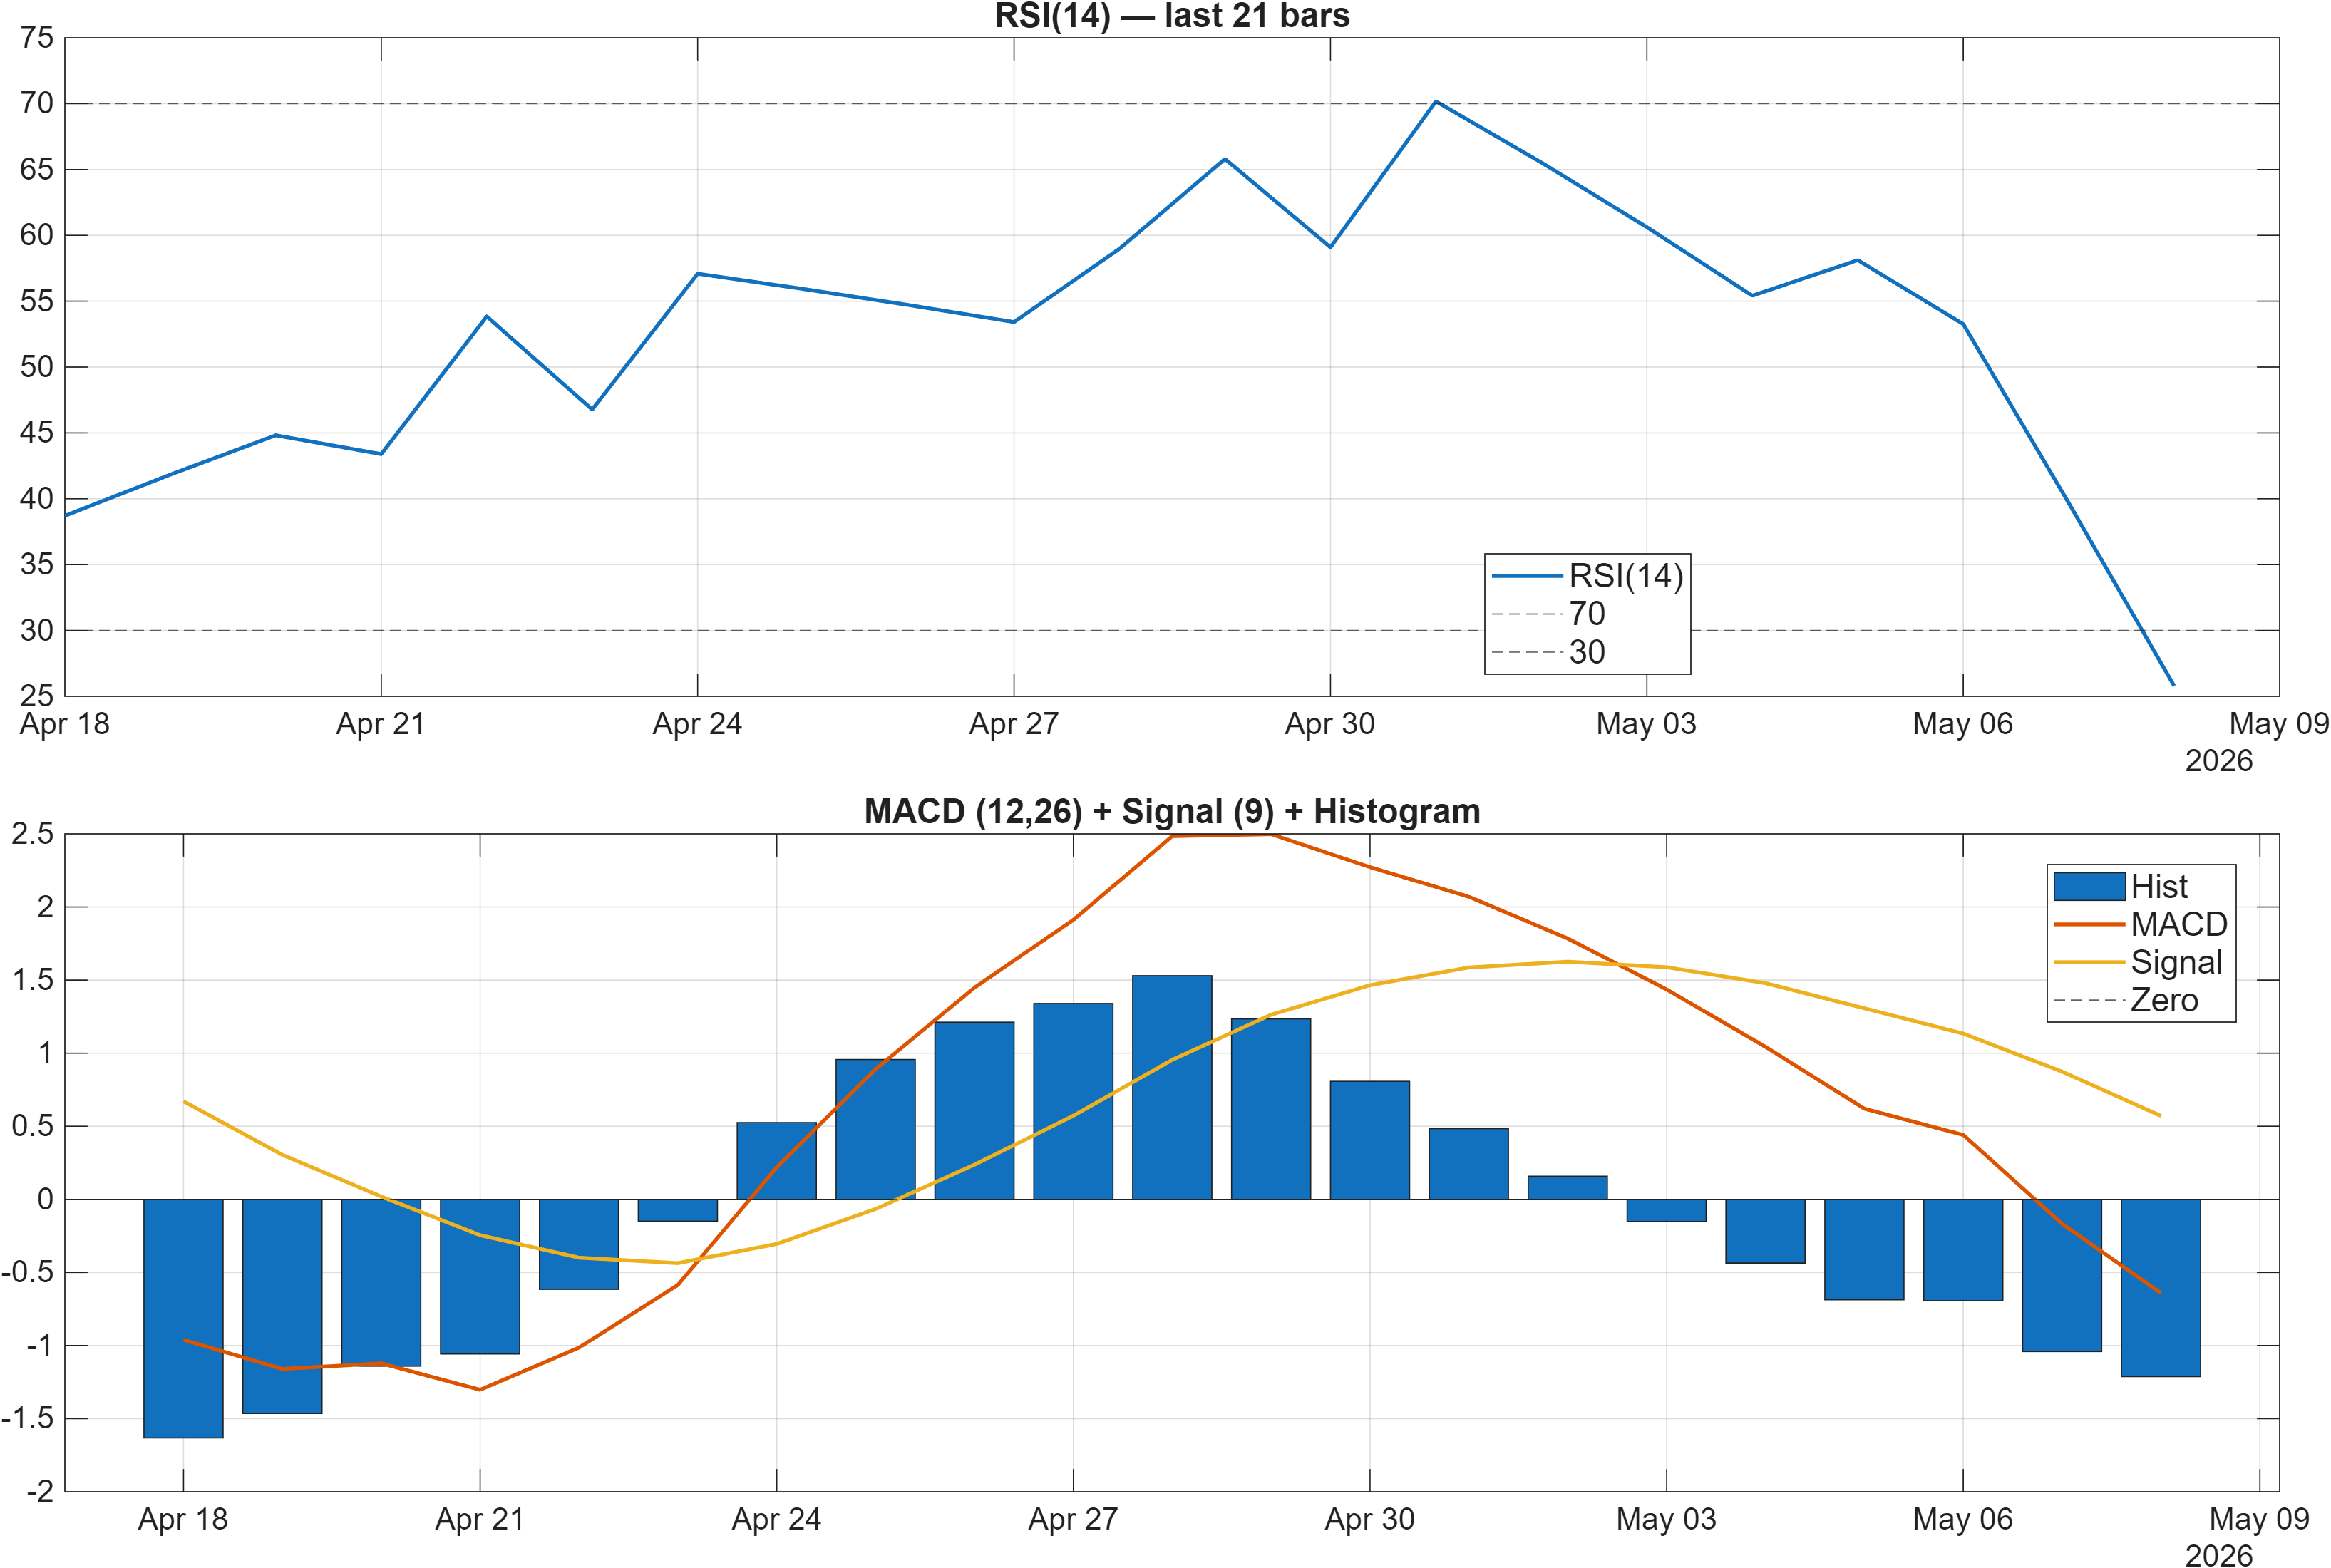
Interpretation: RSI bias = Bearish, MACD hist = -1.2123.
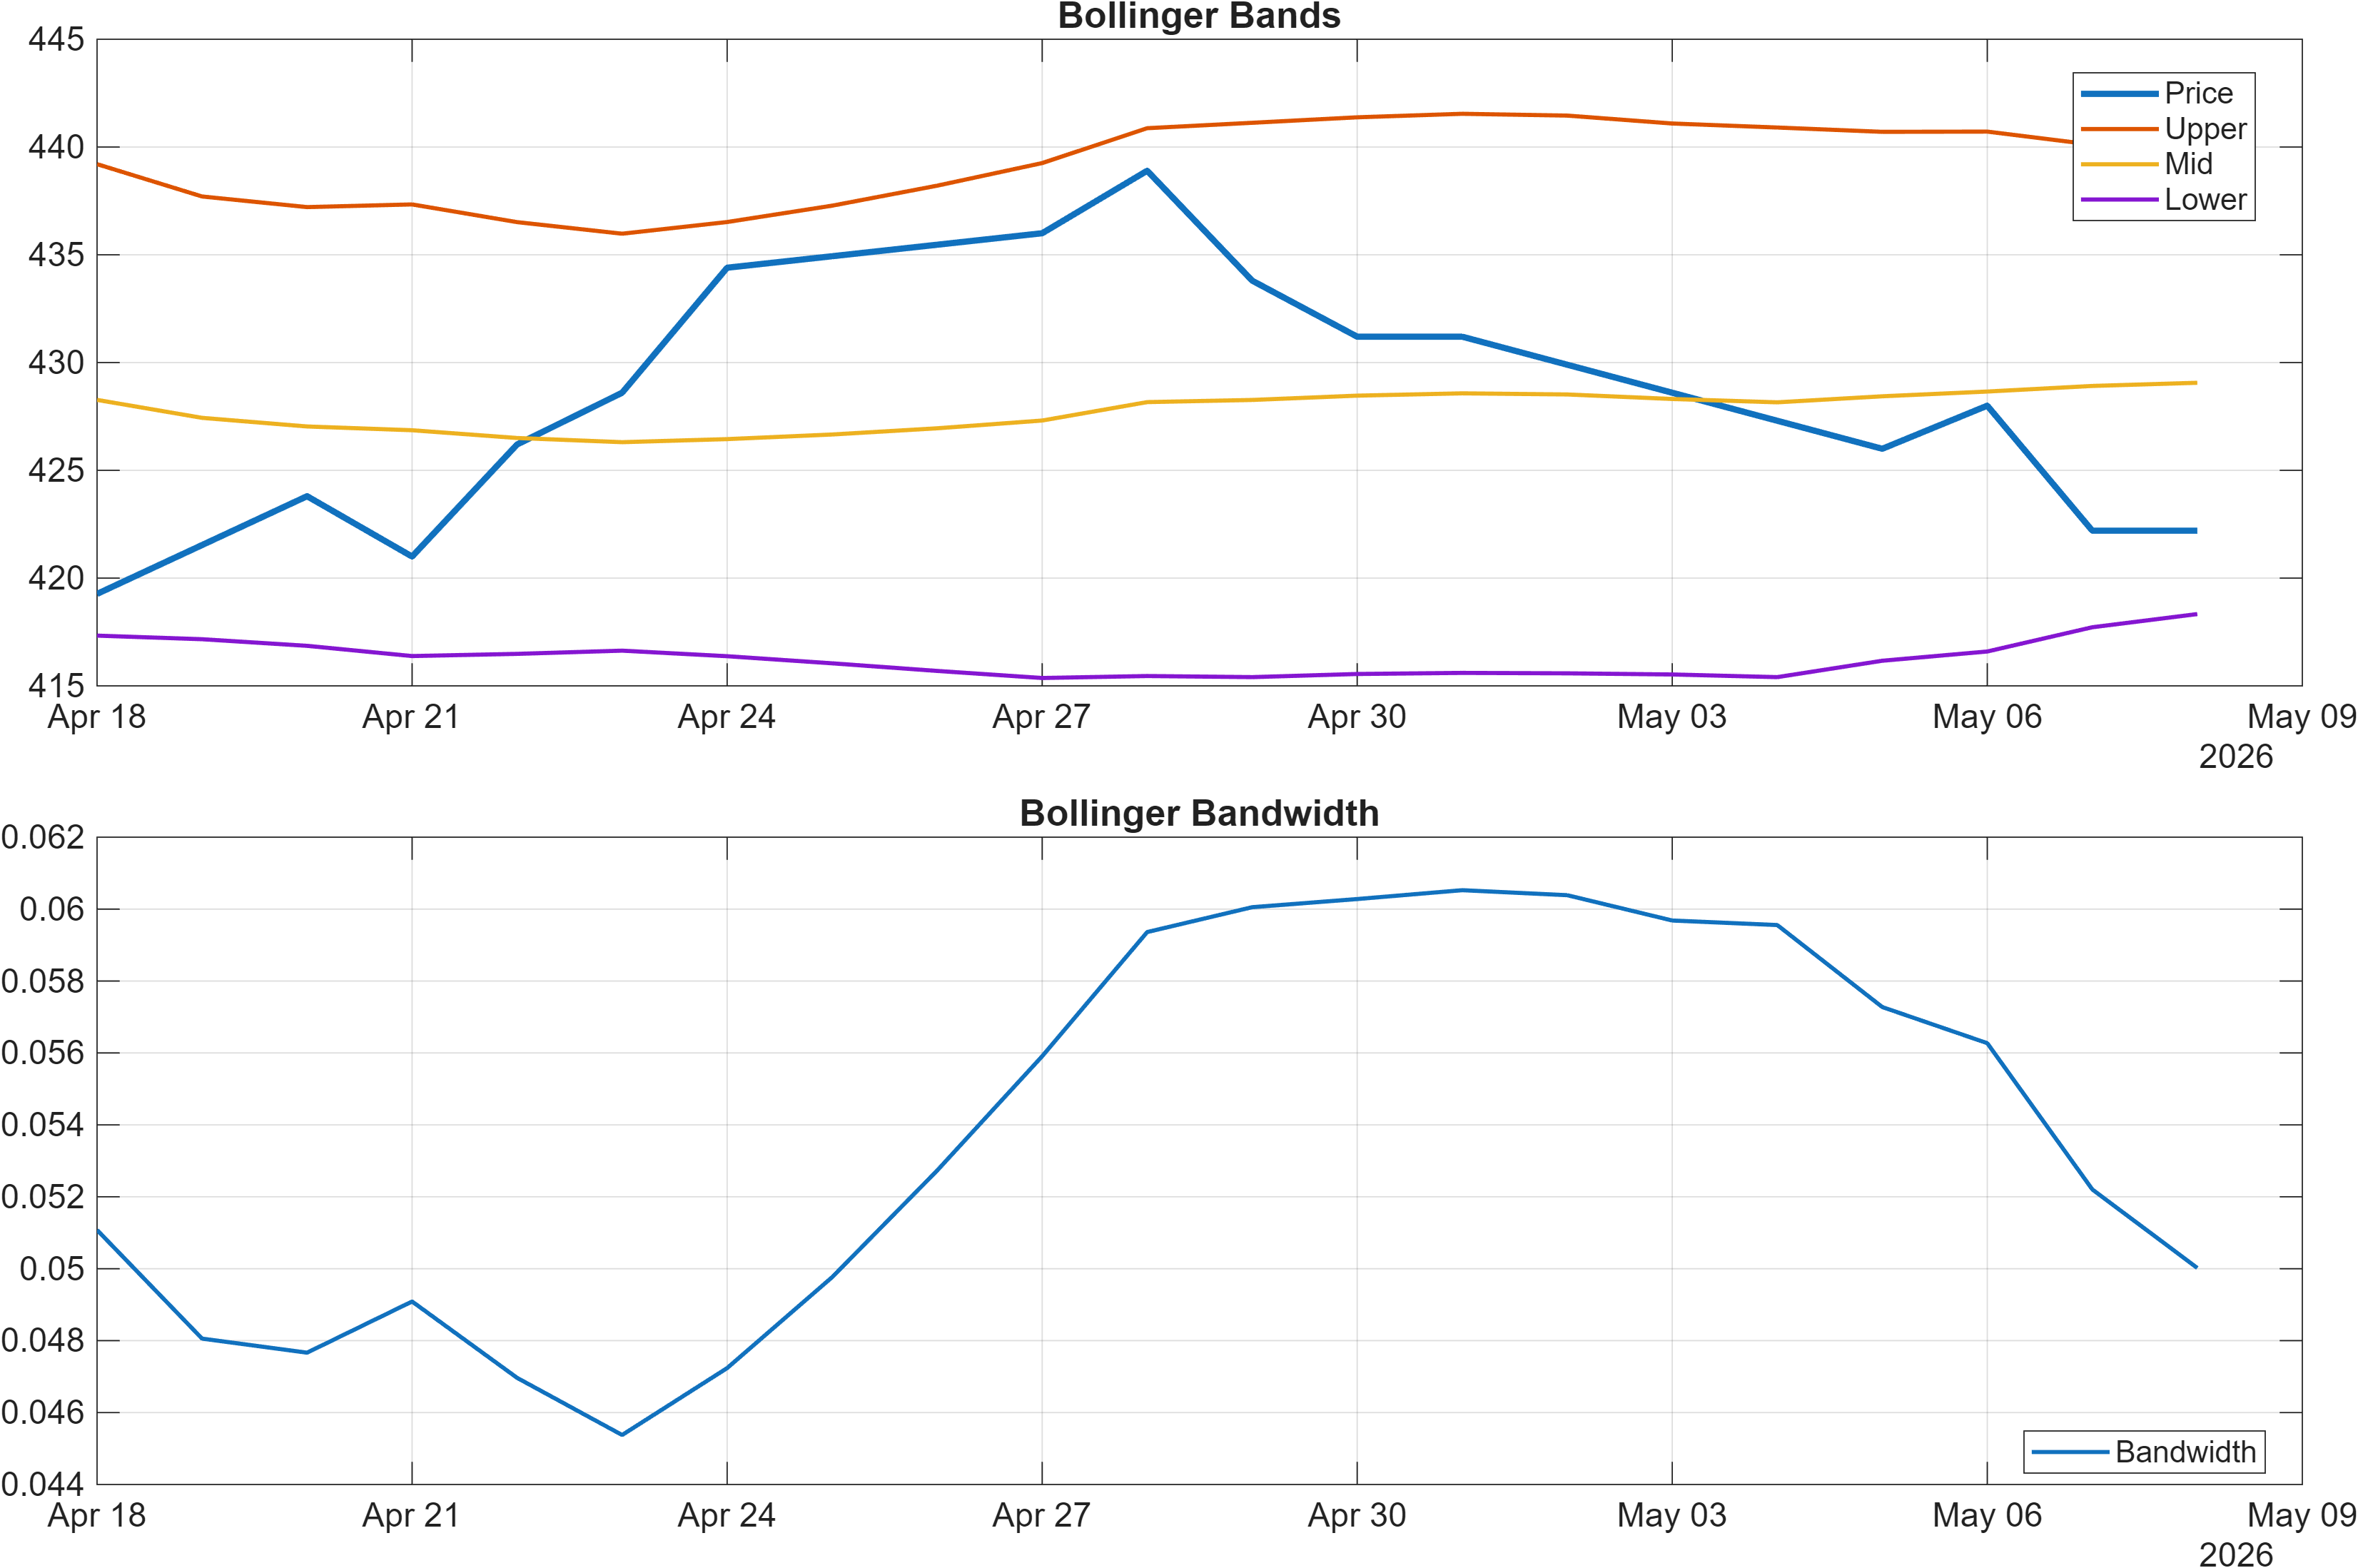
Interpretation: Bandwidth (volatility regime) latest = 0.0500.
Momentum tension: oversold oscillator vs negative trend impulse
The momentum layer is best read as a tension between exhaustion and confirmation. RSI(14) at 25.79 signals an oversold condition and is labeled bearish in the dashboard, reflecting weak recent momentum. However, oversold readings can function as either a warning (weakness persists) or a setup (selling pressure becomes stretched). The differentiator is usually whether trend-following measures begin to stabilize.
On that front, the MACD histogram at -1.2123 remains negative, indicating downside impulse is still present. When RSI is deeply depressed while MACD remains below zero, markets often require base-building—a period where momentum stops deteriorating—before trend-following signals can turn.
Volatility regime: contained bandwidth can precede a directional move
Bollinger bandwidth at 0.0500 indicates a relatively contained volatility regime. Low-to-moderate bandwidth environments can persist, but they also create conditions where a break of well-defined levels (Section 4) becomes more informative because there is less “noise” to obscure follow-through. The practical implication is that a directional resolution may be expressed through compression-to-expansion dynamics: if price begins to move with a widening band structure, the probability of sustained follow-through tends to rise.
How this interacts with trend structure
The mixed MA message from Section 2 aligns with these readings: oversold RSI suggests the pullback may be mature, yet negative MACD argues for caution until the impulse begins to recover. In this context, the support at 414.5000 functions as the nearest “risk boundary,” while resistance at 436.5333 becomes the level where momentum repair is most credibly confirmed.
4) Support / Resistance zones
Support ~ 414.5000 | Resistance ~ 436.5333
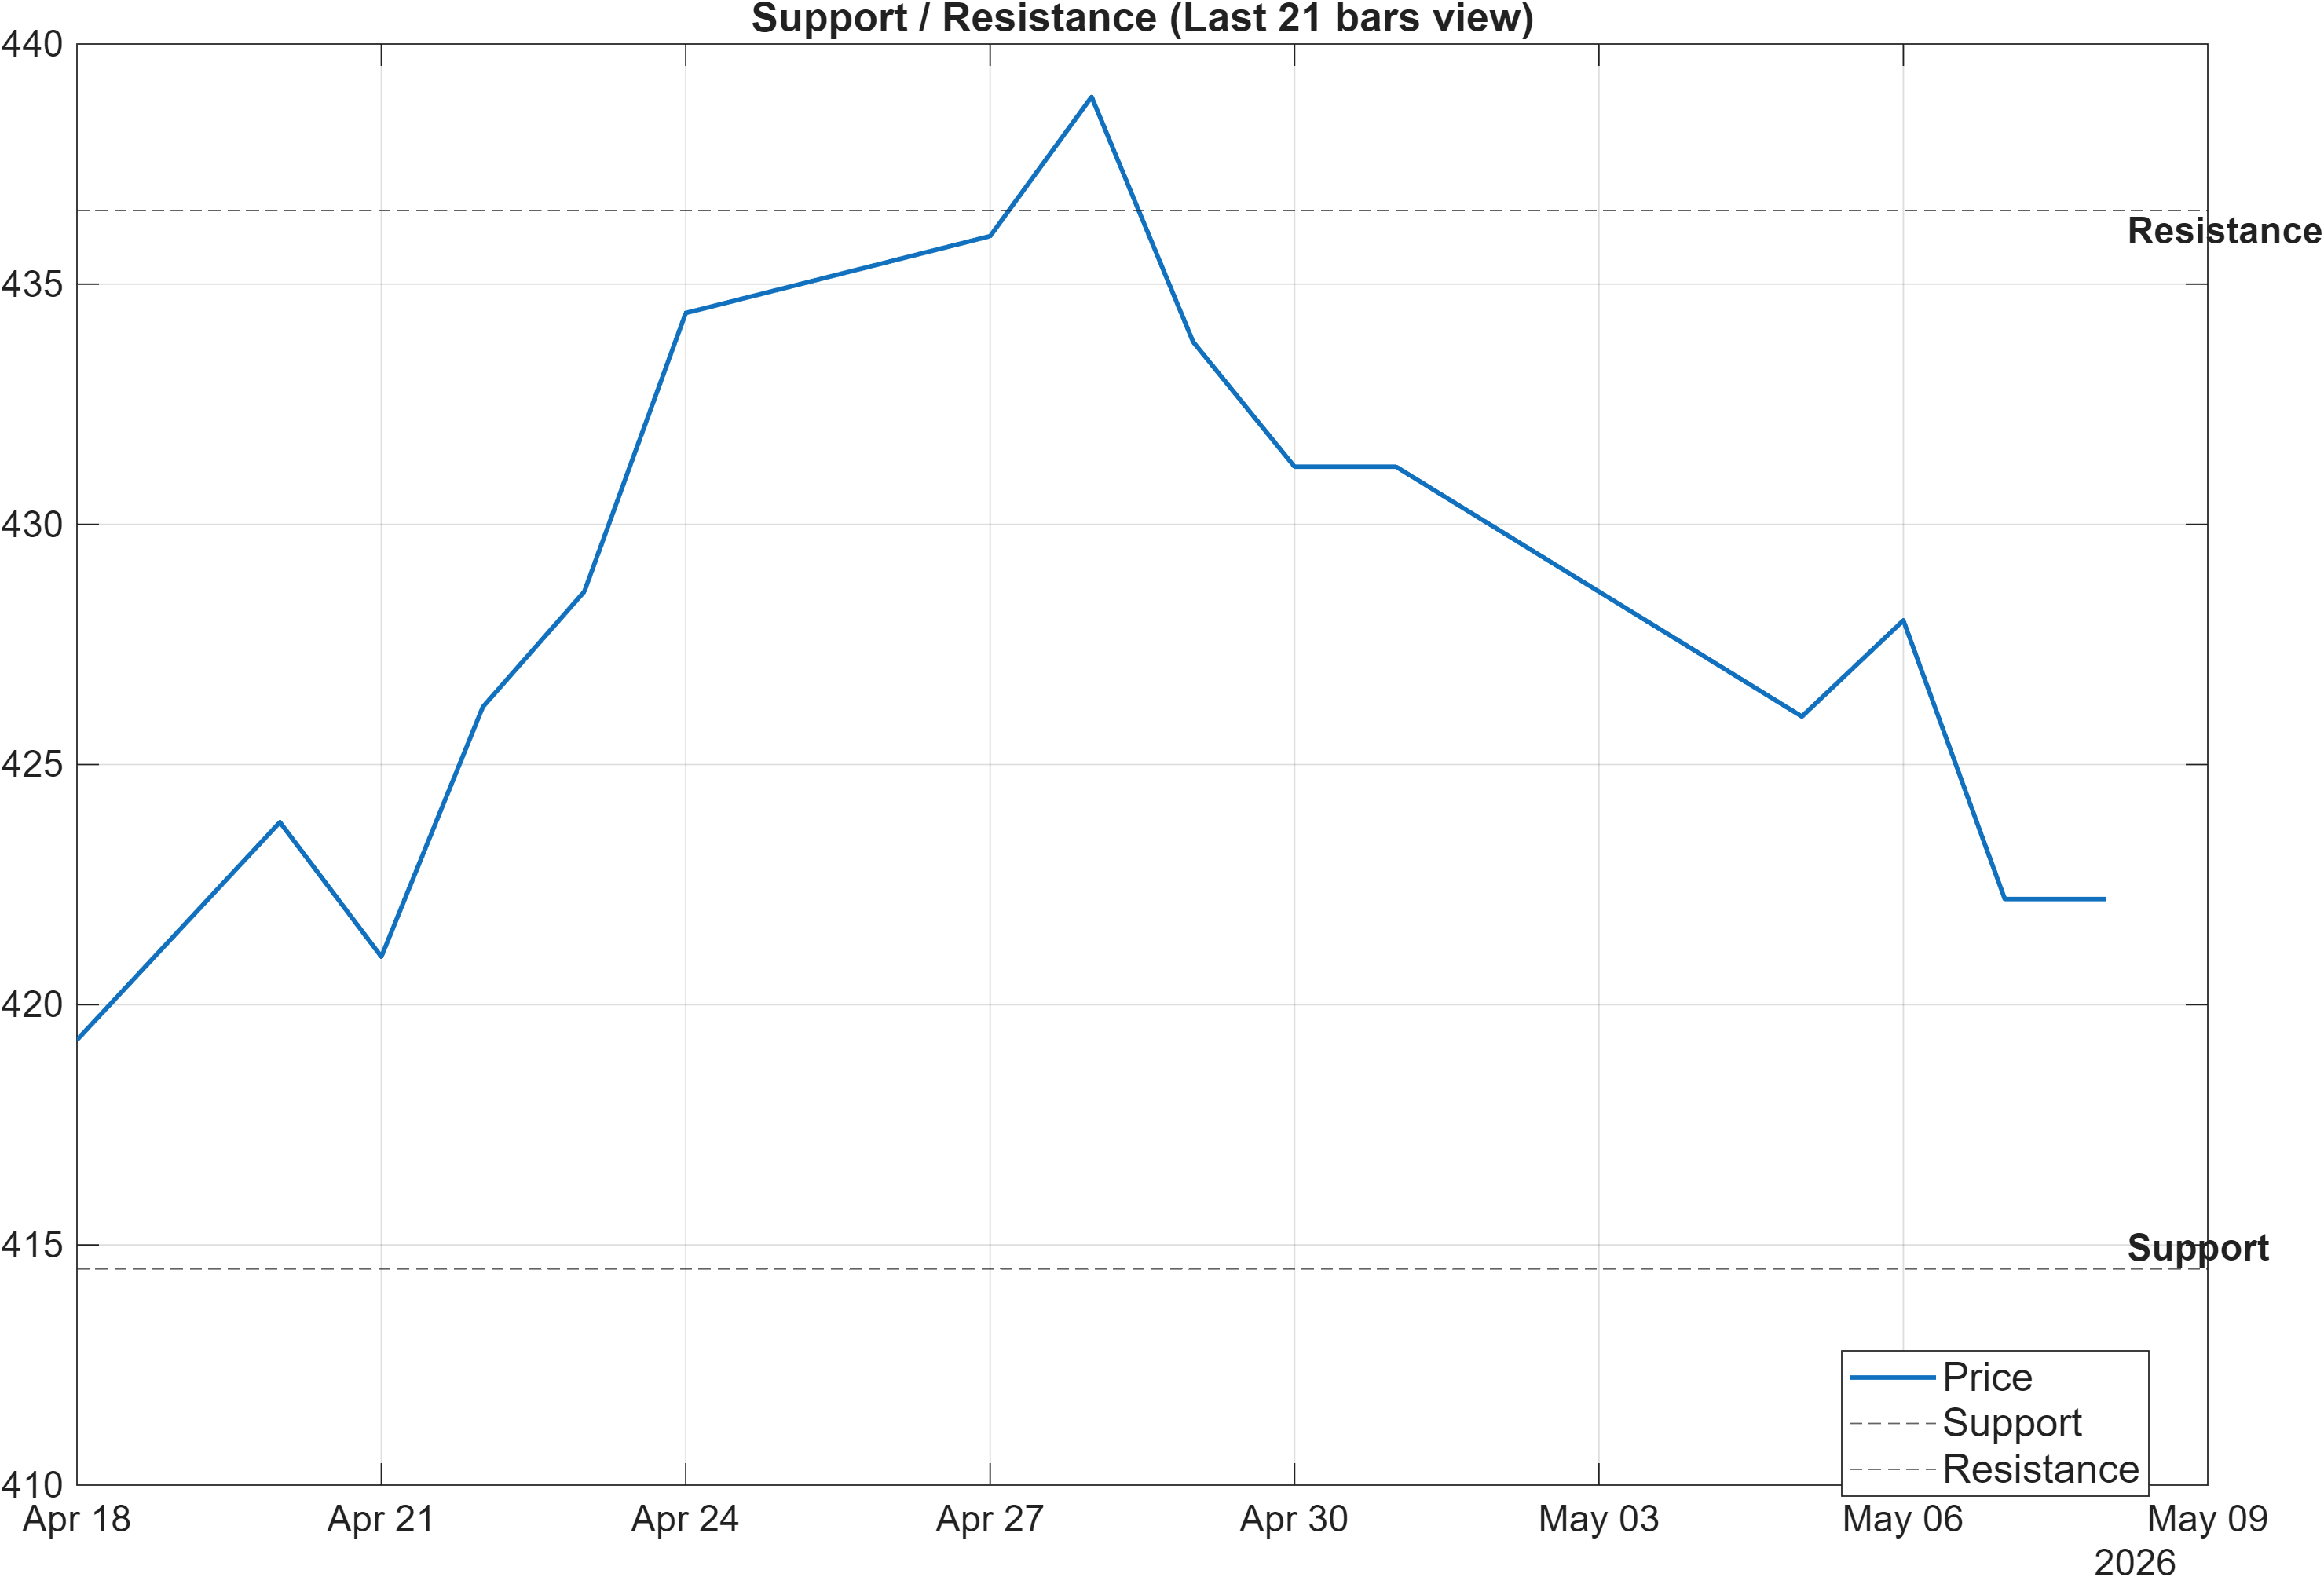
Scenario view: Break above resistance with volume → continuation. Close below support → signal deterioration risk.
Decision zones: where mixed signals become actionable
With momentum and trend indicators sending mixed messages, the support/resistance framework becomes the primary map for conditional interpretation. Support near 414.5000 is the level where the pullback thesis can remain intact; sustained trade below it increases the probability that weakness is not merely a tactical retracement. Resistance near 436.5333 is where a recovery would shift the market back toward a more constructive price structure.
Confluence with the 20-day range markers
The technical dashboard provides additional context around these zones via the 20-day extrema: HHIGH(20) at 440.4 and LLOW(20) at 416.7. The proximity of LLOW(20) to the stated support suggests the market has recently explored the lower part of its short-term range, consistent with the oversold RSI(14) at 25.79. Meanwhile, resistance is positioned close to the recent upper bound, meaning a move through 436.5333 would also be pressuring the range ceiling.
Continuation vs deterioration: tying price levels to confirmation criteria
The report’s scenario logic is intentionally conditional: a break above resistance with volume is the cleanest way to reconcile the bullish longer-horizon ranks (for example, yearly #11) with the current mixed technical posture. Conversely, a close below 414.5000 would be consistent with the bearish elements still present in momentum/trend-following signals (e.g., MACD histogram -1.2123), making the longer-horizon ranks less immediately actionable.
5) Quant Technical Dashboard (18 Signals)
KGNAI AI Technical Analysis Score (Deep Reinforcement Learning): Rank #1288 out of 1419 (Rank 1 represents the strongest technical positioning and a higher probability of favorable price behavior. As ranks increase toward the maximum, the probability of favorable outcomes weakens and bearish positioning becomes more dominant.) | Label: Bearish | Score: -0.815
18-Signal Technical Confluence Score: 0.056 (Neutral)
Overall Technical Score (18-signal confluence + DRL rank blend): -0.206 (Neutral)
Note: The blended score reflects signal strength weighted against broader AI technical ranking, which may temporarily diverge.
Blended technical score breakdown: -0.206 (Neutral | Bull 8 / Bear 7 / Neutral 3)
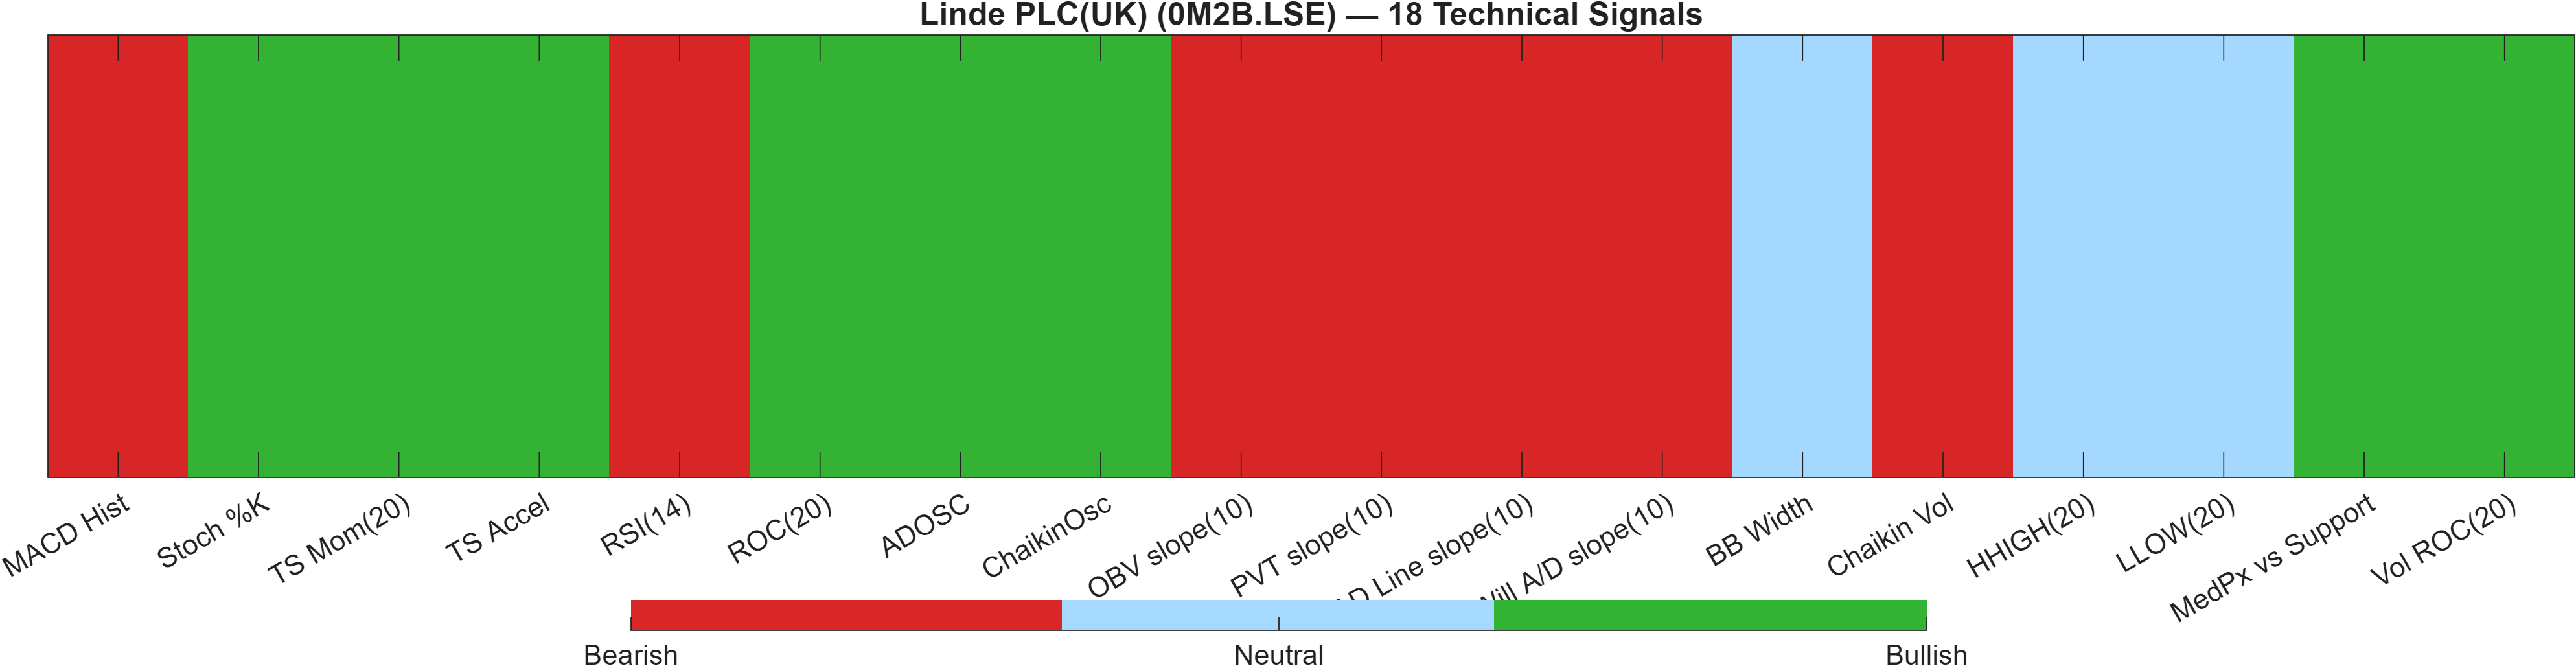
Confluence vs. model rank: why “Neutral” can coexist with a bearish DRL label
This section highlights an important internal divergence. The 18-signal confluence score is 0.056 (Neutral) and the blended overall technical score is -0.206 (Neutral), yet the Deep Reinforcement Learning (DRL) technical rank is #1288 out of 1419 with a -0.815 score and a bearish label. That split typically indicates that while the indicator stack is relatively balanced (Bull 8 vs Bear 7 with 3 neutral), the separate AI technical model is detecting an unfavorable pattern regime compared to the broader universe.
Signal mix: where the bullish and bearish evidence concentrates
The bearish weight is concentrated in trend/volume-adjacent components: MACD histogram is -1.212 (Bearish) and RSI(14) is 25.79 (Bearish), while OBV slope(10) at -2530 and PVT slope(10) at -22.12 point to weaker accumulation characteristics. Offsetting this, multiple momentum and participation proxies register bullish: Stoch %K at 18.68 is labeled bullish (often consistent with “oversold bounce risk”), TS Accel at 10.93 is bullish, and Vol ROC(20) at 100.1 is also bullish—suggesting that when activity arrives, it may be meaningful.
Compression risk: neutral volatility and range markers
BB Width at 0.05002 is Neutral, reinforcing the notion of a market that may be compressing rather than trending cleanly. With HHIGH(20) at 440.4 and LLOW(20) at 416.7, the technical state reads like a bounded range where the next break (not the current position) may determine whether the bullish rank backdrop can translate into a more favorable technical regime.
Signal table (Bull/Bear/Neutral)
| Indicator | Value | Signal |
|---|---|---|
| MACD Hist | -1.212 | Bearish |
| Stoch %K | 18.68 | Bullish |
| TS Mom(20) | 0.6667 | Bullish |
| TS Accel | 10.93 | Bullish |
| RSI(14) | 25.79 | Bearish |
| ROC(20) | 0.1582 | Bullish |
| ADOSC | 1.22 | Bullish |
| ChaikinOsc | 2764 | Bullish |
| OBV slope(10) | -2530 | Bearish |
| PVT slope(10) | -22.12 | Bearish |
| AD Line slope(10) | -498.9 | Bearish |
| Will A/D slope(10) | -11.7 | Bearish |
| BB Width | 0.05002 | Neutral |
| Chaikin Vol | 6.44 | Bearish |
| HHIGH(20) | 440.4 | Neutral |
| LLOW(20) | 416.7 | Neutral |
| MedPx vs Support | 11.6 | Bullish |
| Vol ROC(20) | 100.1 | Bullish |
Interpretation: Indicator-level signals form the base confluence, which is then adjusted using a separate AI-driven technical ranking model. The final technical score summarizes this combined view.
6) News sentiment + extractive gist
Note: Instrument-specific news matches were not found, so the digest includes broader market/sector headlines. Links are provided for verification.
Sentiment score (avg): 0.000 | Positive: 6% | Neutral: 88% | Negative: 6%
KGNAI AI News Sentiment Score (normalized -1 to +1): Not available (as of —) | Label: Not available | Overall news score: 0.00
Positive Developments
Recent coverage across major financial outlets indicates a largely calm information backdrop for this instrument’s immediate narrative, consistent with the sentiment distribution being overwhelmingly Neutral (88%) and only 6% positive. The constructive element is less about issuer-specific catalysts (not available in the provided data) and more about the absence of persistent negative thematic pressure in the feed. In this context, a flat average sentiment score of 0.000 can still be supportive for technically mixed setups, because it reduces the chance that adverse headline flow becomes the driver of volatility expansion. For a stock exhibiting compressed volatility (bandwidth near 0.0500) and defined levels (support 414.5000, resistance 436.5333), stable macro/sector tone can allow the price structure to resolve more “technically,” with follow-through hinging more on participation/volume confirmation than on narrative shocks.
Neutral / Mixed Developments
The digest is dominated by broader macro and geopolitical items rather than company-specific developments, which aligns with the platform note that instrument-specific matches were not found. That limitation matters: when the dataset is not issuer-targeted, sentiment should be treated as contextual background rather than a direct driver of single-name price discovery. The overall news score remains 0.00, and the KGNAI AI News Sentiment Score is Not available as of the stated timestamp, reinforcing that the signal value here is mainly the lack of skew. In practical reading, a neutral backdrop neither validates nor contradicts the bullish longer-horizon rank posture (e.g., yearly rank #11), leaving technical confirmation (RSI/MACD and key levels) to carry more weight in the near term.
Negative / Risk Signals
The negative bucket remains limited (6%) but is not irrelevant given the current technical fragility signaled by a negative MACD histogram (-1.2123) and bearish close vs MA50. Broad risk items—particularly those tied to policy uncertainty, rates, and geopolitical friction—tend to express themselves through risk-off correlation rather than through issuer idiosyncrasy, which can still pressure price if market-wide volatility rises from a compressed regime. With support defined near 414.5000, the main risk is that an external shock accelerates a move through that level before momentum can stabilize. Conversely, if broader risk headlines fade without escalation, the oversold RSI(14) at 25.79 is more likely to function as a mean-reversion condition rather than a prelude to continued deterioration.
- Whether price behavior confirms 436.5333 as a breakout threshold with participation, or rejects it.
- Whether downside probes hold above 414.5000 as RSI remains depressed.
- Any shift away from the current 88% neutral sentiment mix that coincides with volatility expansion.
Snapshot: AI Rank (Short–Mid–Long): Bullish (Bullish–Bullish–Bullish) · Technical Confluence: Neutral · Key Levels: Support ~414.50 | Resistance ~436.53 · News Sentiment: Neutral
Sources referenced: Reuters, Bloomberg, Yahoo Finance, MarketWatch, Investing.com
7) Sources
- US and Iran clash in Hormuz as ceasefire comes under strain — https://www.ft.com/content/90225b9c-707c-4877-931d-5022d1ed583f
- Trump halted ‘Project Freedom’ after Saudi Arabia withheld support — https://www.ft.com/content/13070f17-854d-460e-b97f-9ea535d93e64
- ‘Maga divorce’: how Trump’s Iran war is splitting the US right — https://www.ft.com/content/32d37b38-9585-487d-898e-337672d071da
- ‘Blissful ignorance’: Milken elite bask in glow of roaring markets — https://www.ft.com/content/383df7c6-7111-49df-82ef-899bbdb3e419
- Apple, Berkshire and the virtue of patience — https://www.ft.com/content/2a5ee111-93f1-4fd2-8d22-1b3ba2d128c6
- Trump’s 10% global tariff ruled illegal by US court — https://www.ft.com/content/a53ed6cc-bbef-4527-a19c-8041118e3661
- Trump extends EU trade deal deadline while issuing fresh threat — https://www.ft.com/content/10714a34-2976-4edd-bede-e892eff02d45
- IMF warns new AI models risk ‘systemic’ shock to finance — https://www.ft.com/content/103d73d3-7119-4dee-8c47-b3fc62d2f1e6
You may also like: How KGNAI AI ranks instruments across global markets
Disclaimer: KGNAI provides AI-generated analytics and educational market commentary only. This is not financial advice. Markets involve risk. Always do your own research.