
VAL.LSE (ValiRx plc) — 06-May-2026 Technical & Sentiment Read: Bearish Alignment Across Ranks
ValiRx plc (VAL.LSE) screens as broadly weak within KGNAI’s Europe universe on 06-May-2026, with short-, mid-, and long-horizon ranks clustered near the bottom of a 1,419-instrument set. The evidence set is not dominated by one indicator; instead, it reflects multi-horizon rank pressure alongside a bearish moving-average regime and a negative momentum profile. The 18-signal confluence score is negative, and the blended technical view remains bearish, indicating that most independent signal groups are not confirming a stabilization phase. Volatility is measurable rather than compressed, with Bollinger bandwidth at 0.1059, so downside continuation risk can remain active even without a new volatility expansion trigger. With support identified near 0.2700 and resistance near 0.3322, validation hinges on whether price can reclaim resistance with participation or instead breaks below support and deteriorates further.
- Short / Mid / Long rank stance: Bearish / Bearish / Bearish (ranks positioned in the lower tail of the 1,419 universe).
- Technical confluence label: Bearish (Overall Technical Score: -0.586).
- Key levels: Support ~ 0.2700 | Resistance ~ 0.3322.
- News sentiment bias: Negative (avg: -0.209; Negative: 100%).
- Confirmation / invalidation condition: A sustained move above 0.3322 with volume would be required to challenge the bearish structure; a close below 0.2700 increases deterioration risk.
KGNAI evaluates assets using large cross-sectional datasets built from millions of structured data points. Inputs incorporate fundamental metrics, technical structures, and systematically processed news sentiment. Statistical models, machine learning, and AI frameworks are used to assess relative positioning, signal alignment, and probabilistic behavior across broad universes.
- Ranks are comparative across the tracked universe, not absolute price targets.
- Confluence reflects alignment among independent signal groups.
- Support/resistance levels are probabilistic decision zones, not guarantees.
- Sentiment provides contextual bias within the broader analytical framework.
1) KGNAI AI Analysis
Within the EUROPE region, VAL.LSE is positioned in the weakest portion of KGNAI’s 1,419-instrument universe across every reported horizon, indicating that the model set is not detecting a time-frame “escape hatch.” The daily rank #1361, weekly rank #1417, and monthly rank #1383 cluster near the bottom decile, which typically reflects persistent adverse price behavior characteristics rather than a one-off drawdown. That consistency matters: when short-term and intermediate ranks agree, the probability of mean-reversion signals being durable is generally lower than when ranks diverge.
Longer windows do not materially improve the picture. The 3-month rank #1299, 6-month rank #1301, and yearly rank #1285 remain in the lower tail, suggesting the broader regime is still defined by weak relative behavior. In regime terms, this resembles continuation risk rather than a transitional setup—particularly because the weakest reading appears at the weekly horizon, which often captures the “core” swing structure more effectively than a single day.
- Daily rank: #1361 out of 1419 — Bearish
- Weekly rank: #1417 out of 1419 — Bearish
- Monthly rank: #1383 out of 1419 — Bearish
- 3-Monthly rank: #1299 out of 1419 — Bearish
- 6-Monthly rank: #1301 out of 1419 — Bearish
- Yearly rank: #1285 out of 1419 — Bearish
The term view is uniformly Bearish across short-, mid-, and long-term horizons, and that unanimity reduces the analytical weight of isolated “green shoots” unless they appear as a coordinated shift in both ranks and technical structure. From a positioning perspective, the main question becomes whether any forthcoming improvement is broad-based (rank uplift across horizons) versus narrow (one or two indicators flipping without changing the regime).
KGNAI ranks each instrument across large universes using multiple proprietary AI tests and statistical models (millions of data points). Lower ranks generally indicate stronger probability of favorable performance behavior, while higher ranks indicate weaker probability and more bearish positioning.
Term view: Short-term: Bearish. Mid-term: Bearish. Long-term: Bearish.
Want the full universe and complete rank tables? Unlock full access on KGNAI: https://www.kgnai.com/pricing
2) Price & trend overview
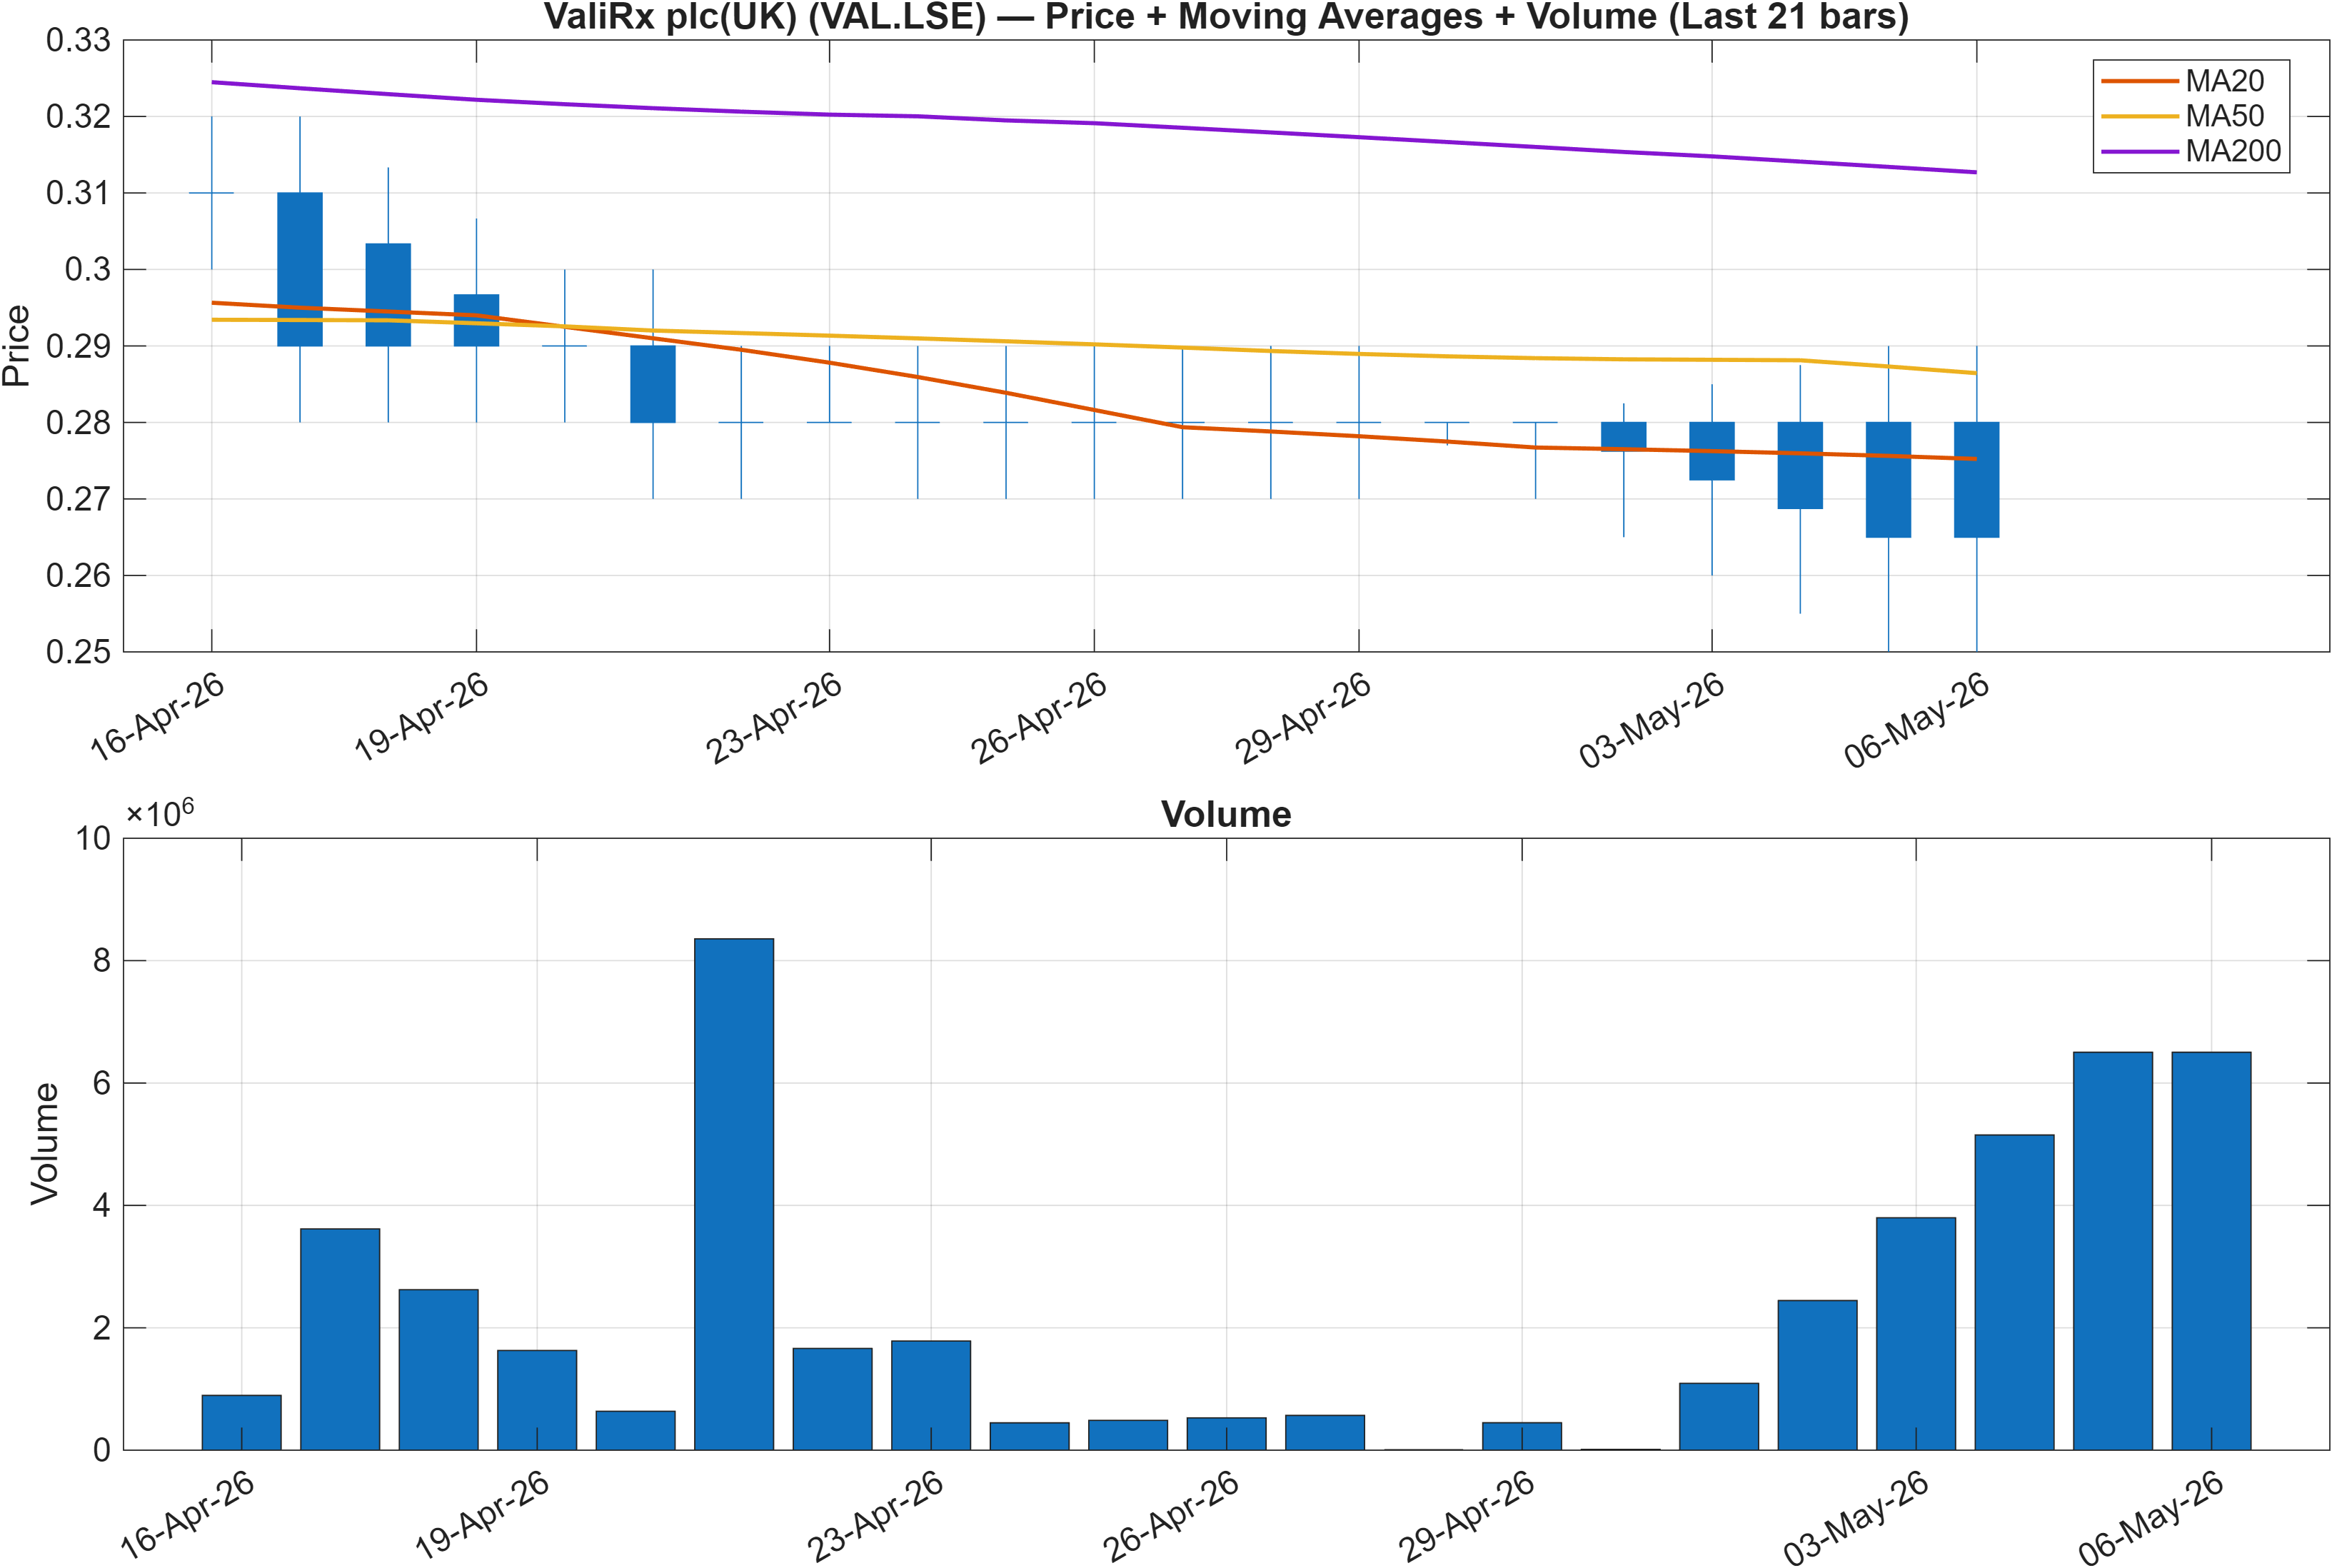
Trend structure is bearish by the report’s moving-average regime: Close vs MA50 = Bearish and MA50 vs MA200 = Bearish. That combination typically signals two layers of headwind—price failing to reclaim its intermediate trend proxy, while the intermediate trend itself remains below the long-term baseline. When both conditions hold, rebounds can occur, but they are less likely to develop into sustained trend reversals without additional confirmation from momentum and breadth/volume indicators.
The practical implication is a regime filter: until the close can consistently improve versus the MA50 (and ultimately shift the MA50/MA200 relationship), bullish interpretations of short-lived bounces should be treated as counter-trend. This is particularly relevant given the weak cross-sectional ranks (for example, weekly #1417 of 1419), which suggest that relative behavior is already under pressure even before considering single-chart patterns.
Volume is shown alongside price in Figure 1, and later signal diagnostics include volume/flow elements (e.g., OBV slope, PVT slope, ADOSC). Taken together, the report is set up to test whether any price rebound is being validated by participation or whether it is primarily mechanical mean reversion. With the stated resistance near 0.3322 and support near 0.2700, this moving-average regime argues for treating those levels as decision points inside a broader downtrend context rather than standalone triggers.
Interpretation: Close vs MA50 = Bearish, MA50 vs MA200 = Bearish.
3) Momentum & volatility dashboard
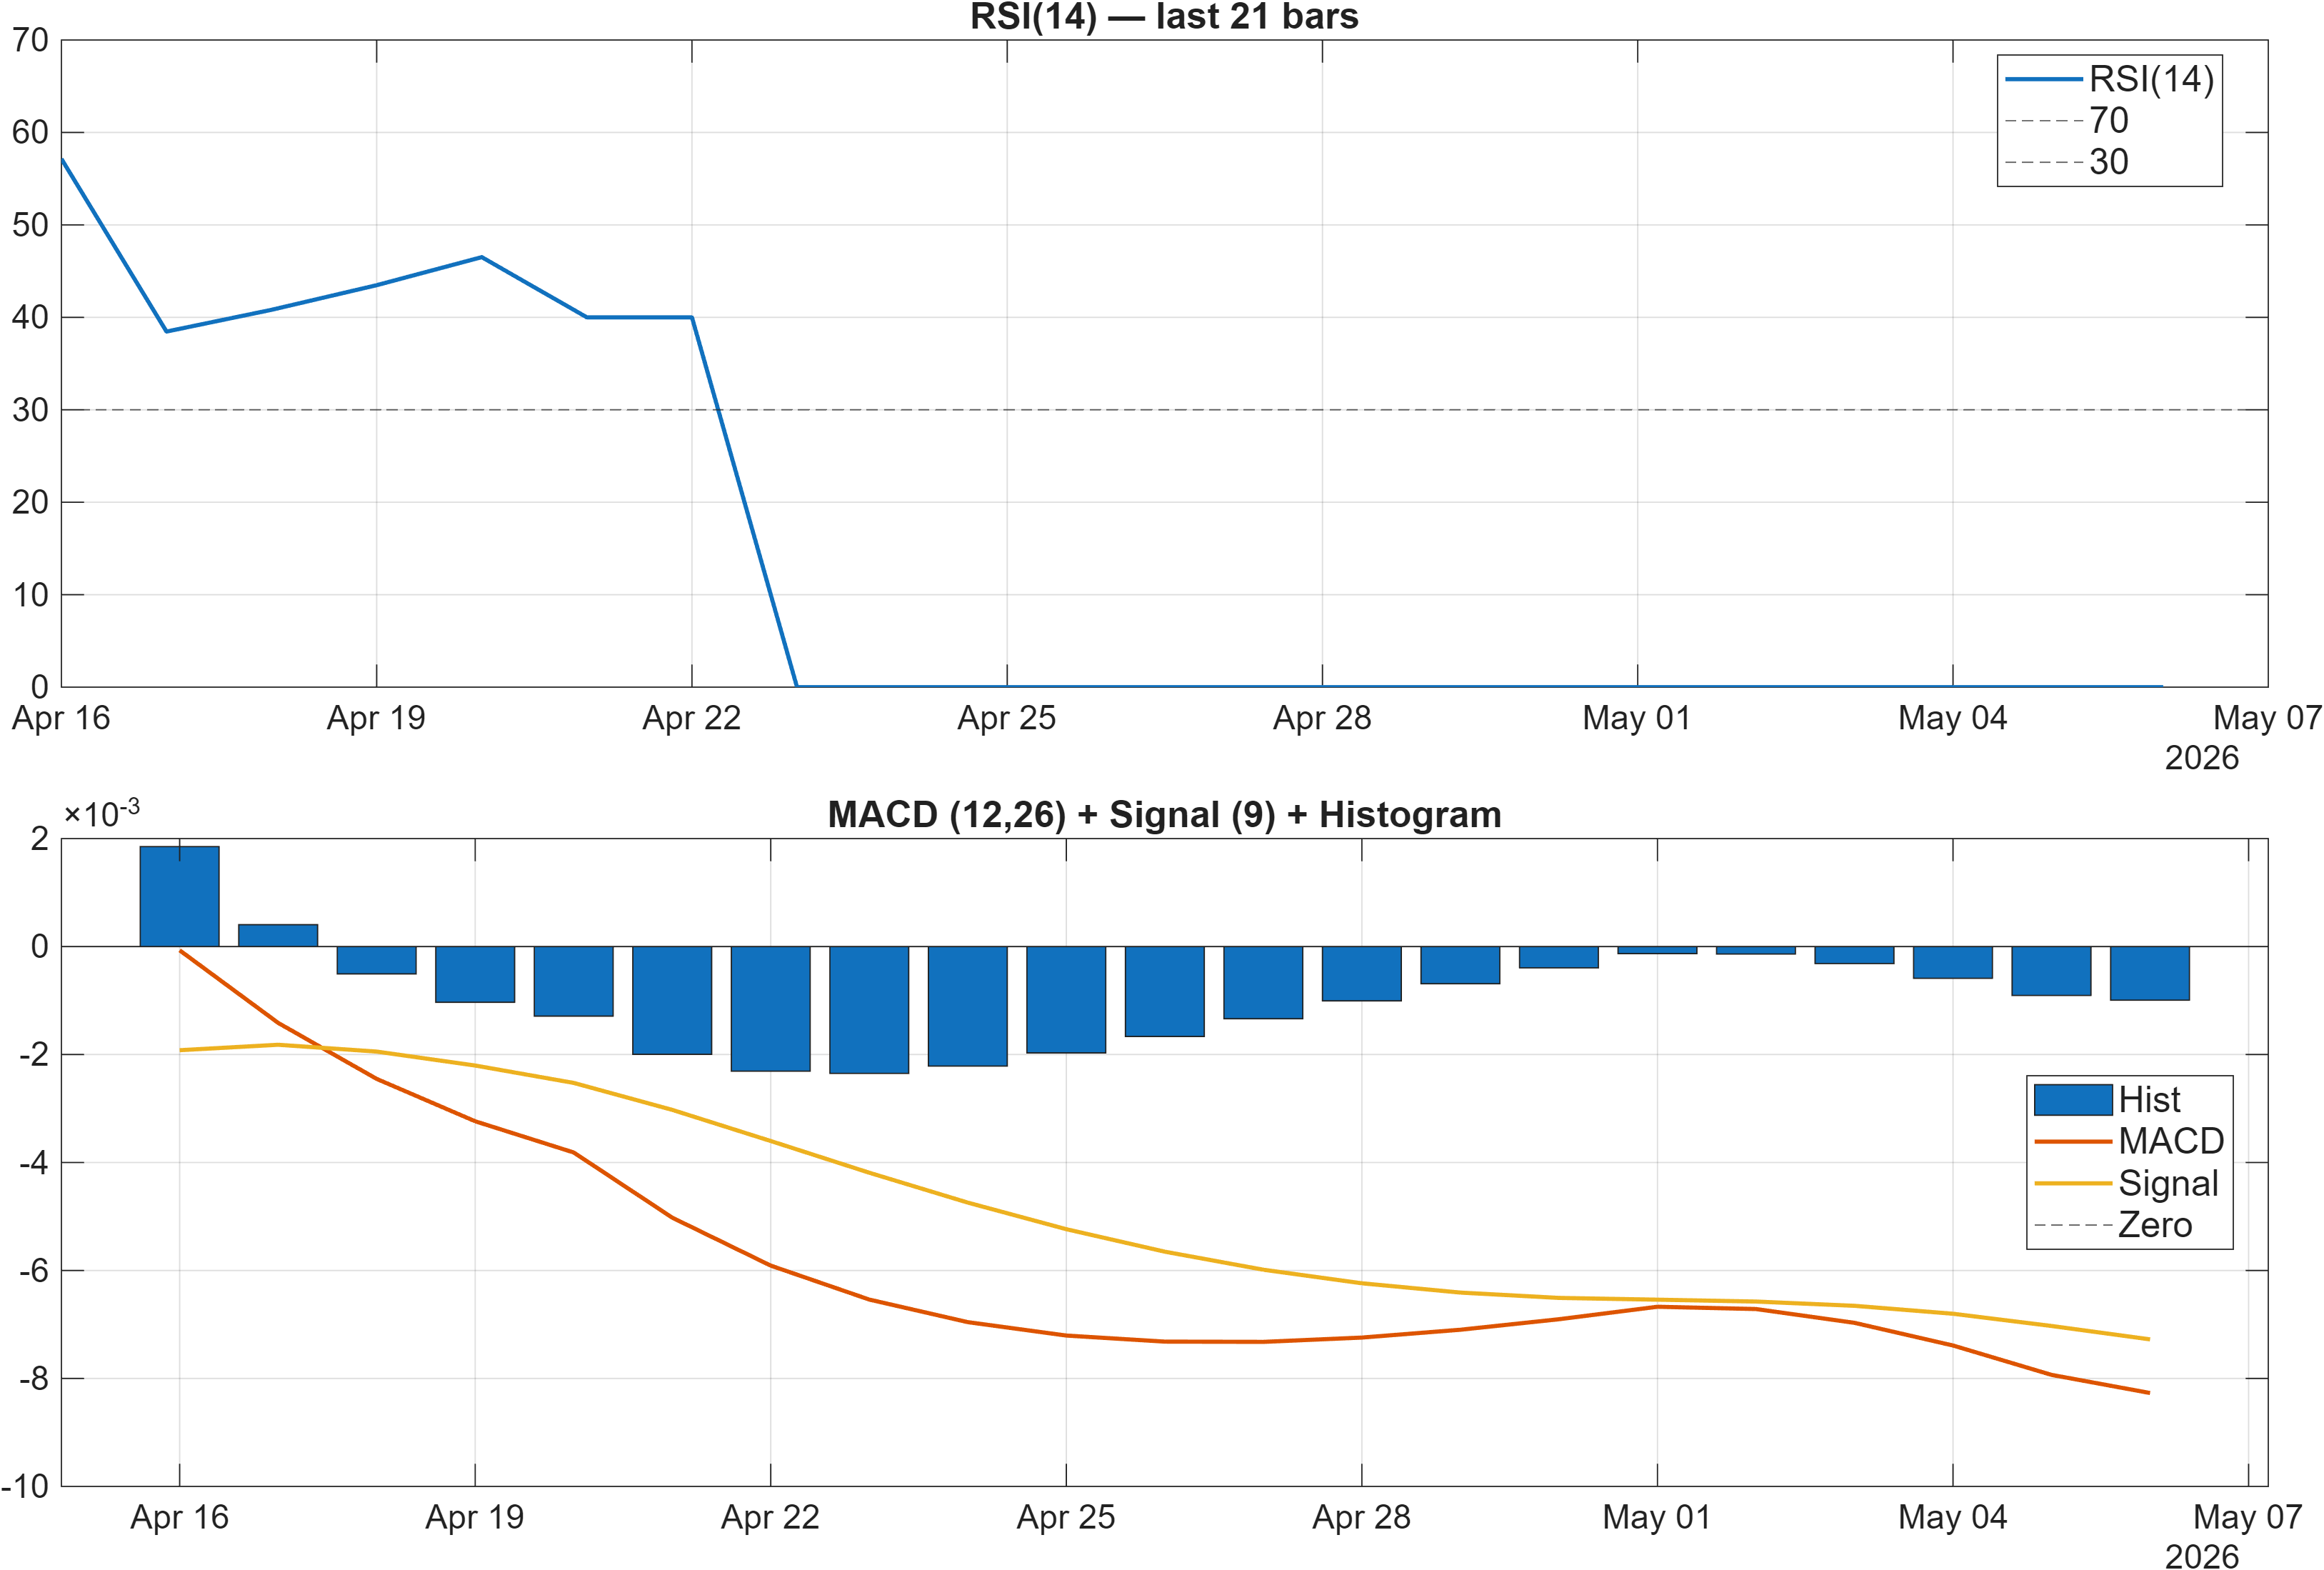
Momentum signals tilt bearish and, importantly, they do not obviously conflict with the trend filter. The dashboard flags RSI bias = Bearish alongside a negative MACD histogram of -0.0010, a combination that is more consistent with weak or deteriorating impulse than with a confirmed base. While RSI and MACD can turn ahead of price, the report’s multi-horizon rank weakness suggests that any early turn would need to be clear and persistent to matter.
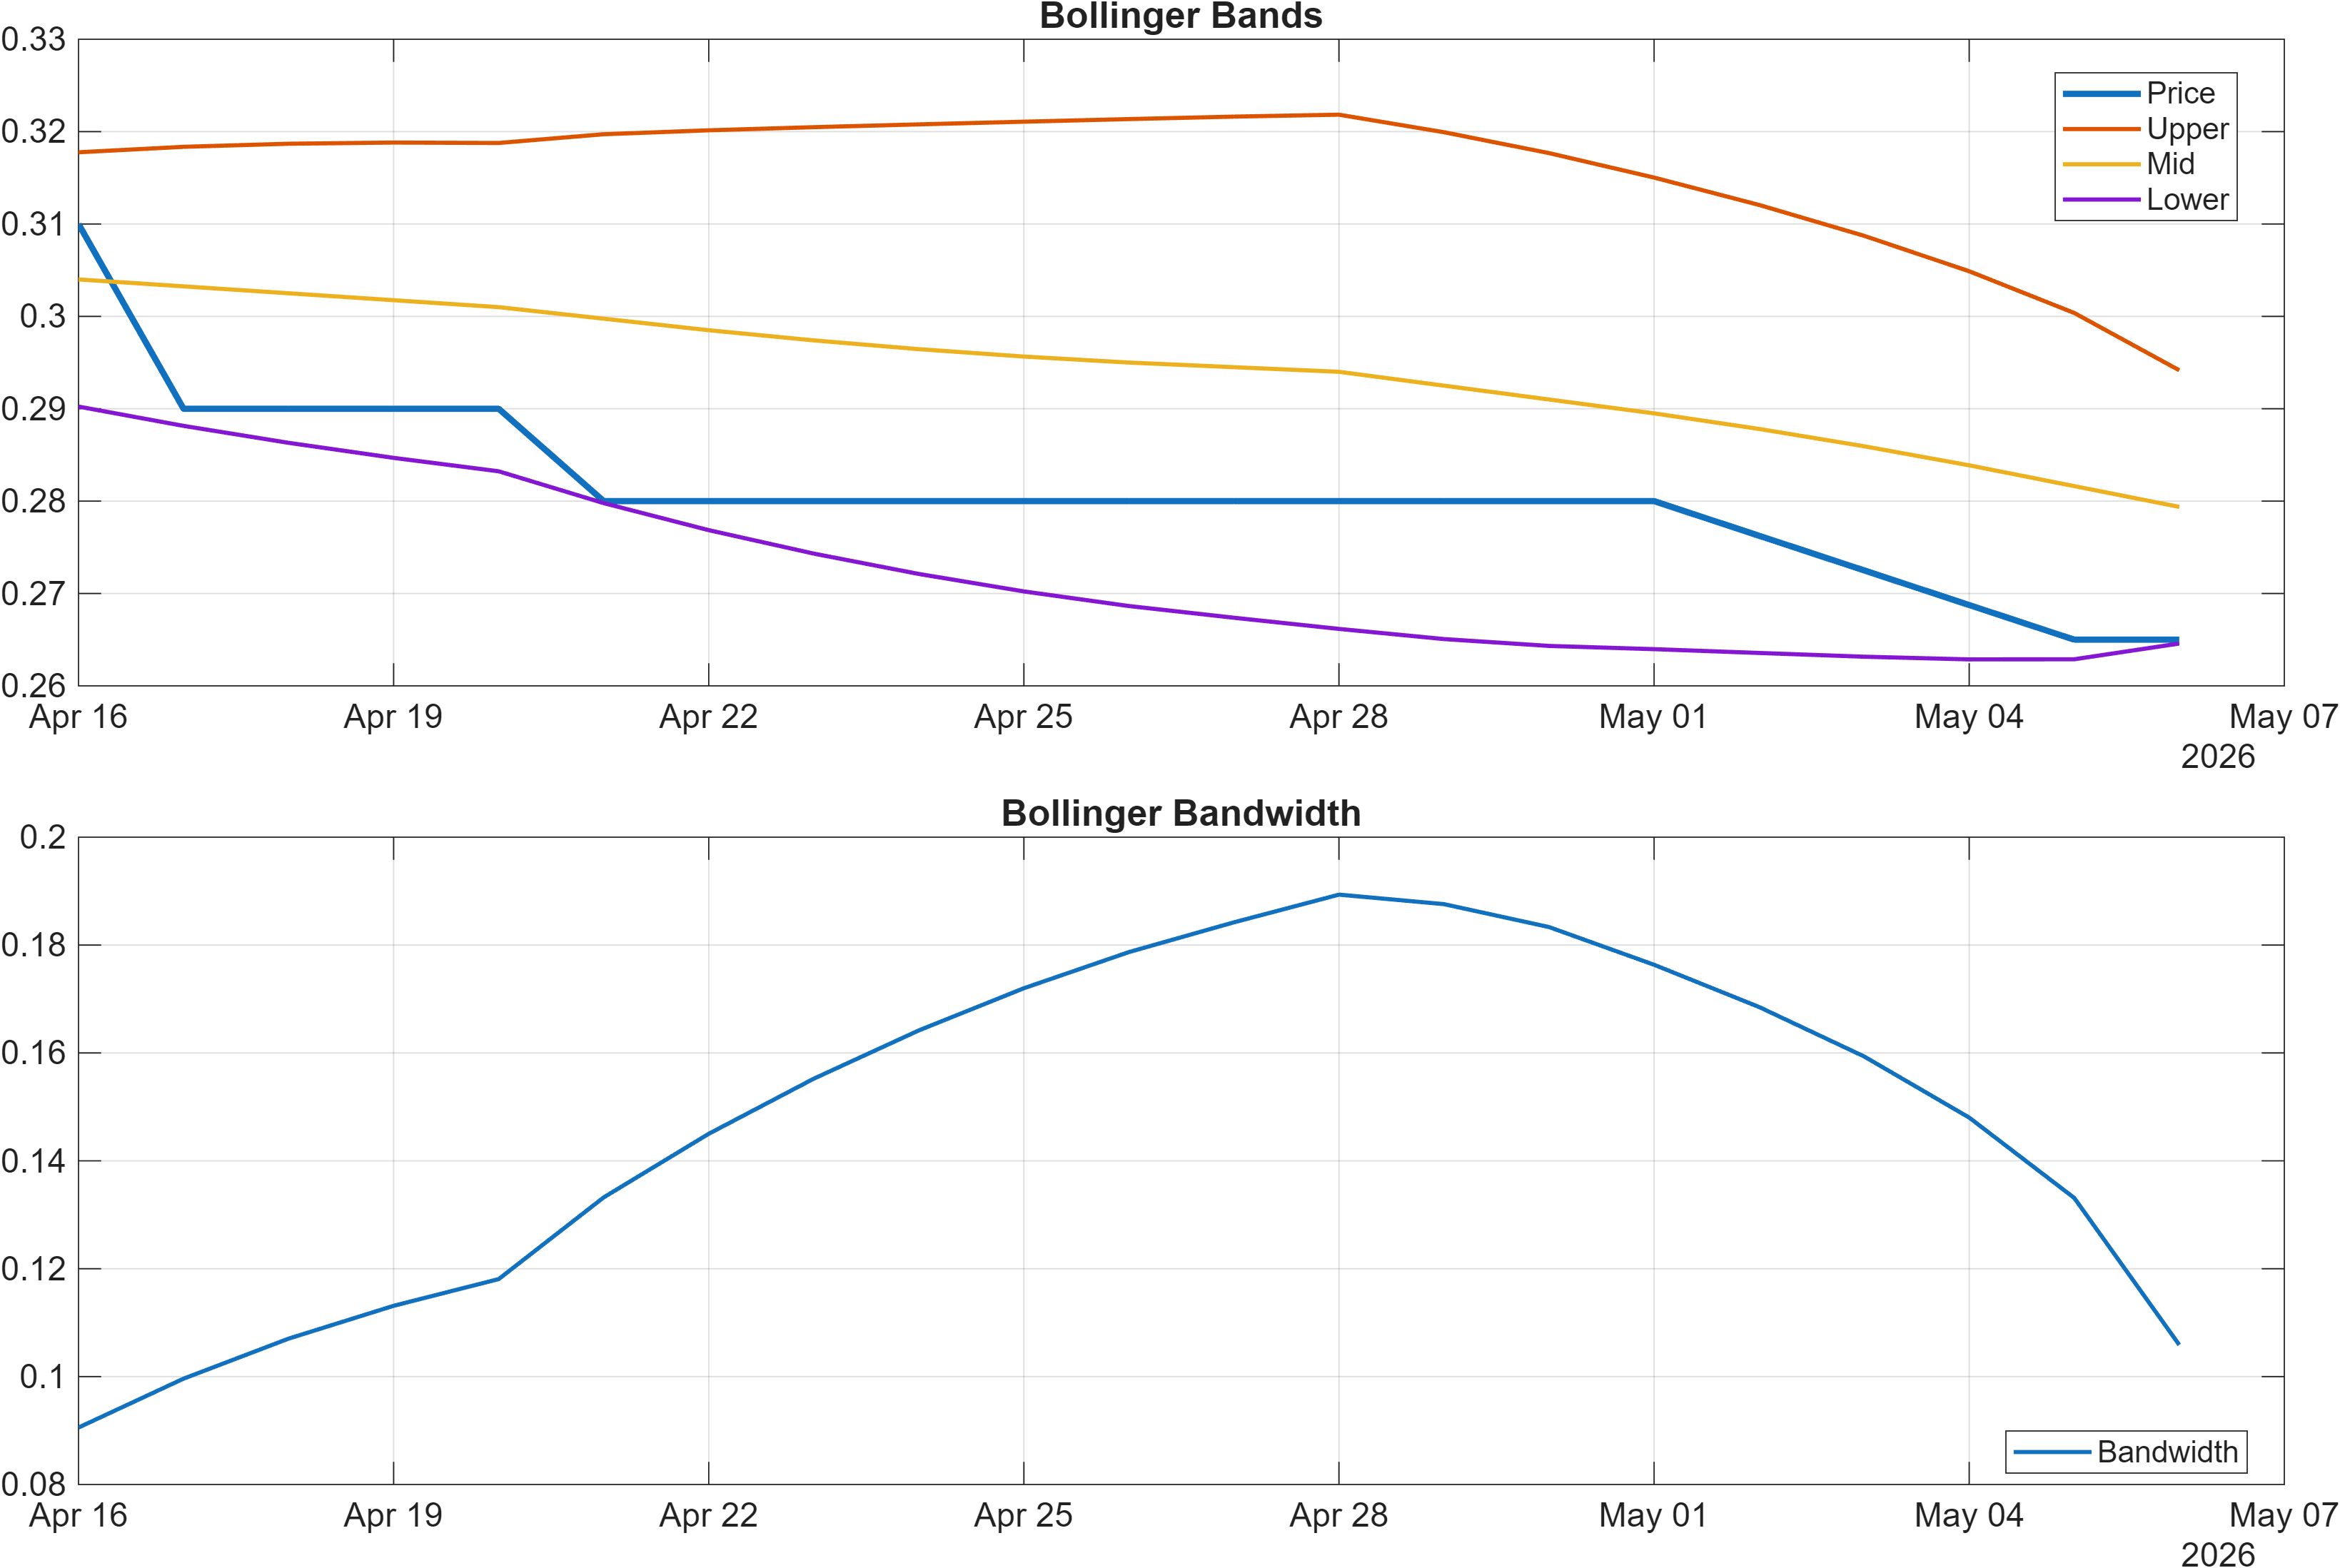
Volatility context is provided via Bollinger Bands, with the latest bandwidth at 0.1059. Rather than implying a tight squeeze, this reading suggests volatility is present enough for directional moves to carry through—meaning the market may not need a fresh “volatility release” to extend a move. In bearish regimes, that matters because downside continuation can occur on normal volatility if momentum remains negative.
The analytical question becomes whether the momentum profile is exhausting or persisting. A persistently negative MACD histogram (here, -0.0010) alongside a bearish RSI bias typically aligns with persistence. For exhaustion to be credible, one would usually look for improving momentum measures while price holds above key support (notably 0.2700) and starts challenging resistance (0.3322) with stronger participation. That confirmation condition is explicitly consistent with the scenario framing in the levels section.
In short, the volatility reading does not, by itself, argue for an imminent reversal; it primarily frames how quickly price may traverse the defined zones. Without a positive inflection in momentum, volatility can amplify drawdowns as easily as it can support rebounds.
Interpretation: RSI bias = Bearish, MACD hist = -0.0010.
Interpretation: Bandwidth (volatility regime) latest = 0.1059.
4) Support / Resistance zones
The report highlights a clean two-level framework: support ~ 0.2700 and resistance ~ 0.3322. With the moving-average regime bearish and momentum biased negative, these zones function less as symmetric “buy/sell” anchors and more as a stress-test for whether selling pressure is stabilizing or re-accelerating.
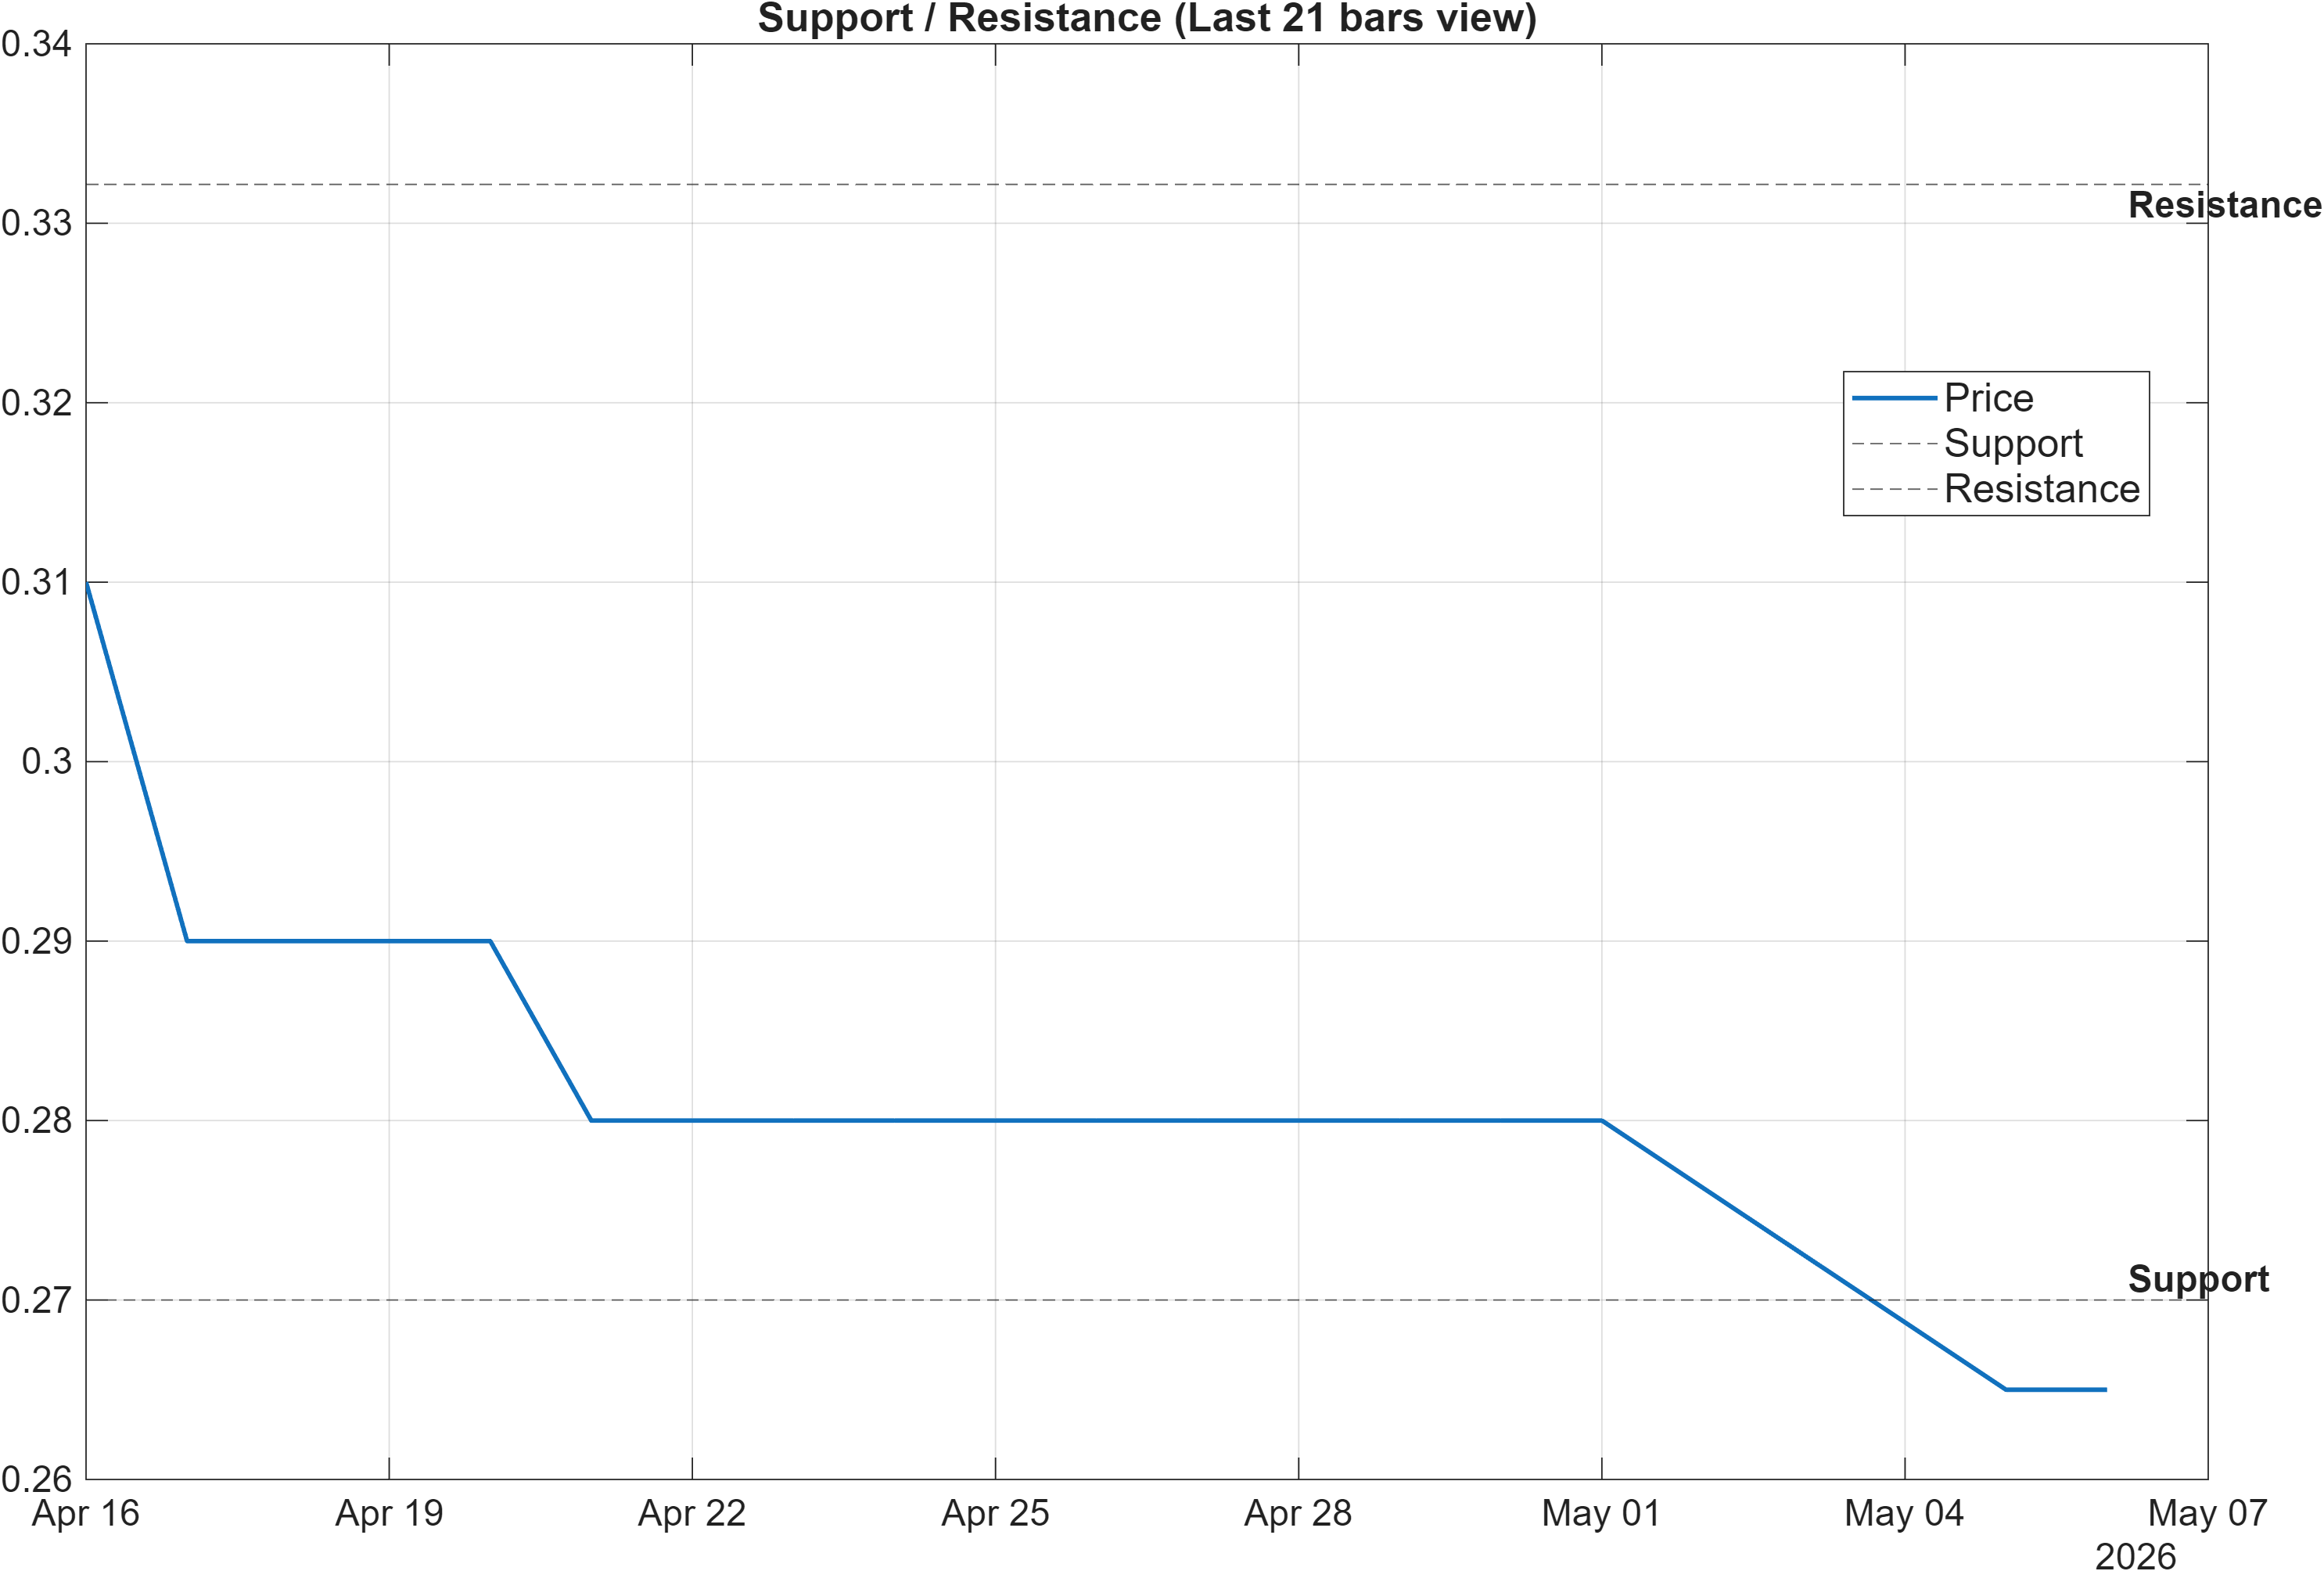
The scenario framing is explicit: a break above 0.3322 with volume is the condition for continuation to the upside, while a close below 0.2700 flags deterioration risk. That asymmetry is typical when the broader state is bearish: upside confirmation requires both price and participation, whereas downside confirmation can occur simply by losing a key floor.
Integrating other parts of the report improves interpretability. Volatility (bandwidth 0.1059) implies the market can move through levels without requiring a regime change, while momentum (MACD hist -0.0010, RSI bias bearish) suggests rallies may stall below resistance unless momentum turns. Meanwhile, the weak ranks (for example, daily #1361 and weekly #1417) indicate that even if price enters the resistance zone, the broader “relative behavior” context remains unfavorable until those ranks improve.
Net: treat the support zone as the key invalidation boundary for stabilization attempts, and treat resistance as the confirmation boundary for any thesis that the downtrend is transitioning into a more constructive regime.
Scenario view: Break above resistance with volume → continuation. Close below support → signal deterioration risk.
5) Quant Technical Dashboard (18 Signals)
KGNAI AI Technical Analysis Score (Deep Reinforcement Learning): Rank #1267 out of 1419 (Rank 1 represents the strongest technical positioning and a higher probability of favorable price behavior. As ranks increase toward the maximum, the probability of favorable outcomes weakens and bearish positioning becomes more dominant.) | Label: Bearish | Score: -0.786
18-Signal Technical Confluence Score: -0.500 (Bearish)
Overall Technical Score (18-signal confluence + DRL rank blend): -0.586 (Bearish)
Note: The blended score reflects signal strength weighted against broader AI technical ranking, which may temporarily diverge.
Blended technical score breakdown: -0.586 (Bearish | Bull 3 / Bear 12 / Neutral 3)
The quant dashboard consolidates two independent layers: an 18-signal confluence model and a Deep Reinforcement Learning (DRL) technical rank. Both layers point in the same direction. The DRL component is bearish with rank #1267 of 1419 and score -0.786, while the 18-signal confluence score is -0.500 and the blended overall technical score is -0.586. This matters because the blend reduces the risk that one submodel is overreacting to a narrow feature set.
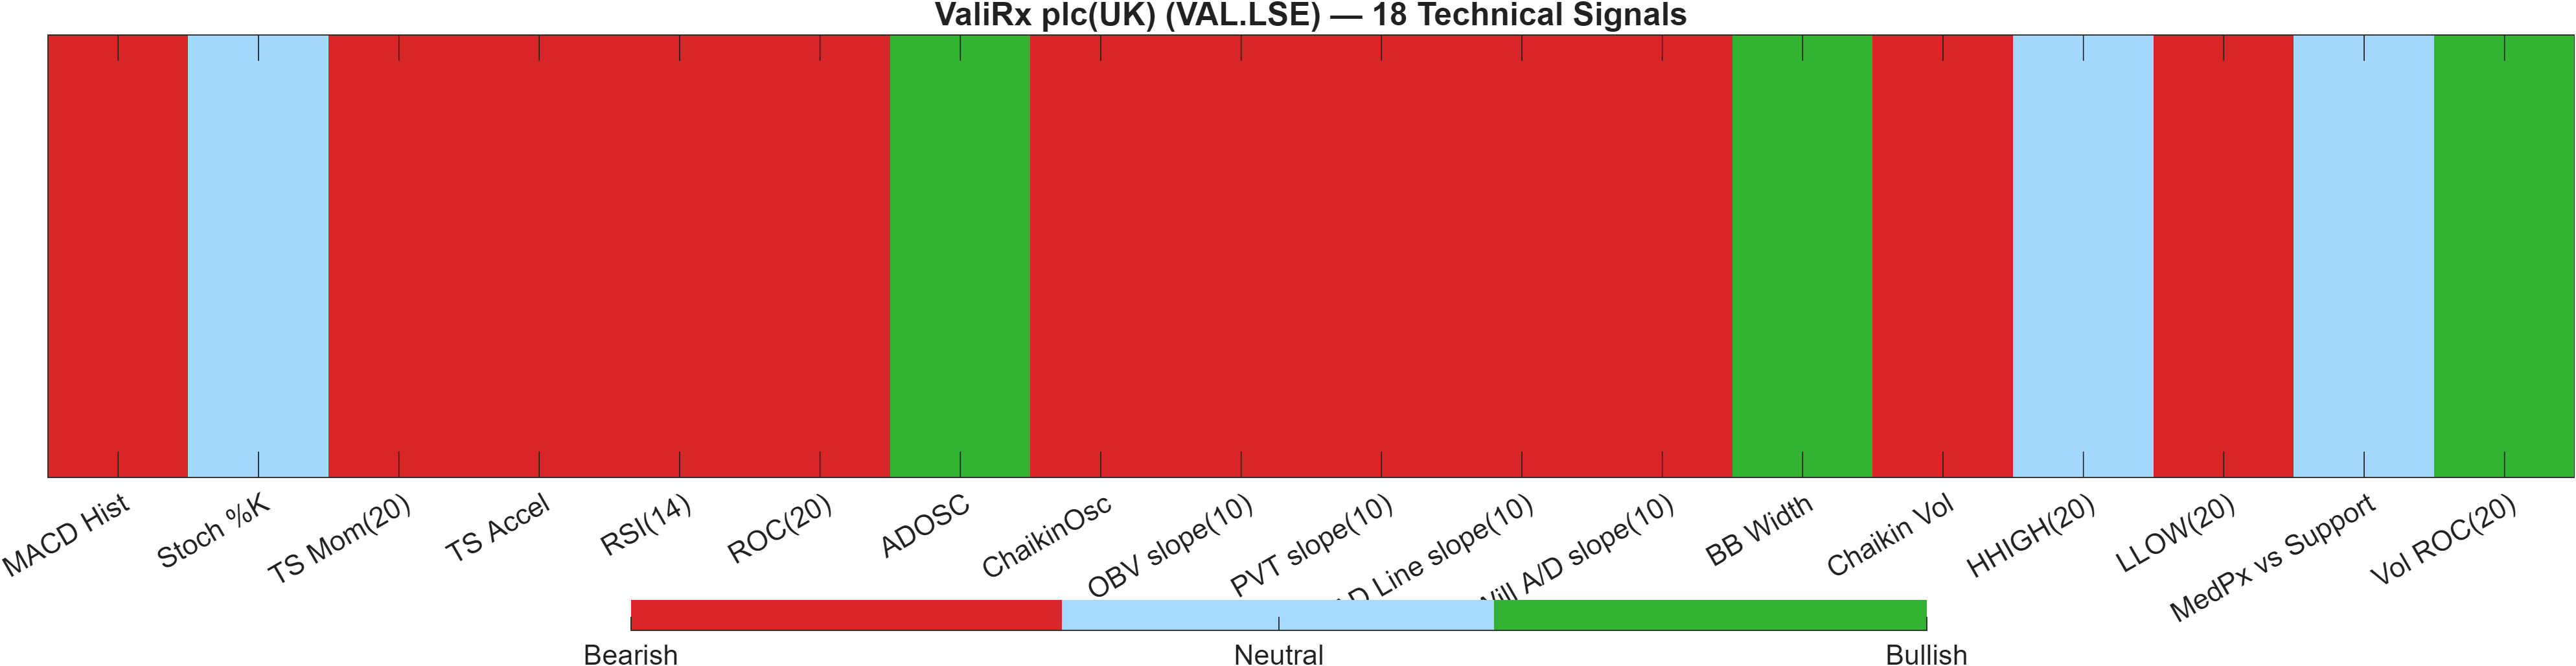
Breadth within the signal set is also skewed: Bear 12 / Bull 3 / Neutral 3. That distribution implies bearishness is not dependent on a single indicator family (e.g., just momentum or just volume), but is instead echoed across categories. For example, MACD histogram is negative (table shows -0.0009932) and price/return measures are weak (e.g., ROC(20) -8.621 and TS Mom(20) -0.025), aligning with the bearish momentum dashboard earlier.
There are, however, small pockets that can matter tactically. The table flags BB Width 0.1059 as bullish and Vol ROC(20) 79.86 as bullish, suggesting activity/variability is present even as direction remains unfavorable. When volatility or volume accelerates during a bearish regime, it can precede either capitulation-style bottoms or continuation legs; the deciding factor is typically whether price can reclaim resistance (0.3322) rather than simply bouncing off support (0.2700).
Signal table (Bull/Bear/Neutral)
| Indicator | Value | Signal |
|---|---|---|
| MACD Hist | -0.0009932 | Bearish |
| Stoch %K | 37.5 | Neutral |
| TS Mom(20) | -0.025 | Bearish |
| TS Accel | -0.01 | Bearish |
| RSI(14) | 0 | Bearish |
| ROC(20) | -8.621 | Bearish |
| ADOSC | 31.25 | Bullish |
| ChaikinOsc | -1.251e+06 | Bearish |
| OBV slope(10) | -1.79e+07 | Bearish |
| PVT slope(10) | -2.459e+05 | Bearish |
| AD Line slope(10) | -2.24e+06 | Bearish |
| Will A/D slope(10) | -0.0625 | Bearish |
| BB Width | 0.1059 | Bullish |
| Chaikin Vol | 28.12 | Bearish |
| HHIGH(20) | 0.32 | Neutral |
| LLOW(20) | 0.25 | Bearish |
| MedPx vs Support | 0 | Neutral |
| Vol ROC(20) | 79.86 | Bullish |
Interpretation: Indicator-level signals form the base confluence, which is then adjusted using a separate AI-driven technical ranking model. The final technical score summarizes this combined view.
6) News sentiment + extractive gist
Sentiment score (avg): -0.209 with Negative: 100% indicates a one-sided tone in the current news sample, which can act as a contextual headwind when technicals are already weak. Recent coverage across major financial outlets indicates that the story mix is dominated by adverse framing rather than balanced updates, and the absence of any positive or neutral distribution in the provided breakdown (Positive: 0%, Neutral: 0%) increases the likelihood that incremental headlines reinforce existing risk perception. In regime terms, that tends to reduce the probability that early technical rebounds gain sponsorship quickly, particularly when ranks are already at the lower tail (e.g., weekly #1417).
The platform’s normalized KGNAI AI News Sentiment Score is listed as Not available in the provided data. Even so, the available aggregate sentiment figures (avg -0.209, overall news score -0.21) are directionally consistent with the bearish technical picture (overall technical score -0.586). When sentiment and price structure align, the burden of proof usually shifts to price-based confirmation—namely reclaiming 0.3322 with volume—rather than relying on sentiment mean reversion.
Positive Developments
Not available in the provided data. The sentiment distribution shows 0% positive items in the current sample, and the extractive gist supplied does not include constructive, company-specific operating catalysts. In an environment where the technical regime is already bearish (Close vs MA50 bearish; MA50 vs MA200 bearish) and cross-sectional ranks are weak (for example, daily #1361), the lack of positive news flow can matter because it reduces the set of potential triggers that might shift participation or improve narrative support. As a result, any short-term stabilization would be expected to come primarily from technical dynamics (support defense near 0.2700, momentum improvement) rather than from a favorable news impulse.
Neutral / Mixed Developments
Not available in the provided data. The breakdown reports 0% neutral items, implying that coverage is not being framed as informational or balanced within the captured sample. For analysis purposes, this limits the ability to treat sentiment as a merely “background” variable; instead, it becomes part of the prevailing bias backdrop alongside bearish confluence (-0.500) and negative overall technical score (-0.586). In such cases, monitoring is best anchored to objective thresholds—particularly whether price can approach 0.3322 without stalling and whether momentum (MACD histogram -0.0010) can improve while volatility (bandwidth 0.1059) remains controlled.
Negative / Risk Signals
Recent coverage across major financial outlets indicates a risk-dominant narrative tone, consistent with the sample’s 100% negative classification and the average sentiment score of -0.209. When news tone is uniformly negative, it can amplify trend persistence by discouraging dip-buying and by increasing the likelihood that rallies are sold into predefined resistance zones. This interacts directly with the chart-defined levels: failure to reclaim 0.3322 can keep price trapped in a bearish structure, while a decisive close below 0.2700 would fit the report’s deterioration scenario. With ranks already near the bottom of the universe, negative sentiment alignment can act as reinforcement rather than a contrarian signal.
- Whether price can sustain trade above 0.3322 with volume confirmation.
- Whether 0.2700 holds on daily closes, or breaks and accelerates deterioration risk.
- Whether momentum improves (MACD histogram rising from -0.0010) while volatility remains stable (bandwidth 0.1059).
Snapshot: AI Rank (Short–Mid–Long): Bearish (Bearish–Bearish–Bearish) · Technical Confluence: Bearish · Key Levels: Support ~0.27 | Resistance ~0.33 · News Sentiment: Negative
7) Sources
- US stock-lending operator charged with $450mn fraud — https://www.ft.com/content/8e71321f-9823-4dda-9a71-9fdc34920122
You may also like: How KGNAI AI ranks instruments across global markets
Disclaimer: KGNAI provides AI-generated analytics and educational market commentary only. This is not financial advice. Markets involve risk. Always do your own research.