
Kid ASA (KID.OL) — 10-May-2026 Technical & Rank Read: Long-Term Strength vs Near-Term Sideways-to-Soft Structure
Kid ASA (KID.OL) is currently characterized by a long-horizon strength profile in KGNAI ranks alongside a bearish near-term technical confluence, a combination that typically signals a regime mismatch rather than a clean directional setup. Within a 1418-instrument European universe, the Yearly rank #4 places the name in the extreme upper tier on longer-term comparative behavior, yet the Deep Reinforcement Learning technical rank #1282 and a -0.554 blended technical score indicate that current price/flow conditions remain pressured. Momentum indicators reinforce this tension: RSI(14) at 31.19 and MACD histogram -0.7588 lean risk-off, while volatility remains contained with Bollinger bandwidth 0.0922. Structurally, the report frames decision zones near support 120.3000 and resistance 137.0000. News sentiment is positive in the dataset (avg 0.361; normalized score 1.00), which may act as a stabilizer but does not override weakening technical breadth.
- Rank stance: Short-term Neutral (Daily #290) | Mid-term Neutral (Weekly #967 / Monthly #394) | Long-term Bullish (6M #34 / Yearly #4)
- Technical confluence: Bearish (18-signal score -0.444; blended score -0.554; DRL rank #1282)
- Key levels: Support ~ 120.3000 | Resistance ~ 137.0000
- News sentiment bias: Bullish (avg 0.361; normalized 1.00)
- Confirmation / invalidation: A sustained push above 137.0000 with volume supports continuation framing; a close below 120.3000 increases deterioration risk per the scenario view.
KGNAI evaluates assets using large cross-sectional datasets built from millions of structured data points. Inputs incorporate fundamental metrics, technical structures, and systematically processed news sentiment. Statistical models, machine learning, and AI frameworks are used to assess relative positioning, signal alignment, and probabilistic behavior across broad universes.
- Ranks are comparative across the tracked universe, not absolute price targets.
- Confluence reflects alignment among independent signal groups.
- Support/resistance levels are probabilistic decision zones, not guarantees.
- Sentiment provides contextual bias within the broader analytical framework.
1) KGNAI AI Analysis
Region: EUROPE | Total universe size: 1418 ranked instruments
- Daily rank: #290 out of 1418 — Neutral
- Weekly rank: #967 out of 1418 — Neutral
- Monthly rank: #394 out of 1418 — Neutral
- 3-Monthly rank: #216 out of 1418 — Bullish
- 6-Monthly rank: #34 out of 1418 — Bullish
- Yearly rank: #4 out of 1418 — Bullish
KID.OL’s rank stack is best read as a time-horizon divergence. The Daily rank (#290) sits in the upper portion of the universe, while the Weekly rank (#967) moves into the lower third—an indication that very recent comparative behavior has softened materially versus peers. At the same time, the 3-Monthly rank (#216) returns to a more constructive tier, and the 6-Monthly (#34) and Yearly (#4) ranks remain firmly in the top decile and extreme top tail respectively.
This configuration often appears when an instrument has a strong longer-run profile but is experiencing a short-term digestion phase (e.g., pullback, consolidation, or relative underperformance) that has not yet fully resolved. In practical market-structure terms, the weekly weakness can matter because it frequently aligns with positioning adjustments and liquidity-driven mean reversion, even while the longer-term cross-sectional signal stays positive.
The declared term view—Short-term Neutral, Mid-term Neutral, Long-term Bullish—is consistent with the rank gradient. The key analytical implication is that timing risk is elevated: long-term comparatives remain favorable (Yearly #4), but near-term conditions (Weekly #967) can dominate realized path until technical internals recover.
2) Price & trend overview
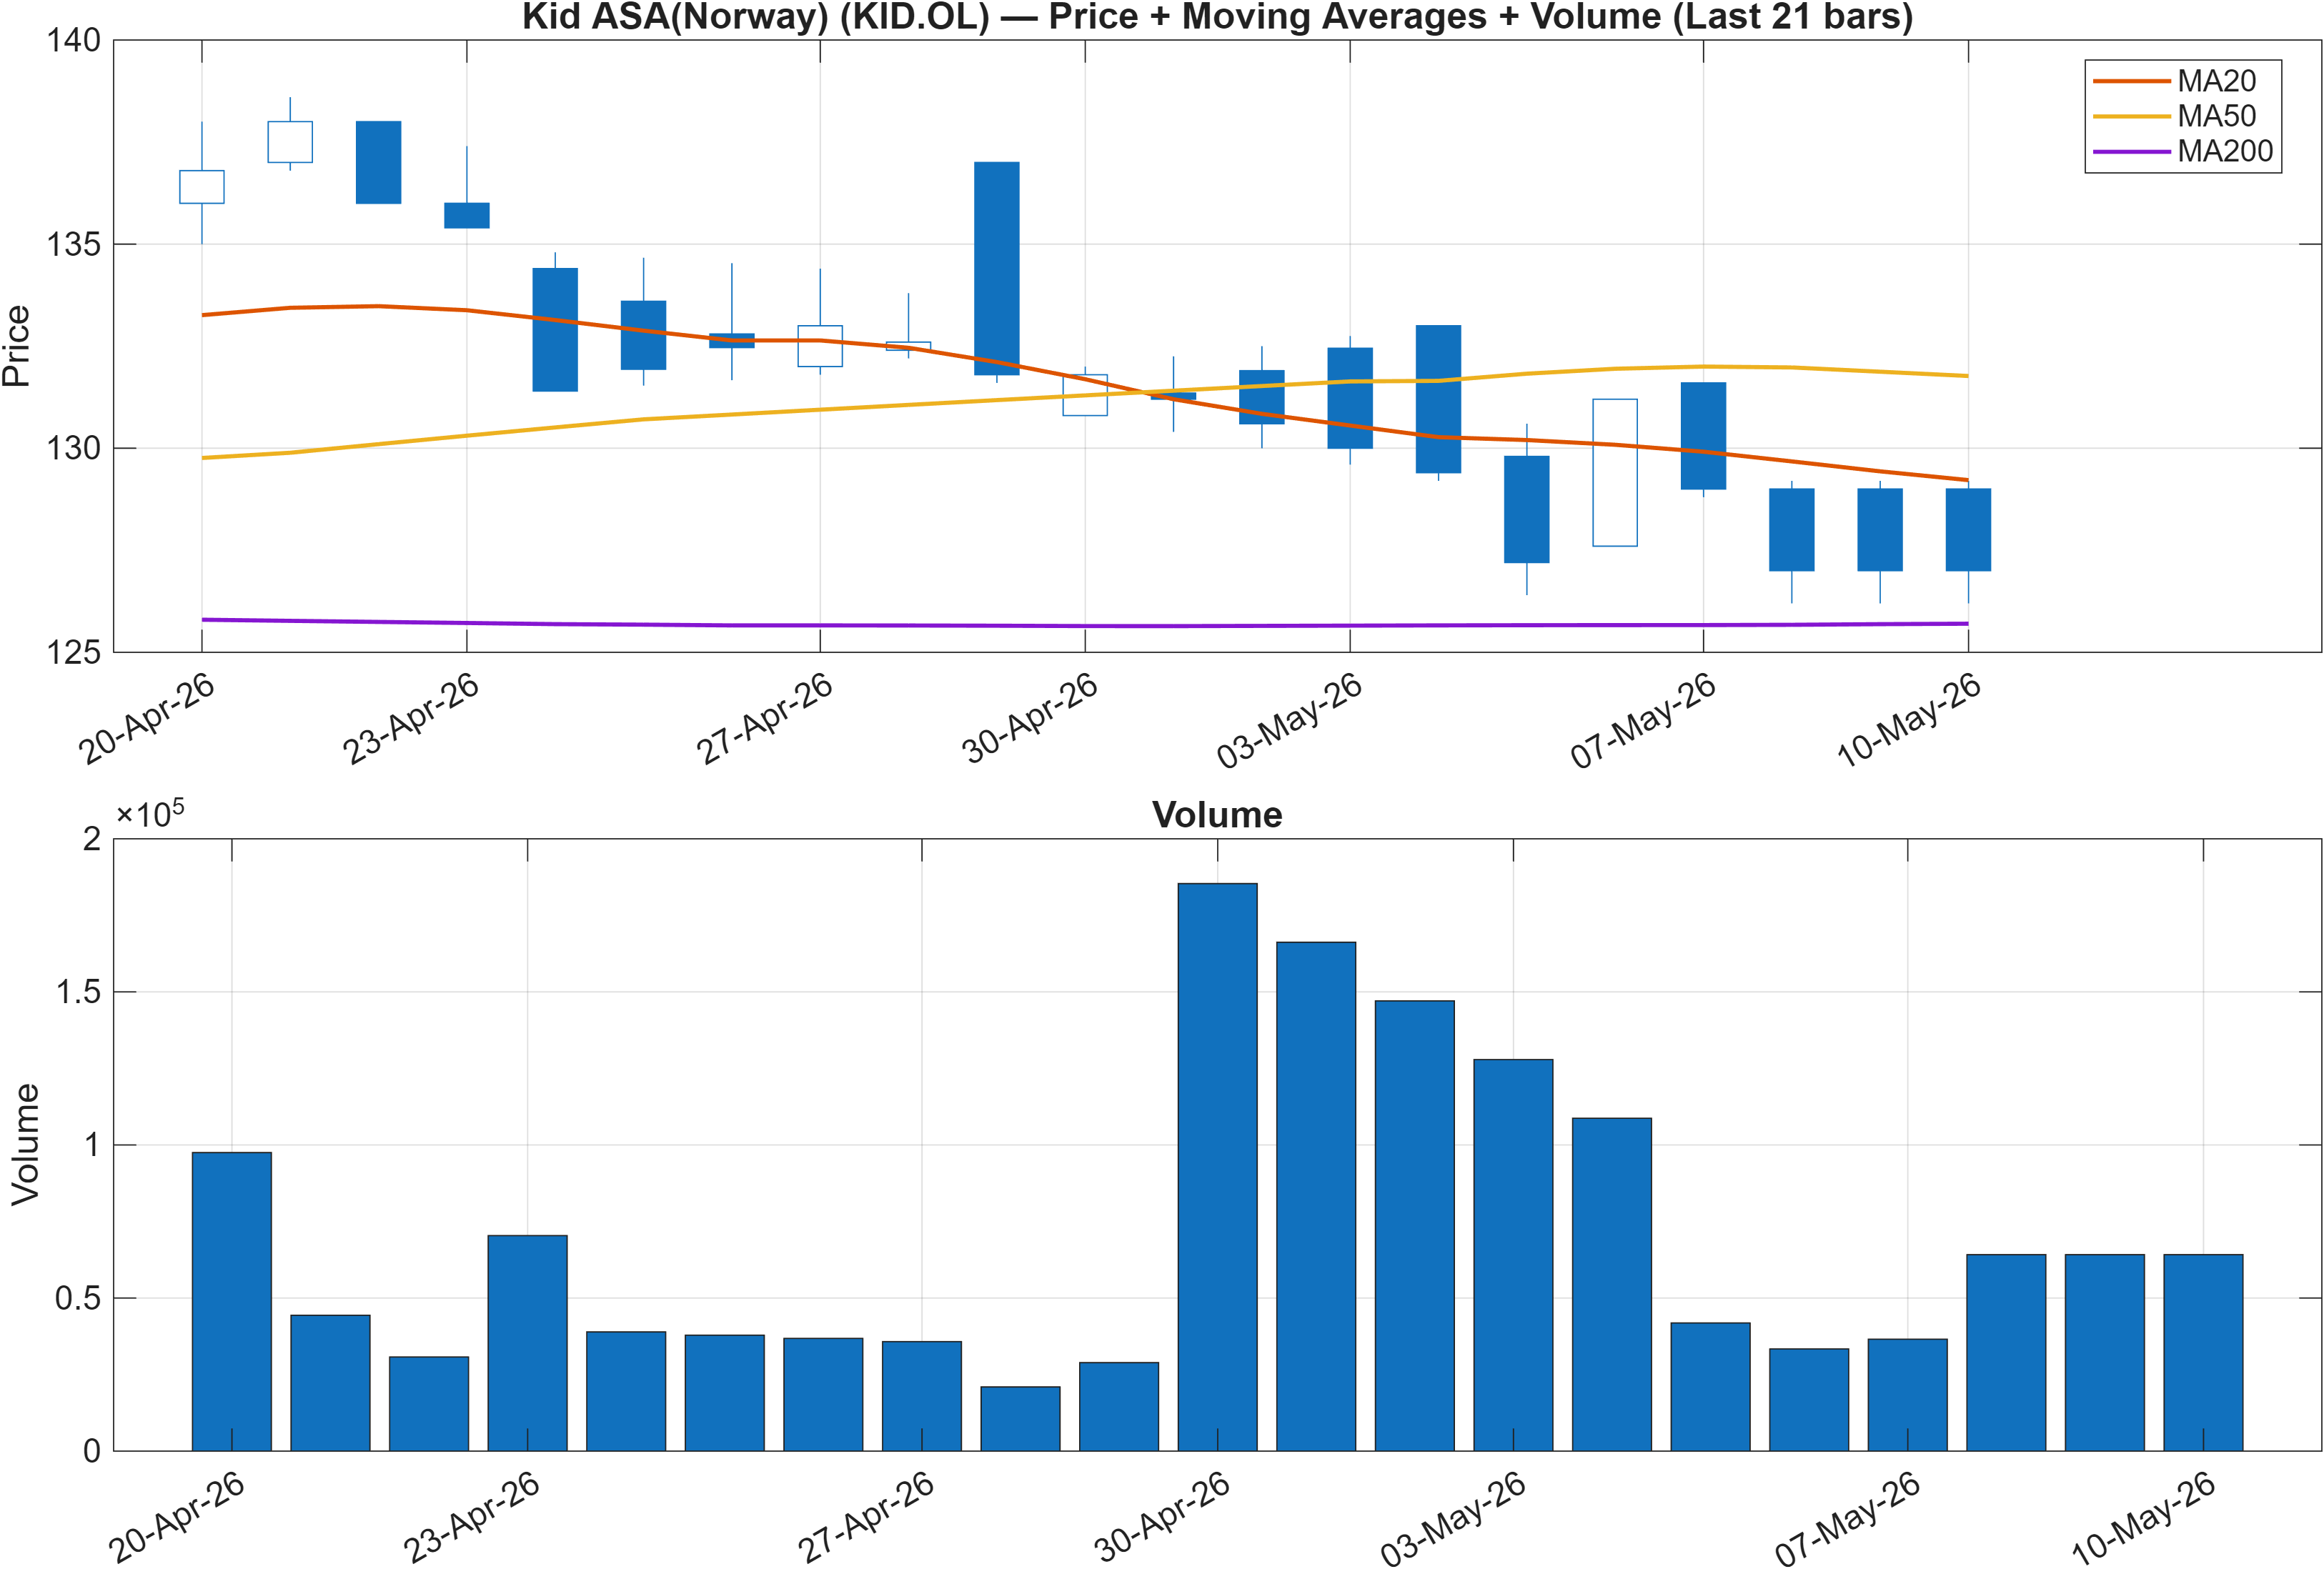
The moving-average state is explicitly split: Close vs MA50 = Bearish, while MA50 vs MA200 = Bullish. That combination generally maps to a pullback within a broader uptrend rather than a clean trend reversal. In other words, the longer baseline (captured by the MA200 relationship) remains supportive, but the shorter baseline (MA50) is acting as overhead friction, consistent with the “sideways structure holds” stance.
This is where rank horizon matters: the persistence of strong longer-term ranks (6-Month #34; Yearly #4) aligns with a constructive longer trend regime, but the bearish close-versus-MA50 condition helps explain why shorter-term ranks are not confirming (Weekly #967). When price trades below a key intermediate moving average while the longer moving average stack remains positive, it often implies that trend continuation requires re-acceptance above the MA50 rather than immediate acceleration.
Volume context in Figure 1 should be read alongside later evidence of mixed participation. Within the 18-signal dashboard, Vol ROC(20) = 44.62 prints bullish, suggesting recent activity/turnover has increased, yet several flow/accumulation measures lean bearish (e.g., negative OBV/AD slopes). That tension is consistent with a market that is trading actively but not yet showing broad confirmation that incremental volume is translating into sustained directional demand.
3) Momentum & volatility dashboard
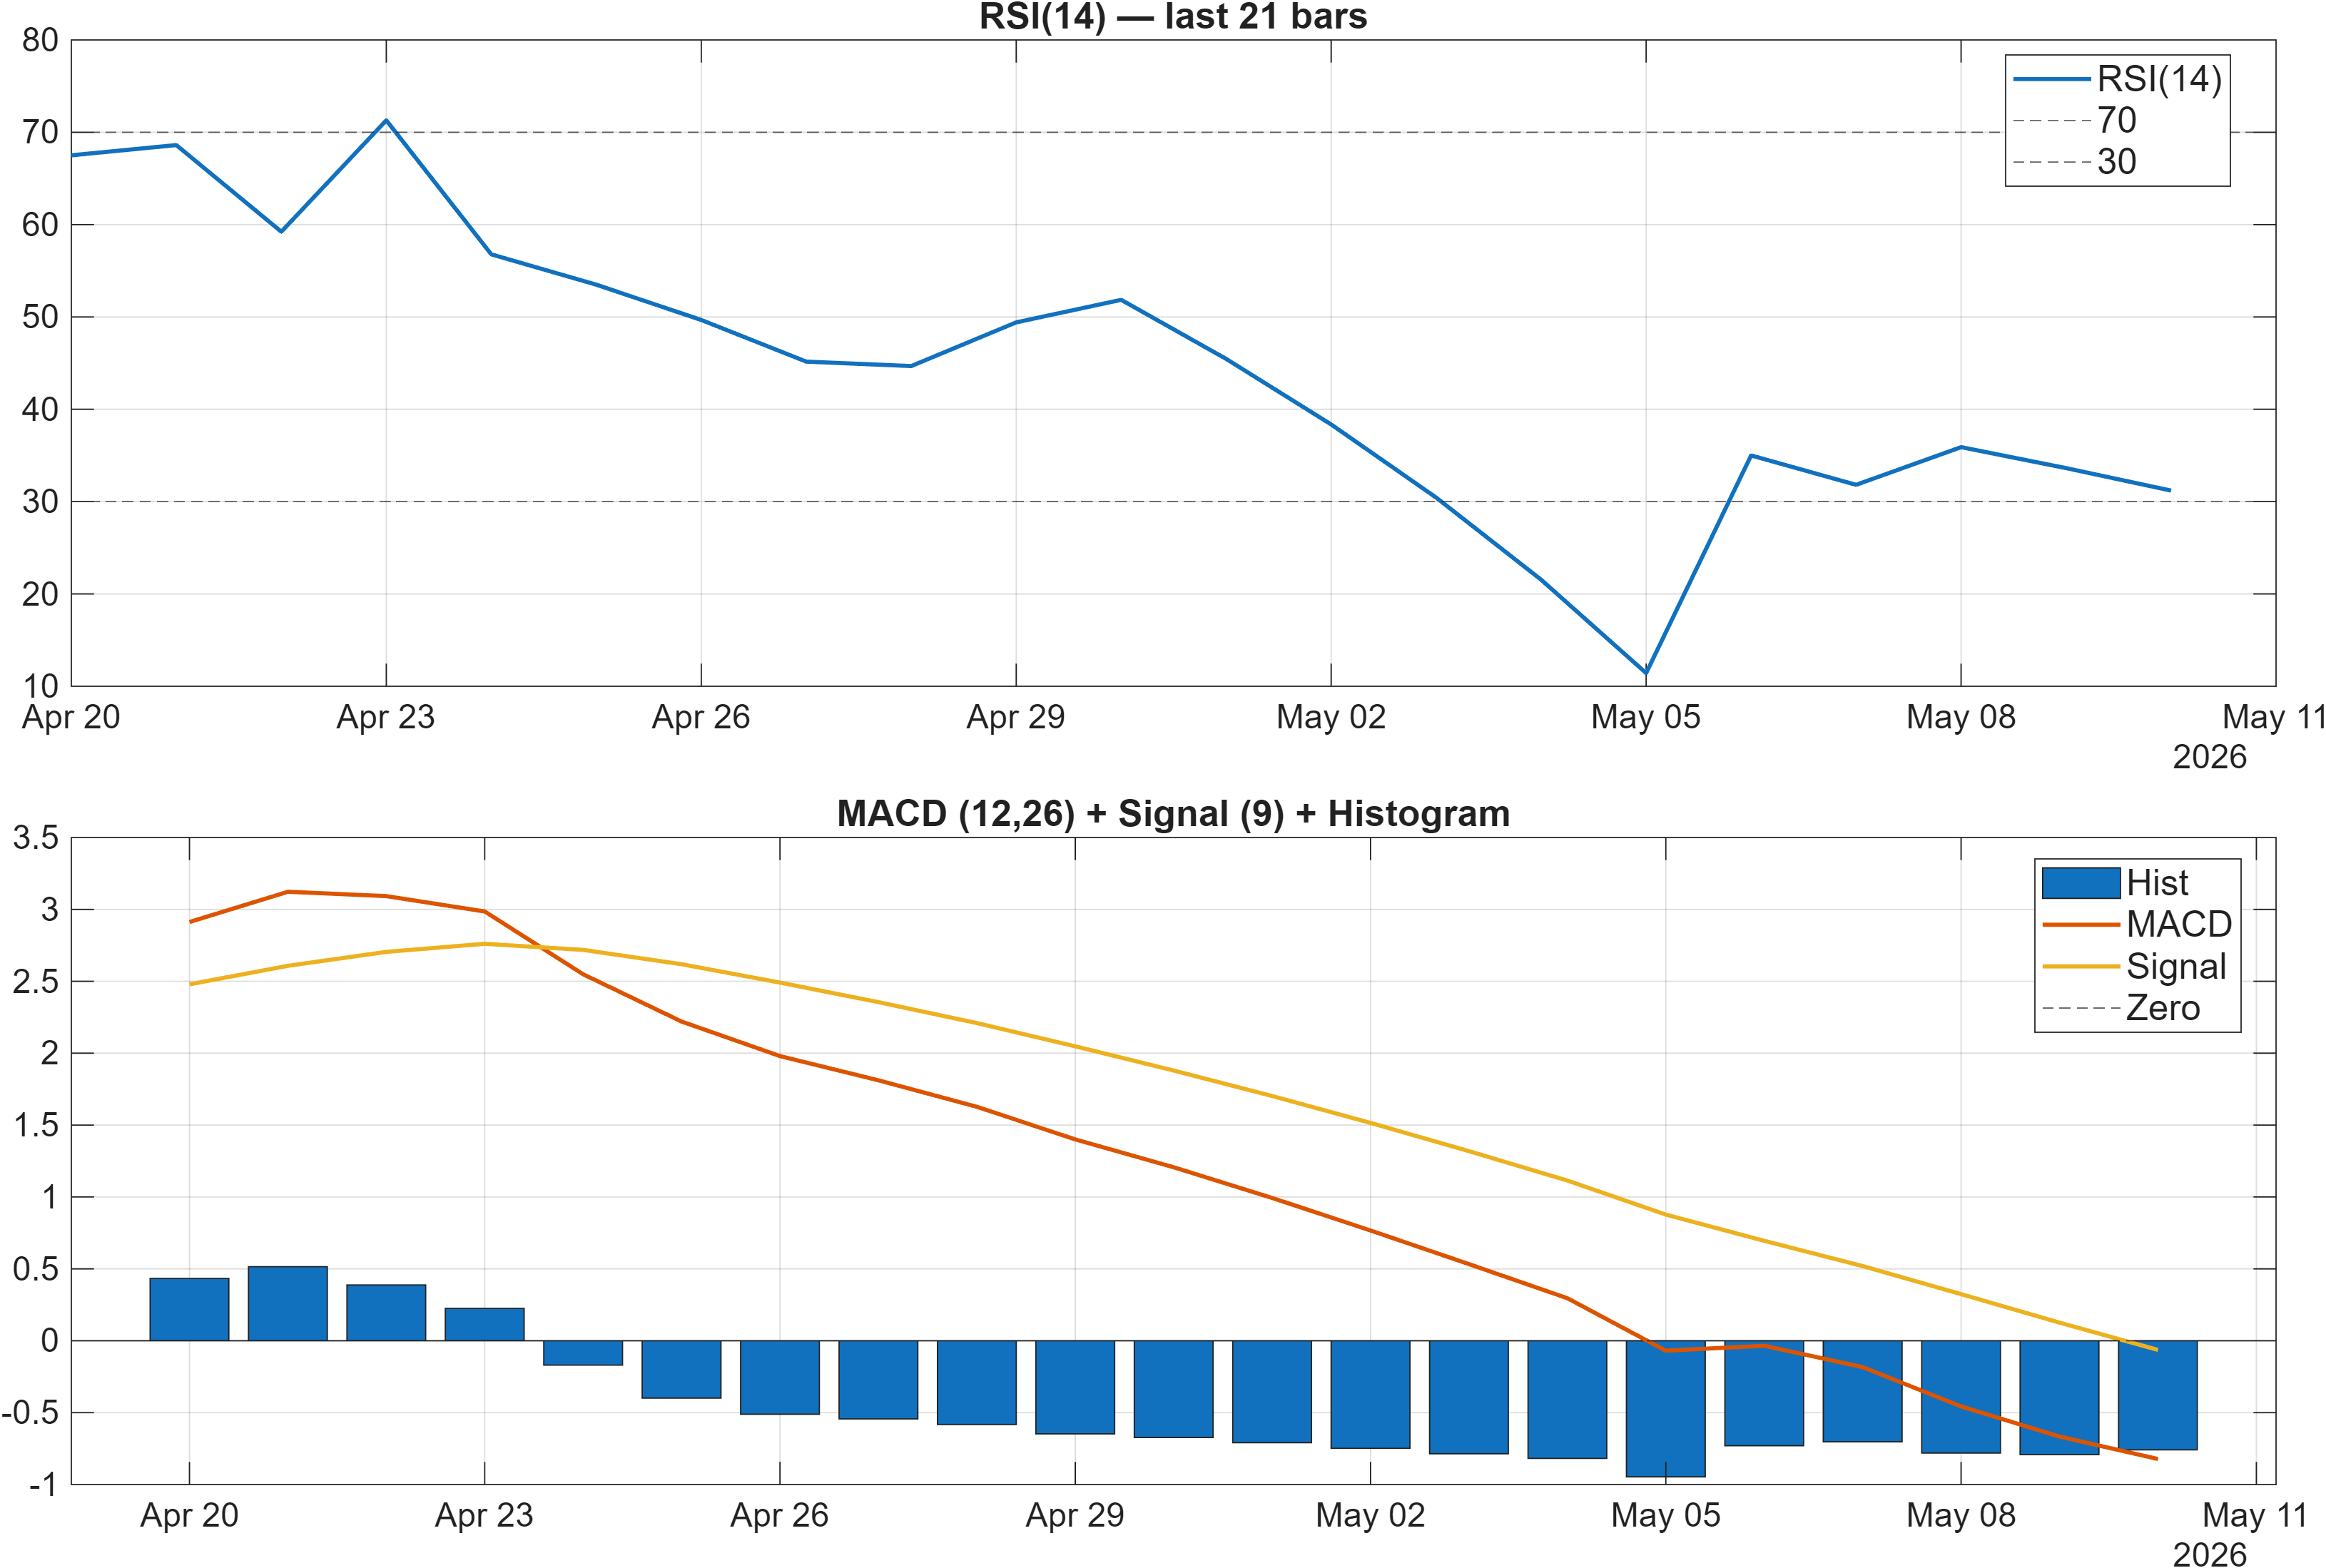
Momentum is skewed to the downside in the current snapshot. The RSI bias is marked bearish with RSI(14) = 31.19, placing it near the lower threshold typically associated with oversold/pressure regimes. At the same time, MACD histogram = -0.7588 indicates that downside momentum has not fully mean-reverted yet, reinforcing that the market is still operating with negative impulse on this timeframe.
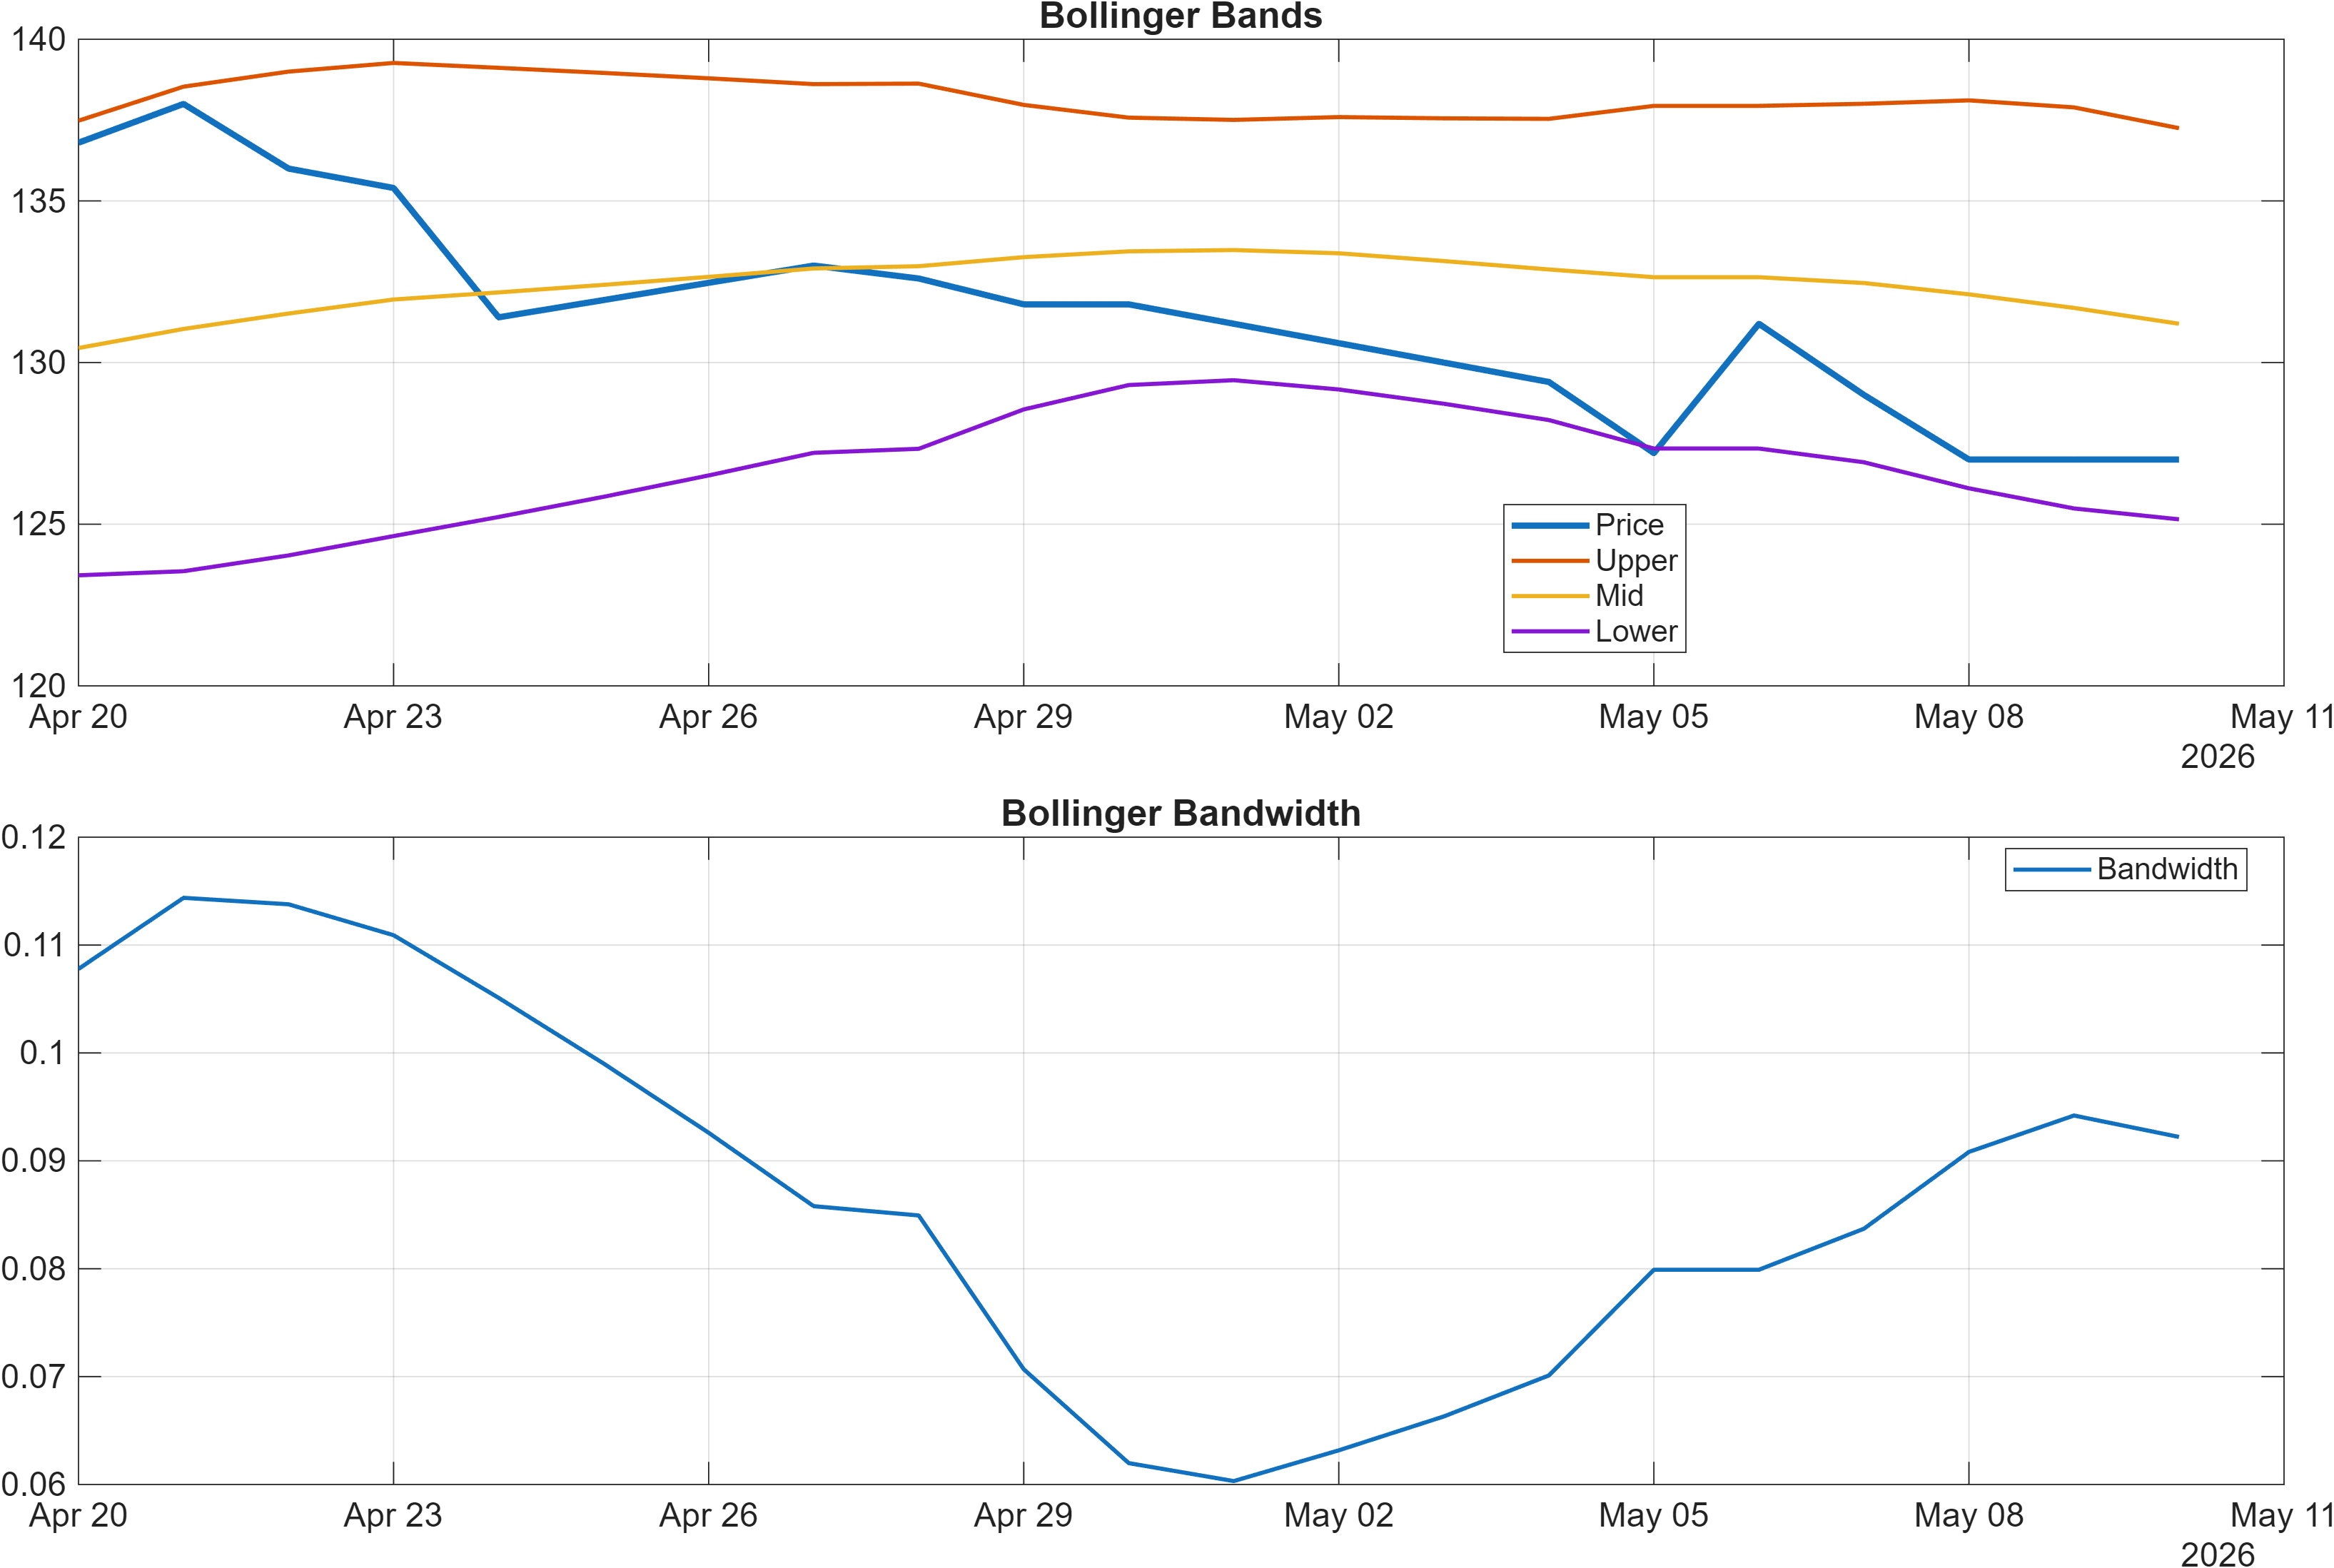
Volatility is comparatively contained. The latest Bollinger bandwidth is 0.0922, echoed by BB Width 0.09222 in the signal table, which is labeled neutral. Low-to-moderate bandwidth during bearish momentum often suggests compressed drift rather than capitulation—pressure can persist, but the market is not (yet) expressing a broad volatility expansion typically seen in disorderly sell-offs.
The more nuanced read is that there are early stabilization hints inside momentum breadth. Stoch %K = 11.76 is labeled bullish, a configuration that commonly appears when price is stretched down relative to its recent range. However, other time-series measures remain heavy: TS Mom(20) = -11 and TS Accel = -22.53 stay bearish, arguing that any bounce risk is competing with negative trend persistence. Until MACD pressure eases and RSI moves away from the low 30s, the signal set fits a market in recovery attempts within a still-weak momentum envelope.
4) Support / Resistance zones
Support ~ 120.3000 | Resistance ~ 137.0000
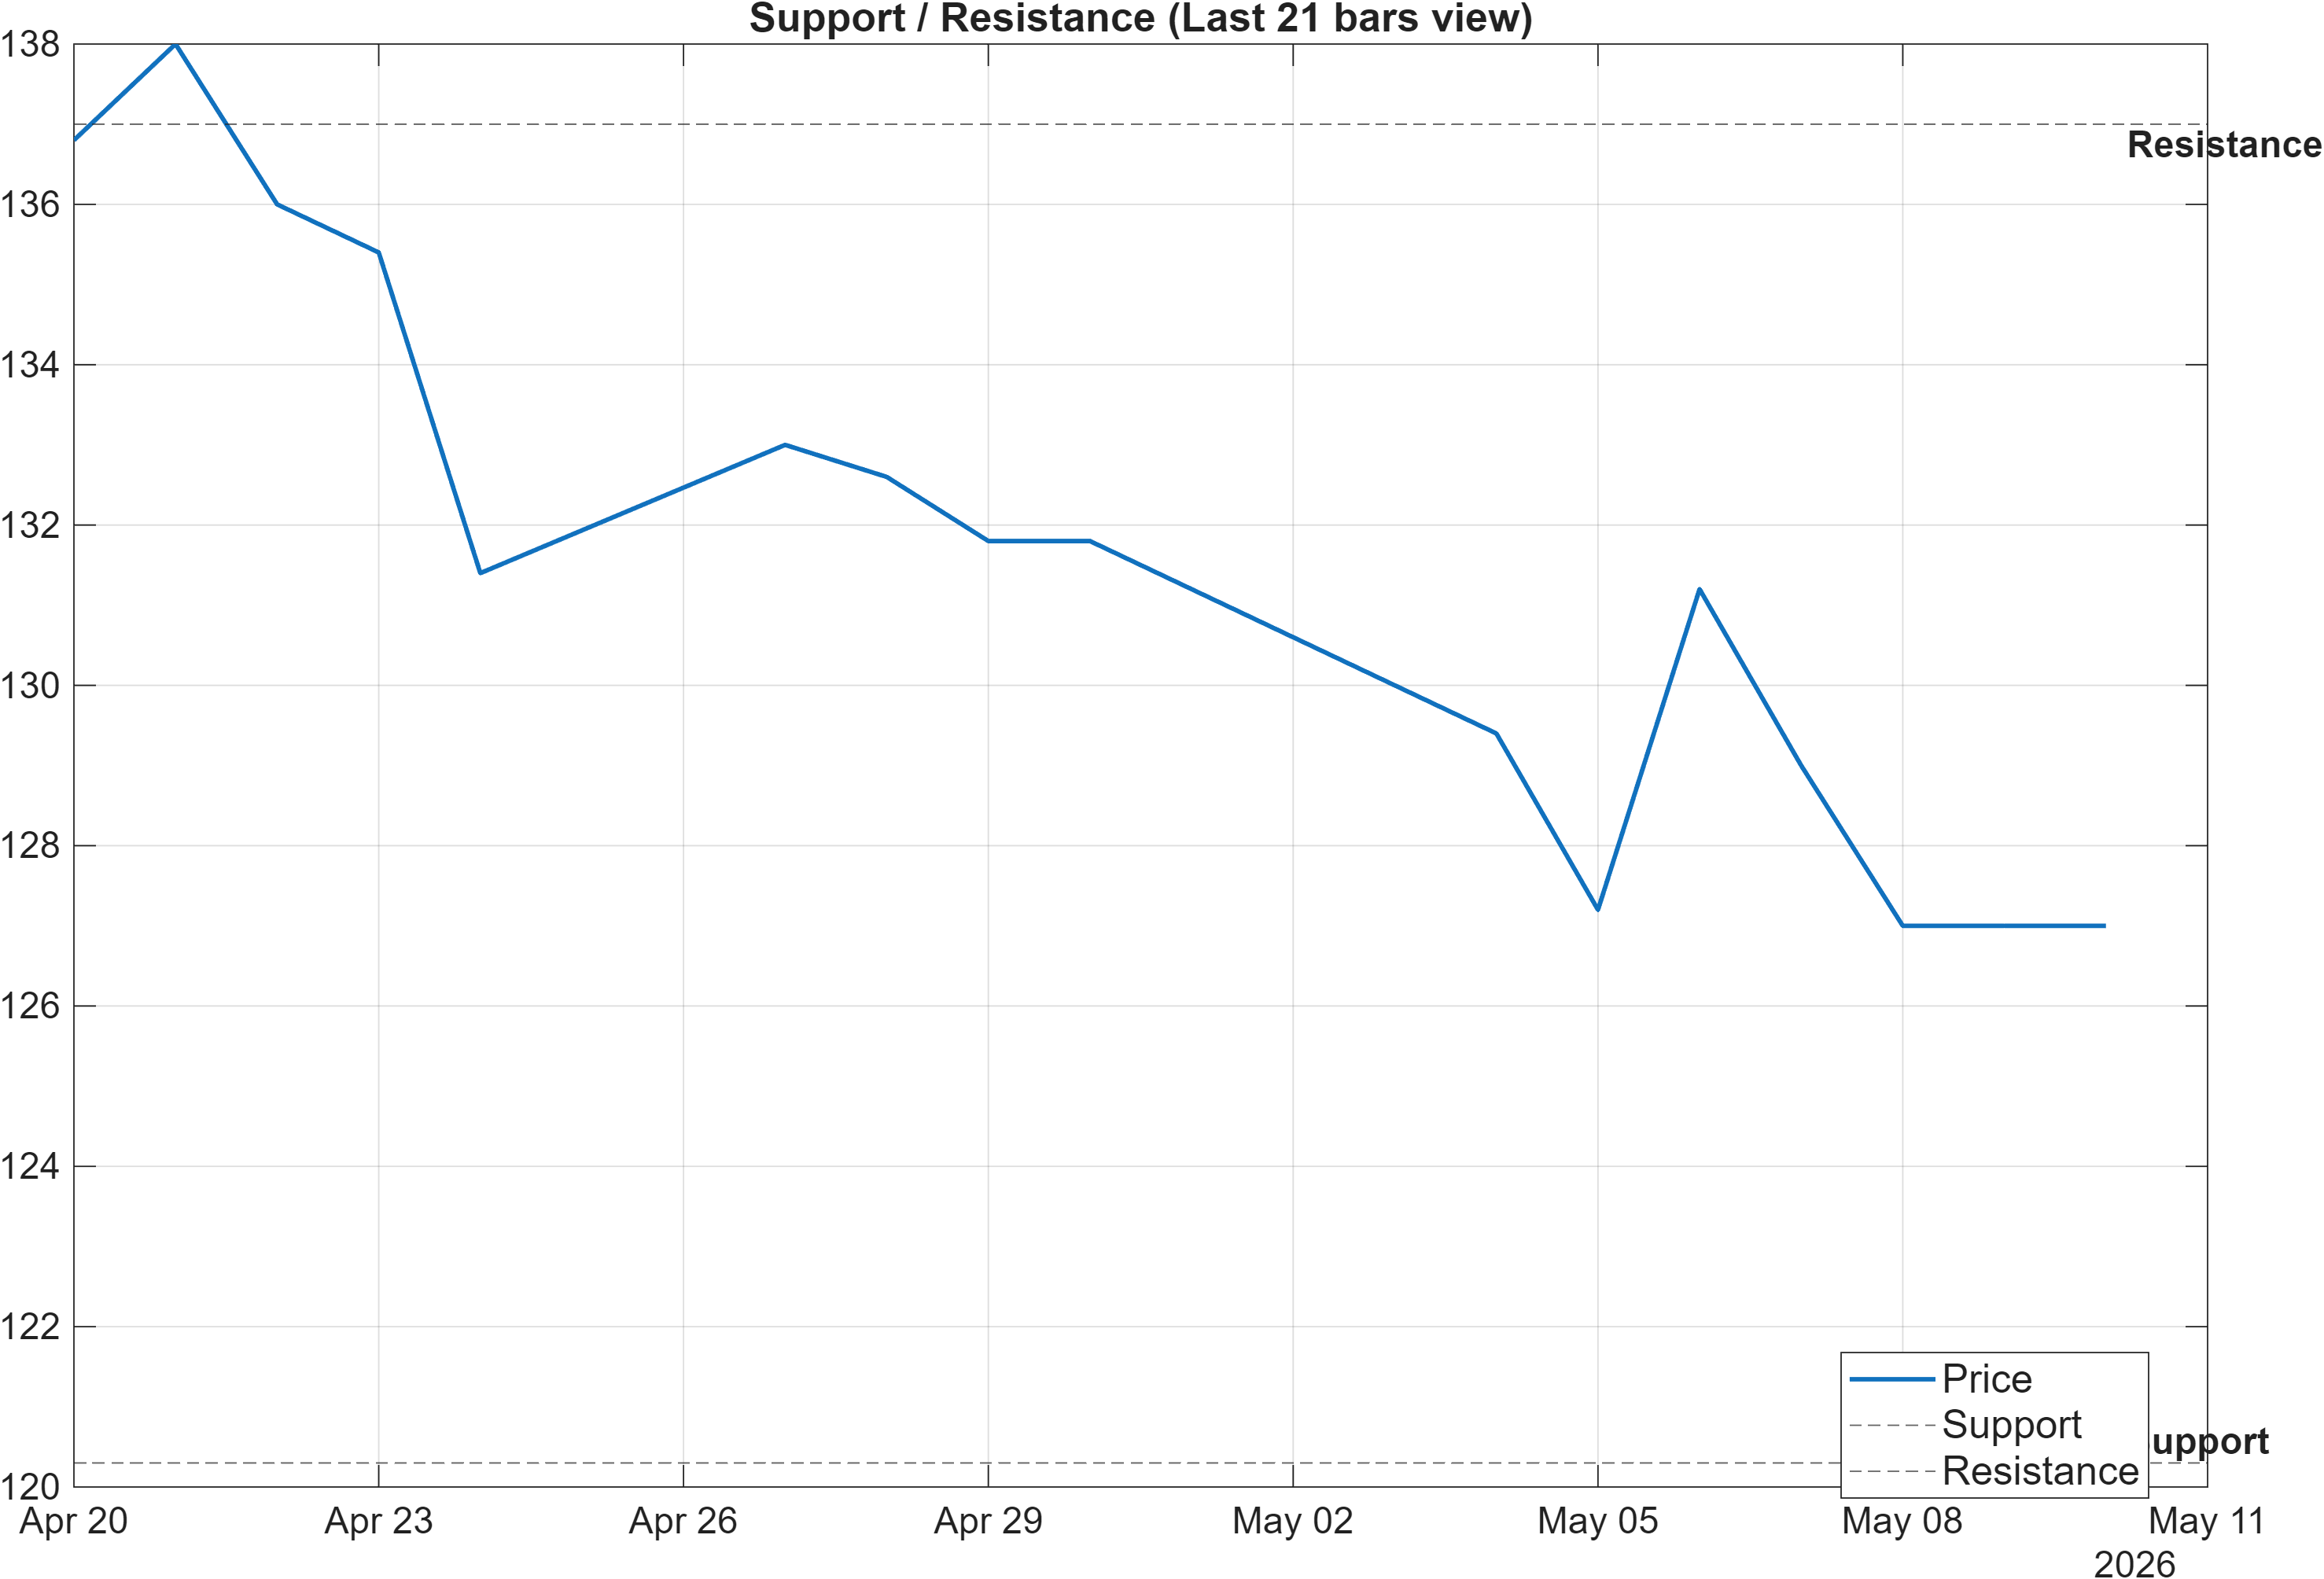
The 120.3000–137.0000 structure frames the current trade as a range-resolution problem more than a trend-chasing environment. With momentum depressed (RSI(14) 31.19; MACD hist -0.7588) and volatility moderate (bandwidth 0.0922), support becomes the primary reference for whether weakness is simply cyclical within the broader profile (consistent with Yearly rank #4) or whether the tape is transitioning into a more adverse regime.
The signal table provides additional context for where the market is sitting within its recent distribution. LLOW(20) = 126.2 is labeled bearish, while HHIGH(20) = 138.6 is neutral—placing resistance proximity near the upper bound of the 20-day range and implying that 137.0000 is not an arbitrary figure but sits close to recent upper structure. Conversely, MedPx vs Support = 7.4 is bullish, which is consistent with price holding a measurable distance above the mapped support zone—support is relevant, but not necessarily under immediate attack.
The scenario logic in the base snapshot is appropriately conditional: a break above 137.0000 with volume would shift the regime read toward continuation, while a close below 120.3000 would mark deterioration risk. Given the mismatch between bullish longer-horizon ranks (6M #34) and bearish technical confluence (overall -0.554), these zones operate as the cleanest validation points for whether long-term strength is reasserting or being deferred.
5) Quant Technical Dashboard (18 Signals)
KGNAI AI Technical Analysis Score (Deep Reinforcement Learning): Rank #1282 out of 1418 (Rank 1 represents the strongest technical positioning and a higher probability of favorable price behavior. As ranks increase toward the maximum, the probability of favorable outcomes weakens and bearish positioning becomes more dominant.) | Label: Bearish | Score: -0.808
18-Signal Technical Confluence Score: -0.444 (Bearish)
Overall Technical Score (18-signal confluence + DRL rank blend): -0.554 (Bearish)
Note: The blended score reflects signal strength weighted against broader AI technical ranking, which may temporarily diverge.
Blended technical score breakdown: -0.554 (Bearish | Bull 4 / Bear 12 / Neutral 2)
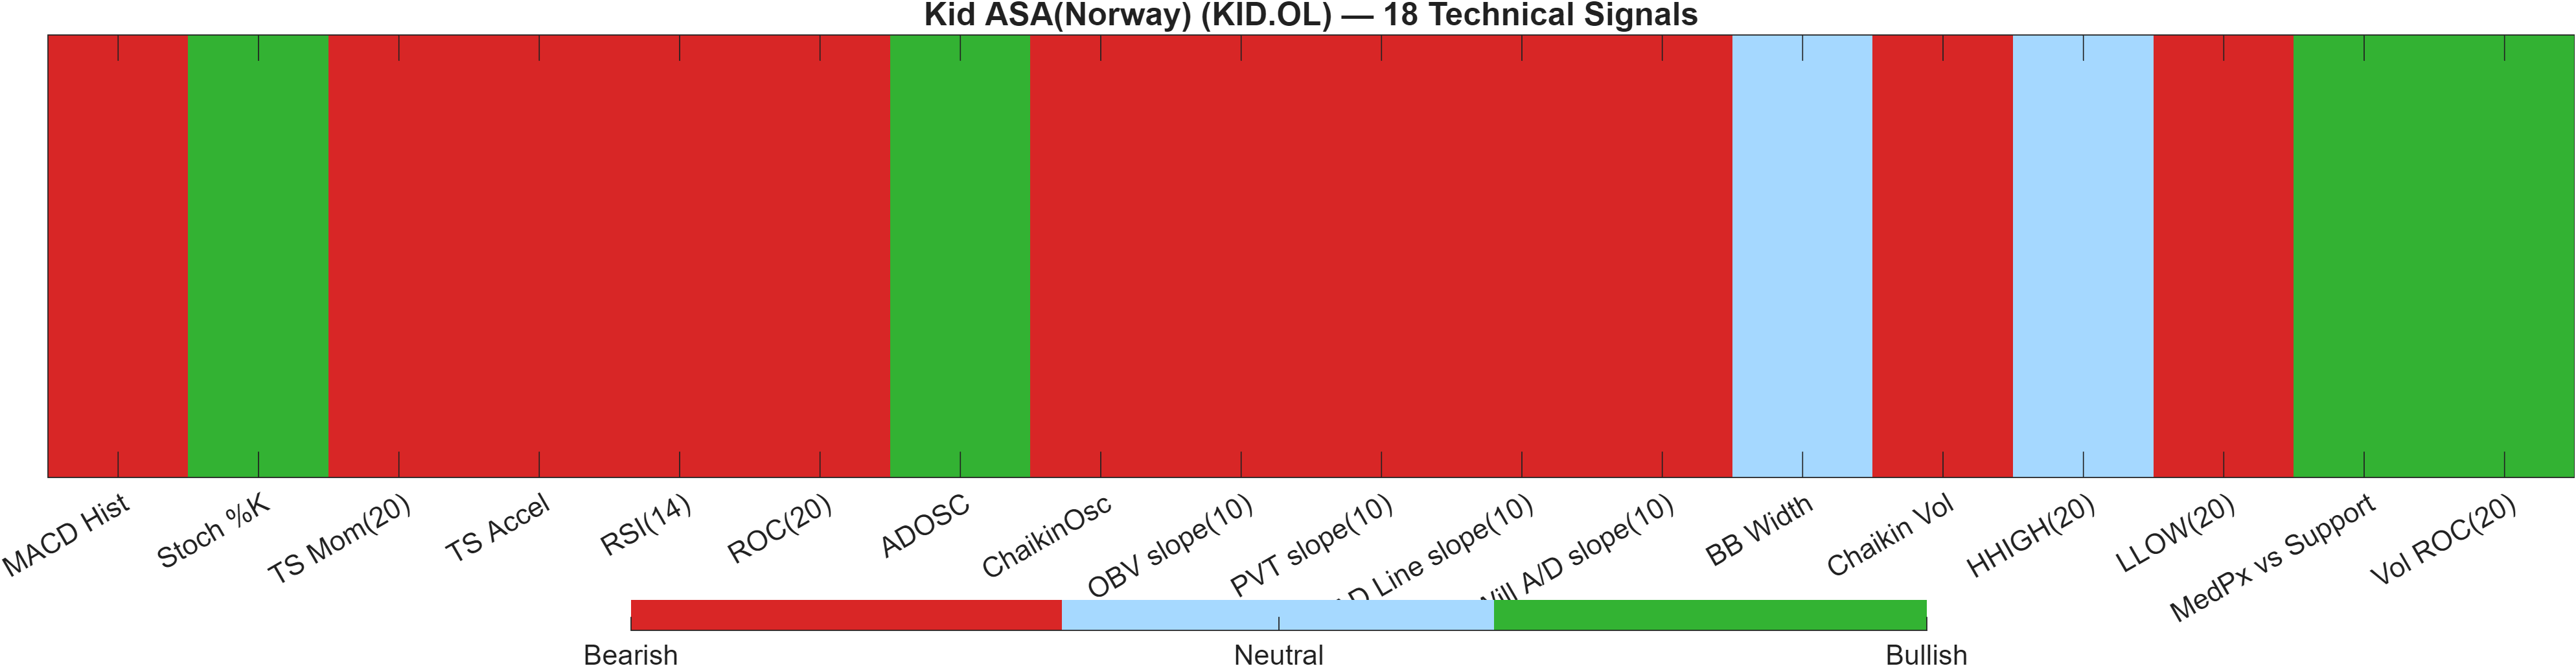
The technical layer is unambiguous on balance: the 18-signal confluence is -0.444 and the blended technical score is -0.554, both labeled Bearish. The distribution (Bull 4 / Bear 12 / Neutral 2) suggests that weakness is broad-based across momentum and participation measures rather than isolated to a single indicator family. The DRL technical rank (#1282) further indicates that, cross-sectionally, the current technical state is among the weaker subset of the universe.
The important nuance is where bearishness is concentrated. Momentum and rate-of-change metrics remain negative (e.g., MACD histogram -0.7588; ROC(20) -7.971; TS acceleration -22.53), which is consistent with the RSI read at 31.19. At the same time, there are selective positives that can matter for stabilization: Stoch %K 11.76 is bullish (often a “washed-out” condition), ADOSC 16.67 is bullish, and Vol ROC(20) 44.62 is bullish—together suggesting that a rebound attempt could be tradable if price reclaims key structure.
Participation measures, however, remain a headwind: several slope-based flow/volume proxies are labeled bearish (e.g., negative OBV and AD slopes in the table), which aligns with the idea that the market has not yet shown consistent accumulation characteristics. In that context, the neutral volatility read (BB Width 0.09222) can be interpreted as a market that is weak but orderly—more consistent with distribution or controlled de-risking than forced liquidation.
Signal table (Bull/Bear/Neutral)
| Indicator | Value | Signal |
|---|---|---|
| MACD Hist | -0.7588 | Bearish |
| Stoch %K | 11.76 | Bullish |
| TS Mom(20) | -11 | Bearish |
| TS Accel | -22.53 | Bearish |
| RSI(14) | 31.19 | Bearish |
| ROC(20) | -7.971 | Bearish |
| ADOSC | 16.67 | Bullish |
| ChaikinOsc | -9.57e+04 | Bearish |
| OBV slope(10) | -6.591e+05 | Bearish |
| PVT slope(10) | -3788 | Bearish |
| AD Line slope(10) | -4.053e+05 | Bearish |
| Will A/D slope(10) | -13.5 | Bearish |
| BB Width | 0.09222 | Neutral |
| Chaikin Vol | 18.86 | Bearish |
| HHIGH(20) | 138.6 | Neutral |
| LLOW(20) | 126.2 | Bearish |
| MedPx vs Support | 7.4 | Bullish |
| Vol ROC(20) | 44.62 | Bullish |
6) News sentiment + extractive gist
Sentiment score (avg): 0.361 | Positive: 100% | Neutral: 0% | Negative: 0%
KGNAI AI News Sentiment Score (normalized -1 to +1): 1.00 (as of 2026-01-22) | Label: Bullish | Overall news score: 1.00
Positive Developments
Recent coverage across major financial outlets indicates a consistently constructive narrative around operational execution and growth initiatives, which is consistent with the dataset’s 100% positive news classification and 1.00 normalized sentiment score. The recurring emphasis is on revenue growth and the ability to manage cost and channel mix while scaling activity, with operational actions framed as deliberate rather than reactive. From a market-structure perspective, a uniformly positive sentiment tape can reduce incremental downside sensitivity around routine updates and can support stabilization near key technical levels—particularly when momentum is stretched (e.g., RSI(14) 31.19). That said, sentiment should be treated as contextual bias: it can improve the odds of dip-buying interest emerging, but it does not mechanically reverse bearish technical breadth when the blended score remains -0.554.
Neutral / Mixed Developments
The same coverage also carries mixed elements that tend to sit in the “execution watch” bucket rather than thesis-breaking signals. Commentary frequently combines strong top-line descriptors with acknowledgments of operating frictions, which can keep investor attention on near-term delivery and margin/efficiency pathways. In the current setup, this matters because the tape is already reflecting hesitancy: the short-to-mid KGNAI ranks are Neutral (Daily #290; Weekly #967; Monthly #394), and the price trend state is split (Close vs MA50 bearish, MA50 vs MA200 bullish). As a result, informational items may function more as catalysts for volatility around the 120.3000–137.0000 range than as clean directional drivers.
Negative / Risk Signals
Risk framing in recent coverage tends to concentrate on operational and logistical challenges alongside cost and margin pressures. Even when the broader tone is positive, these issues can still matter for price behavior because they often map onto near-term uncertainty—precisely where KID.OL’s technical picture is weakest (DRL rank #1282; MACD histogram -0.7588; TS acceleration -22.53). When a market is technically heavy but sentiment is constructive, downside can become more “orderly” rather than abrupt, yet it can also persist if confirmation does not arrive through price reclaiming resistance and improving participation measures. The practical risk marker in this report remains structural: a close below 120.3000 would align negative price action with currently bearish internals.
- Whether price action can sustain acceptance above 137.0000 alongside improving momentum (watch RSI(14) and MACD histogram behavior).
- Whether activity translates into confirmation beyond volume expansion (e.g., stabilization in flow/participation measures that are currently bearish in the signal set).
- Whether price holds the 120.3000 support zone during any renewed weakness.
Snapshot: AI Rank (Short–Mid–Long): Mixed (Neutral–Neutral–Bullish) · Technical Confluence: Bearish · Key Levels: Support ~120.30 | Resistance ~137.00 · News Sentiment: Positive
Sources referenced: Reuters, Bloomberg, Yahoo Finance, MarketWatch, Investing.com
7) Sources
Not available in the provided data.
You may also like: How KGNAI AI ranks instruments across global markets
Disclaimer: KGNAI provides AI-generated analytics and educational market commentary only. This is not financial advice. Markets involve risk. Always do your own research.