
ALFA.LSE (Alfa Financial Software Holdings PLC(UK)) — 29-Apr-2026 Technical Ranks Suggest a Balanced Bearish Bias
As of 29-Apr-2026, KGNAI’s cross-universe positioning for ALFA.LSE leans bearish across most horizons, while the indicator-level picture is more mixed. The daily rank (#1253/1419) and yearly rank (#1294/1419) sit in the weaker tail of the EUROPE universe, which typically aligns with softer relative behavior versus peers. At the same time, the 18-signal confluence score (-0.056) and the overall technical score (-0.236) remain Neutral, highlighting a market that is not uniformly trending but instead oscillating between rebound attempts and participation fade. Momentum metrics show selective improvement (e.g., Stoch %K 18.33 and ROC(20) 4.301), yet volume/flow signals remain heavy and volatility is not expansive (Bollinger bandwidth 0.1054). Key decision zones frame risk: support ~143.4946 and resistance ~198.0000.
Key Takeaways
- Rank stance: Short Bearish | Mid Bearish | Long Bearish (universe size: 1419)
- Technical confluence: Neutral (18-signal confluence -0.056; blended overall -0.236)
- Key levels: Support ~143.4946 | Resistance ~198.0000
- News sentiment bias: Neutral (avg 0.086; 19% positive / 81% neutral / 0% negative; instrument-specific matches not found)
- Confirmation / invalidation condition: A sustained break above 198.0000 with volume would improve trend confirmation; a close below 143.4946 would raise deterioration risk.
What KGNAI Measures
KGNAI evaluates assets using large cross-sectional datasets built from millions of structured data points. Inputs incorporate fundamental metrics, technical structures, and systematically processed news sentiment. Statistical models, machine learning, and AI frameworks are used to assess relative positioning, signal alignment, and probabilistic behavior across broad universes.
How to Read This Report
- Ranks are comparative across the tracked universe, not absolute price targets.
- Confluence reflects alignment among independent signal groups.
- Support/resistance levels are probabilistic decision zones, not guarantees.
- Sentiment provides contextual bias within the broader analytical framework.
1) KGNAI AI Analysis
Region: EUROPE | Total universe size: 1419 ranked instruments
- Daily rank: #1253 out of 1419 — Bearish
- Weekly rank: #1188 out of 1419 — Bearish
- Monthly rank: #1124 out of 1419 — Neutral
- 3-Monthly rank: #1207 out of 1419 — Bearish
- 6-Monthly rank: #1158 out of 1419 — Bearish
- Yearly rank: #1294 out of 1419 — Bearish
The rank profile clusters in the lower third of the universe for most horizons, with the daily (#1253), 3-month (#1207), and yearly (#1294) readings all carrying bearish labels. This consistency across short, intermediate, and long windows is typically associated with weaker relative technical behavior versus peers rather than a single-timeframe anomaly.
One nuance is the monthly rank (#1124) being Neutral, which can occur when price stabilizes enough to reduce near-term downside pressure while broader regime measures remain weak. In practice, that combination often maps to an “underperformer attempting basing” state: downside is less one-directional, but upside follow-through is not yet validated by cross-sectional strength.
The rank framework is reinforced by the technical blend later in the report: the indicator confluence is close to flat (-0.056), but the separate AI technical rank remains poor (#1176/1419), pulling the blended view to -0.236 (Neutral). That divergence suggests signals inside the chart may be improving at the margin, while broader comparative behavior still argues for caution.
Term view: Short-term: Bearish. Mid-term: Bearish. Long-term: Bearish.
Want the full universe and complete rank tables? Unlock full access on KGNAI: https://www.kgnai.com/pricing
2) Price & trend overview
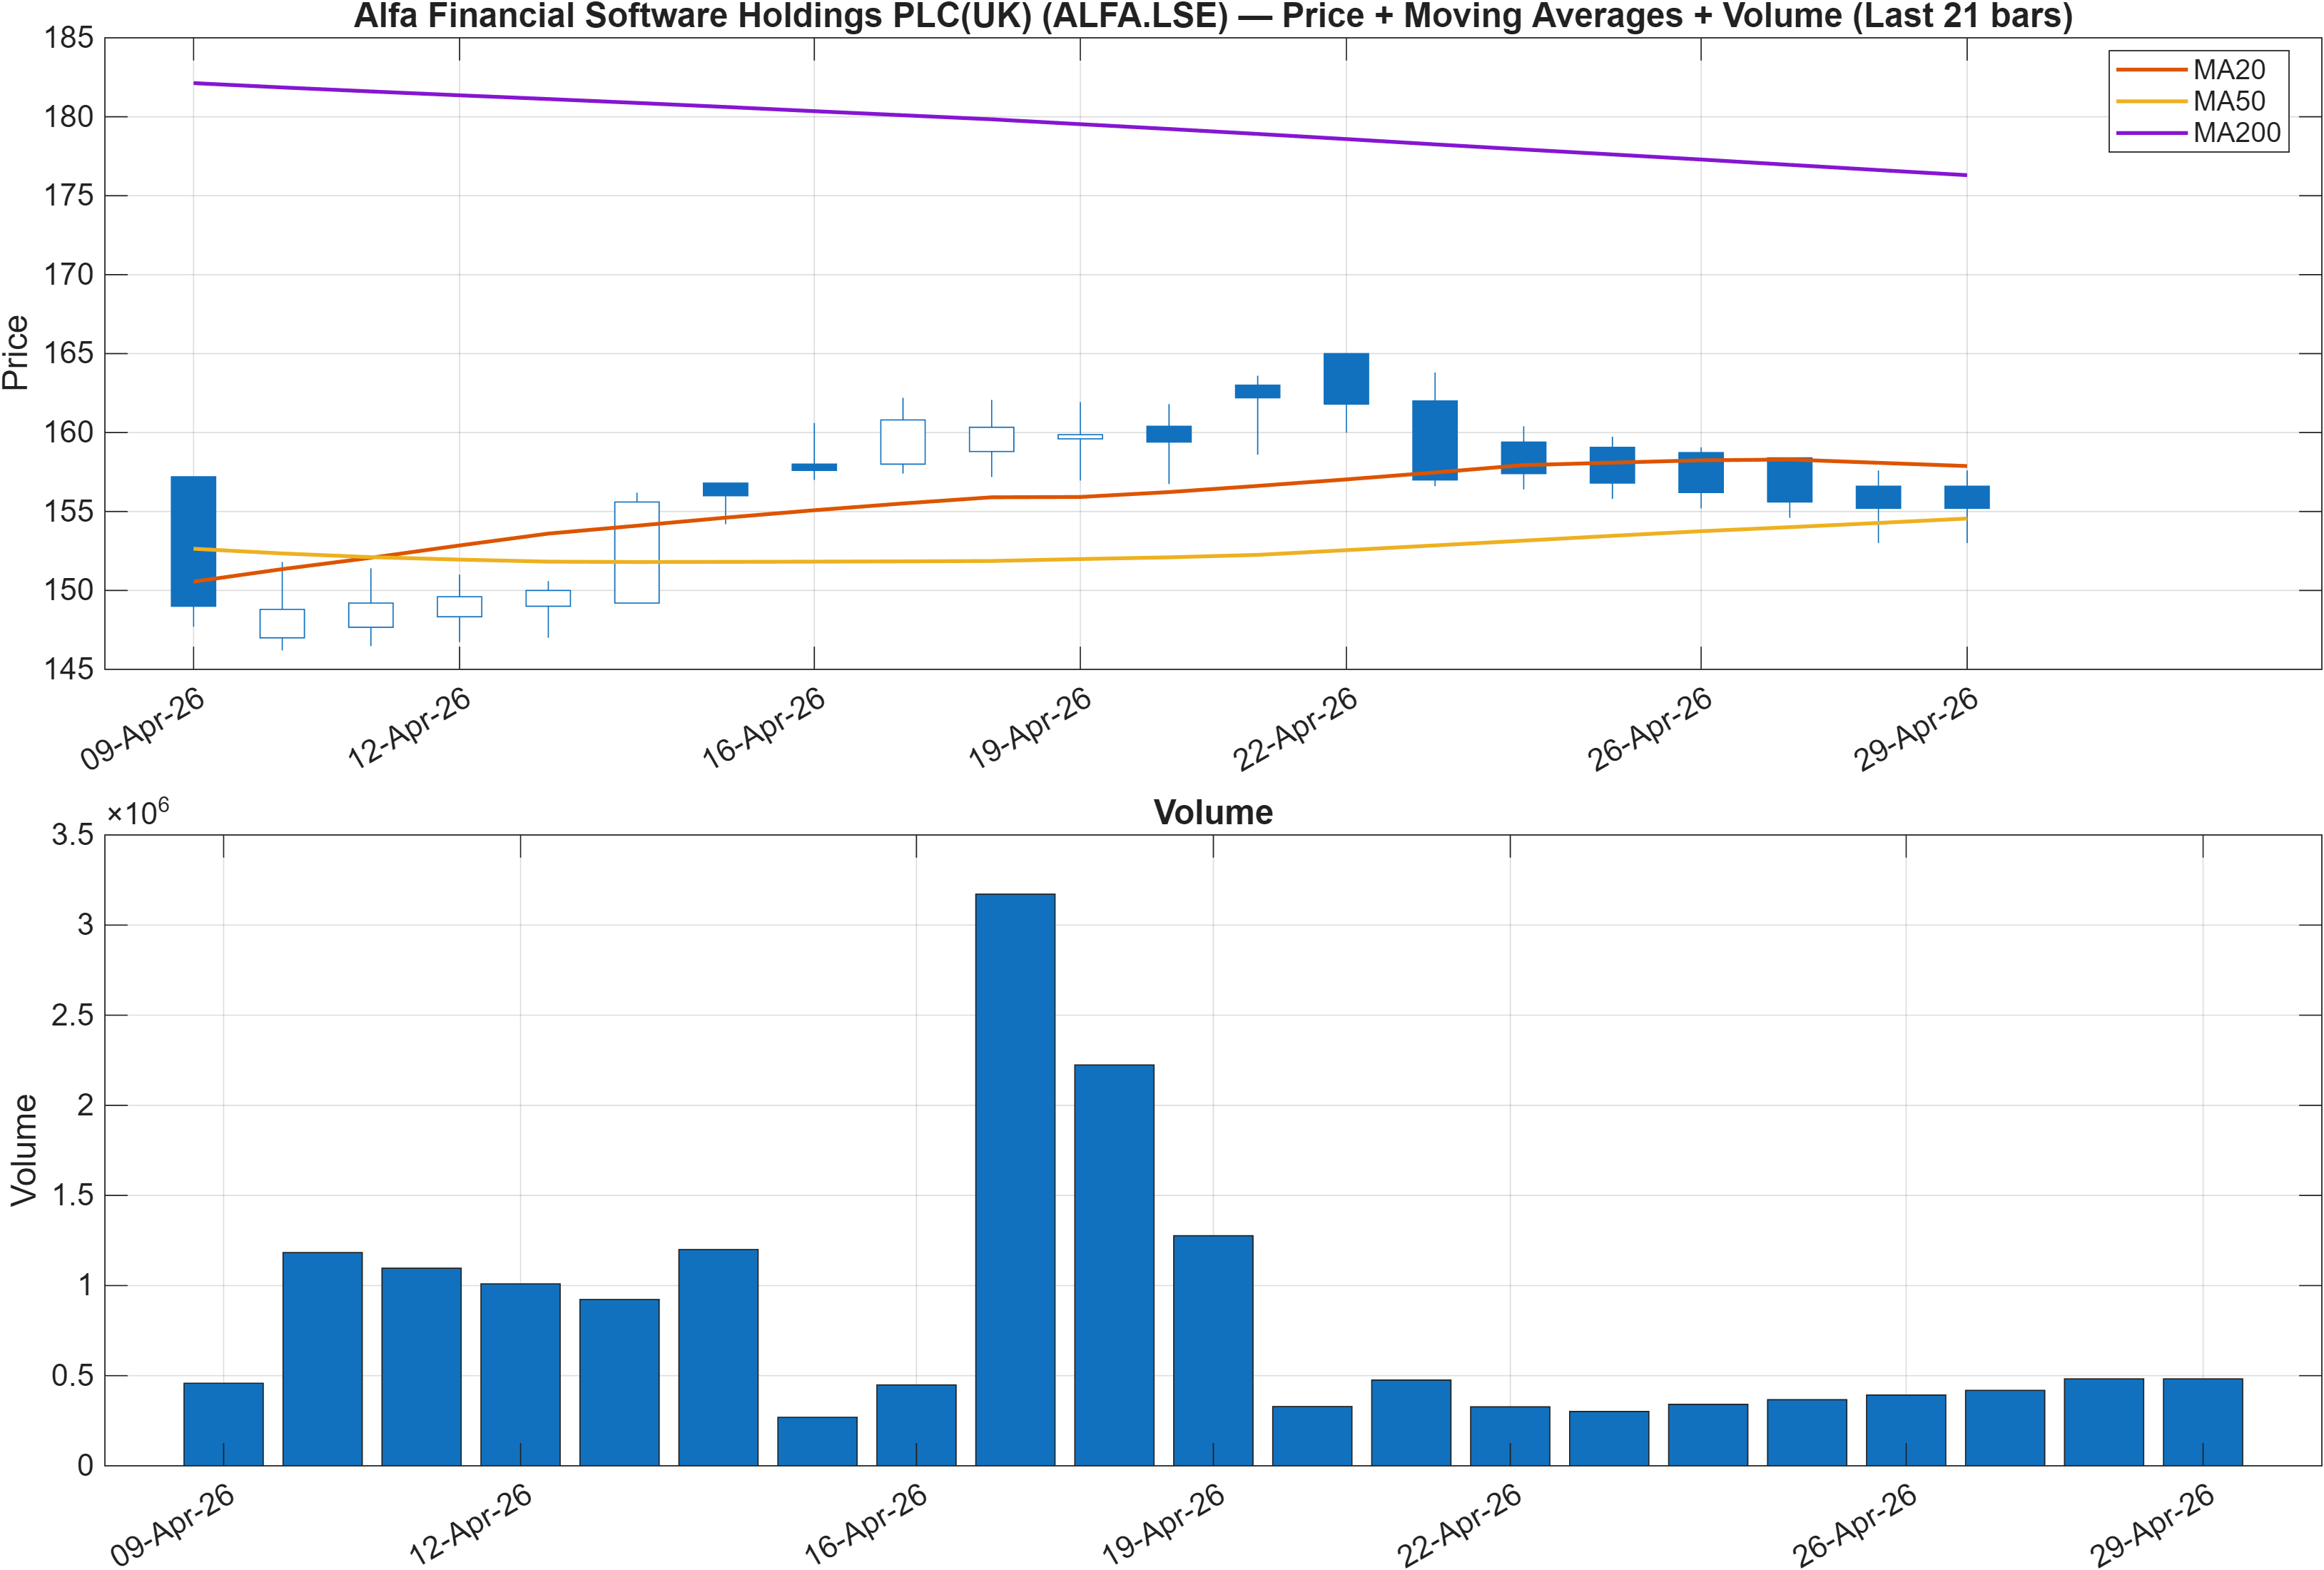
Trend structure is currently best described as mixed across horizons. The provided interpretation reads Close vs MA50 = Bullish while MA50 vs MA200 = Bearish, which is a classic configuration where near-term recovery is occurring inside a weaker longer-term trend. This is often where whipsaw risk increases: price can look improved on a shorter lens, but the broader moving-average stack still reflects prior deterioration.
In that context, confirmation tends to be less about a single up day and more about persistence. The rank backdrop supports this framing: the weekly rank (#1188) and 6-month rank (#1158) are both bearish, implying that even if price is holding above the MA50, the instrument has not yet demonstrated sustained relative strength versus the broader universe.
Volume adds an additional constraint. While the figure provides the visual, the signal table later flags Vol ROC(20) at -59.22 as bearish—consistent with participation fading rather than expanding on rallies. When short-term trend improvement is accompanied by weakening volume dynamics, breakouts can be less reliable and mean-reversion more common.
Taken together, the price/MA configuration argues for monitoring whether the rebound can transition into a more durable regime shift. Without a broader improvement in comparative rank and participation, the setup often behaves like a recovery phase within a still-challenged longer-term structure.
3) Momentum & volatility dashboard
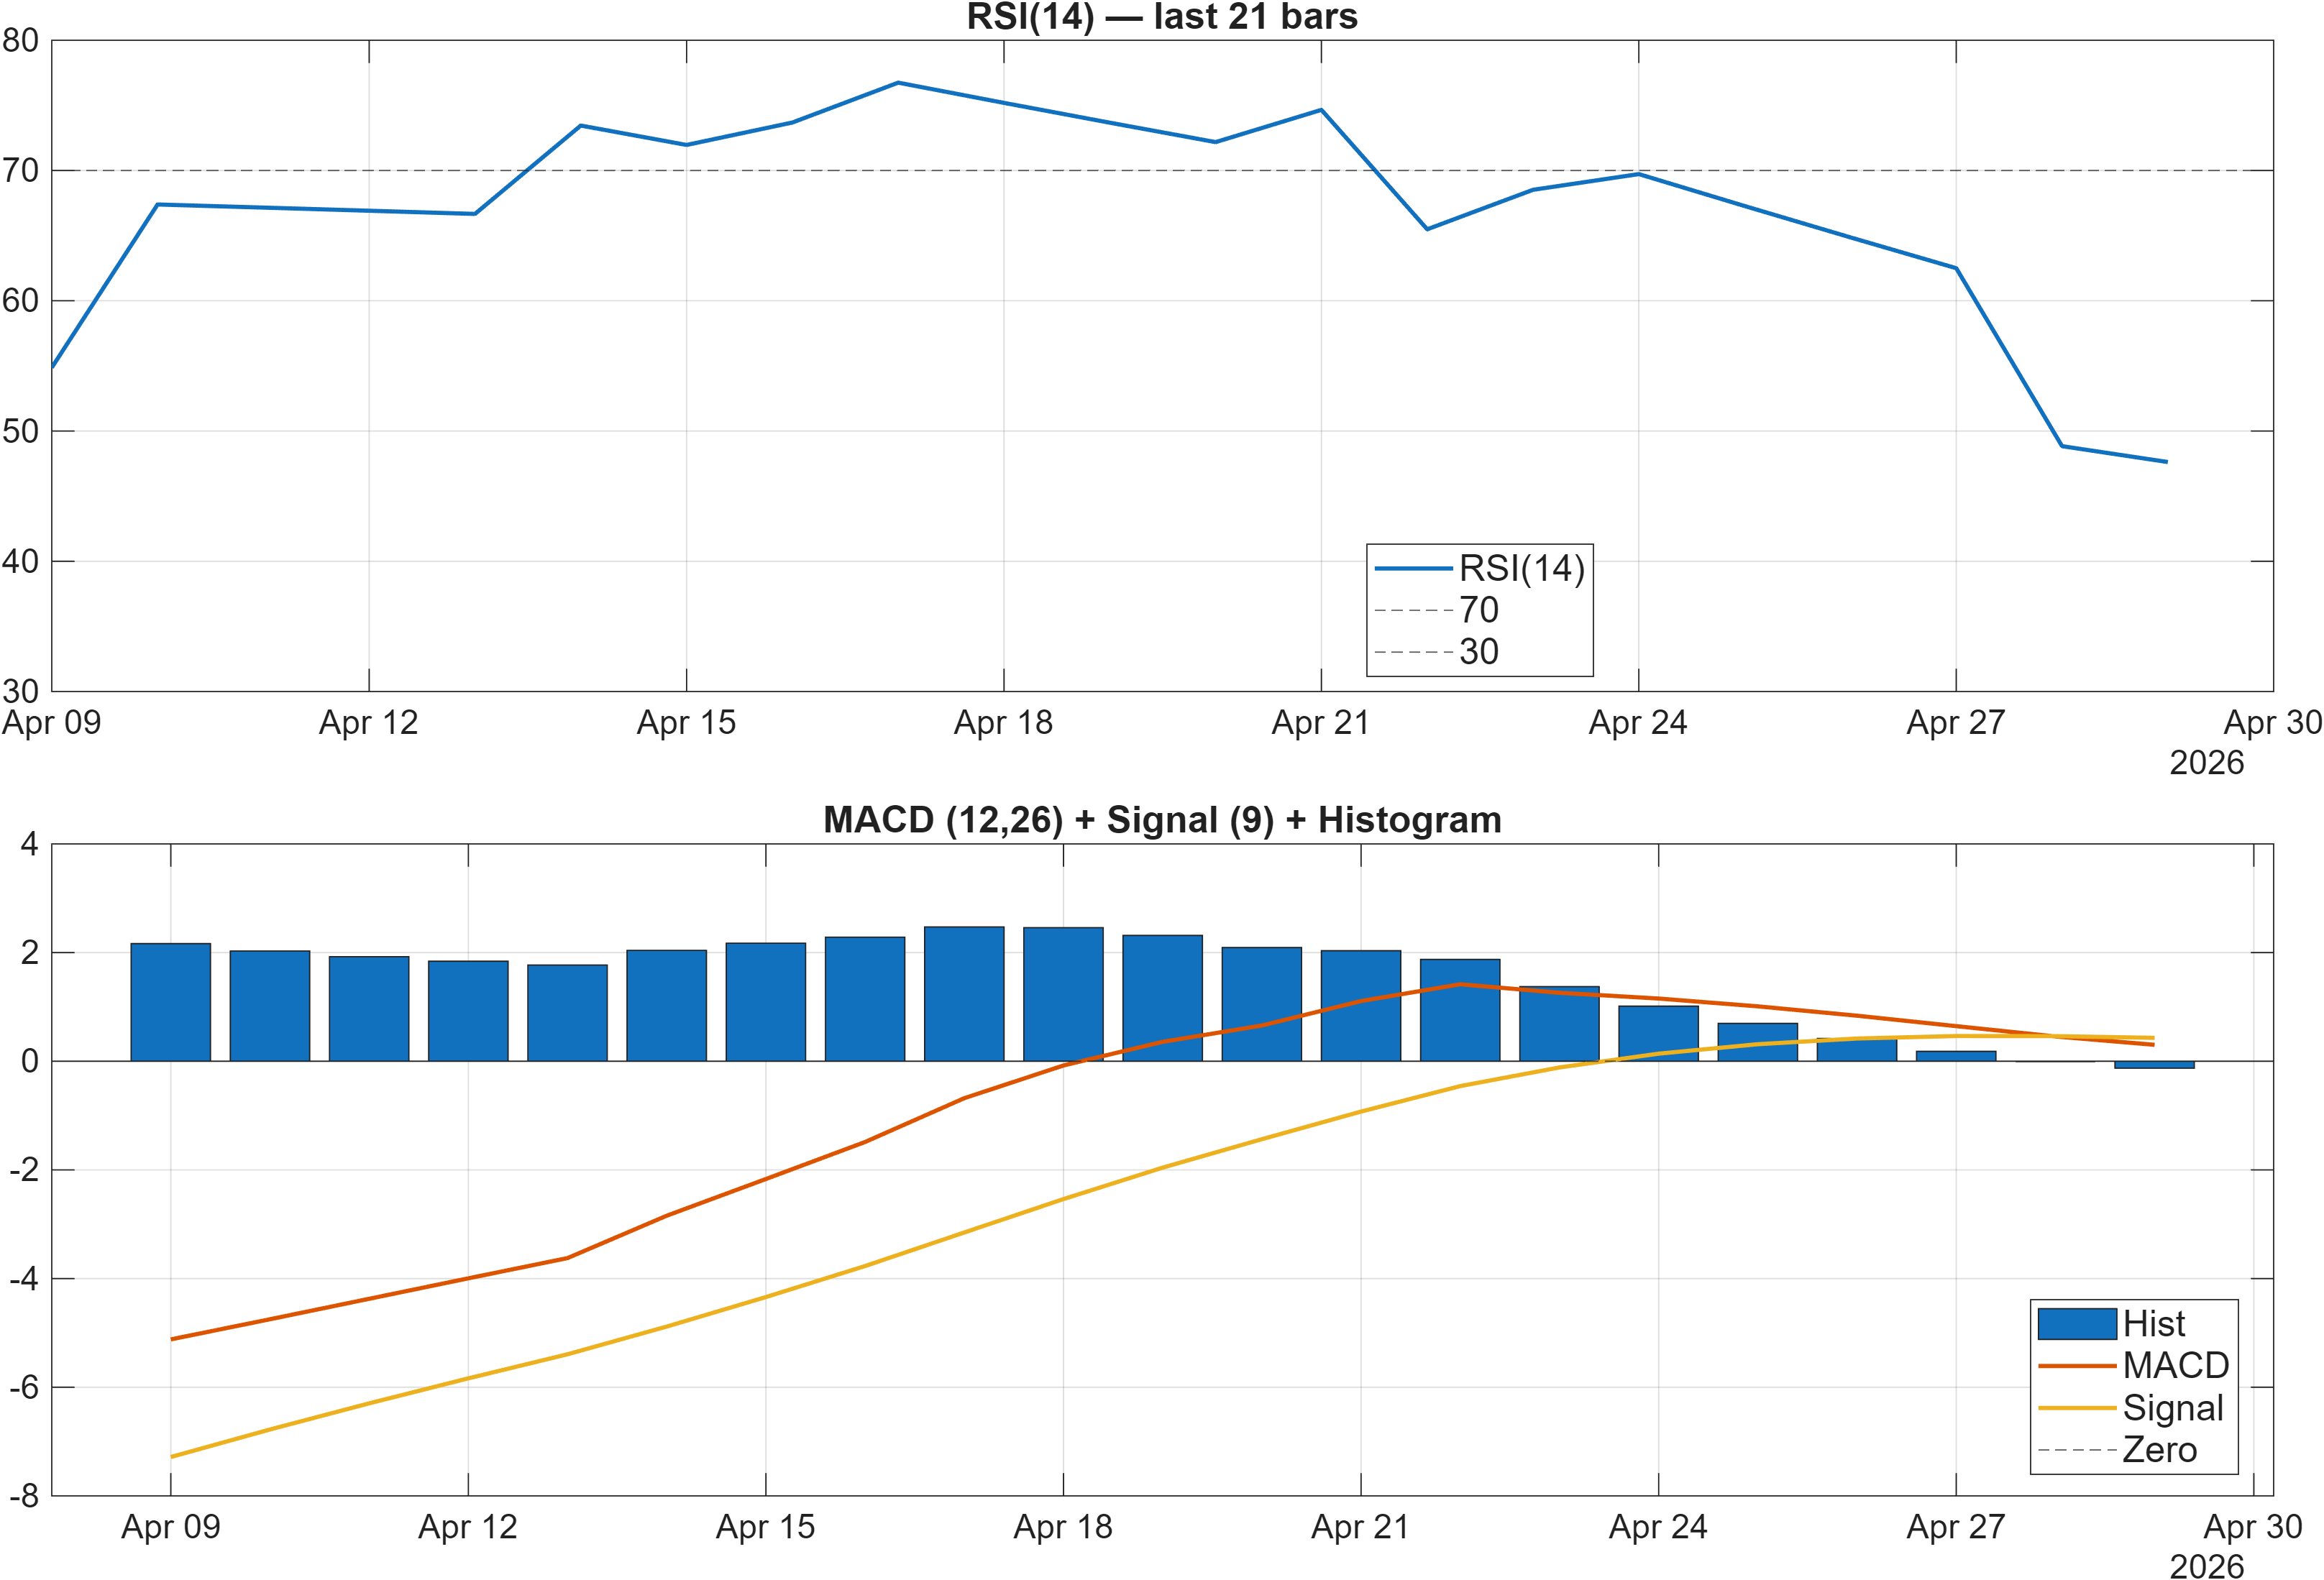
Momentum signals show selective improvement without full confirmation. RSI is described as Neutral and the table places RSI(14) at 47.62, a level typically associated with balance rather than trend strength. Meanwhile, MACD remains a headwind: the MACD histogram is -0.1282 and explicitly labeled bearish, suggesting that the most recent momentum impulse has not yet flipped into a consistently positive regime.
Shorter-cycle oscillators are more constructive. Stoch %K at 18.33 is labeled bullish, and with TS Mom(20) at 6.4 plus TS Accel at 8.733 also bullish, the data points toward a market that has staged a rebound from a weaker condition. However, bullish oscillators alongside a still-negative MACD histogram commonly describe a countertrend or early-turn attempt rather than a fully established advance.
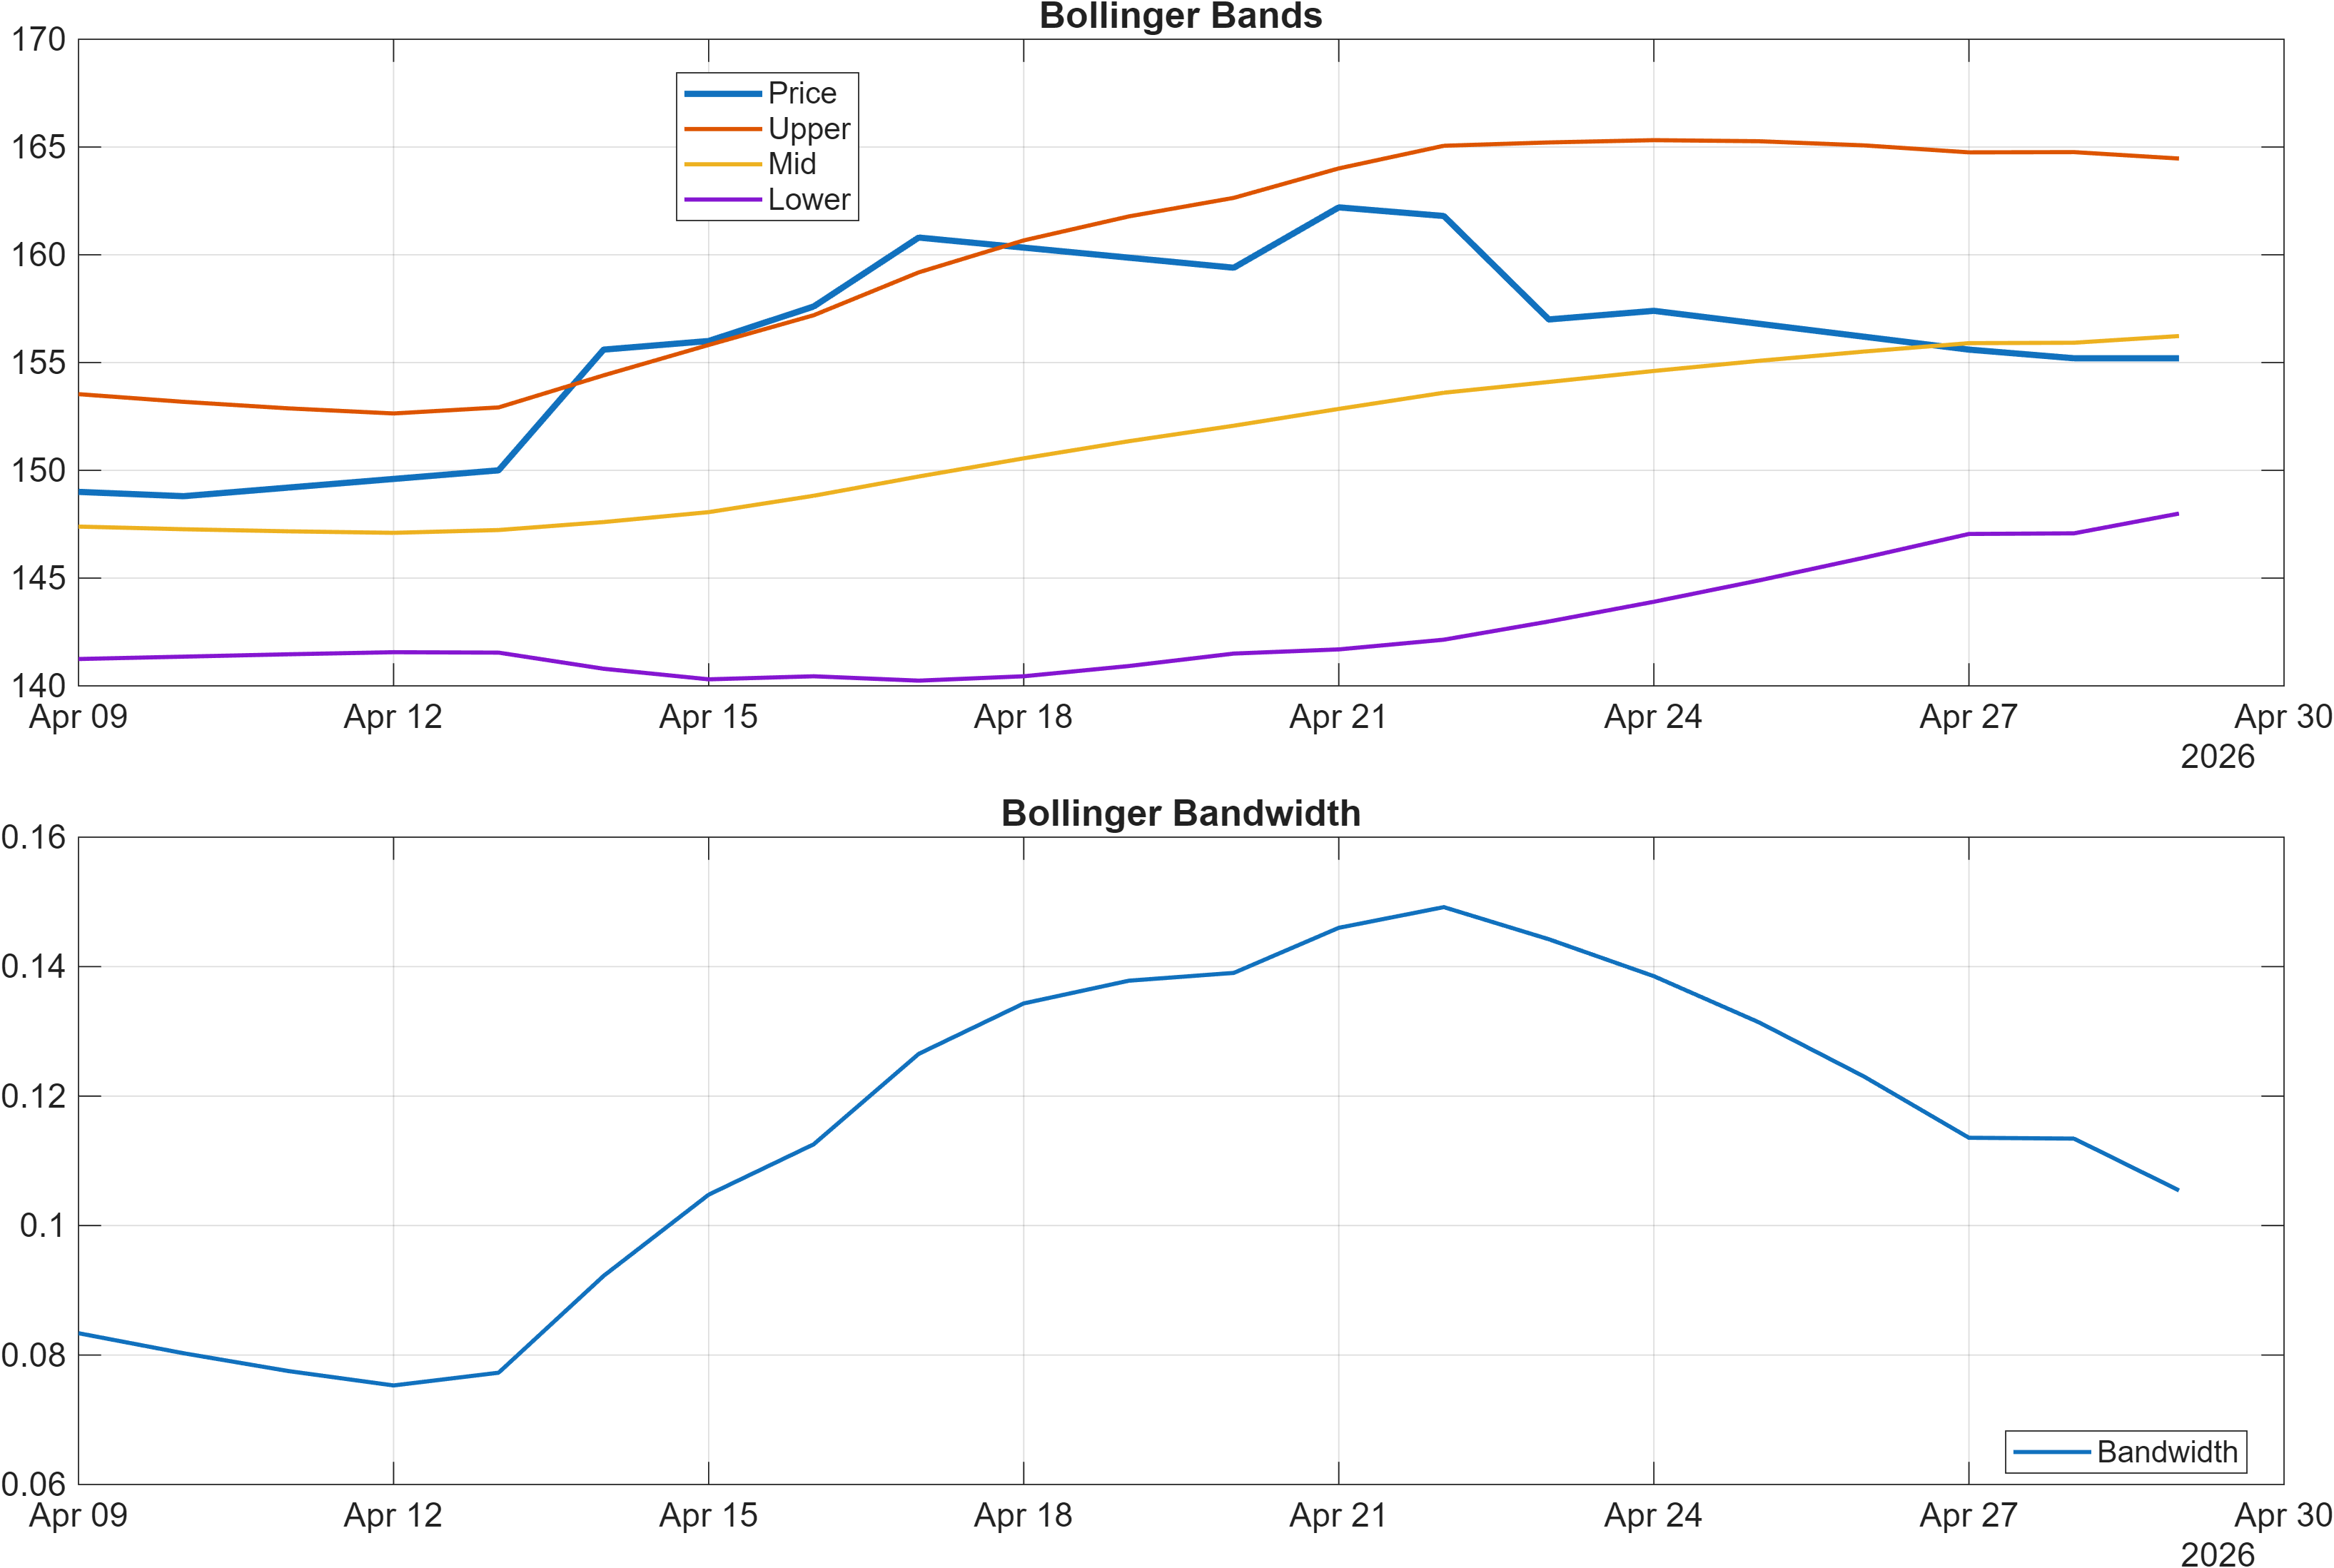
Volatility conditions do not currently imply a strong expansion phase. The Bollinger bandwidth is 0.1054 (also reflected as BB Width 0.1054, Neutral). When bandwidth stays contained, price may remain range-bound, and signals can rotate more quickly between bullish and bearish readings. This matters because a durable trend typically benefits from volatility expansion rather than compression.
Overall, momentum is not uniformly bearish; instead, it is internally split—oscillators improve first, MACD confirms later, and volatility dictates whether the move becomes directional. The current mix supports a cautious stance consistent with the weaker cross-sectional ranks.
4) Support / Resistance zones
Support ~ 143.4946 | Resistance ~ 198.0000
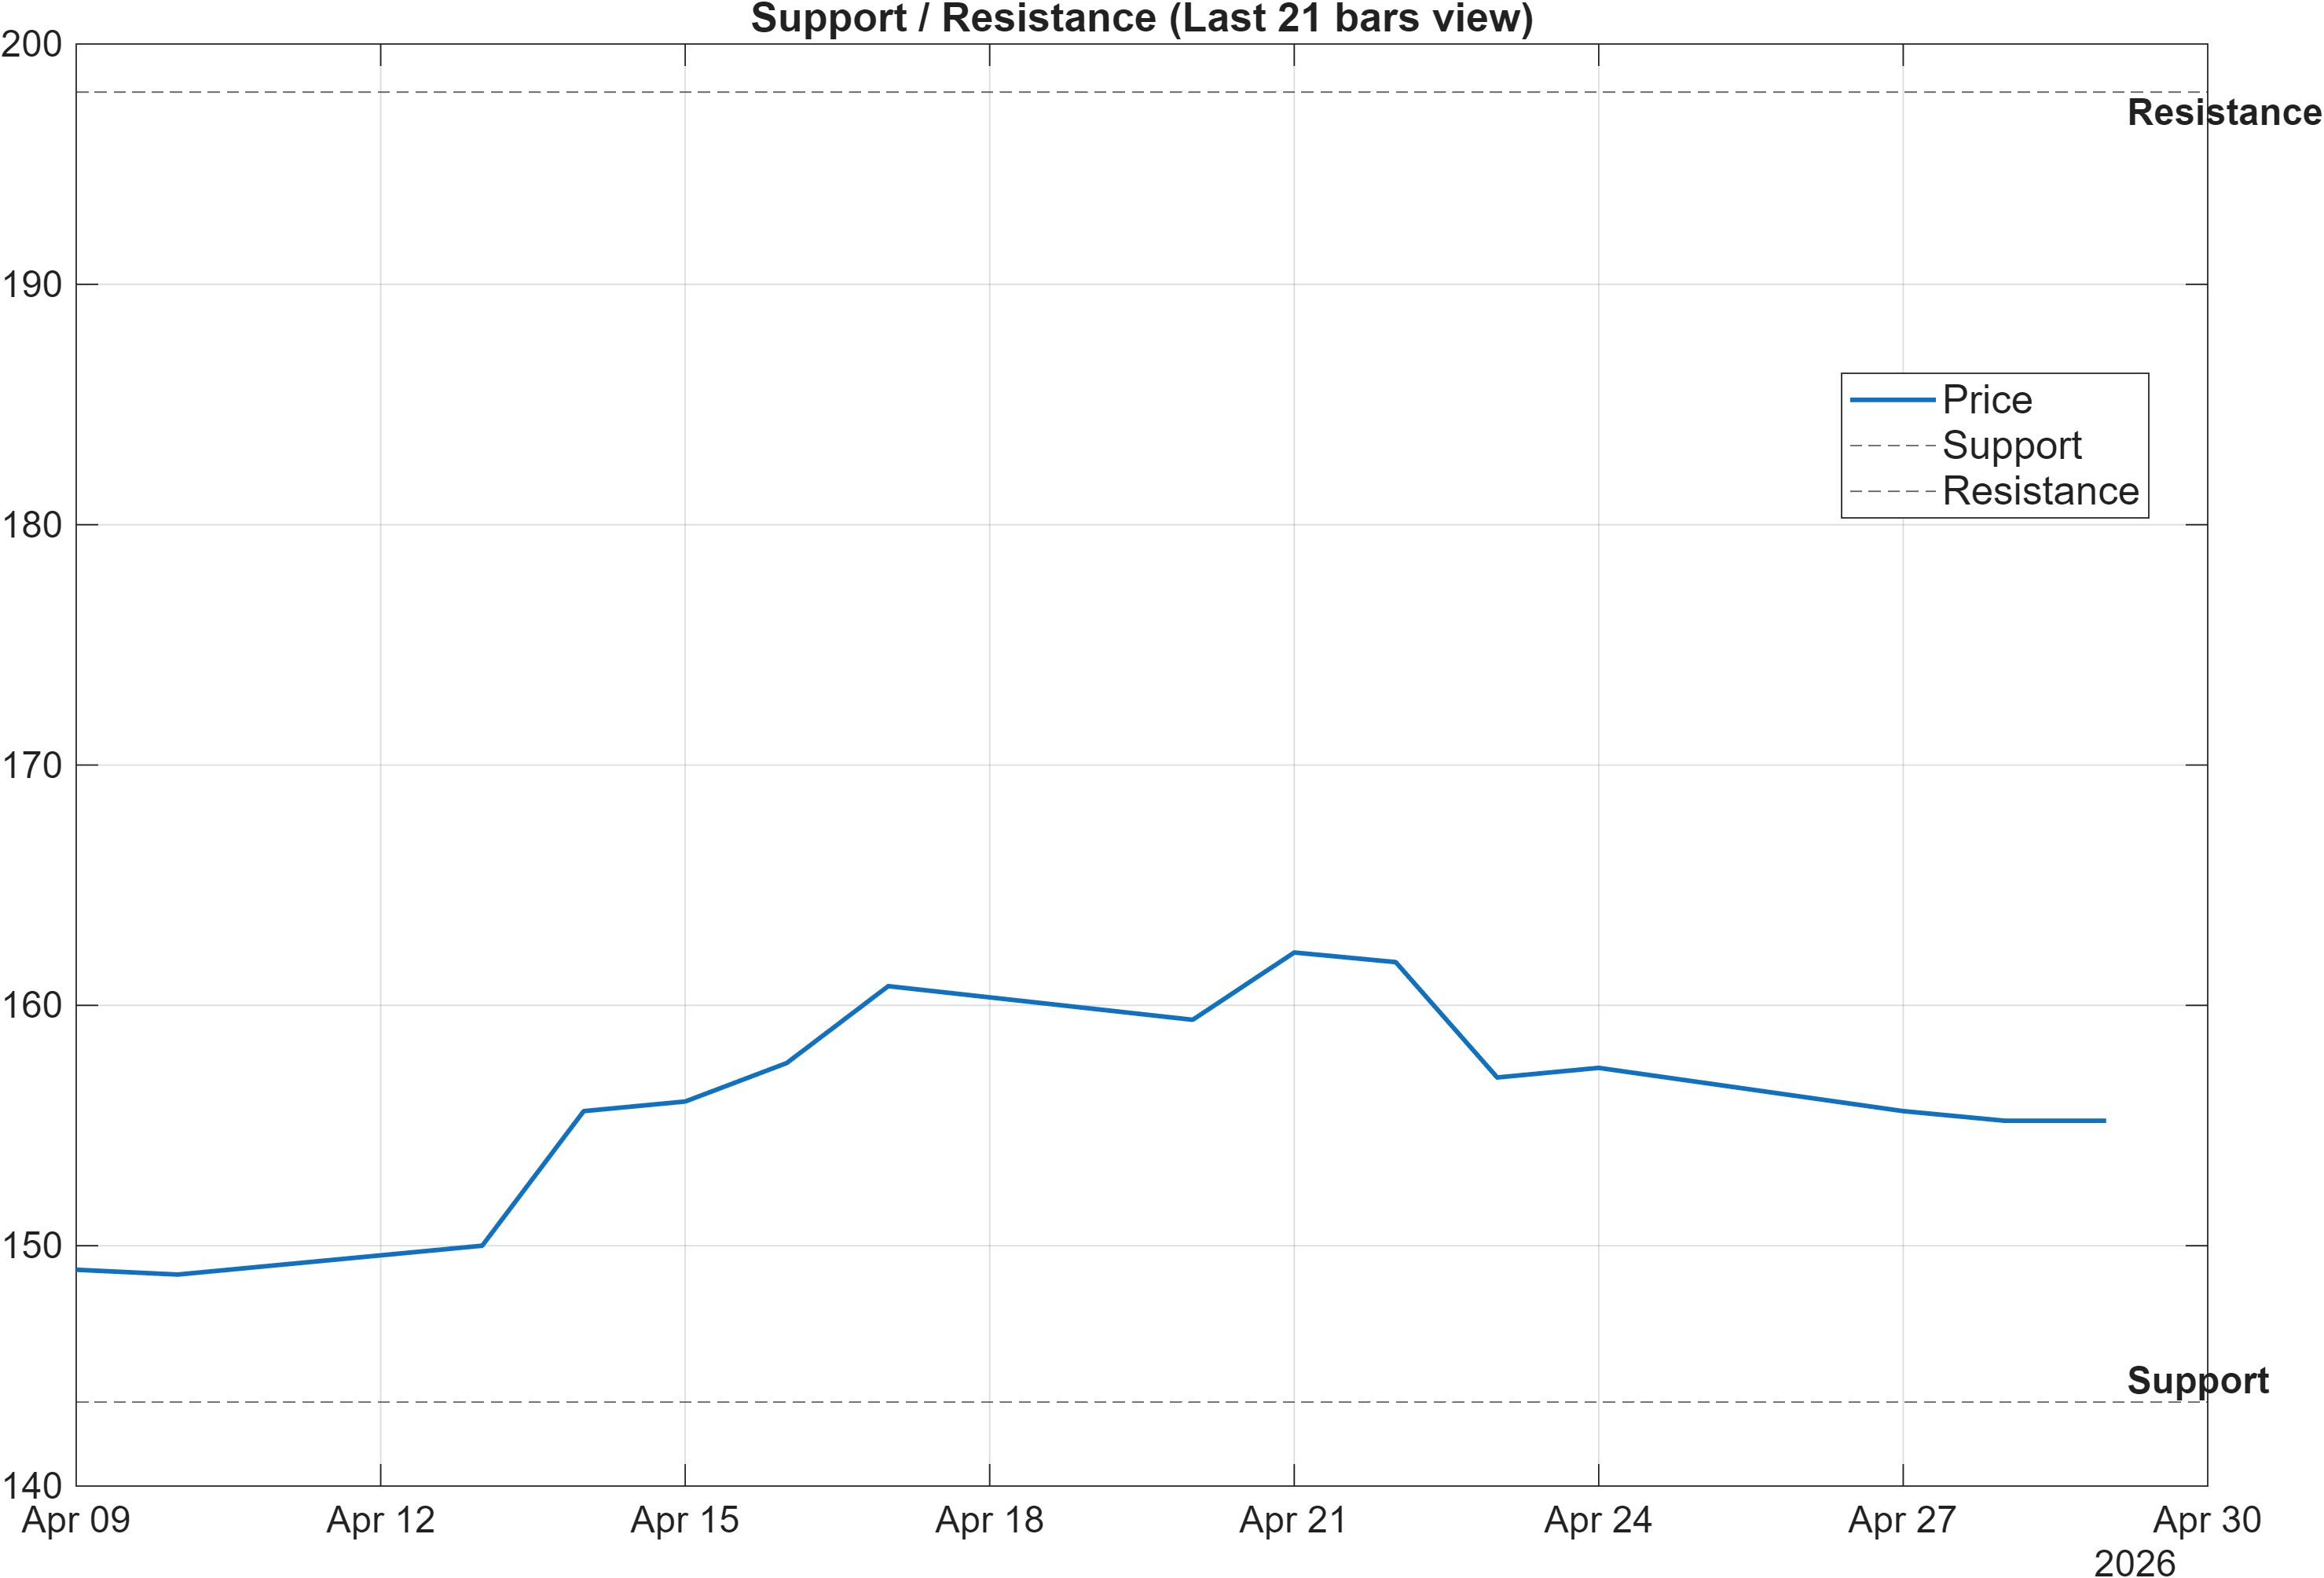
The support/resistance map frames the current market as a decision-zone structure rather than a completed trend. The stated levels—143.4946 for support and 198.0000 for resistance—create a wide operating range, implying that the market may require multiple tests before direction becomes clearer. In this type of regime, reactions at levels often carry more information than mid-range movement.
Internally, the signal table provides a small but relevant alignment check: MedPx vs Support = 11.81 is labeled bullish, consistent with price holding meaningfully above the defined support zone. That supports the idea that downside has a nearby reference point, but it does not, by itself, resolve the longer-term bearish rank posture.
From a confirmation standpoint, the scenario language is already explicit: a break above resistance with volume would favor continuation, while a close below support increases deterioration risk. This is where the participation indicators become particularly important. With Vol ROC(20) at -59.22 (Bearish) and multiple flow measures negative (e.g., OBV slope(10) -1.801e+06 is Bearish), upside attempts may require an observable shift in volume behavior to be trusted.
Practically, these levels can be treated as probabilistic boundaries for reassessing the regime: strength above 198.0000 challenges the longer-term bearish framing, while weakness below 143.4946 would align the price structure more tightly with the bearish ranks.
5) Quant Technical Dashboard (18 Signals)
KGNAI AI Technical Analysis Score (Deep Reinforcement Learning): Rank #1176 out of 1419 (Rank 1 represents the strongest technical positioning and a higher probability of favorable price behavior. As ranks increase toward the maximum, the probability of favorable outcomes weakens and bearish positioning becomes more dominant.) | Label: Bearish | Score: -0.658
18-Signal Technical Confluence Score: -0.056 (Neutral)
Overall Technical Score (18-signal confluence + DRL rank blend): -0.236 (Neutral)
Note: The blended score reflects signal strength weighted against broader AI technical ranking, which may temporarily diverge.
Blended technical score breakdown: -0.236 (Neutral | Bull 6 / Bear 7 / Neutral 5)
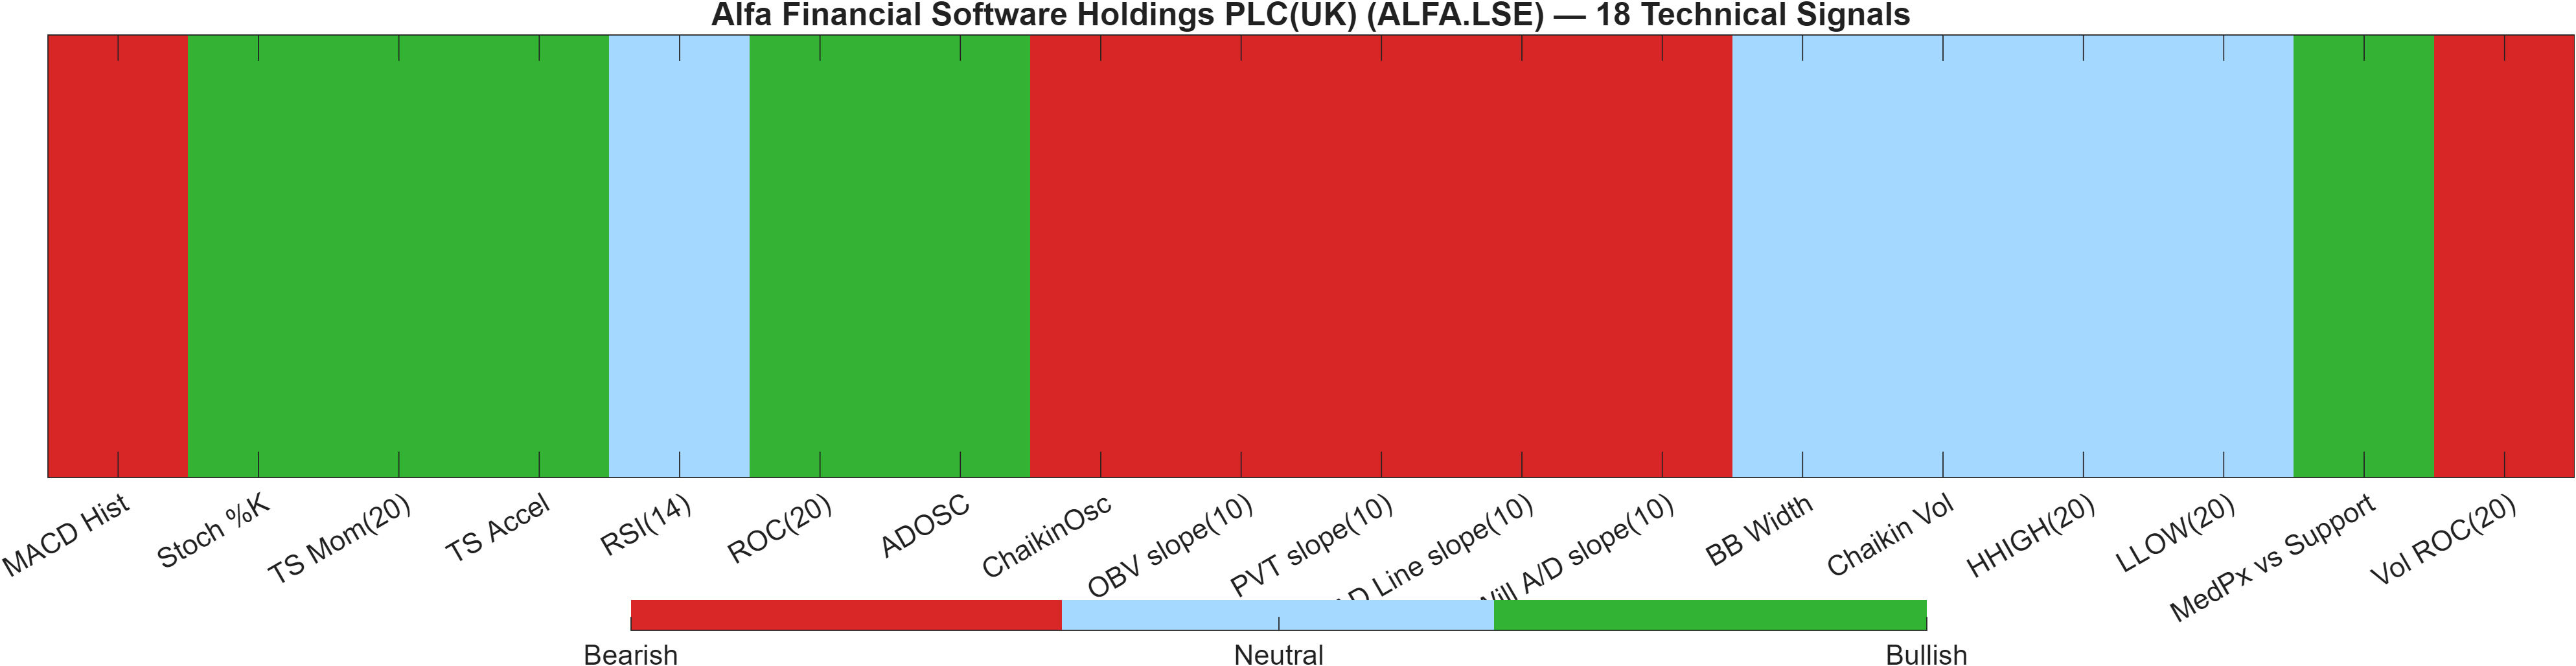
This dashboard is best read as a confluence-versus-regime comparison. The indicator stack is close to balanced (confluence -0.056, Neutral), but the DRL model ranks the technical state poorly (#1176/1419, score -0.658). When the blended score stays Neutral (-0.236) despite a bearish AI rank, it often indicates early stabilization that has not yet translated into durable relative strength.
The composition supports that interpretation. On the constructive side, momentum/oscillator readings (e.g., ROC(20) 4.301 bullish and TS Mom(20) 6.4 bullish) suggest upside impulses are present. Accumulation also appears mixed: ADOSC 34.78 is bullish, but several closely related flow/participation measures remain bearish, including ChaikinOsc -1.01e+05 and PVT slope(10) -7233. This internal disagreement often shows that buying pressure is not broad-based across volume-derived measures.
A second tension comes from volatility and trend boundaries. BB Width 0.1054 (Neutral) aligns with a non-expansive regime, where signals can flip without follow-through. In that setting, a bearish MACD histogram (-0.1282) can dominate if volatility fails to expand and price fails to extend beyond resistance.
Signal table (Bull/Bear/Neutral)
| Indicator | Value | Signal |
|---|---|---|
| MACD Hist | -0.1282 | Bearish |
| Stoch %K | 18.33 | Bullish |
| TS Mom(20) | 6.4 | Bullish |
| TS Accel | 8.733 | Bullish |
| RSI(14) | 47.62 | Neutral |
| ROC(20) | 4.301 | Bullish |
| ADOSC | 34.78 | Bullish |
| ChaikinOsc | -1.01e+05 | Bearish |
| OBV slope(10) | -1.801e+06 | Bearish |
| PVT slope(10) | -7233 | Bearish |
| AD Line slope(10) | -9.138e+05 | Bearish |
| Will A/D slope(10) | -18.8 | Bearish |
| BB Width | 0.1054 | Neutral |
| Chaikin Vol | -7.07 | Neutral |
| HHIGH(20) | 165 | Neutral |
| LLOW(20) | 146.2 | Neutral |
| MedPx vs Support | 11.81 | Bullish |
| Vol ROC(20) | -59.22 | Bearish |
Interpretation: Indicator-level signals form the base confluence, which is then adjusted using a separate AI-driven technical ranking model. The final technical score summarizes this combined view.
6) News sentiment + extractive gist
Note: Instrument-specific news matches were not found, so the digest includes broader market/sector headlines. Links are provided for verification.
Sentiment score (avg): 0.086 | Positive: 19% | Neutral: 81% | Negative: 0%
KGNAI AI News Sentiment Score (normalized -1 to +1): Not available (as of —) | Label: Not available | Overall news score: 0.09
Positive Developments
Recent coverage across major financial outlets indicates a modestly constructive tone dominated by market-activity and risk-on pockets rather than company-specific catalysts. The distribution is skewed toward neutral, but the 19% positive share alongside an average sentiment of 0.086 implies that the marginal flow of stories is not strongly adverse. The constructive tilt appears linked to improved trading conditions in parts of financial markets and resilience in select global equity segments, which can support broader risk appetite. For ALFA.LSE, this matters mainly as context: when the technical backdrop is mixed (neutral confluence at -0.056) and longer-horizon ranks remain bearish, macro- and sector-level tone can influence whether rebounds persist or stall. With instrument-specific matches not available in the provided data, the news read-through should be treated as a sentiment backdrop rather than a direct driver.
Neutral / Mixed Developments
The dominant regime in the digest is still neutral, consistent with the 81% neutral classification and the absence of negative items in the score split. Coverage appears informational and event-driven, mixing corporate/industry narratives with broader questions around commodity and policy dynamics. This kind of “busy but not directional” news mix often aligns with technical conditions where volatility is contained—here, Bollinger bandwidth 0.1054—and where oscillators can improve without a full trend transition. For ALFA.LSE, a neutral news backdrop tends to place more weight on price structure and participation signals (e.g., Vol ROC(20) -59.22) for determining whether moves are being reinforced by broader engagement.
Negative / Risk Signals
Even with 0% negative in the classified split, risk is still present in the form of geopolitical and commodity-disruption narratives that can raise volatility expectations and rotate leadership quickly across markets. These themes can be particularly relevant when an instrument is already weak on a cross-sectional basis (e.g., daily rank #1253/1419 and yearly rank #1294/1419) because shocks tend to punish weaker relative profiles first. In a setup where the longer-term moving-average relationship is bearish (MA50 vs MA200) while short-term price action is attempting to stabilize, exogenous risk can interrupt the stabilization process and push price toward key decision zones such as support ~143.4946. The practical takeaway is that “neutral” sentiment does not remove drawdown pathways when technical participation remains inconsistent.
- Whether price reactions near 198.0000 are accompanied by improving participation (watch Vol ROC(20) behavior).
- Whether momentum confirmation improves (watch MACD hist -0.1282 for a sustained turn).
- Whether any instrument-specific news becomes available; current digest is sector/macro in scope.
Snapshot: AI Rank (Short–Mid–Long): Bearish (Bearish–Bearish–Bearish) · Technical Confluence: Neutral · Key Levels: Support ~143.49 | Resistance ~198.00 · News Sentiment: Neutral
Sources referenced: Reuters, Bloomberg, Yahoo Finance, MarketWatch, Investing.com
7) Sources
Not available in the provided data.
You may also like: How KGNAI AI ranks instruments across global markets
Disclaimer: KGNAI provides AI-generated analytics and educational market commentary only. This is not financial advice. Markets involve risk. Always do your own research.