
SAF.PA (Safran SA) — 01-May-2026 Quant Signal Review: Neutral Ranks with Bearish Momentum Inside a Consolidation Regime
Safran SA (SAF.PA) currently presents a neutral cross-horizon rank profile inside KGNAI’s EUROPE universe (1419 instruments), while short-cycle technical signals skew more defensive. The 18-signal confluence is -0.111 (Neutral) and the blended overall technical score is -0.005 (Neutral), indicating that bearish momentum readings are being partially offset by pockets of supportive volume/accumulation behavior. On the chart, the moving-average structure is flagged as bearish (Close vs MA50 = Bearish; MA50 vs MA200 = Bearish), reinforcing a “consolidation with downside pressure” interpretation rather than clean trend continuation. Key decision zones remain clearly defined: support ~269.1500 and resistance ~320.7833. News sentiment metrics add a modest positive bias (avg sentiment 0.042; normalized score 1.00 as of 2026-04-24), but the market still requires price confirmation before that sentiment becomes technically actionable.
- Rank stance: Short Neutral | Mid Neutral | Long Neutral (with a stronger 6-month rank than weekly/monthly).
- Technical confluence: Neutral (18-signal confluence -0.111; blended score -0.005; Bull 6 / Bear 8 / Neutral 4).
- Key levels: Support ~269.1500 | Resistance ~320.7833.
- News sentiment bias: Bullish on normalized score (1.00), while distribution remains balanced (25% positive / 50% neutral / 25% negative).
- Confirmation / invalidation: A sustained push above 320.7833 with volume favors continuation signals; a close below 269.1500 increases deterioration risk.
What KGNAI Measures
KGNAI evaluates assets using large cross-sectional datasets built from millions of structured data points. Inputs incorporate fundamental metrics, technical structures, and systematically processed news sentiment. Statistical models, machine learning, and AI frameworks are used to assess relative positioning, signal alignment, and probabilistic behavior across broad universes.
How to Read This Report
- Ranks are comparative across the tracked universe, not absolute price targets.
- Confluence reflects alignment among independent signal groups.
- Support/resistance levels are probabilistic decision zones, not guarantees.
- Sentiment provides contextual bias within the broader analytical framework.
1) KGNAI AI Analysis
Region: EUROPE
Total universe size: 1419 ranked instruments
- Daily rank: #492 out of 1419 — Neutral
- Weekly rank: #968 out of 1419 — Neutral
- Monthly rank: #923 out of 1419 — Neutral
- 3-Monthly rank: #498 out of 1419 — Neutral
- 6-Monthly rank: #275 out of 1419 — Bullish
- Yearly rank: #313 out of 1419 — Neutral
Cross-horizon positioning: stability with a mid-cycle improvement
The rank stack for SAF.PA is dominated by Neutral outcomes, but the dispersion across horizons matters. The daily rank (#492) and 3-month rank (#498) sit near the middle of the 1419-instrument universe, consistent with consolidation rather than a strong trend impulse. By contrast, the 6-month rank (#275) is materially stronger (upper tier of the universe), suggesting that the longer swing context has been more constructive even as nearer-term signals softened.
The weak point in the stack is the weekly rank (#968) alongside the monthly rank (#923), both in the lower portion of the universe. This pattern often reflects a regime where intermediate positioning has deteriorated faster than longer-run structure—frequently seen after a pullback that has not yet repaired its momentum profile. Importantly, the yearly rank (#313) remains neutral rather than bearish, which reduces the probability that the instrument is in a broad breakdown regime based solely on KGNAI ranking.
Net: the ranking picture reads as range-bound with time-horizon disagreement—an environment where confirmation tends to come from either (a) technical momentum repairing in the weekly/monthly windows, or (b) a failure at key supports that drags longer-horizon ranks lower. The stated term view remains Neutral across short, mid, and long horizons, consistent with this mixed but not extreme placement.
2) Price & trend overview
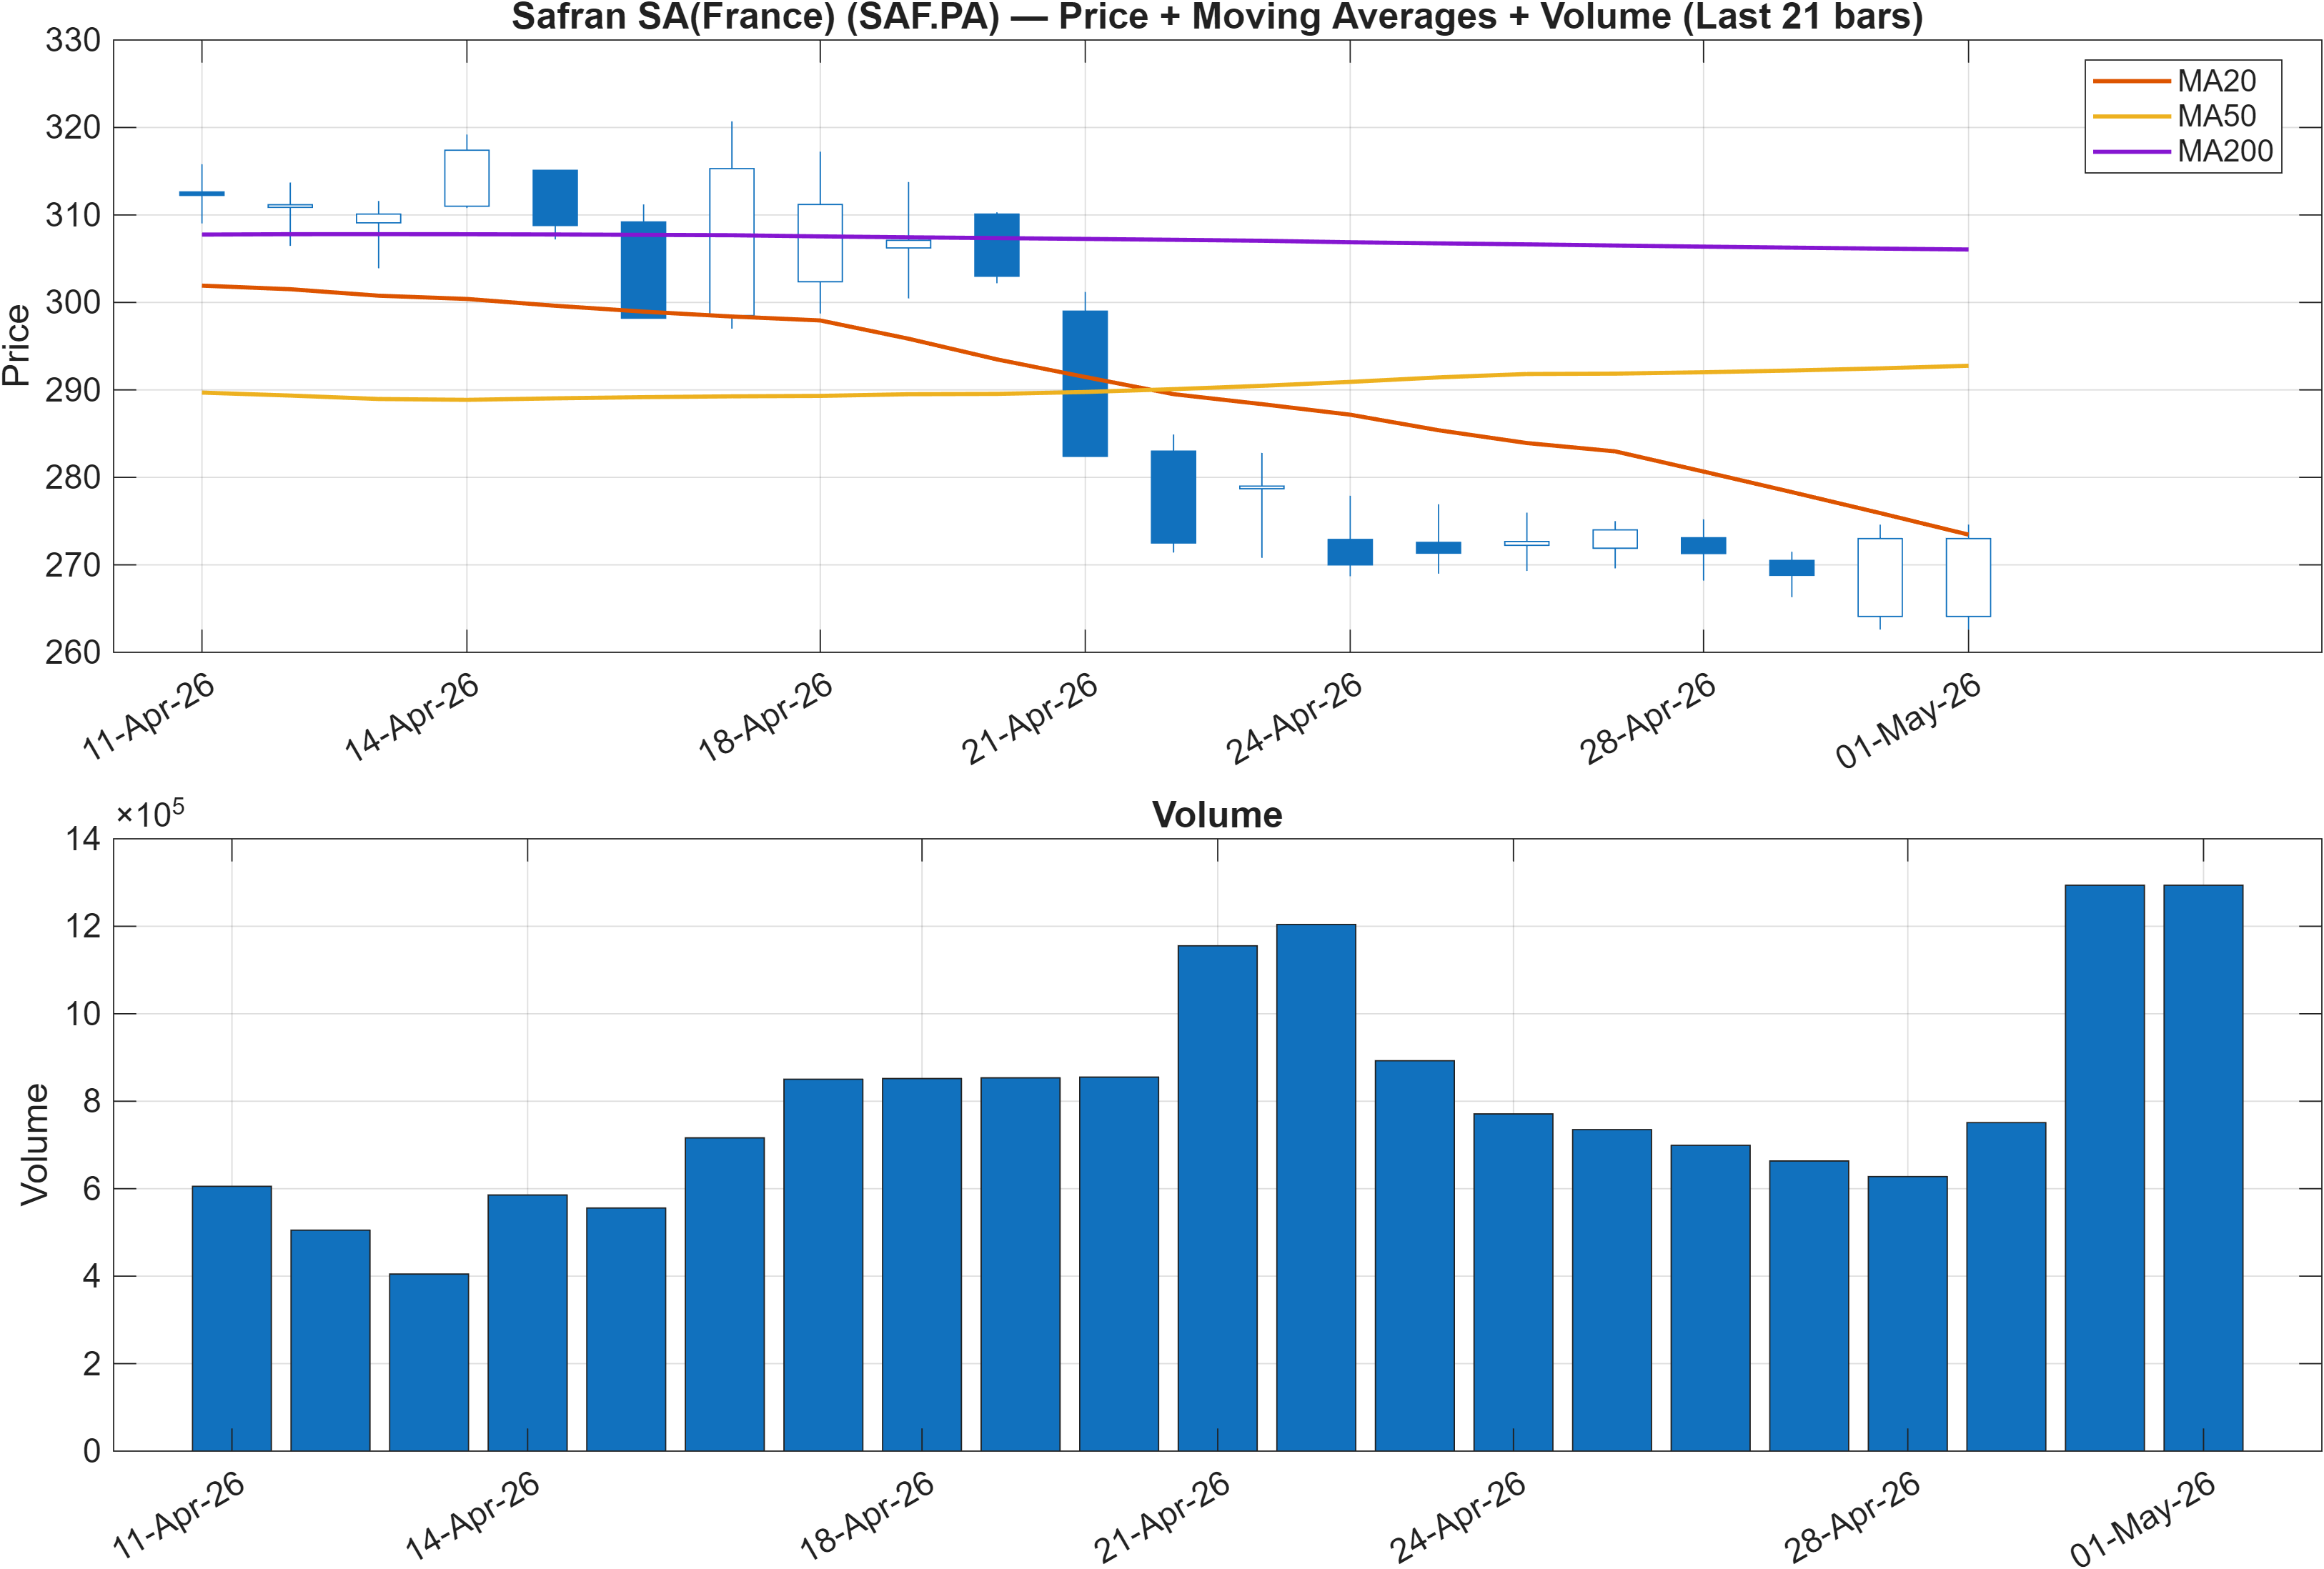
Moving-average structure: defensive trend state despite neutral ranking
The price/trend read is explicitly flagged as bearish on two independent tests: Close vs MA50 = Bearish and MA50 vs MA200 = Bearish. This combination typically signals that recent price action is occurring below a key intermediate trend measure while the medium trend remains below the long trend—an unfavorable structure for momentum-following systems and a common feature of consolidation phases that have a downward tilt.
A notable analytical tension emerges here: ranks are mostly neutral (with a stronger 6-month placement), yet the moving-average stack is bearish. That divergence often appears when the instrument’s longer-cycle relative behavior is still acceptable, but the immediate tape is struggling to regain trend control. In these conditions, the market tends to be more sensitive to level-based triggers than to “trend continuation” narratives, because the system is not currently in a clean uptrend configuration.
From a market-structure perspective, this is consistent with a repair process: the instrument can improve without trending if it compresses volatility and stabilizes above support, allowing MA50 to flatten and eventually regain positive slope. Conversely, if price remains pinned below the MA50 while MA50 stays below MA200, rallies often behave more like mean-reversion moves unless accompanied by confirming breadth/volume dynamics—some of which appear elsewhere in the dashboard. The next sections assess whether momentum and volatility conditions support stabilization or continued pressure.
3) Momentum & volatility dashboard
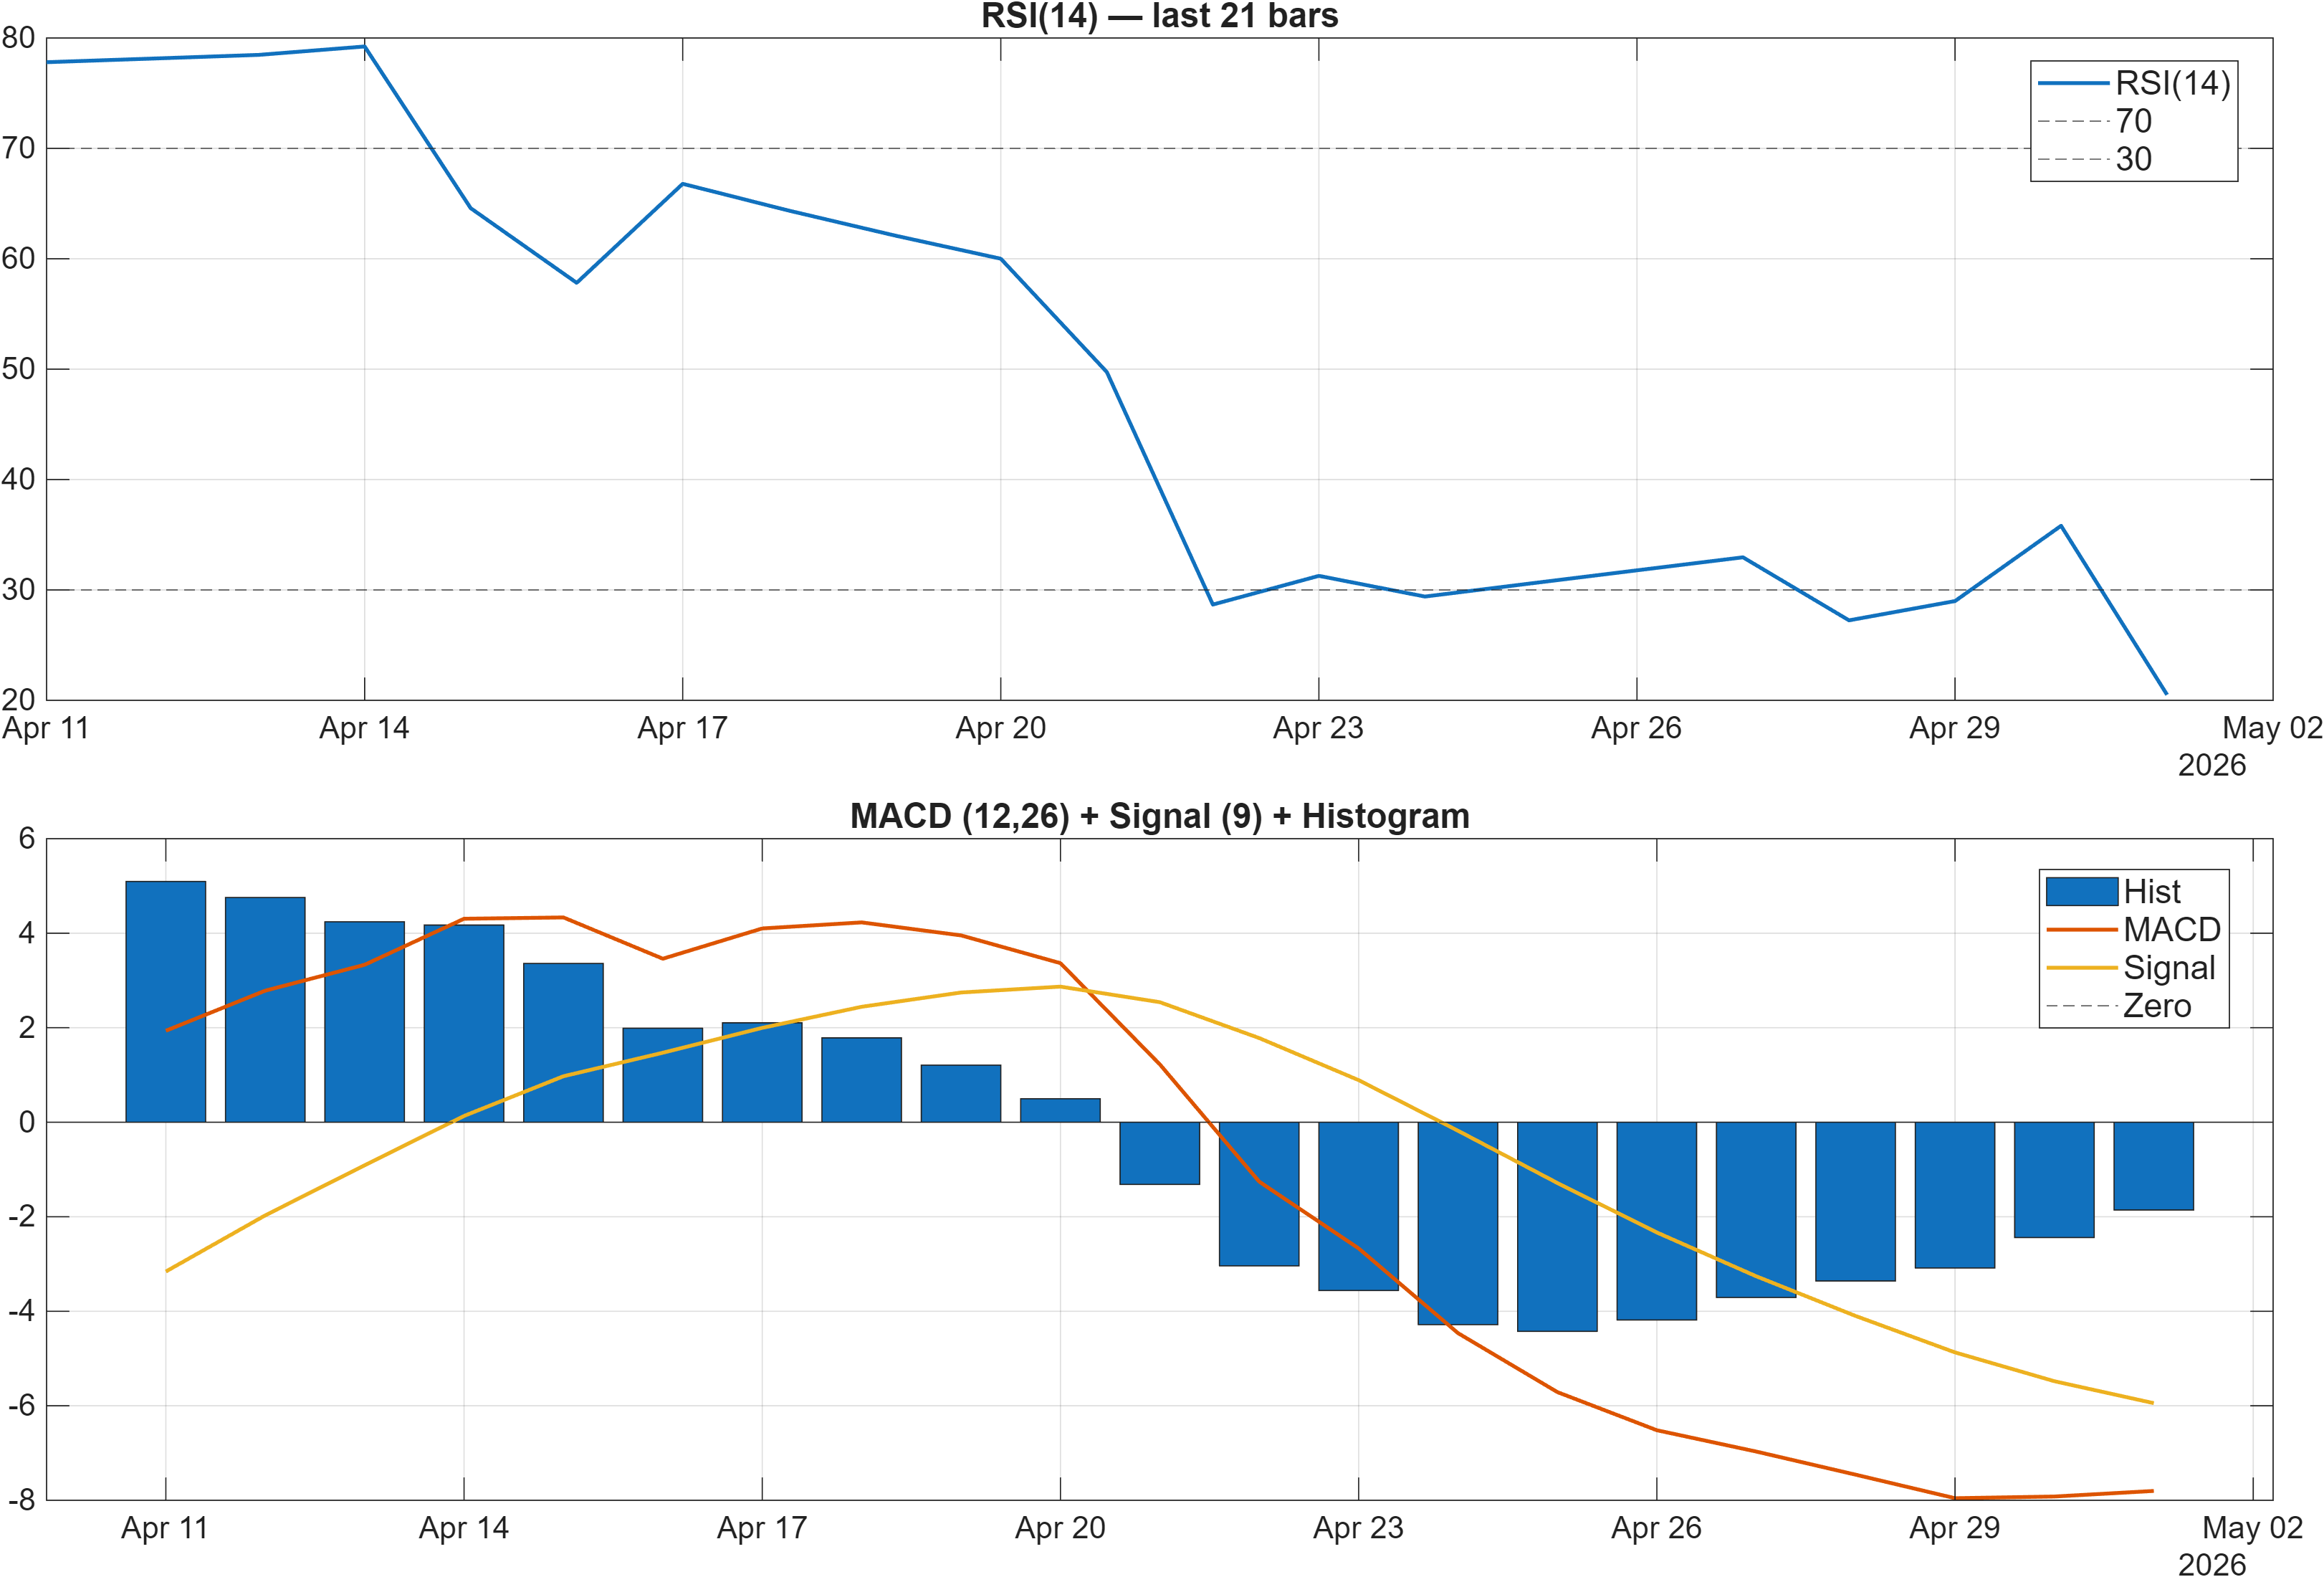
Interpretation: RSI bias = Bearish, MACD hist = -1.8571.
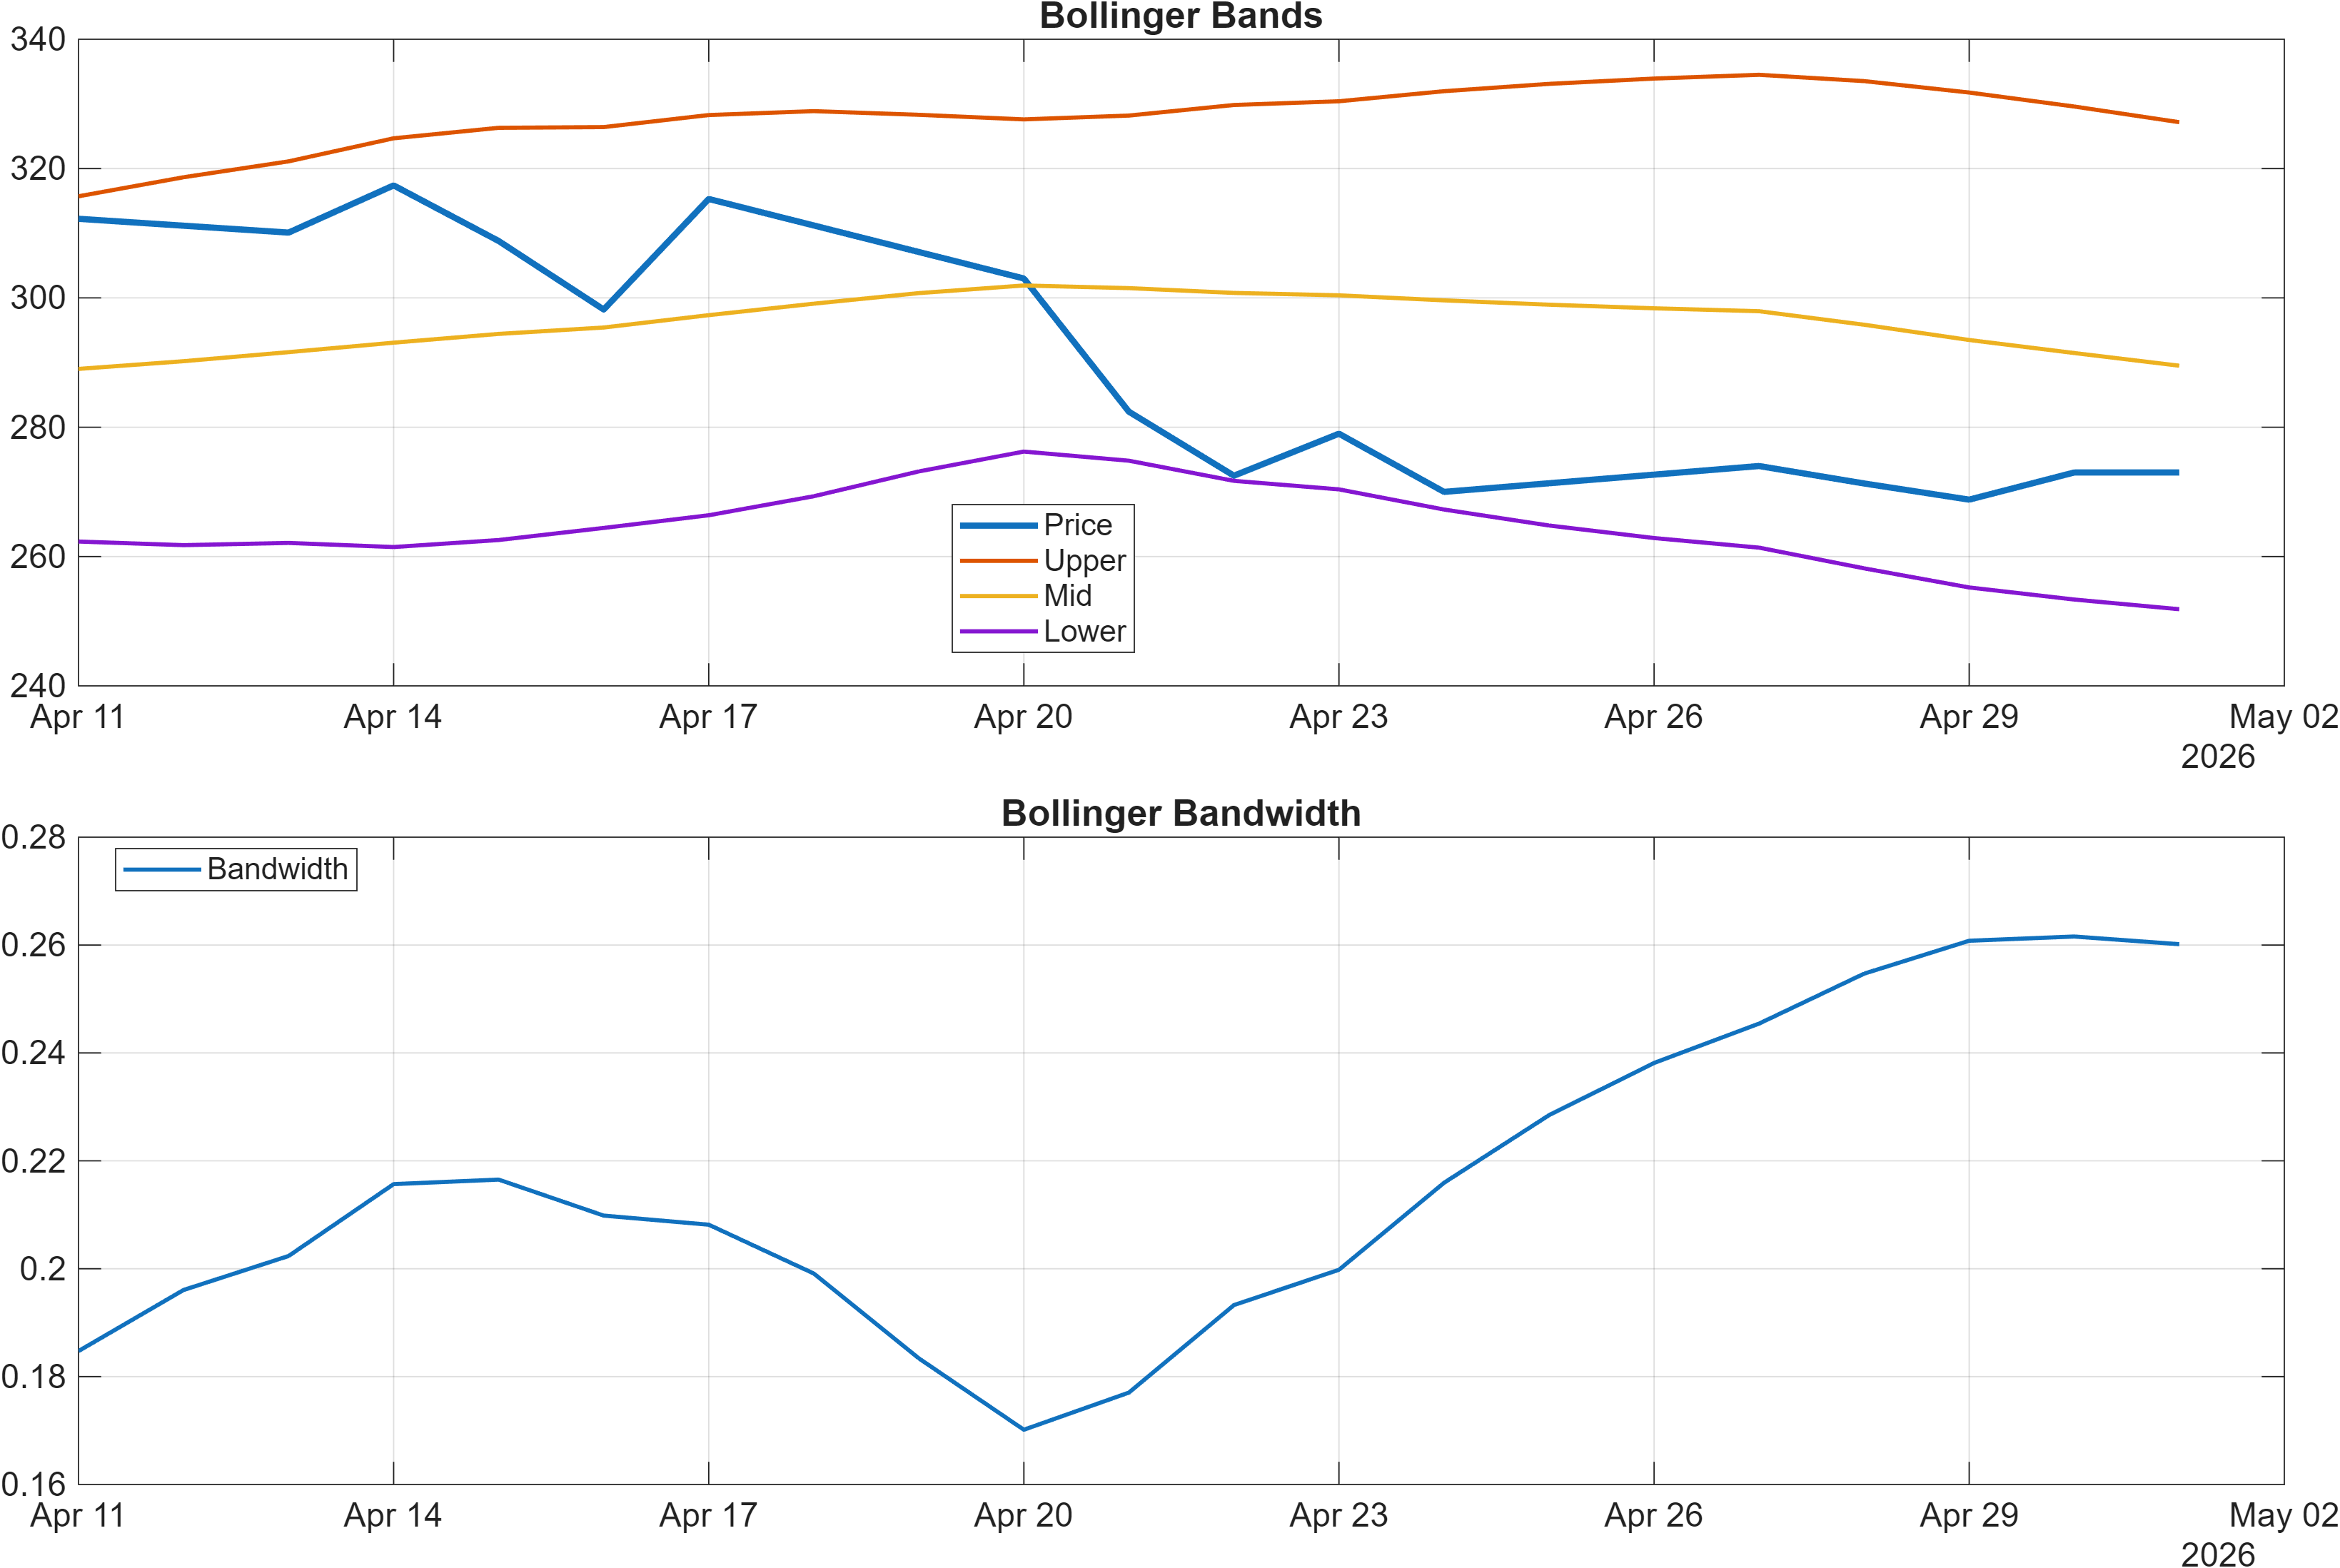
Interpretation: Bandwidth (volatility regime) latest = 0.2602.
Momentum: oversold pressure remains present, but not necessarily persistent
Momentum indicators are leaning bearish, led by RSI(14) at 20.5 and a negative MACD histogram (-1.8571). The RSI reading is notably low, which can coincide with strong downside impulses or late-stage drawdown phases. However, low RSI alone does not define a reversal; it primarily tells that recent returns have been heavily skewed to the downside and that mean-reversion conditions may begin to form if selling pressure fades.
Volatility context adds nuance. Bollinger bandwidth at 0.2602 suggests a defined volatility regime rather than an ultra-tight squeeze; that matters because reversals in wider-band environments often require a cleaner price base before trend signals (like MA50) can repair. When bandwidth is not compressed, the market can remain “noisy,” and momentum oscillators can swing without producing durable direction.
The key analytical question is whether bearish momentum is exhausting or re-accelerating. The broader technical dashboard supports the idea that momentum is currently weak (e.g., ROC and time-series momentum signals later register bearish), yet volume/accumulation measures show offsets. In practice, that combination tends to produce stop-and-go rebounds rather than smooth trend reversals—unless price can reclaim important reference levels and the MACD histogram begins to lift toward zero. Until then, the momentum regime remains defensive even if tactical bounces emerge.
4) Support / Resistance zones
Support ~ 269.1500 | Resistance ~ 320.7833
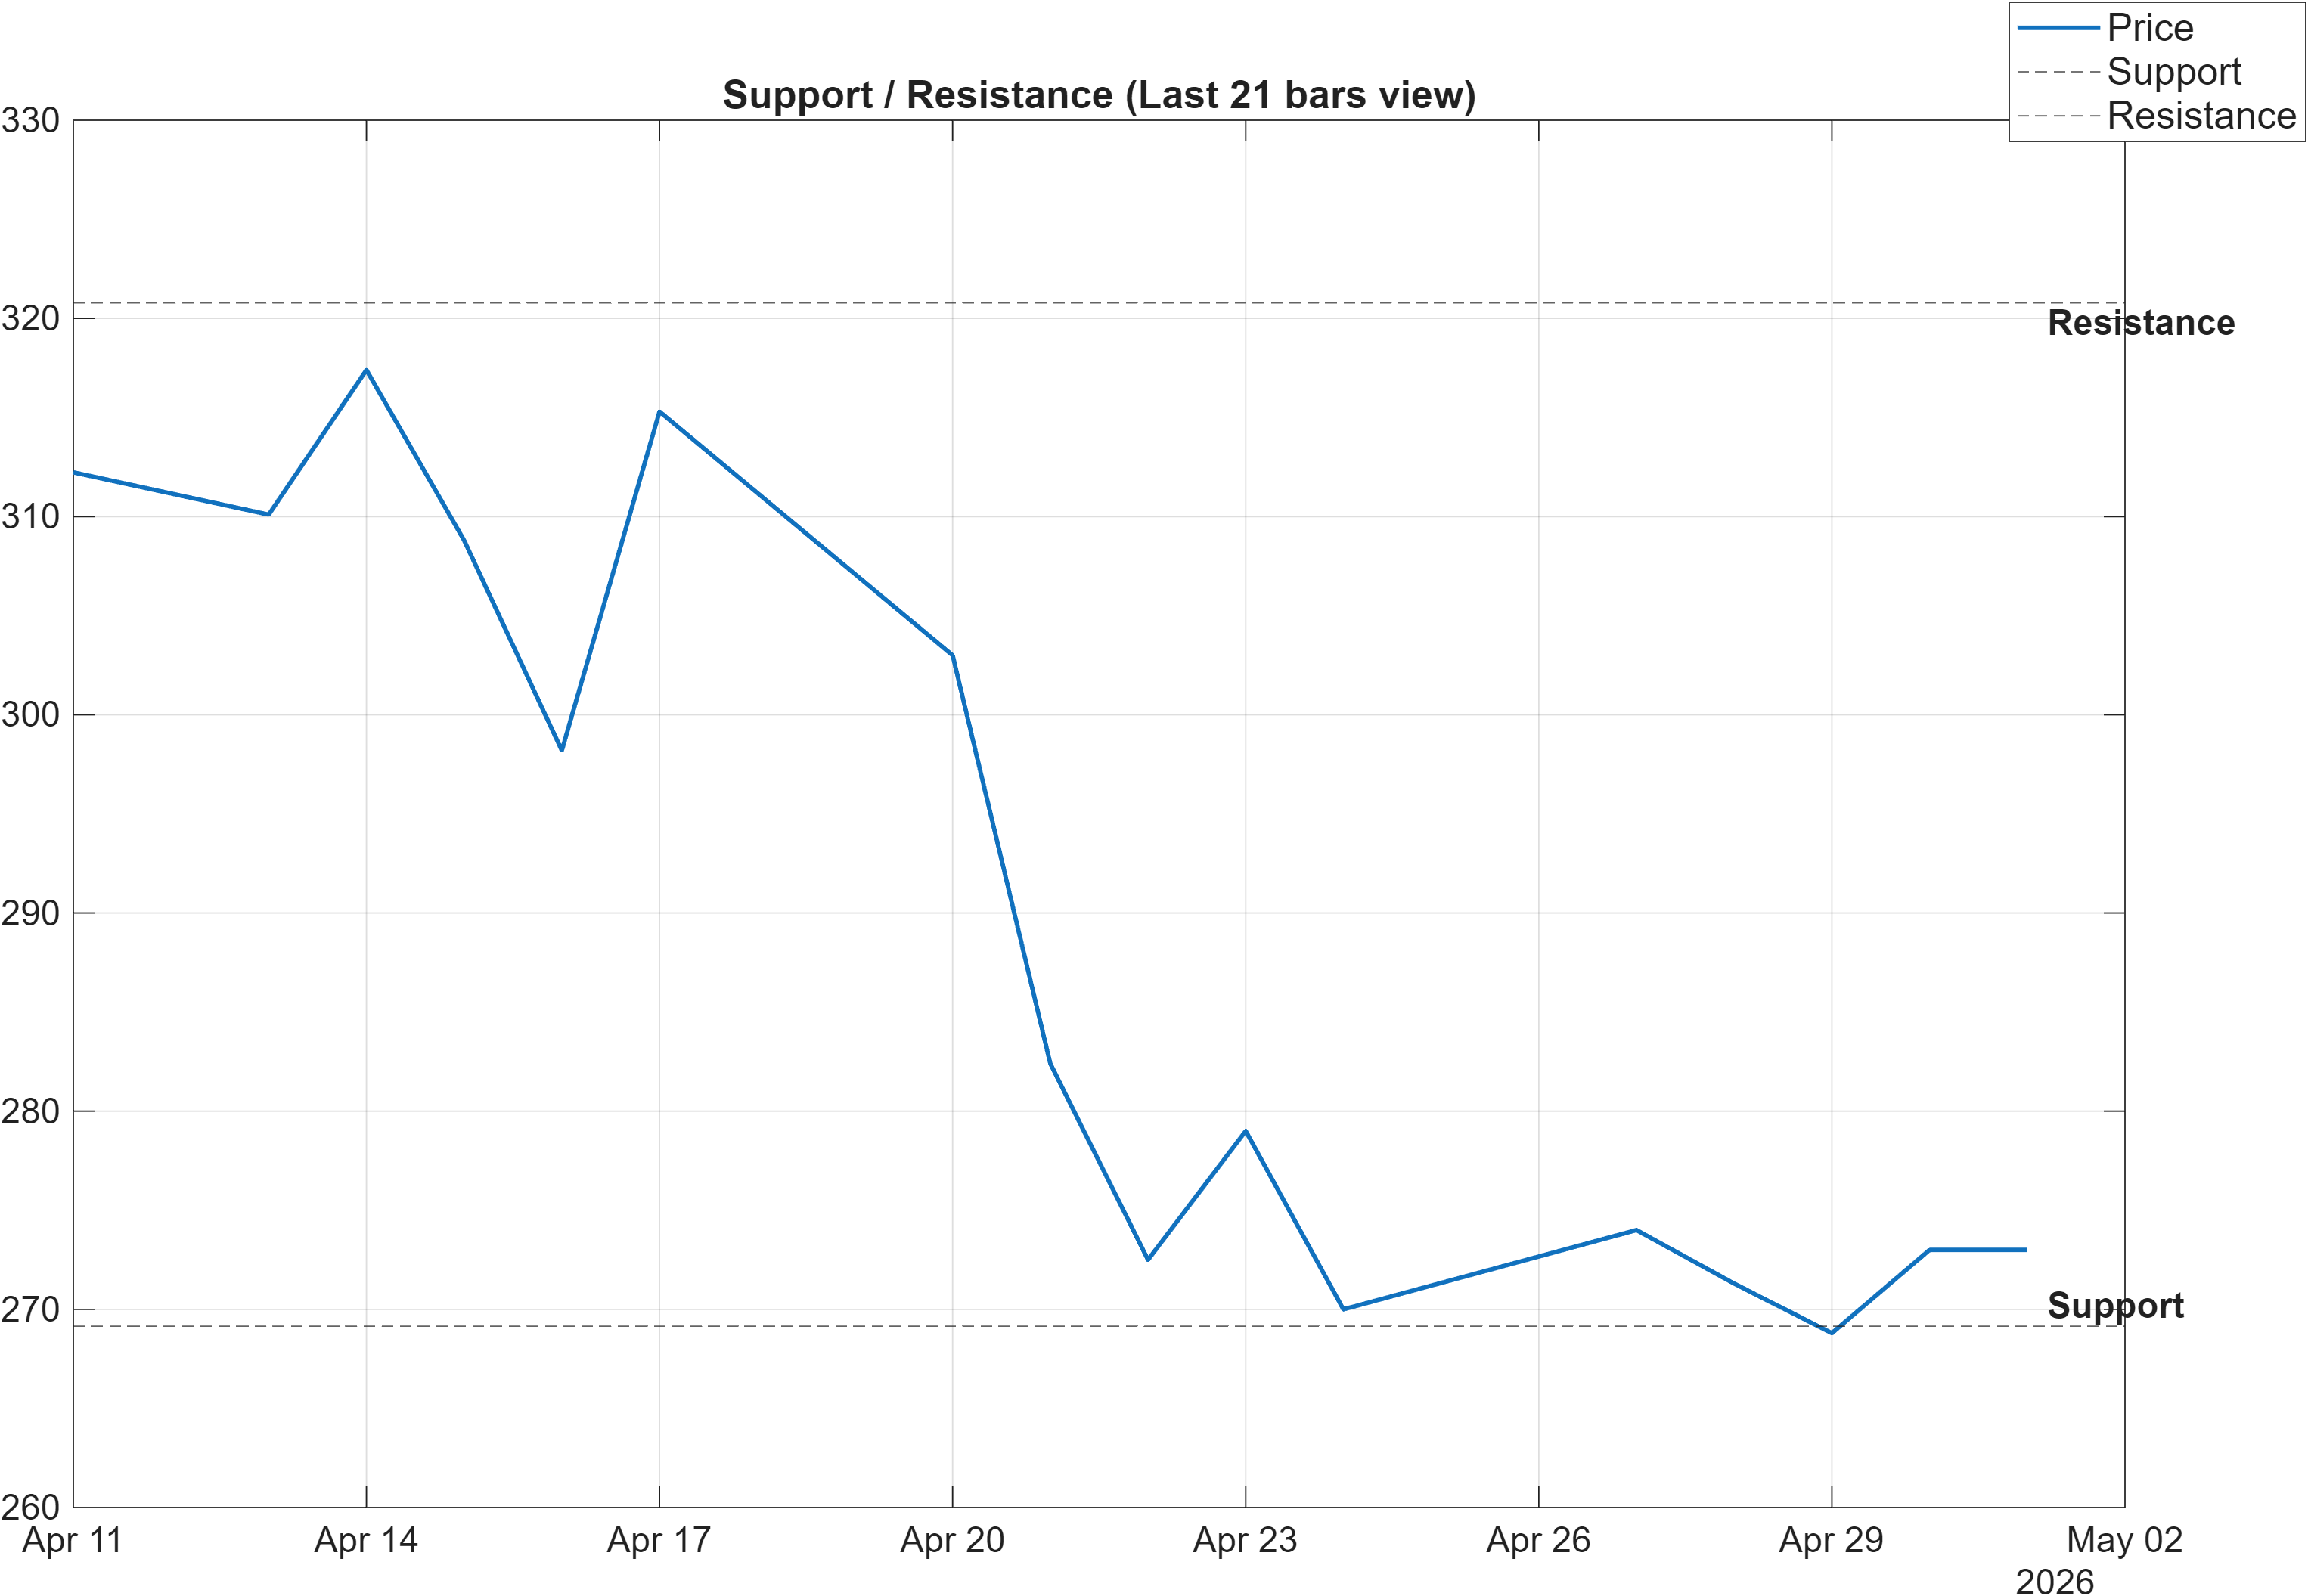
Decision zones: range logic dominates while trend filters remain bearish
With moving-average structure bearish and momentum still pressured, the most reliable framing is currently level-based: 269.1500 is the pivotal downside reference and 320.7833 is the upside boundary that would begin to revalidate continuation risk-on behavior. In consolidations, these zones often operate as liquidity checkpoints where positioning is forced to update—especially when intermediate ranks (weekly/monthly) are weaker than the 6-month view.
The scenario language is asymmetric for a reason. A break above 320.7833 with volume would act as a structural confirmation that buyers are absorbing supply at the upper boundary and that the bearish MA configuration may be starting to unwind. Conversely, a close below 269.1500 would not only weaken price structure, but also likely reinforce the bearish cluster already visible in momentum signals (e.g., RSI bias bearish; MACD histogram negative). That would shift the market from consolidation into a higher-risk deterioration regime.
The technical dashboard later flags MedPx vs Support at -0.55, a reminder that price is positioned uncomfortably relative to the defined support framework rather than comfortably above it. In such cases, risk management tends to be dictated by how price behaves around support (stabilization and higher lows) rather than by one-off intraday breaches. The market is effectively asking for confirmation through either reclaiming resistance or defending support decisively.
5) Quant Technical Dashboard (18 Signals)
KGNAI AI Technical Analysis Score (Deep Reinforcement Learning): Rank #538 out of 1419 (Rank 1 represents the strongest technical positioning and a higher probability of favorable price behavior. As ranks increase toward the maximum, the probability of favorable outcomes weakens and bearish positioning becomes more dominant.) | Label: Neutral | Score: 0.242
18-Signal Technical Confluence Score: -0.111 (Neutral)
Overall Technical Score (18-signal confluence + DRL rank blend): -0.005 (Neutral)
Note: The blended score reflects signal strength weighted against broader AI technical ranking, which may temporarily diverge.
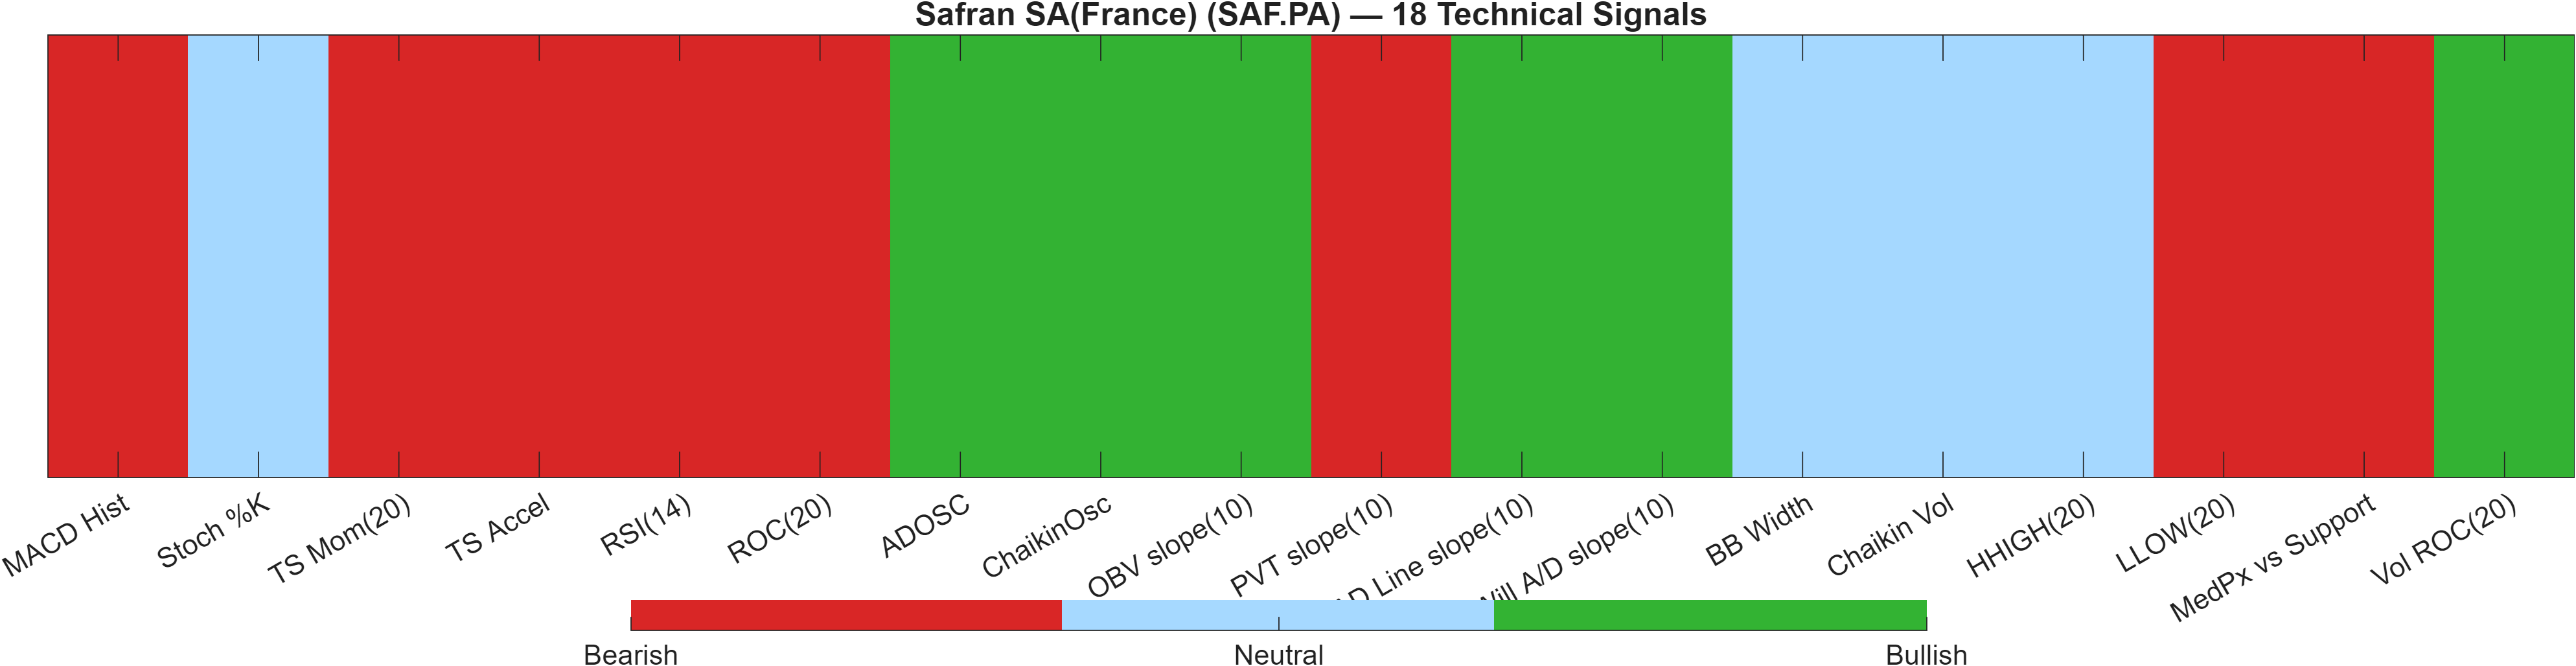
Blended technical score breakdown: -0.005 (Neutral | Bull 6 / Bear 8 / Neutral 4)
Signal interaction: bearish momentum cluster vs bullish accumulation offsets
The dashboard is best understood as a neutral aggregate produced by opposing clusters. On the bearish side, momentum and rate-of-change measures are clearly negative: TS Mom(20) at -38.17, TS Accel at -67.23, and ROC(20) at -12.27 align with the weak RSI and negative MACD histogram. This grouping is consistent with a tape that has recently been under persistent pressure and is still working through the aftermath.
Offsetting that, several volume/accumulation proxies register bullish: ADOSC at 87.08, OBV slope(10) at 9.301e+05, and AD Line slope(10) at 6.852e+05. When accumulation signals improve while momentum remains weak, the market often transitions into a base-building or distribution-to-accumulation test. It does not guarantee upside, but it reduces the likelihood that the instrument is in a purely one-directional sell regime.
Volatility signals are largely neutral (e.g., BB Width 0.2602 marked neutral), which fits a consolidation framework rather than an expanding-trend state. The DRL technical rank at #538 with score 0.242 also lands in the neutral zone, reinforcing that the system is not observing broad, consistent technical dominance in either direction. Overall, the confluence -0.111 and blended -0.005 read as a market that is internally conflicted: bearish momentum remains the primary headwind, but improving accumulation is the main stabilizer that could matter if price begins reclaiming higher reference levels.
Signal table (Bull/Bear/Neutral)
| Indicator | Value | Signal |
|---|---|---|
| MACD Hist | -1.857 | Bearish |
| Stoch %K | 46.64 | Neutral |
| TS Mom(20) | -38.17 | Bearish |
| TS Accel | -67.23 | Bearish |
| RSI(14) | 20.5 | Bearish |
| ROC(20) | -12.27 | Bearish |
| ADOSC | 87.08 | Bullish |
| ChaikinOsc | 3.657e+05 | Bullish |
| OBV slope(10) | 9.301e+05 | Bullish |
| PVT slope(10) | -2.837e+04 | Bearish |
| AD Line slope(10) | 6.852e+05 | Bullish |
| Will A/D slope(10) | 0.7 | Bullish |
| BB Width | 0.2602 | Neutral |
| Chaikin Vol | -27.22 | Neutral |
| HHIGH(20) | 320.7 | Neutral |
| LLOW(20) | 262.6 | Bearish |
| MedPx vs Support | -0.55 | Bearish |
| Vol ROC(20) | 156.1 | Bullish |
Interpretation: Indicator-level signals form the base confluence, which is then adjusted using a separate AI-driven technical ranking model. The final technical score summarizes this combined view.
6) News sentiment + extractive gist
Sentiment score (avg): 0.042 | Positive: 25% | Neutral: 50% | Negative: 25%
KGNAI AI News Sentiment Score (normalized -1 to +1): 1.00 (as of 2026-04-24) | Label: Bullish | Overall news score: 0.93
Positive Developments
Recent coverage across major financial outlets indicates a constructive tone around Safran’s positioning after a pullback, with commentary frequently framed as valuation and “reset” discussion rather than a fundamental shock narrative. In the KGNAI readout, this is consistent with the bullish normalized sentiment score (1.00) despite the overall distribution still being balanced. Mentions highlight the stock’s longer-run performance context and focus on whether recent weakness has improved entry conditions. From an analytics standpoint, that type of discourse tends to coincide with a market probing for a base—particularly when accumulation-style indicators in the technical stack are improving while momentum remains pressured. The takeaway is not directional certainty; rather, sentiment is not amplifying downside risk at the margin, which can matter when price is operating near key levels like 269.1500 support and when upside validation remains tied to 320.7833 resistance.
Neutral / Mixed Developments
A significant portion of the news flow is informational and comparative—discussing share-price behavior across multiple horizons and how market pricing may be interpreting current conditions. This aligns with the avg sentiment score (0.042) and the 50% neutral share in the sentiment split, implying that the information set is not uniformly supportive. In market terms, that neutrality often shows up during consolidations where participants debate whether a drawdown is a temporary dislocation or a more durable regime shift. This matches the technical profile: overall confluence is -0.111 (Neutral) and the blended score is -0.005 (Neutral), signaling that the system is still waiting for cleaner confirmation from price structure and momentum repairs.
Negative / Risk Signals
Risk-oriented commentary focuses on the recent pullback and the possibility that sector-wide pressure or macro-sensitive sentiment can weigh on aerospace/defense-linked names. While the KGNAI news label is bullish on a normalized basis, the presence of 25% negative items reinforces that the narrative is not one-sided and that drawdown sensitivity remains elevated. This matters because technical momentum is already defensive—RSI(14) at 20.5 and MACD histogram at -1.8571—so negative news can have outsized impact when the tape is fragile and moving-average structure is bearish. In this context, the most practical risk signal is not the storyflow itself but whether it coincides with a loss of technical footing, particularly a failure around 269.1500 support or renewed volatility expansion beyond the current 0.2602 bandwidth regime.
- What to monitor next: Price acceptance above 320.7833 alongside improving momentum (MACD histogram lifting toward zero).
- What to monitor next: Stability around 269.1500 given the bearish “MedPx vs Support” reading (-0.55).
- What to monitor next: Whether bullish accumulation signals (e.g., ADOSC 87.08) persist if volatility changes from the current 0.2602 regime.
Sources referenced: Reuters, Bloomberg, Yahoo Finance, MarketWatch, Investing.com
7) Sources
Not available in the provided data.
You may also like: How KGNAI AI ranks instruments across global markets
Disclaimer: KGNAI provides AI-generated analytics and educational market commentary only. This is not financial advice. Markets involve risk. Always do your own research.