
AO.LSE (AO World(UK)) — 04-Mar-2026 Technical & Rank Read: Weak Momentum Remains the Control Variable
AO World(UK) (AO.LSE) currently sits in a weaker cross-sectional position within KGNAI’s Europe universe (1,425 instruments), with bearish bias dominating mid- and long-horizon ranks. Price structure is also aligned with that weakness: the close remains below the 50-day average and the 50-day remains below the 200-day, a configuration that typically reflects persistent trend pressure rather than a single-session dislocation. Momentum signals reinforce the same message—RSI(14) at 32.38 is still bearish-leaning, while the MACD histogram at -0.1542 implies downside momentum remains present even if the rate of decline can fluctuate. Volatility is not signaling panic; Bollinger Bandwidth near 0.0746 points to a relatively contained regime, which can allow trends to persist longer than expected. Key decision zones remain clearly defined at 96.8667 (support) and 114.3000 (resistance).
- Rank stance: Short Neutral-to-Bearish | Mid Bearish | Long Bearish
- Technical confluence: 18-signal confluence is Neutral, but the blended overall technical score is Bearish
- Key levels: Support ~ 96.8667 | Resistance ~ 114.3000
- News sentiment bias: Slightly positive/neutral mix (avg 0.052), while the normalized model score is Bullish
- Confirmation / invalidation: A sustained push above 114.3000 with volume would improve continuation odds; a close below 96.8667 increases deterioration risk per the provided scenario framing.
KGNAI evaluates assets using large cross-sectional datasets built from millions of structured data points. Inputs incorporate fundamental metrics, technical structures, and systematically processed news sentiment. Statistical models, machine learning, and AI frameworks are used to assess relative positioning, signal alignment, and probabilistic behavior across broad universes.
- Ranks are comparative across the tracked universe, not absolute price targets.
- Confluence reflects alignment among independent signal groups.
- Support/resistance levels are probabilistic decision zones, not guarantees.
- Sentiment provides contextual bias within the broader analytical framework.
1) KGNAI AI Analysis
Region: EUROPE
Total universe size: 1425 ranked instruments
- Daily rank: #1042 out of 1425 — Neutral
- Weekly rank: #1161 out of 1425 — Bearish
- Monthly rank: #1276 out of 1425 — Bearish
- 3-Monthly rank: #956 out of 1425 — Neutral
- 6-Monthly rank: #1288 out of 1425 — Bearish
- Yearly rank: #1273 out of 1425 — Bearish
Across horizons, AO.LSE screens as a lower-third candidate in the tracked universe rather than a relative leader. The monthly rank at #1276 and the 6-month rank at #1288 sit deep in the distribution, consistent with sustained weakness in the behavior that KGNAI’s cross-sectional tests typically reward. While the daily rank is only Neutral at #1042, this is better read as a short-horizon stabilization attempt rather than a completed regime shift, particularly since the weekly rank remains #1161 (Bearish).
The time-horizon pattern matters: the 3-month rank at #956 (Neutral) is less negative than the 6-month and yearly readings (#1273, Bearish), indicating that the most severe relative weakness is not uniformly increasing at every horizon. That said, the combined short/mid/long view in the provided snapshot remains Bearish, implying that any improvement has not been strong enough to flip the broader probability-weighted profile.
From a market-structure perspective, this type of configuration often coincides with risk premia staying elevated: short-term bounces can occur, but they tend to require cleaner confirmation from independent technical groups before the ranking complex improves materially. In this report, later sections show that indicator-level confluence is not decisively bullish and the blended technical score is still negative, which is consistent with the rank stack remaining heavy.
2) Price & trend overview
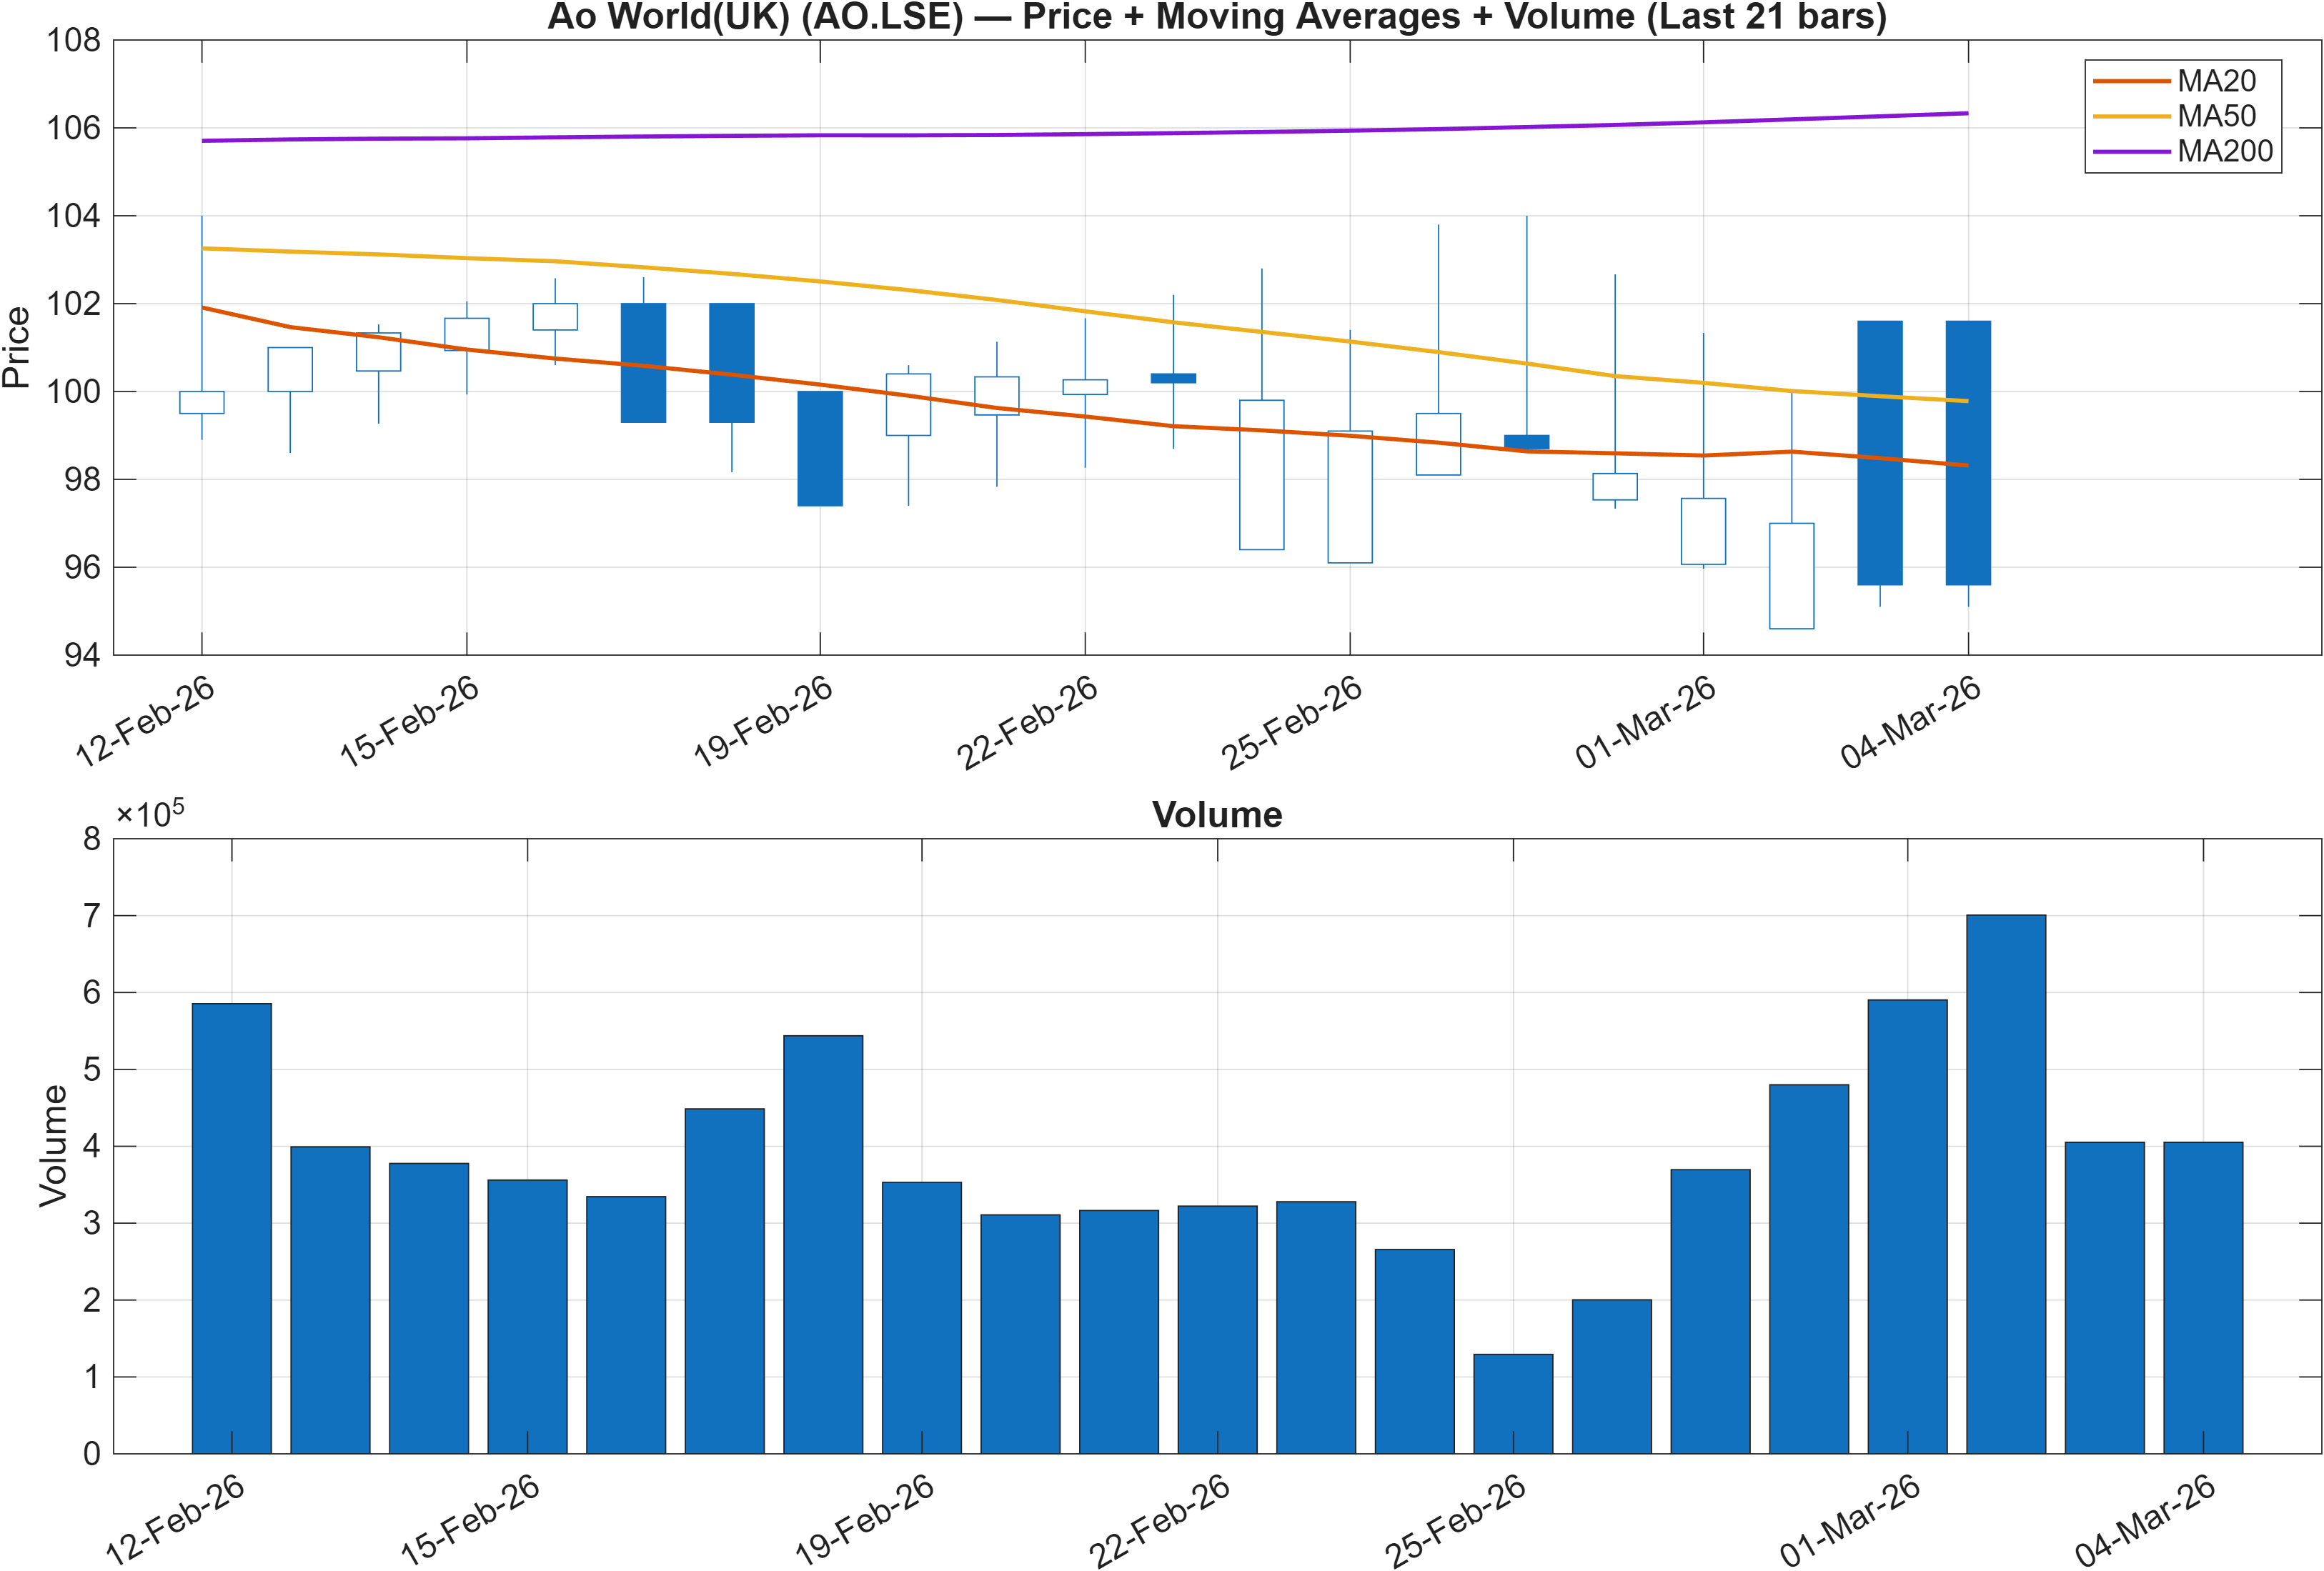
Interpretation: Close vs MA50 = Bearish, MA50 vs MA200 = Bearish.
Trend state: persistence favored over reversal without confirmation
The moving-average configuration is unambiguous: the close is below the MA50 and the MA50 is below the MA200. This structure tends to describe a market where rallies often meet supply earlier than expected, because multiple participant groups (trend-followers, systematic allocators, and discretionary risk managers) anchor decisions around the same slope hierarchy. In that context, a single positive session typically has limited informational value unless it is followed by additional confirmation.
The rank stack reinforces that reading. A monthly rank of #1276 and a yearly rank of #1273 suggest that the prevailing trend condition is not merely a short-term fluctuation; it is embedded in longer-horizon relative behavior. When long-horizon ranks are this weak, price is often required to do more work—either through time (base-building) or through a sharper displacement—before trend metrics improve.
Importantly, the report’s volatility read (Bollinger Bandwidth latest 0.0746) does not indicate an unusually explosive regime. Lower-to-moderate bandwidth can allow a bearish trend to grind rather than capitulate, which can keep moving averages in bearish alignment for longer. That interplay—bearish trend structure plus contained volatility—often leads to range-bound rallies that fail to clear key resistance until participation broadens.
3) Momentum & volatility dashboard
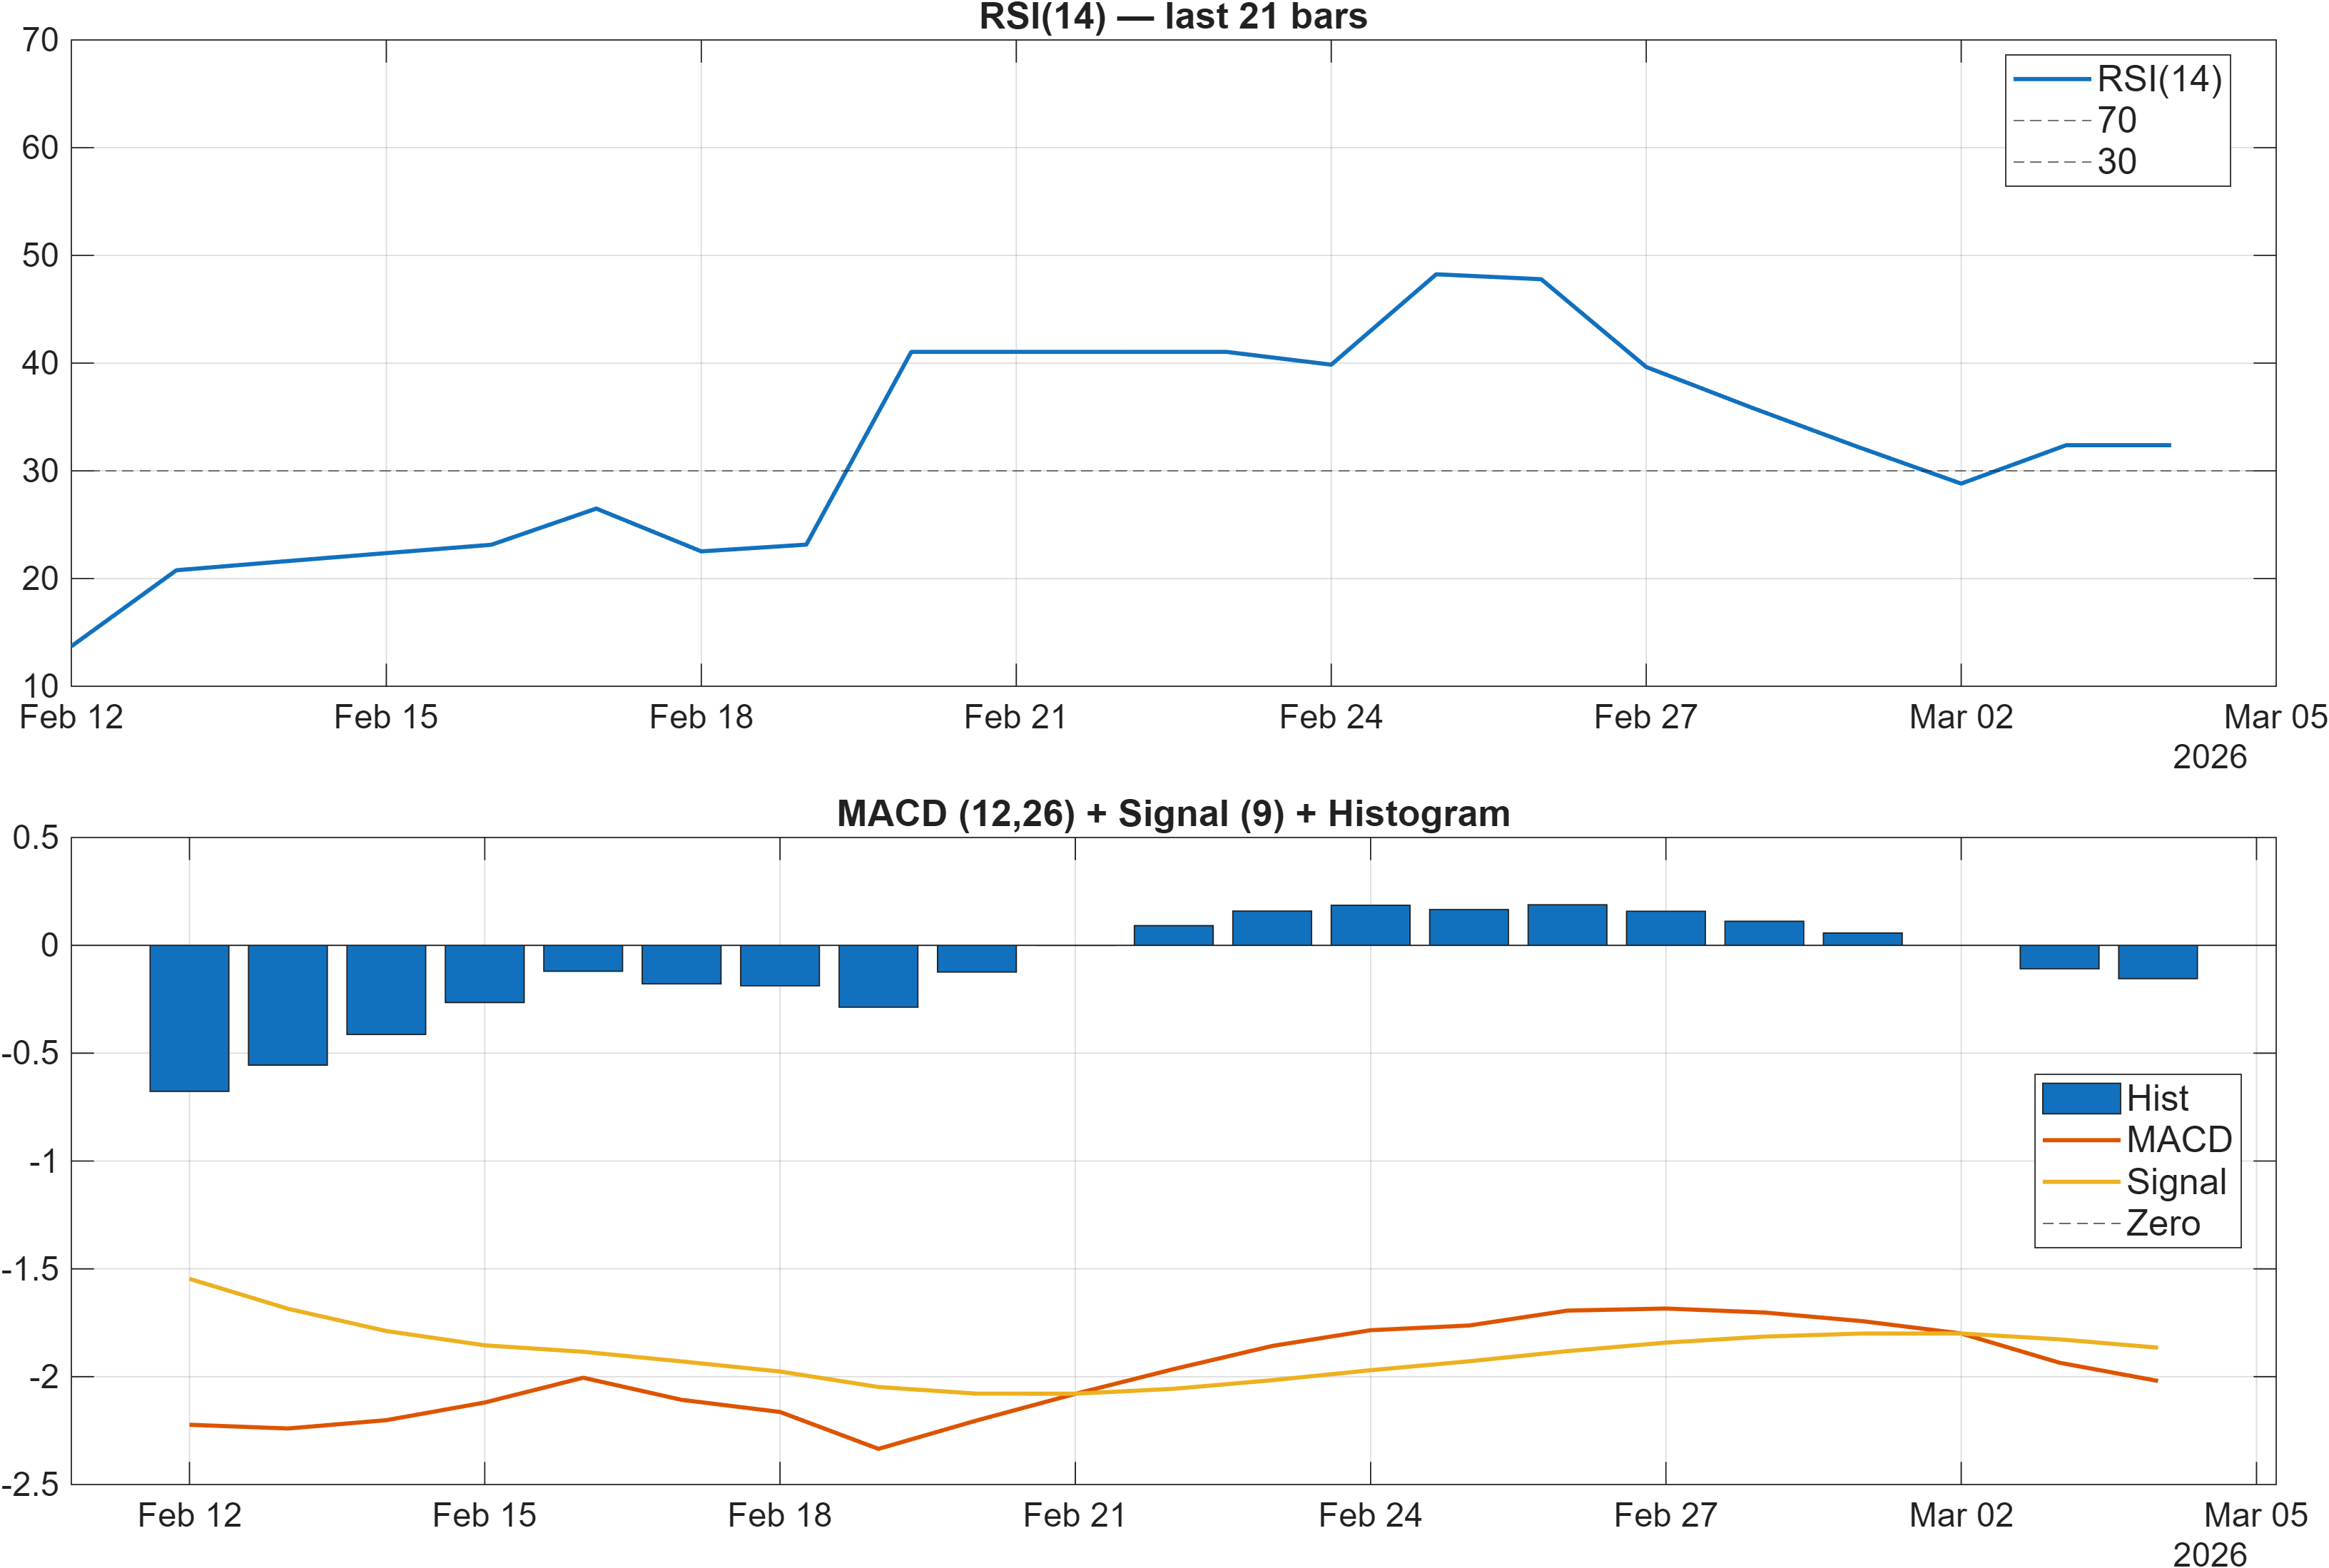
Interpretation: RSI bias = Bearish, MACD hist = -0.1542.
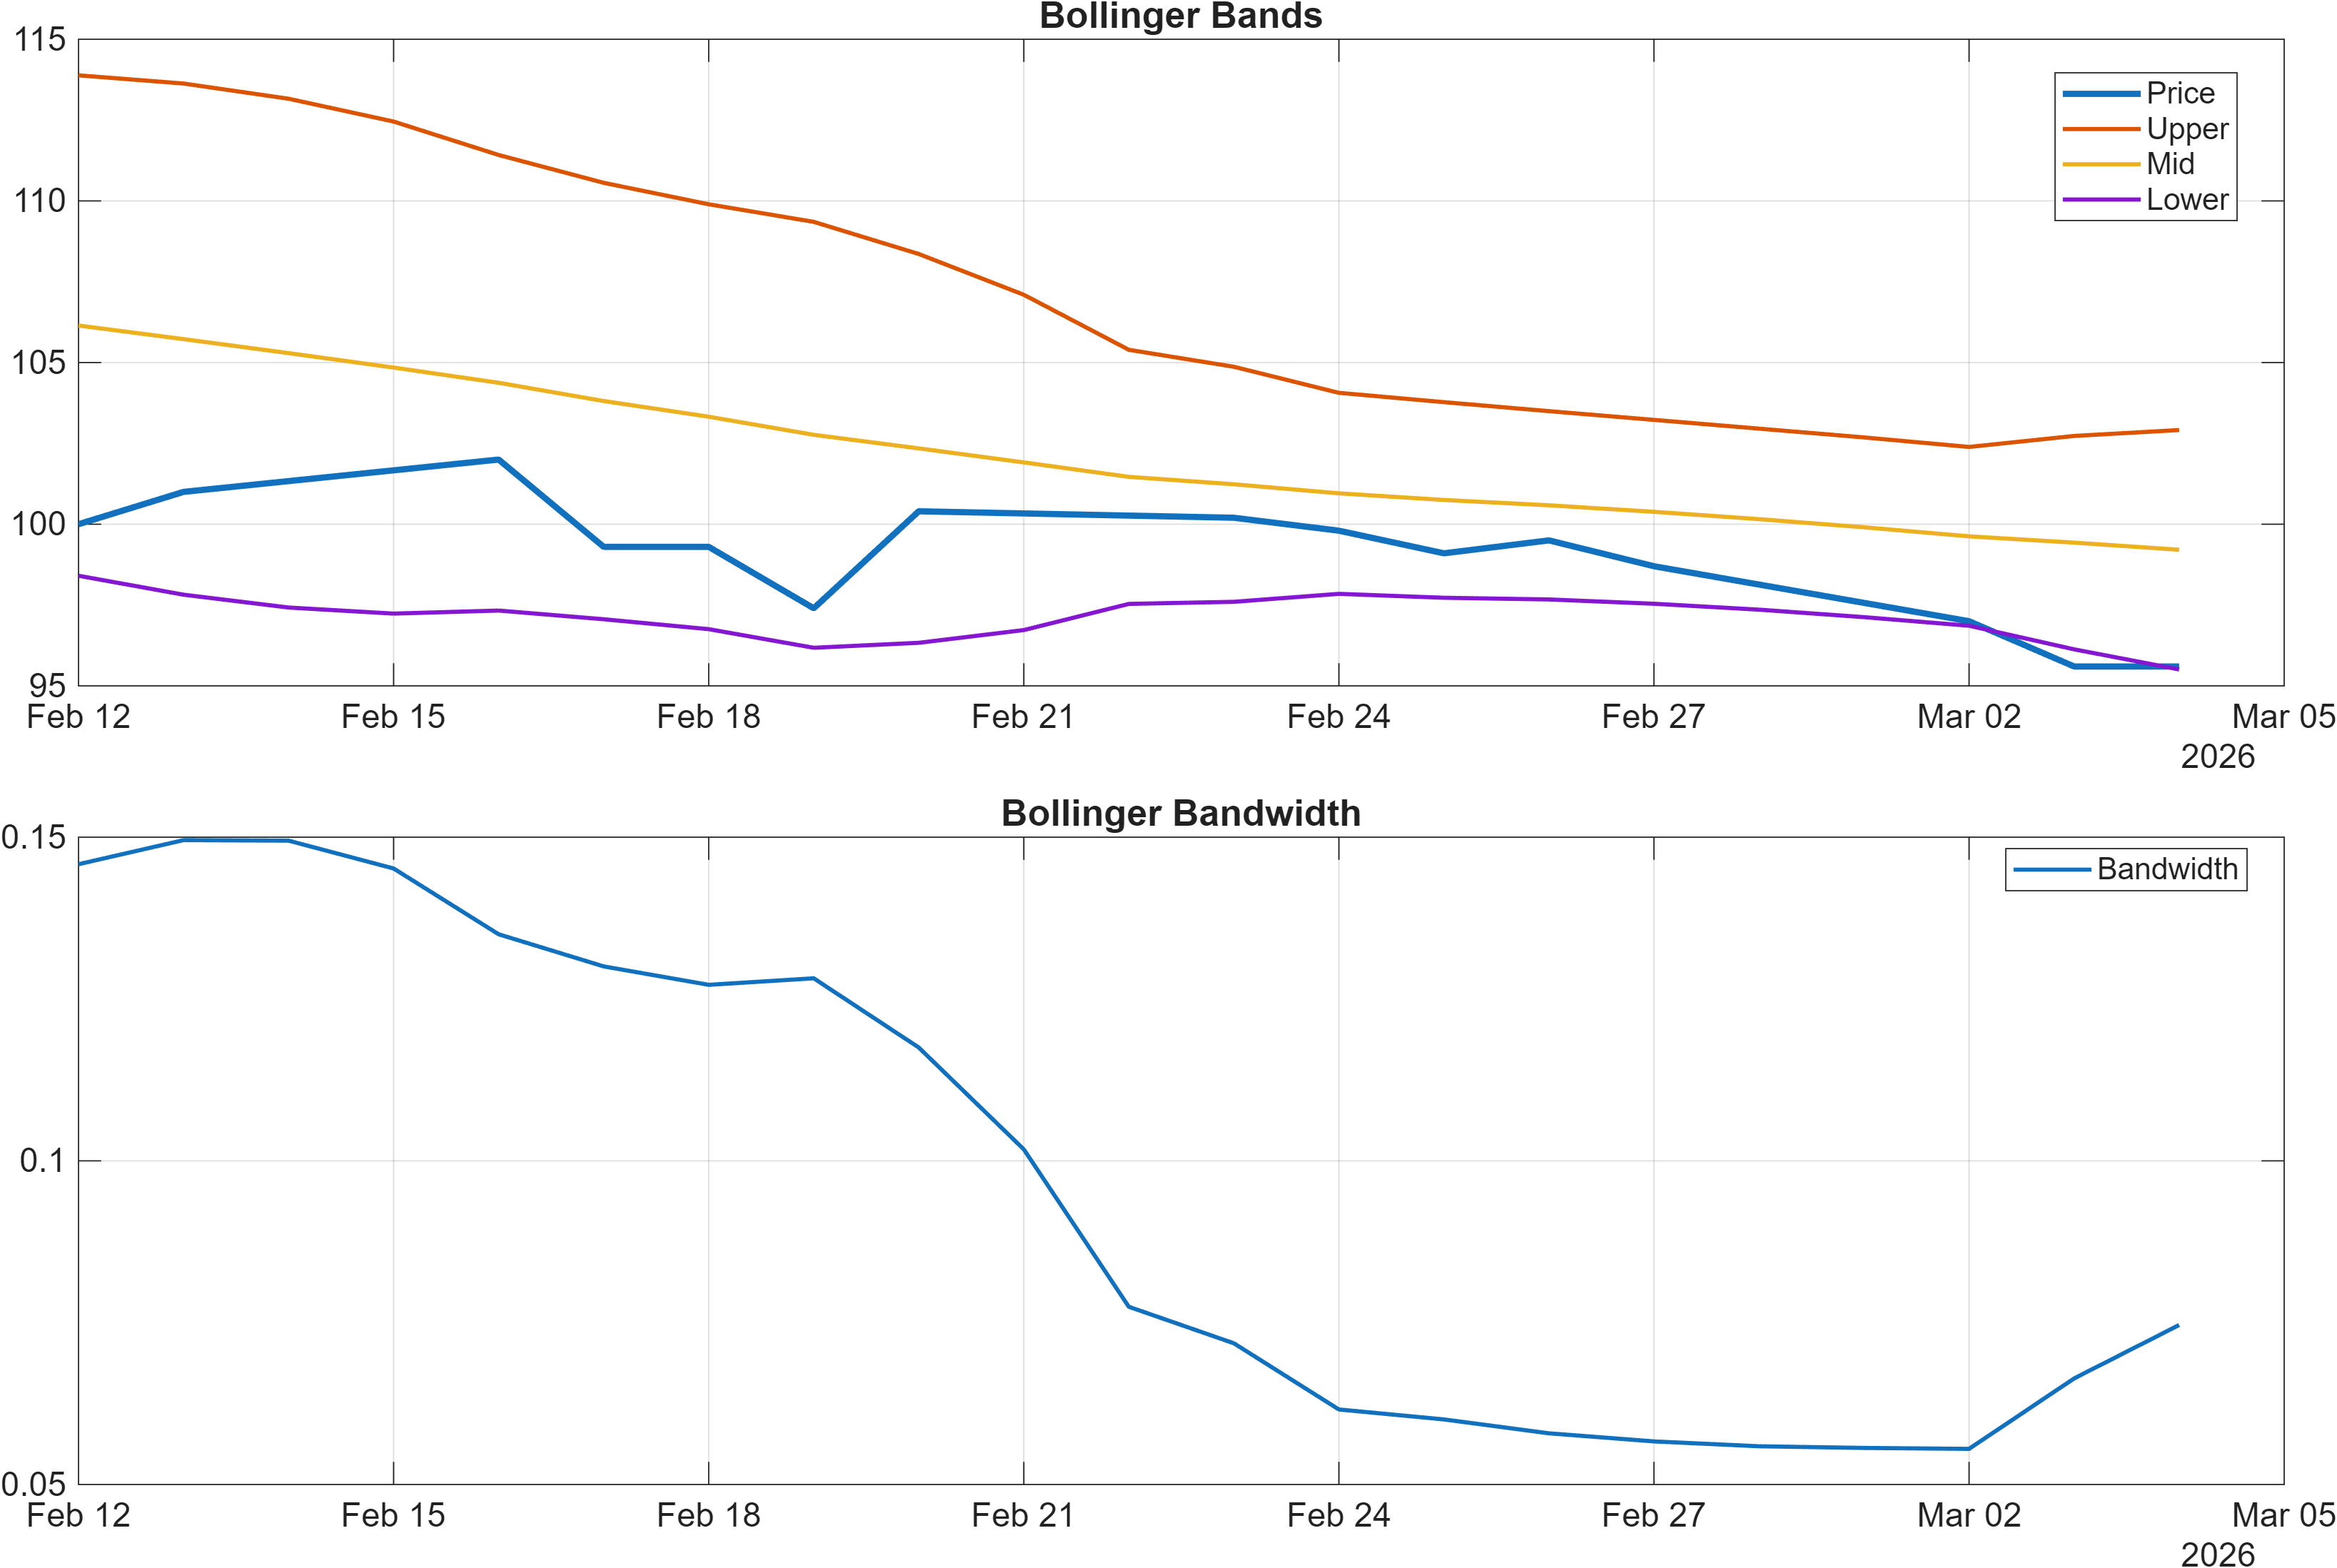
Interpretation: Bandwidth (volatility regime) latest = 0.0746.
Momentum: bearish bias, but watch for “stabilization without trend change”
The momentum complex is tilted bearish. RSI(14) at 32.38 is consistent with a market that remains closer to downside pressure than mean-reversion strength, and the MACD histogram at -0.1542 indicates negative momentum is still present in the trend/momentum composite. In combination with the bearish moving-average stack, this profile typically aligns with sell-the-rally behavior until proven otherwise.
At the same time, not all momentum components are equally weak in the broader signal set. In the 18-signal table, Stoch %K is 10.64 and labeled Bullish, which often appears when price is stretched on a short lookback even as the primary trend remains down. That kind of “oversold inside a downtrend” condition can support tactical bounces, but it is not, by itself, a regime signal.
Volatility adds a separate lens. With Bollinger Bandwidth near 0.0746, the market is not displaying a high-energy expansion phase. When volatility is contained while momentum is negative, reversals commonly require a clearer catalyst in price action—typically a reclaim of key levels—because the underlying range dynamics can keep RSI suppressed and MACD negative for extended periods. This is one reason the support/resistance framing in the next section is critical: it offers concrete zones to validate whether momentum is merely stretched or actually transitioning.
4) Support / Resistance zones
Support ~ 96.8667 | Resistance ~ 114.3000
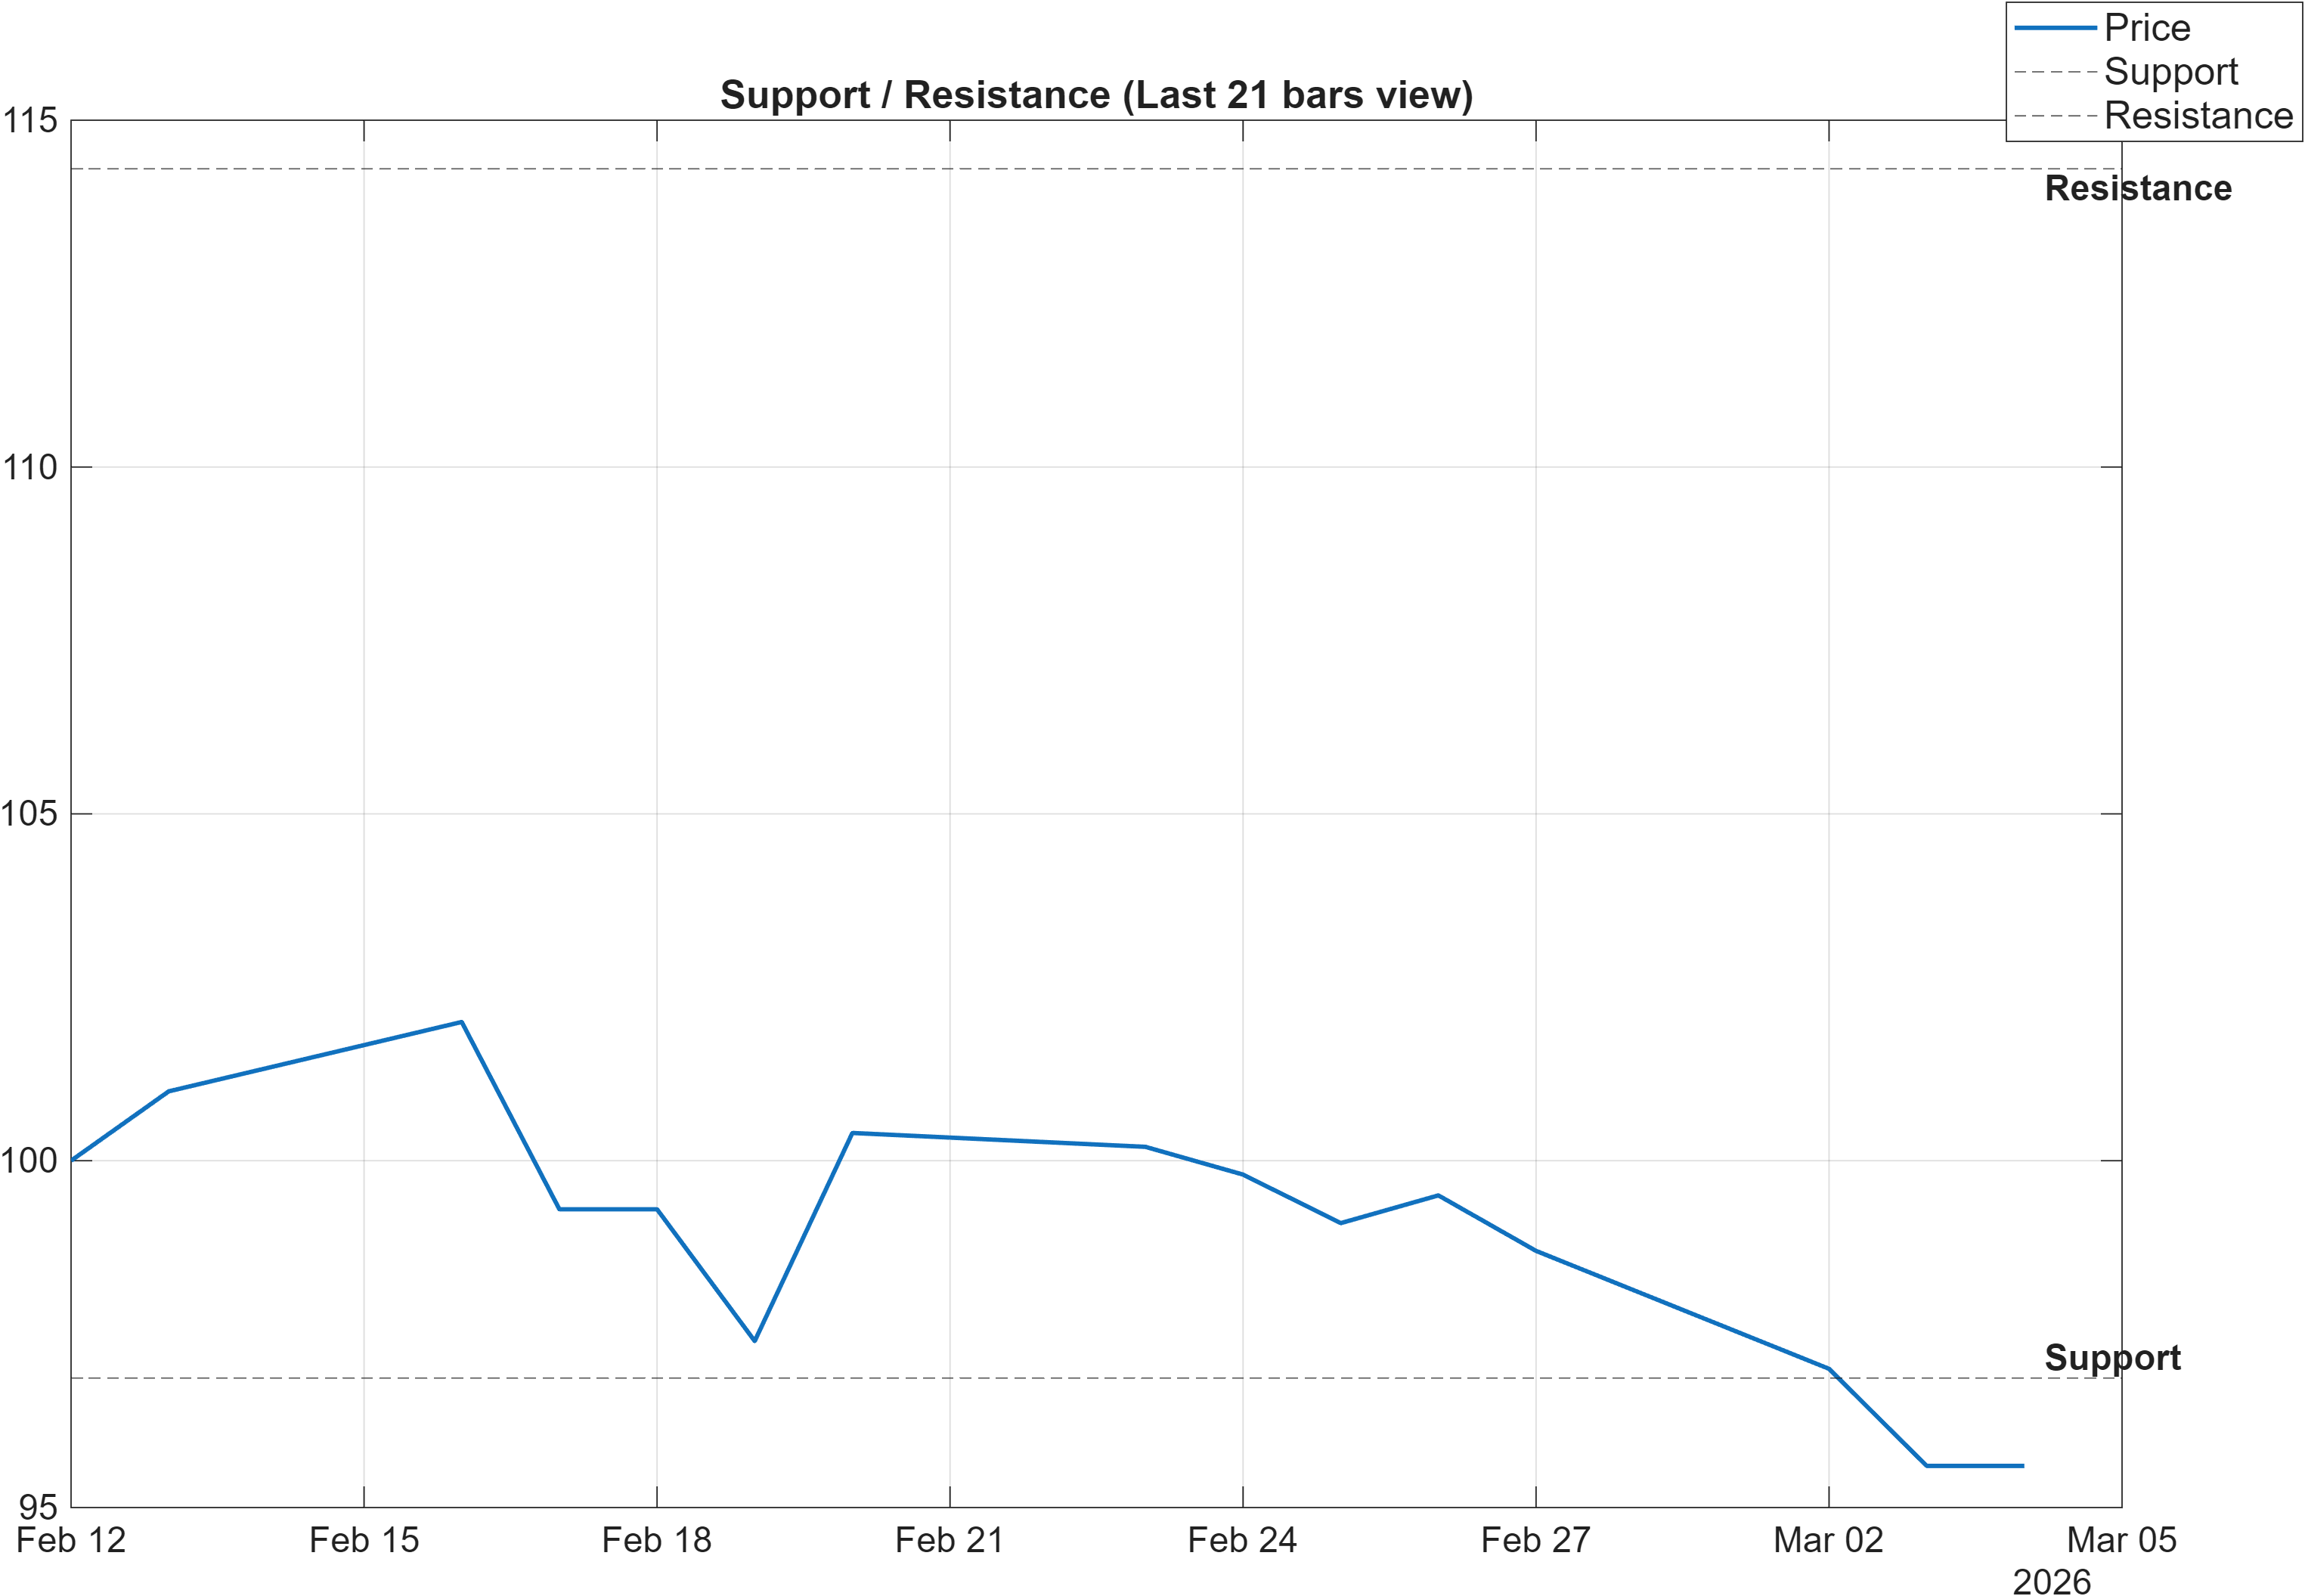
Scenario view: Break above resistance with volume → continuation. Close below support → signal deterioration risk.
Decision zones: mapping risk around a bearish trend structure
The report defines a clear operating corridor: support near 96.8667 and resistance near 114.3000. With trend structure bearish (close below MA50; MA50 below MA200) and momentum soft (RSI(14) 32.38), the support level functions less as a “buy point” and more as a risk boundary for whether downside pressure is accelerating.
A close below 96.8667 would align with the report’s stated deterioration risk and would likely pressure the already-weak longer-horizon rank complex (notably the 6-month rank at #1288). In that situation, the signal mix would be vulnerable to further bearish consolidation, particularly given that several volume/flow proxies in the signal table are negative (for example, OBV slope is bearish).
Conversely, resistance at 114.3000 is best interpreted as the first zone where bearish narratives are forced to defend. The scenario note explicitly requires a break above resistance with volume for continuation—an important qualifier given that volatility is not elevated (bandwidth 0.0746). In a lower-volatility regime, a clean breakout generally benefits from participation confirmation, because false breaks can be more frequent when ranges are tight.
Practically, these two levels bracket the most decision-relevant outcomes in the provided data: either the bearish trend persists (support fails), or the market demonstrates enough demand to challenge the trend structure (resistance clears). Until one of those conditions occurs, signals can remain mixed—particularly short-term oscillators—without altering the dominant regime.
5) Quant Technical Dashboard (18 Signals)
KGNAI AI Technical Analysis Score (Deep Reinforcement Learning): Rank #1170 out of 1425 (Rank 1 represents the strongest technical positioning and a higher probability of favorable price behavior. As ranks increase toward the maximum, the probability of favorable outcomes weakens and bearish positioning becomes more dominant.) | Label: Bearish | Score: -0.642
18-Signal Technical Confluence Score: -0.278 (Neutral)
Overall Technical Score (18-signal confluence + DRL rank blend): -0.387 (Bearish)
Note: The blended score reflects signal strength weighted against broader AI technical ranking, which may temporarily diverge.
Blended technical score breakdown: -0.387 (Bearish | Bull 5 / Bear 10 / Neutral 3)
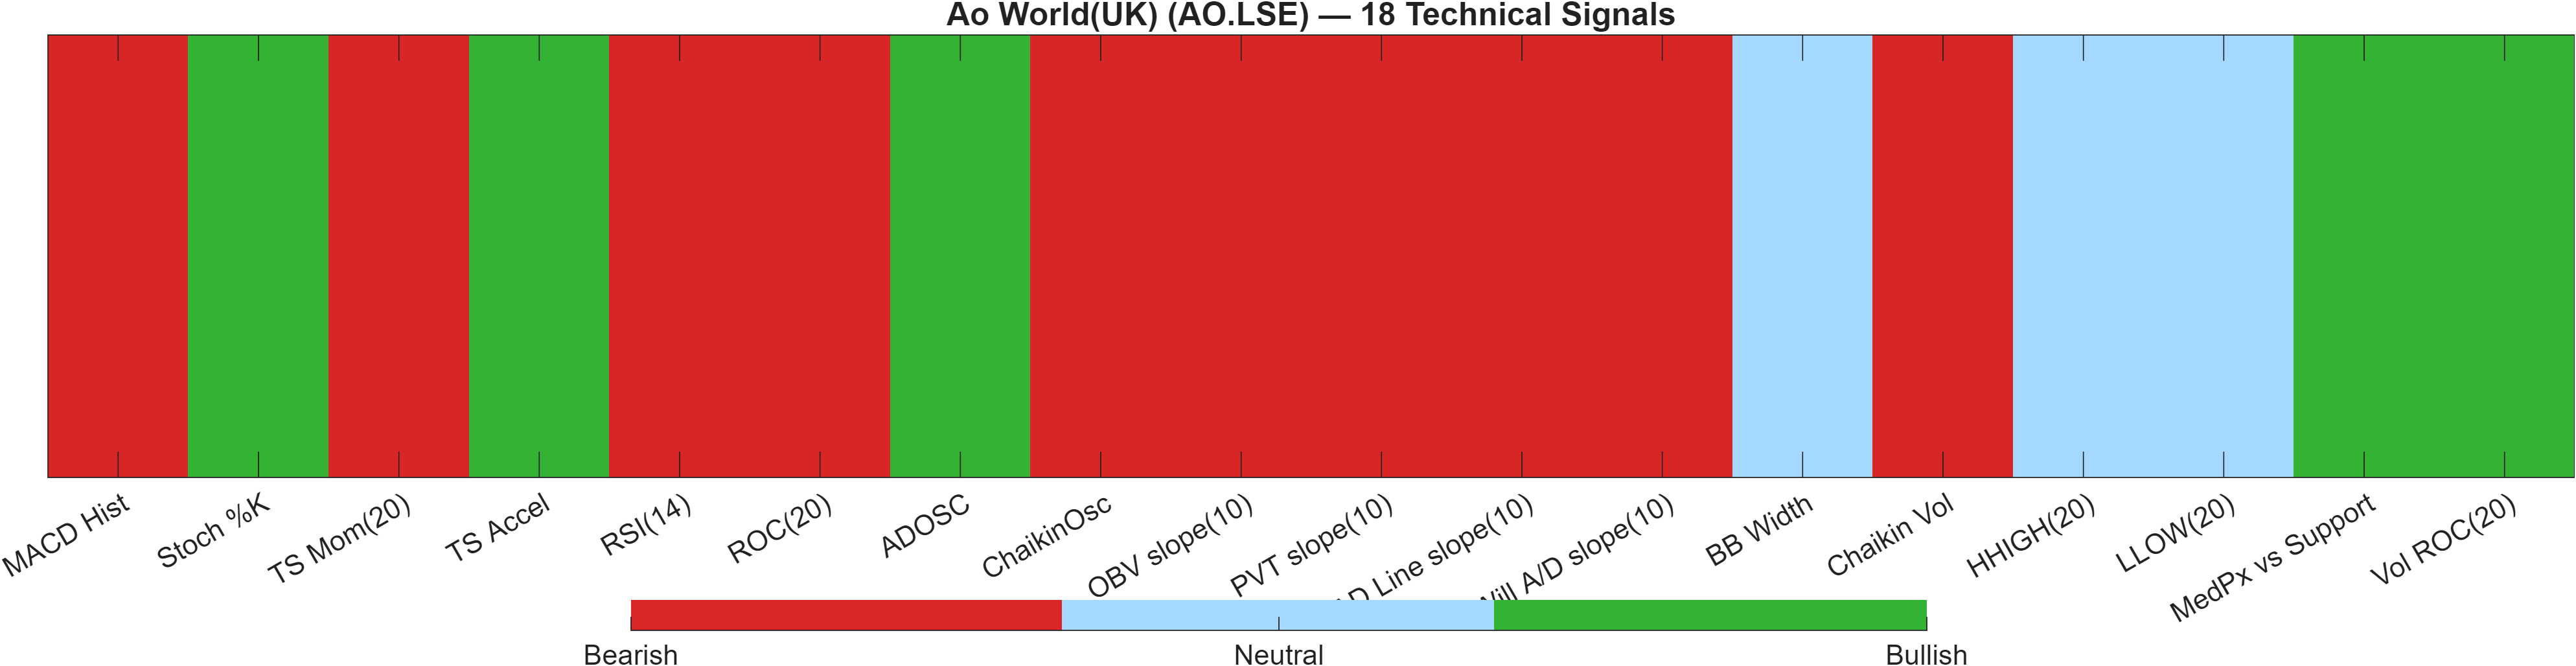
Confluence vs ranking: neutral surface signals, bearish composite control
A key nuance in this report is the difference between indicator confluence and the blended technical composite. The 18-signal confluence score is -0.278 (Neutral), implying that, at the indicator level, the market is not in a uniformly bearish “all systems go” state. However, once those signals are weighted and combined with the DRL technical rank, the overall technical score moves to -0.387 (Bearish), and the DRL rank itself is #1170 with a score of -0.642.
The breakdown helps explain why: the blend counts Bear 10 versus Bull 5 and Neutral 3. That mix suggests the market may occasionally print tactical bullish readings (often in oscillators or short-run acceleration), yet the weight of evidence continues to sit on the bearish side—particularly across momentum and flow/participation measures. For example, MACD histogram is bearish at -0.1542 and RSI(14) is bearish at 32.38, both consistent with the earlier trend read.
Another practical implication: when confluence is only mildly negative/neutral but the AI rank blend is decisively bearish, the model is effectively stating that similar-looking indicator snapshots have historically resolved poorly in comparable regimes. This is precisely where support/resistance becomes operational. If price can reclaim 114.3000 on the required participation conditions, the “rank drag” embedded in the DRL blend has a clearer pathway to improve. If not, the neutral confluence can persist without translating into durable upside.
Signal table (Bull/Bear/Neutral)
| Indicator | Value | Signal |
|---|---|---|
| MACD Hist | -0.1542 | Bearish |
| Stoch %K | 10.64 | Bullish |
| TS Mom(20) | -5.4 | Bearish |
| TS Accel | 3.6 | Bullish |
| RSI(14) | 32.38 | Bearish |
| ROC(20) | -5.347 | Bearish |
| ADOSC | 3.846 | Bullish |
| ChaikinOsc | -6.32e+05 | Bearish |
| OBV slope(10) | -3.068e+06 | Bearish |
| PVT slope(10) | -2.043e+04 | Bearish |
| AD Line slope(10) | -1.822e+06 | Bearish |
| Will A/D slope(10) | -28.5 | Bearish |
| BB Width | 0.07464 | Neutral |
| Chaikin Vol | 58.63 | Bearish |
| HHIGH(20) | 104 | Neutral |
| LLOW(20) | 94.6 | Neutral |
| MedPx vs Support | 1.483 | Bullish |
| Vol ROC(20) | 1.483 | Bullish |
Interpretation: Indicator-level signals form the base confluence, which is then adjusted using a separate AI-driven technical ranking model. The final technical score summarizes this combined view.
6) News sentiment + extractive gist
Note: Some headlines were matched using a looser (title-only) rule to avoid missing relevant coverage.
Sentiment score (avg): 0.052 | Positive: 25% | Neutral: 75% | Negative: 0%
KGNAI AI News Sentiment Score (normalized -1 to +1): 1.00 (as of 2026-02-06) | Label: Bullish | Overall news score: 0.99
Positive Developments
Recent coverage across major financial outlets indicates a modestly constructive tone around the broader backdrop influencing European equities, which can indirectly support risk appetite even when a single name’s technical posture remains heavy. In the provided sentiment split, the dataset shows 25% positive and 0% negative, with an average sentiment score of 0.052. KGNAI’s normalized news model reads 1.00 (Bullish) with an overall news score of 0.99 as of 2026-02-06, suggesting the extraction model is interpreting the matched coverage as net supportive rather than cautionary. For positioning, the more relevant takeaway is not “good news,” but the absence of a negative headline skew in the matched set—reducing the probability that sentiment is actively reinforcing the bearish technical stack at this time.
Neutral / Mixed Developments
Despite the bullish normalized label, the distribution is still predominantly Neutral (75%), which is consistent with an information tape that is not strongly directional. This matters because neutral-heavy sentiment often fails to provide the kind of catalyst that changes trend structure on its own. In practice, when the technical composite remains bearish (overall technical score -0.387) while news is broadly non-negative, price action tends to become the decision-maker: either the market uses the calm tape to stabilize near support, or it continues to drift lower under the weight of trend and momentum. Put differently, the sentiment input provides contextual bias, but the report’s key levels (support 96.8667, resistance 114.3000) remain the cleaner arbiters of confirmation.
Negative / Risk Signals
Notably, the matched set shows 0% negative sentiment, which limits the ability to isolate specific downside narratives from the provided data. The risk signal, therefore, is more structural than headline-driven: a bullish or neutral tape can coexist with weak momentum, and that mismatch sometimes leads to sentiment–price divergence where optimism does not translate into buying persistence. With RSI(14) at 32.38 and MACD histogram at -0.1542, the burden of proof remains on the chart, not the tape. If price were to close below 96.8667, the report’s own scenario framing flags deterioration risk regardless of sentiment tone. Until a break above 114.3000 with volume occurs, news positivity should be treated as a mild offset—not a primary driver—within this framework.
- What to monitor next: Whether price action improves enough to challenge 114.3000 alongside stronger participation/volume behavior.
- What to monitor next: Whether support near 96.8667 remains intact as momentum (RSI 32.38) attempts to stabilize.
- What to monitor next: Any shift in the sentiment mix away from the current 75% neutral profile that could alter contextual bias.
Sources referenced: Reuters, Bloomberg, Yahoo Finance, MarketWatch, Investing.com
Snapshot: AI Rank (Short–Mid–Long): Bearish (Bearish–Bearish–Bearish) · Technical Confluence: Neutral · Key Levels: Support ~96.87 | Resistance ~114.30 · News Sentiment: Neutral
7) Sources
- Xiaomi launches flagship smartphone as memory price surge threatens sales — https://www.cnbc.com/2026/02/28/xiaomi-17-and-17-ultra-launch-price-specs.html
- Why the railways often seem to be in such chaos over Christmas — https://www.bbc.com/news/articles/czdg795m5epo?at_medium=RSS&at_campaign=rss
- GRAPHIC- Europe's earnings gain pace while lofty valuations cap rewards - AOL.com — https://news.google.com/rss/articles/CBMihwRBVV95cUxPMzM0a2NXWGJhT0l5dDNDa09DbHhMVVVxbGl1TWptV1JTZ3ZJdVR2MEk3Ul9fUndTWG1vd2oybUxtQVVESk5NZG5TYlN3aW9STEtFc1U0dFRUazdCQUFWbm9vQXdIc0lwSE9zYUhfcm15dlZDX1dnN1QwWGtFMWNfV1M4TlJvaVh5c25fNzd2Qm5BLUFYMDEwR3RET2x3RGp0MFBiVzlIdHV6UmFqN084TWM2OER3XzdnNEQzX2h0d3hRV1RfVnV3OXFPZ0Mzazg4WW5IYlRDdWN2eUZ2ZjVObk9sWDVoOGtWWXhIZ2xsZzNqZC1YMGU0UkRUU1M2RVllWHN6Y0o5Y01ndmQ0eGhwQmpORWJ1aHpYMlRnV01rZmJDc0UtVWszaTN6eFVIaUt1OEFfakdOMURkd2NsVlBNdlE1SGFHVWtadzRiaXBLOWNYTFREeVhidzFNQzNCMzl1cWoxMTFYaFBZSm1VQjR6aENXVFVuNFM3N0hsa1k4cHRaeThDTkdOUGV1d3V0b3lRU2t1Y1hzS1ZuWTRnYl9hV0hfQ2xVLVNaNmEyUVp3VFdVWnlCS2J0U0FsbjdiaWRGWExJMzRacTc5OXlqLXFEUUZTVC1FcUZaWU5aUV8wMlVxQUR0RFNSNnk3eHQ4SklrYlk1c3JLbDhGUTYxUGdxYWJvaHZaQ0E?oc=5
- Amarin (AMRN) Q4 2025 Earnings Call Transcript - AOL.com — https://news.google.com/rss/articles/CBMifEFVX3lxTE52Q20xRnZsRzNWNDdnZG5GR2RrVkc3WnlrWnBsMERjRUVQMXJTcEY2eWo5M0QxQ3JEWV9NTWVqcm93dllJcHpKWEMtVE9SWXJqZjlaMzNDWnVMNEoyRmZtdC0wS0lBTWhUZ2dDRDQ4NGVDQjB3VjliQWxibkU?oc=5
You may also like: How KGNAI AI ranks instruments across global markets
Disclaimer: KGNAI provides AI-generated analytics and educational market commentary only. This is not financial advice. Markets involve risk. Always do your own research.