
RIO.LSE (Rio Tinto PLC (UK)) — 06-Mar-2026 Neutral ranks vs bearish technical confluence
Rio Tinto PLC (UK) (RIO.LSE) enters 06-Mar-2026 with a broadly Neutral cross-universe rank profile, while the technical confluence remains Bearish on the blended framework. The daily rank of #318 out of 1425 places the instrument in the upper quartile-to-top third of the tracked universe, but the Deep Reinforcement Learning technical rank of #1320 out of 1425 sits in the lower decile, highlighting a clear model-level divergence between relative positioning and technical state. Momentum diagnostics lean cautious: RSI(14) at 43.27 is consistent with weaker-than-neutral momentum, and the MACD histogram at -74.9971 signals negative impulse. Volatility is not elevated, with Bollinger bandwidth at 0.0746, keeping the focus on level-defined reactions. Key decision zones are framed by support ~6126.8390 and resistance ~7444.5000, while news sentiment is mechanically positive in the scoring layer despite mixed relevance in the extracted item set.
- Short / Mid / Long rank stance: Neutral / Neutral / Neutral (daily #318; weekly #481; yearly #578 out of 1425)
- Technical confluence: Bearish (overall technical score -0.489; DRL rank #1320)
- Key levels: Support ~6126.8390; Resistance ~7444.5000
- News sentiment bias: Bullish (normalized 1.00; overall news score 0.89; avg sentiment 0.104)
- Confirmation / invalidation: A break above 7444.5000 with volume supports continuation conditions; a close below 6126.8390 increases deterioration risk per the scenario view.
KGNAI evaluates assets using large cross-sectional datasets built from millions of structured data points. Inputs incorporate fundamental metrics, technical structures, and systematically processed news sentiment. Statistical models, machine learning, and AI frameworks are used to assess relative positioning, signal alignment, and probabilistic behavior across broad universes.
- Ranks are comparative across the tracked universe, not absolute price targets.
- Confluence reflects alignment among independent signal groups.
- Support/resistance levels are probabilistic decision zones, not guarantees.
- Sentiment provides contextual bias within the broader analytical framework.
1) KGNAI AI Analysis
Region: EUROPE
Total universe size: 1425 ranked instruments
- Daily rank: #318 out of 1425 — Neutral
- Weekly rank: #481 out of 1425 — Neutral
- Monthly rank: #561 out of 1425 — Neutral
- 3-Monthly rank: #494 out of 1425 — Neutral
- 6-Monthly rank: #898 out of 1425 — Neutral
- Yearly rank: #578 out of 1425 — Neutral
Cross-horizon positioning: stable neutrality, limited directional edge
The rank curve is notably consistent: every horizon from daily through yearly is labeled Neutral, with placements spanning from #318 (daily) to #898 (6-month) out of 1425. That spread matters: the short horizon sits closer to the upper quartile/top third of the universe, while the 6-month horizon drifts into the lower third, implying that any near-term comparative firmness has not yet translated into durable medium-term leadership. The monthly and yearly readings (#561 and #578) cluster near the middle of the distribution, reinforcing the idea of “market-like” behavior rather than a strong factor tilt.
This rank stability also reduces the likelihood that a single time-frame anomaly is driving the narrative. Instead, the framework is signaling that RIO.LSE is not currently exhibiting the kind of cross-horizon alignment typically associated with high-conviction regimes. In practical workflow terms, neutrality across horizons tends to shift attention away from directional forecasting and toward level-based validation (notably the 6126.8390 support and 7444.5000 resistance) and to whether technical signals begin to converge with ranks. The term view remains explicitly Neutral across short-, mid-, and long-term lenses.
KGNAI ranks each instrument across large universes using multiple proprietary AI tests and statistical models (millions of data points). Lower ranks generally indicate stronger probability of favorable performance behavior, while higher ranks indicate weaker probability and more bearish positioning.
Term view: Short-term: Neutral. Mid-term: Neutral. Long-term: Neutral.
Want the full universe and complete rank tables? Unlock full access on KGNAI: https://www.kgnai.com/pricing
2) Price & trend overview
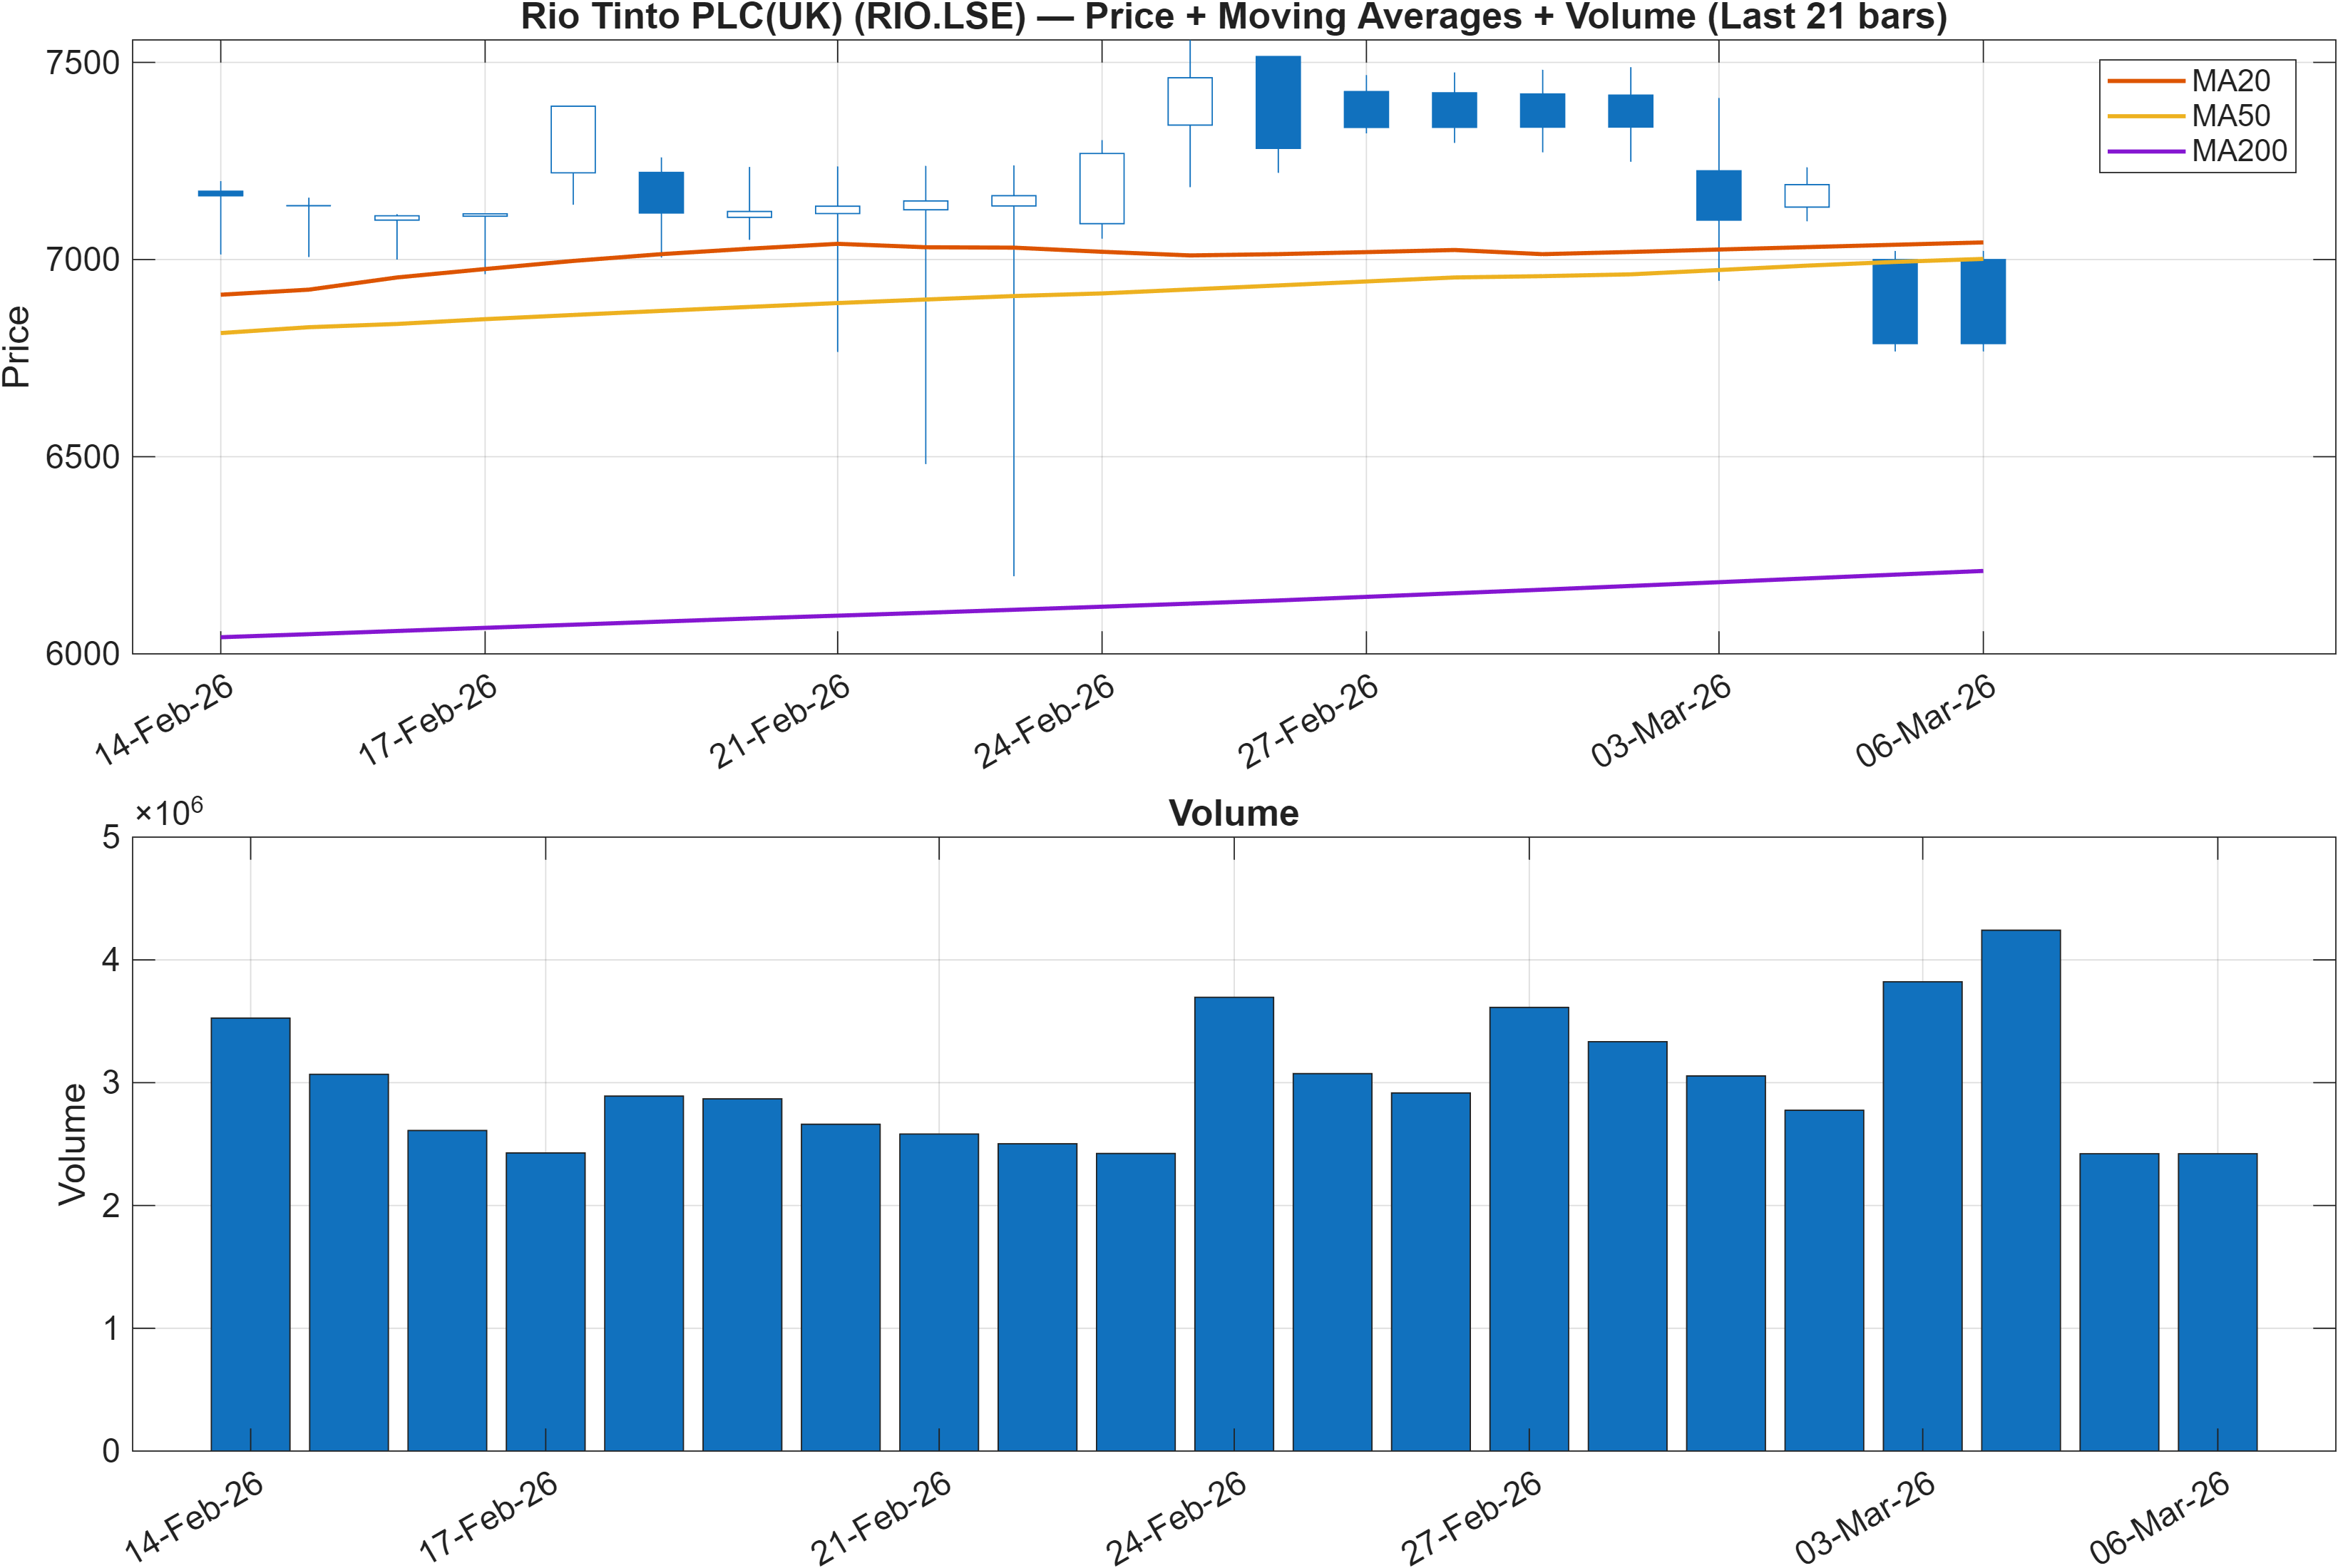
Moving-average split: short-term pressure within a longer-horizon up-bias
The trend read is explicitly bifurcated: Close vs MA50 = Bearish, while MA50 vs MA200 = Bullish. This configuration is frequently associated with a pullback or consolidation occurring inside a still-constructive longer-term structure. In other words, the market is not confirming a clean trend reversal on longer averages, but it is also not rewarding near-term momentum.
When this split persists, the more actionable question often becomes whether price can reclaim behavior consistent with the shorter average without violating the broader structure. That is where the support ~6126.8390 becomes analytically important: it functions as a local “line in the sand” for maintaining a controlled drawdown profile. Conversely, the resistance ~7444.5000 defines the level where the market would have to demonstrate sustained demand before trend continuation arguments become structurally better supported.
The rank backdrop adds nuance. A daily rank of #318 contrasts with a weaker 6-month rank of #898, which fits the idea of a market attempting to stabilize tactically while still carrying longer-horizon drag. Until the moving-average condition improves (close regaining strength versus MA50) or price resolves decisively through the defined zones, the trend lens remains best treated as a range-to-reversion environment rather than a directional breakout regime.
3) Momentum & volatility dashboard
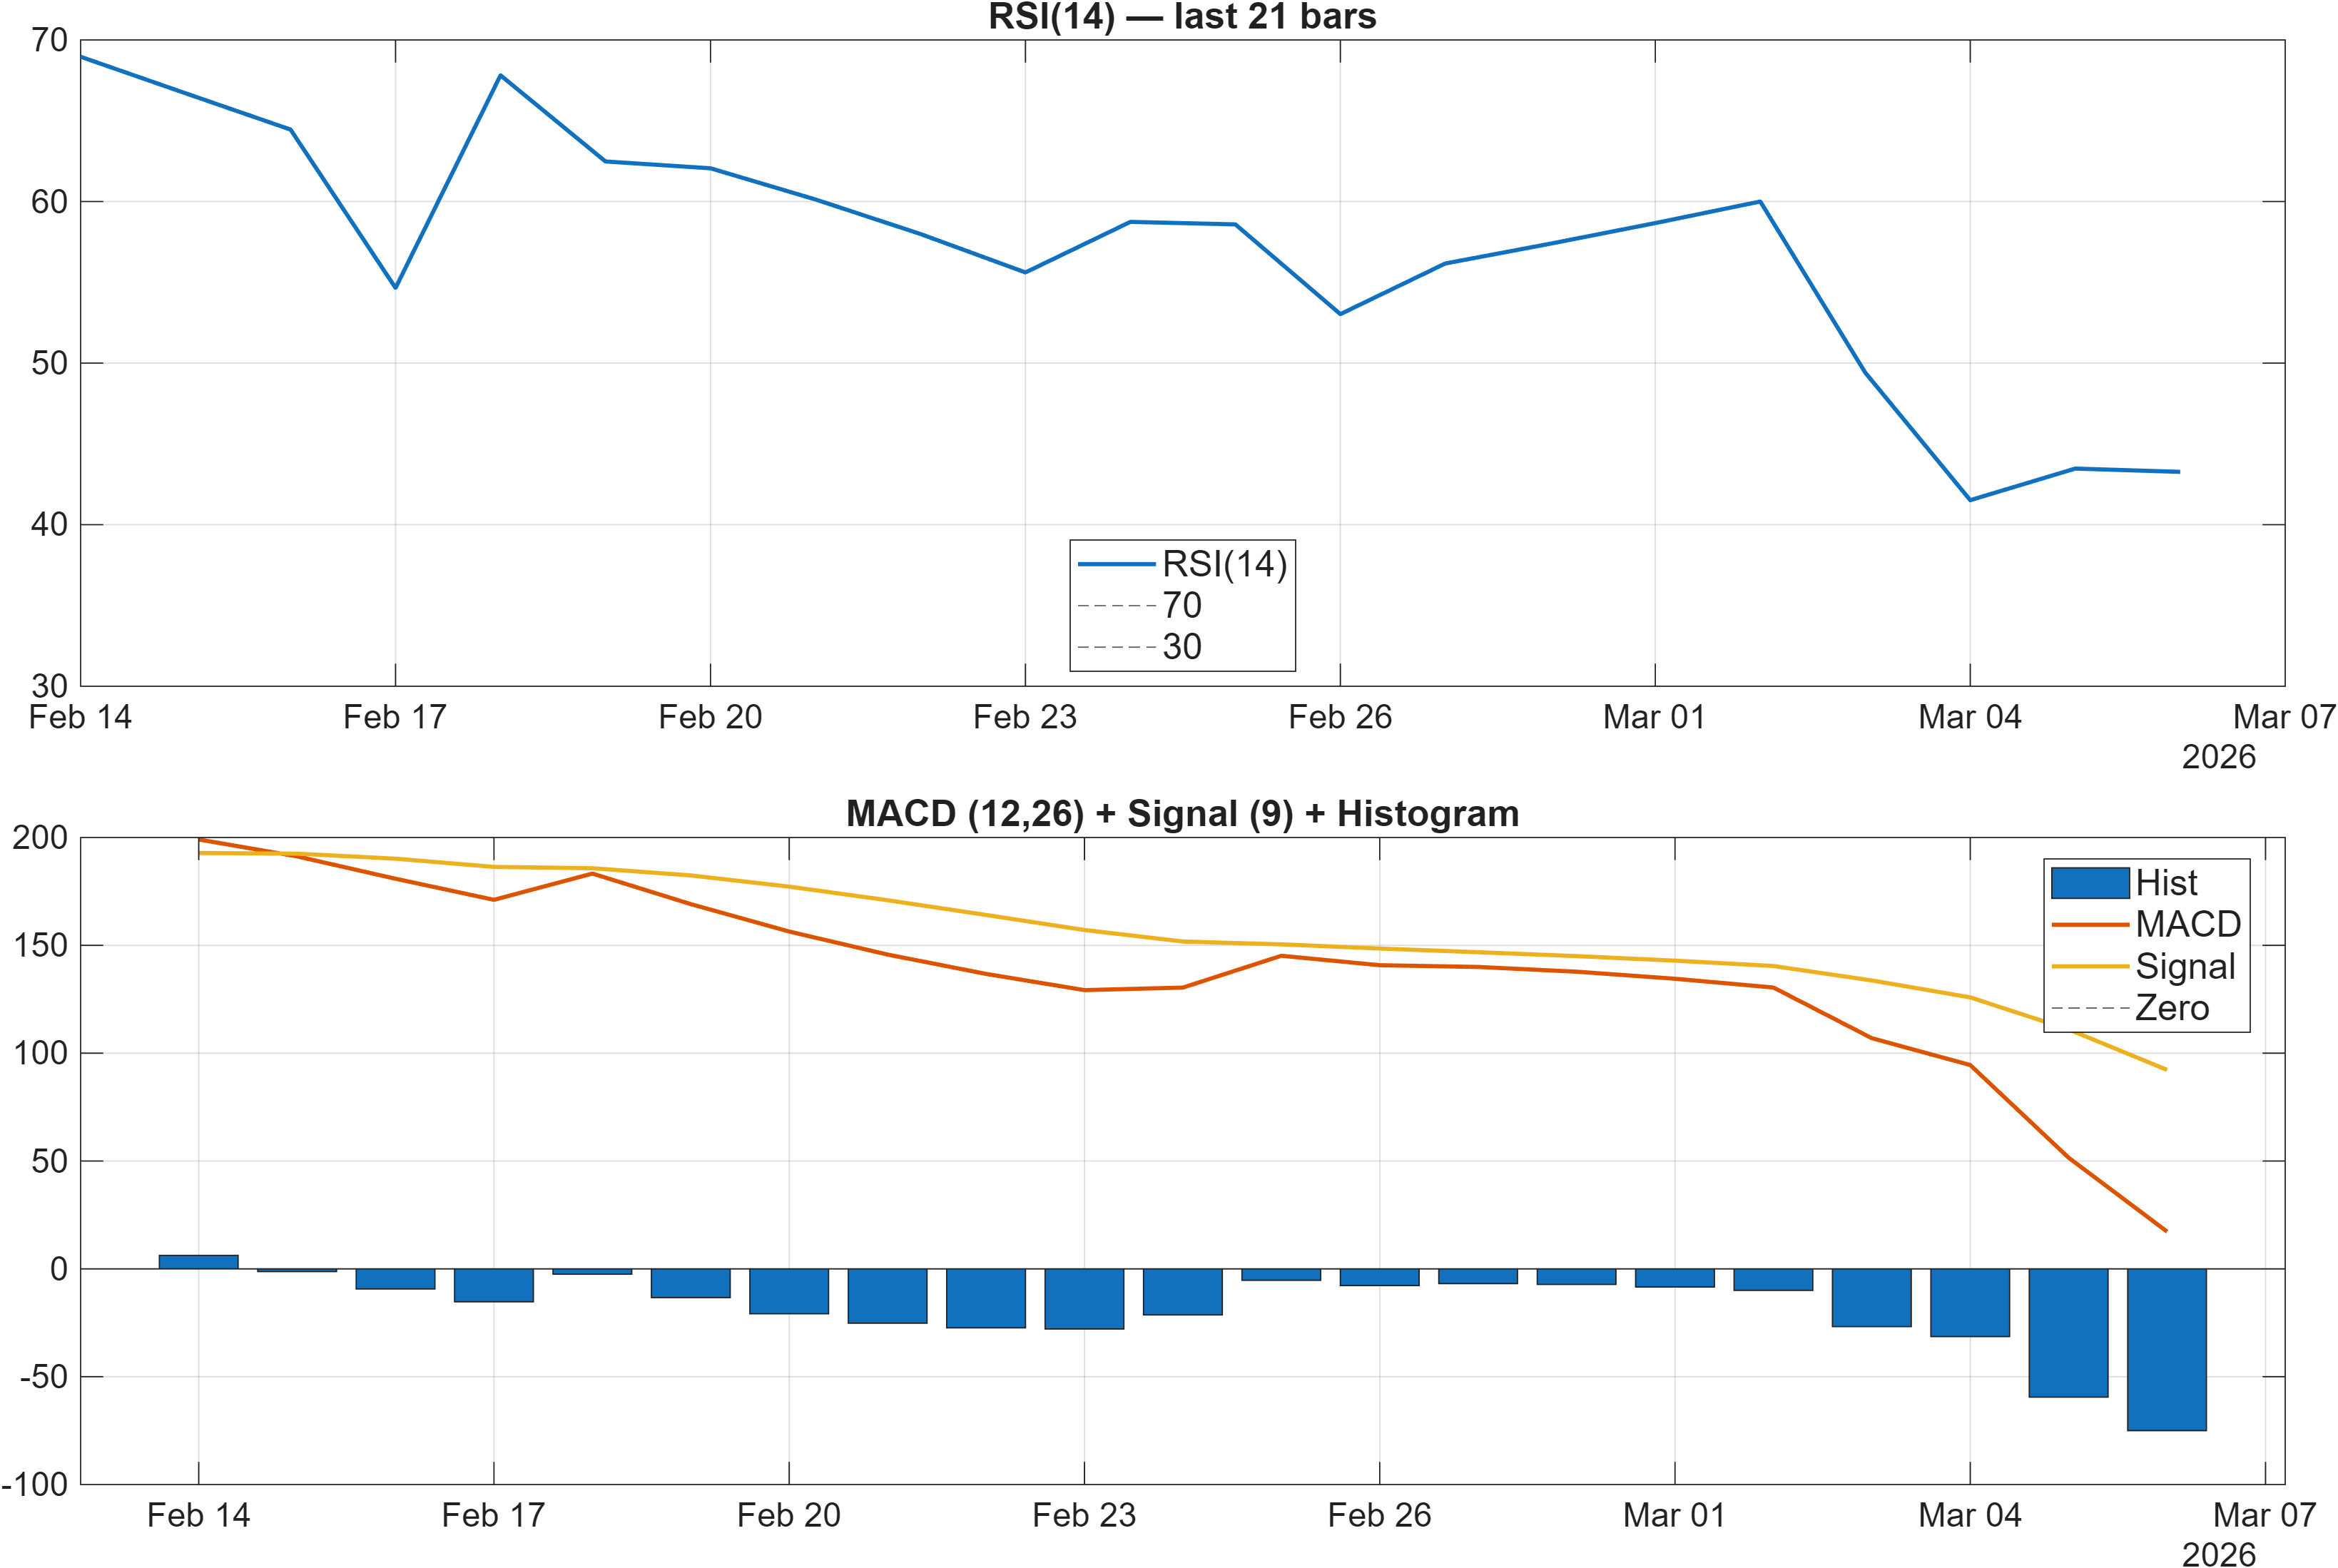
Interpretation: RSI bias = Neutral, MACD hist = -74.9971.
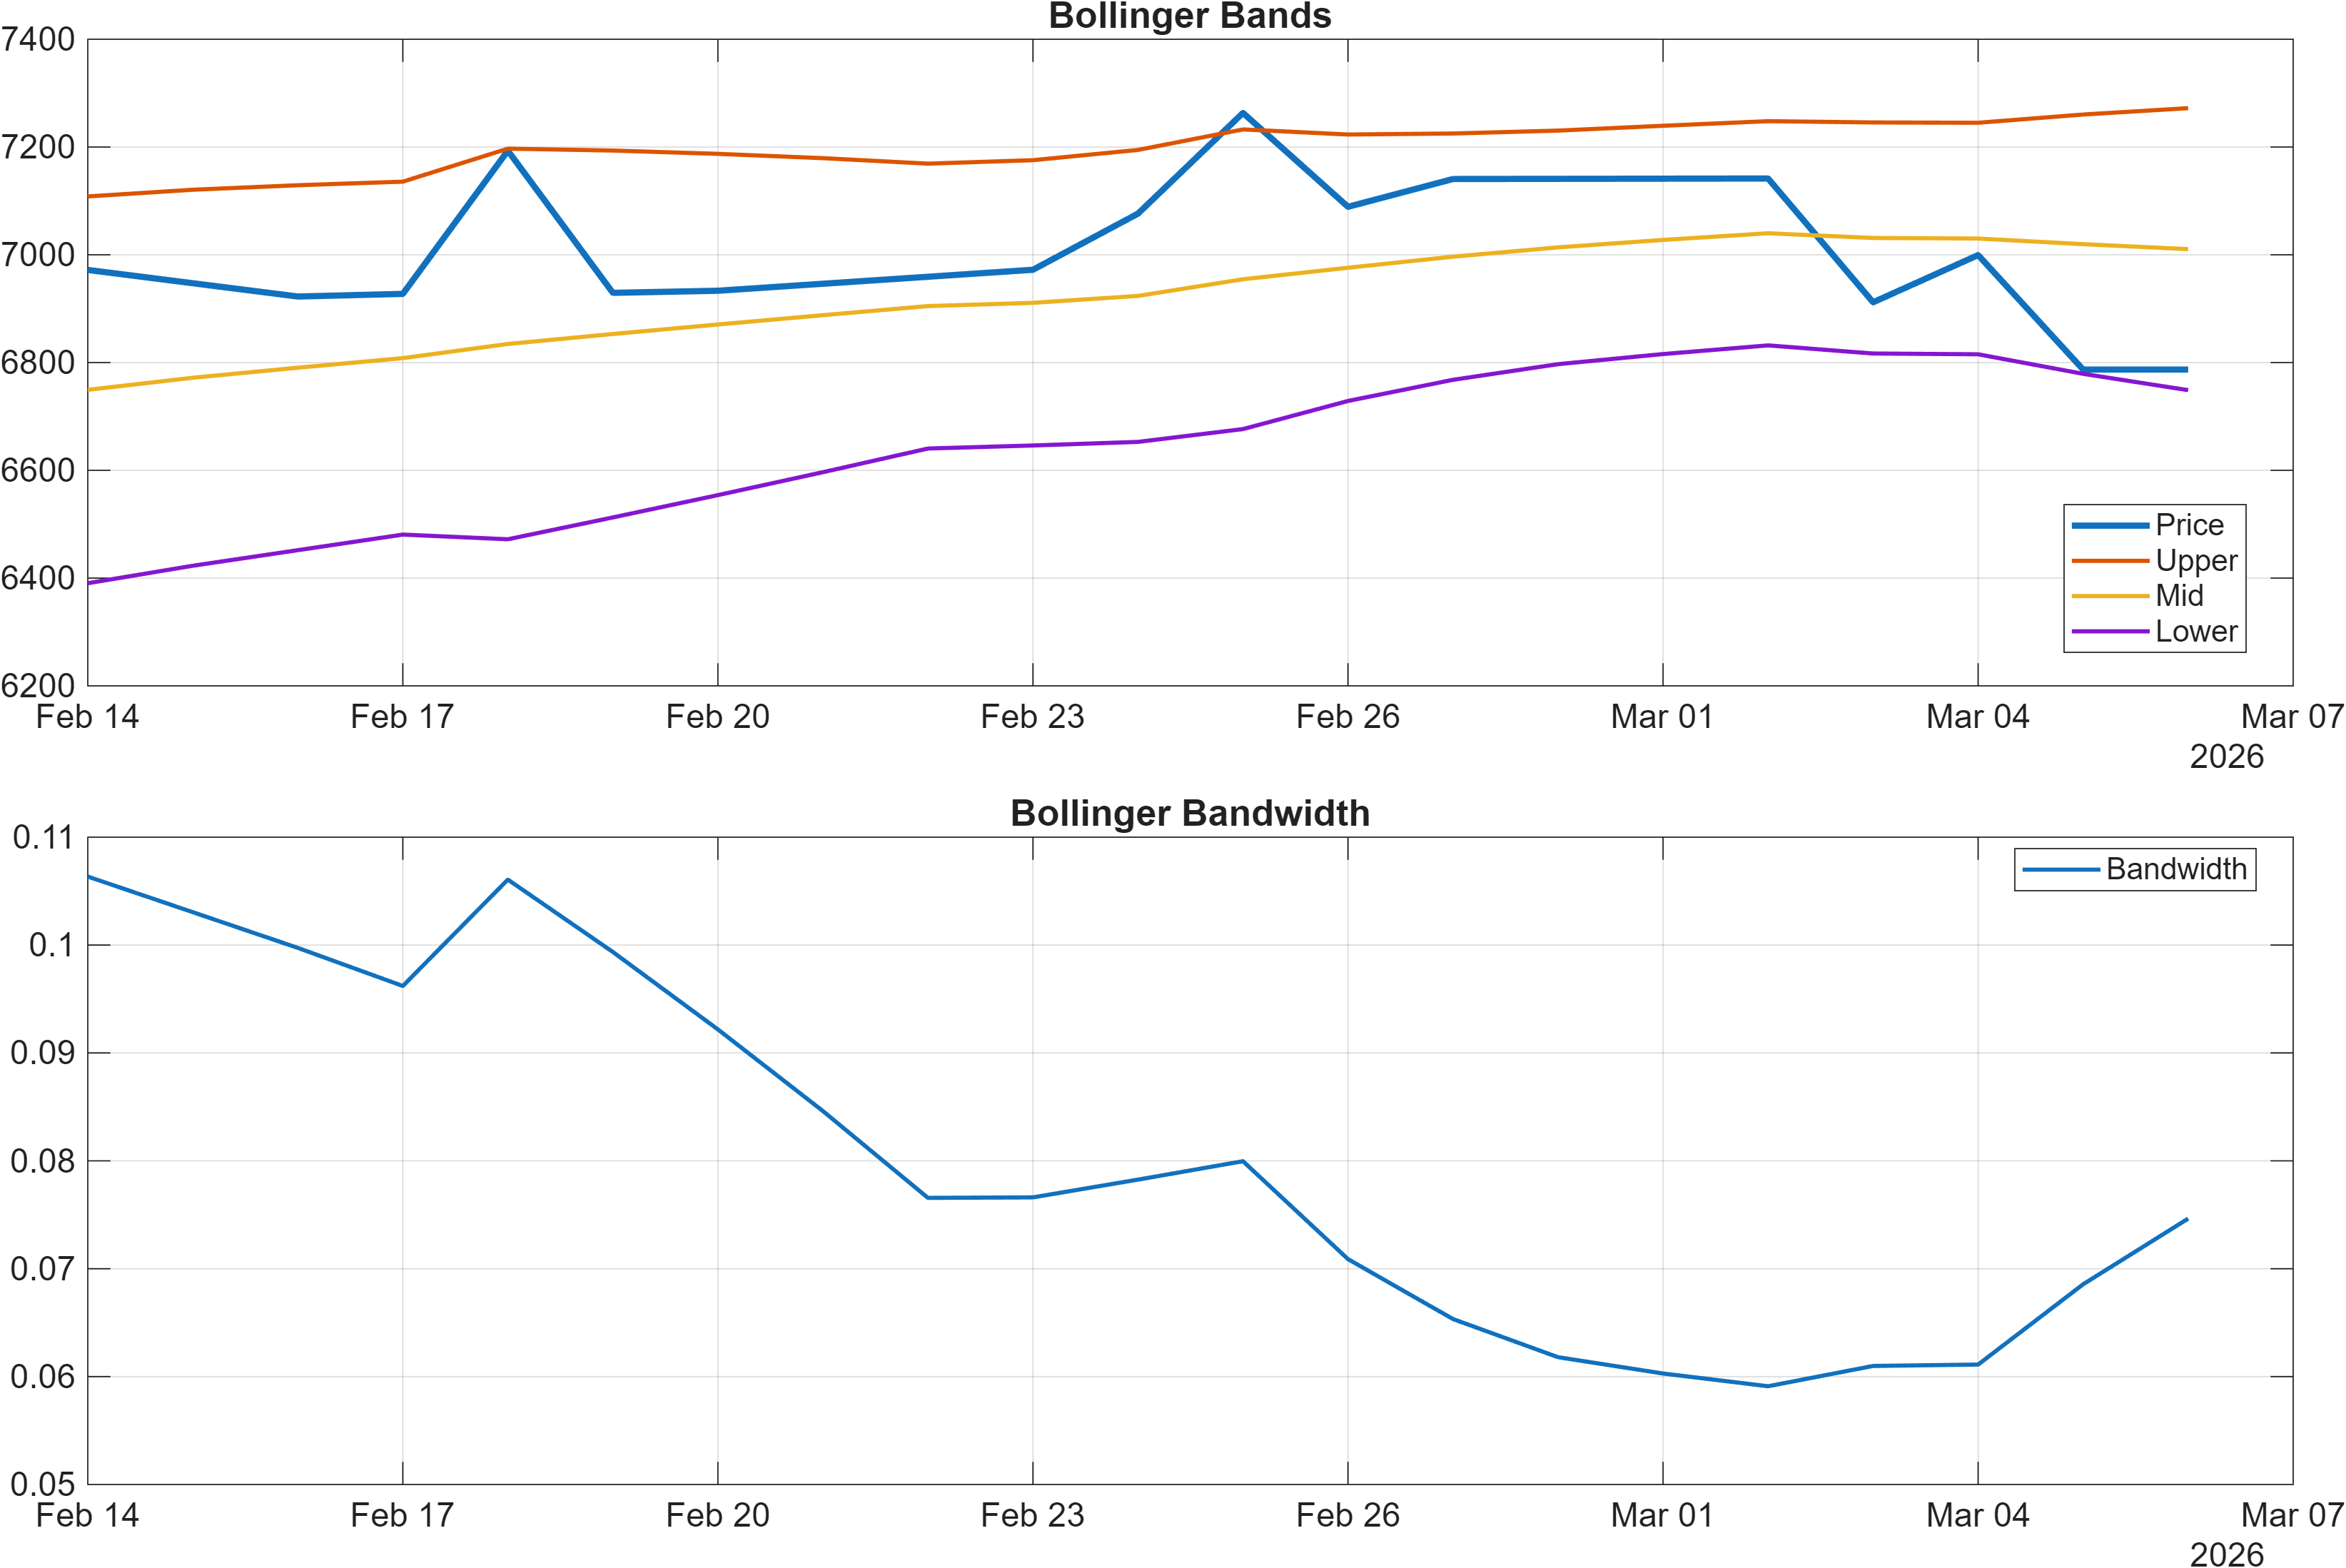
Interpretation: Bandwidth (volatility regime) latest = 0.0746.
Momentum tilt negative; volatility contained, raising the bar for breakout conviction
Momentum is sending a cautious message even as the dashboard’s RSI bias is labeled neutral. The key detail is the downside impulse in trend-following measures: the MACD histogram at -74.9971 indicates negative acceleration in the MACD framework, aligning with several bearish momentum flags in the broader signal stack (e.g., ROC(20) at -2.306 and TS Mom(20) at -349.3). The RSI(14) at 43.27 sits below the midline, which tends to be consistent with a market that is not yet rebuilding sustained upside momentum.
Volatility context tempers how these momentum readings are interpreted. With Bollinger bandwidth at 0.0746, the regime is not signaling a volatility expansion wave; that commonly results in price spending more time “working” levels than trending cleanly. In such conditions, bearish momentum can fade into sideways consolidation if sell pressure does not intensify, but it can also become more consequential if price drifts toward support while volatility remains compressed.
This creates a practical tension: the news sentiment score normalized at 1.00 leans constructive, yet the momentum complex remains negative. When sentiment and momentum diverge, the framework typically prioritizes price/level confirmation—particularly reactions around 6126.8390 and any attempt to re-establish strength toward 7444.5000—before treating sentiment as more than contextual bias.
4) Support / Resistance zones
Support ~ 6126.8390 | Resistance ~ 7444.5000
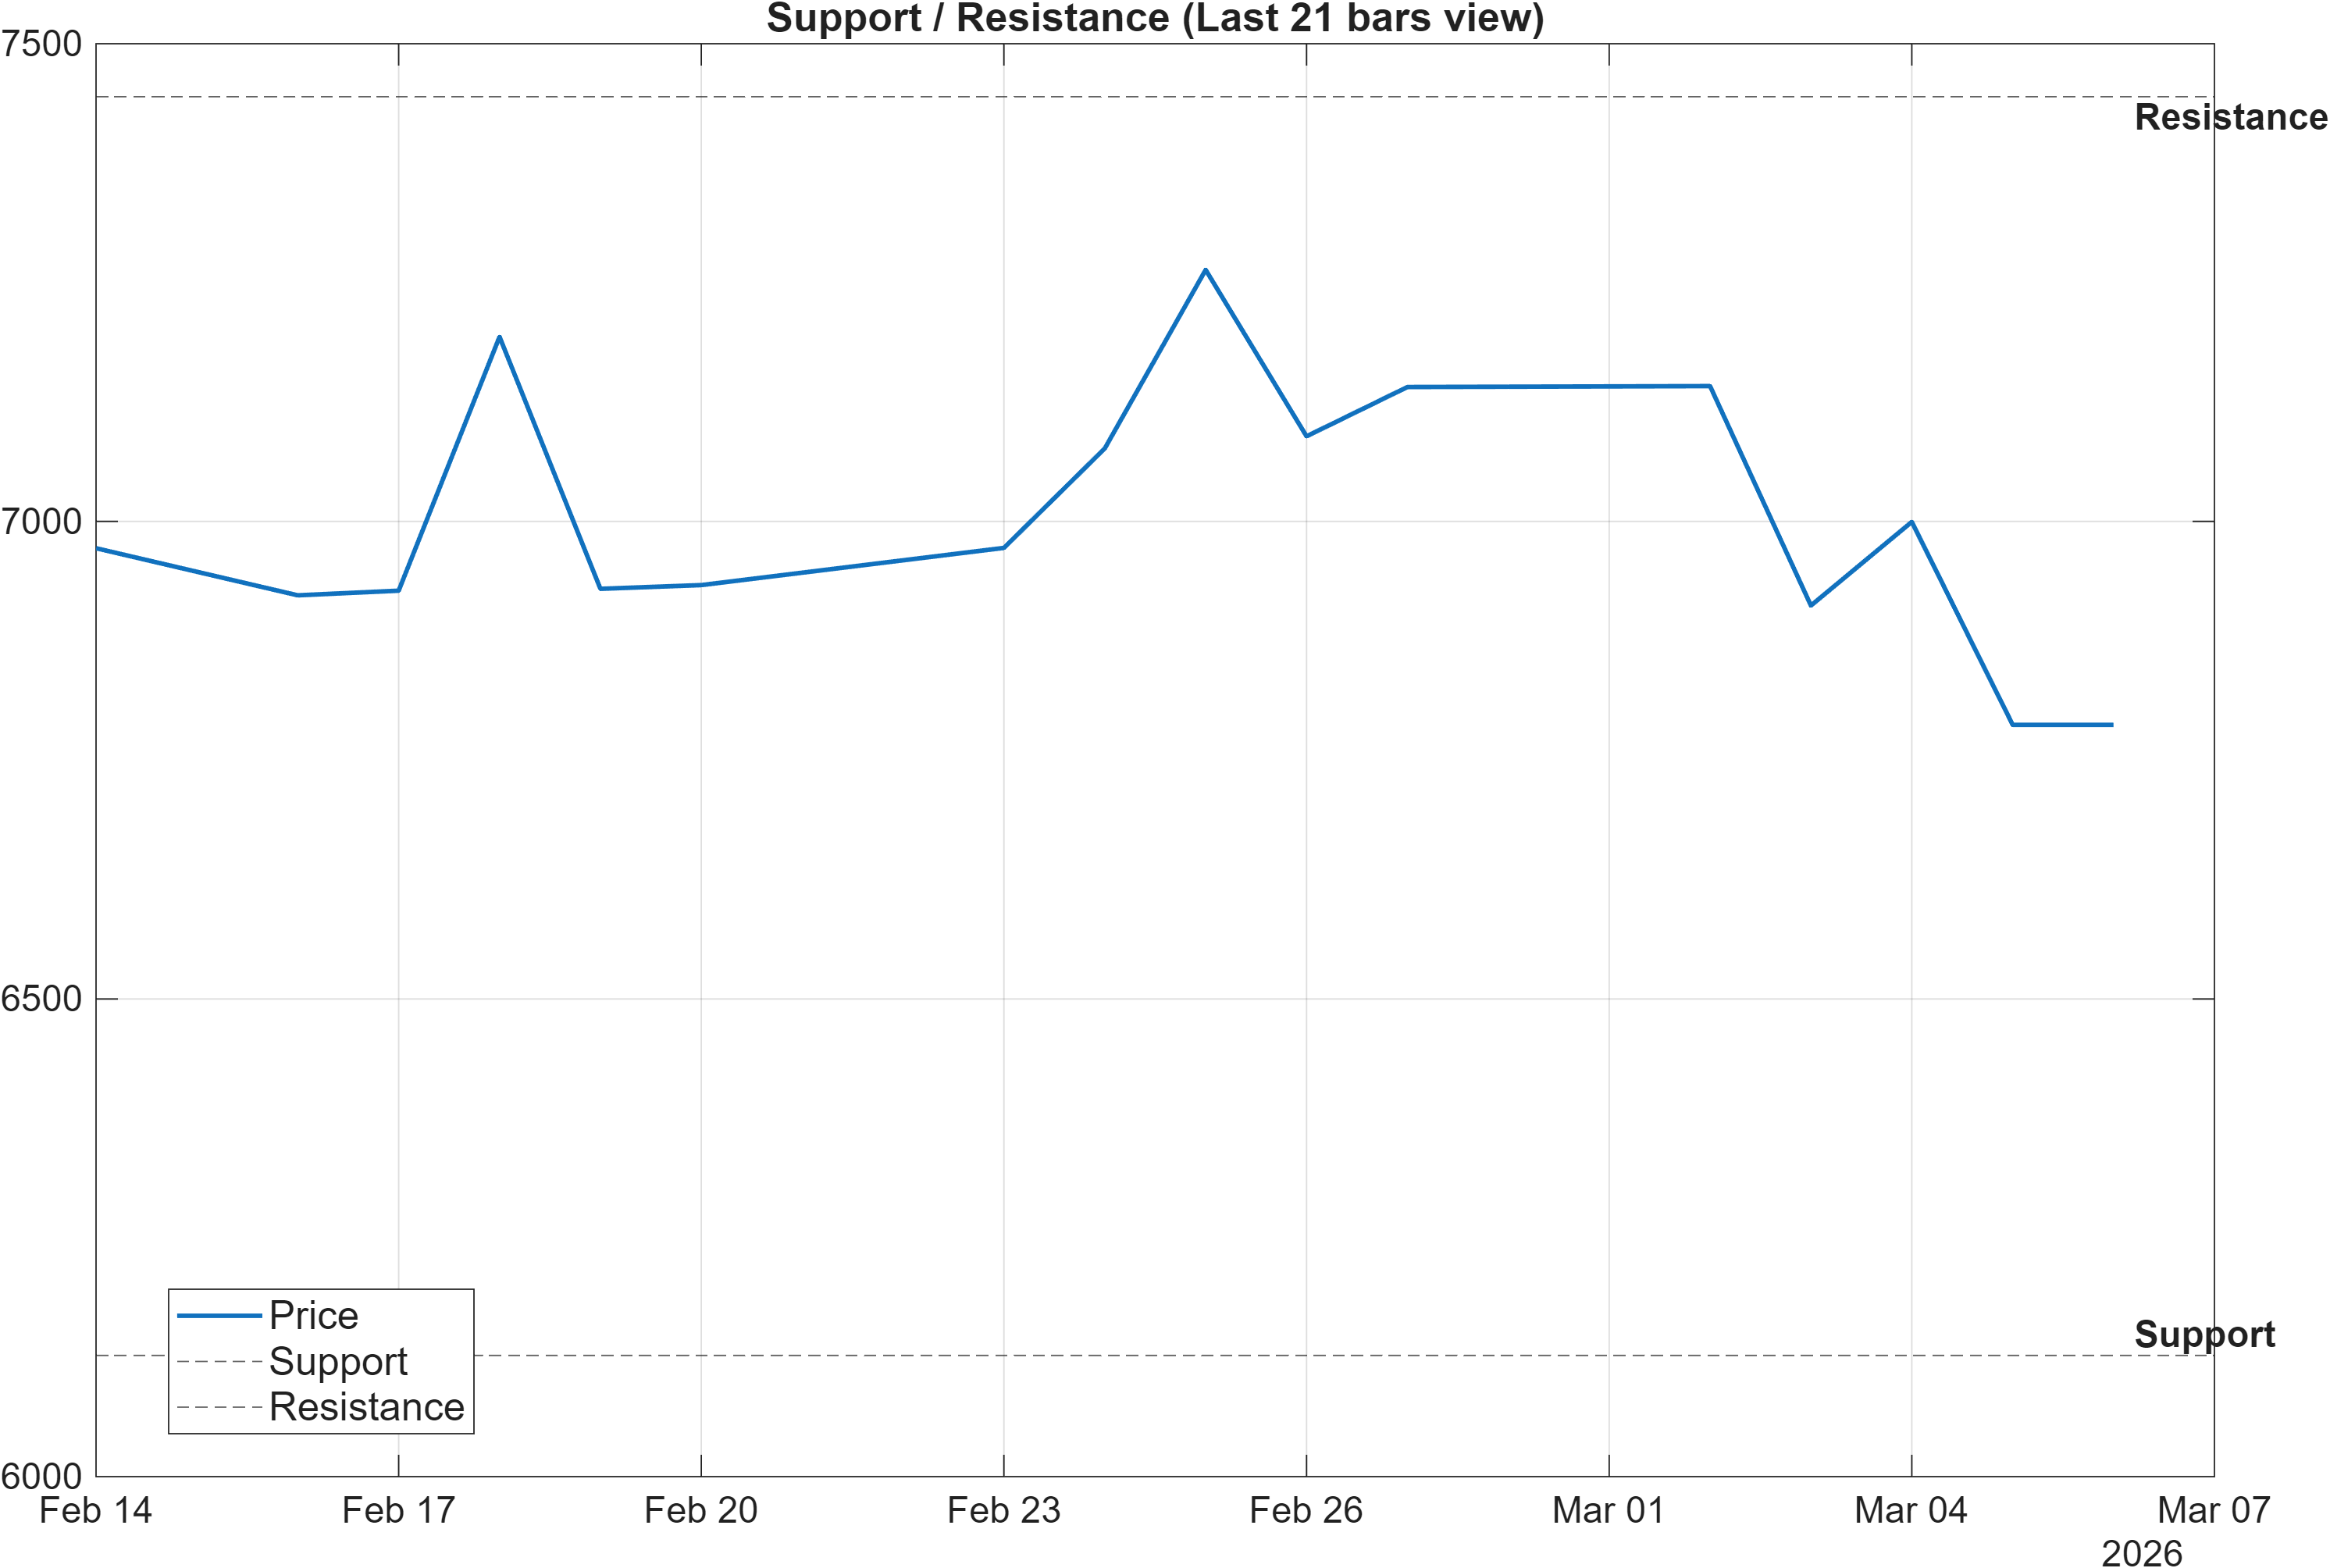
Scenario view: Break above resistance with volume → continuation. Close below support → signal deterioration risk.
Decision zones: level validation dominates while ranks stay neutral and momentum soft
With ranks pinned to Neutral across horizons and volatility contained (0.0746 bandwidth), the analytical weight shifts toward how price behaves at the defined boundaries: 6126.8390 as support and 7444.5000 as resistance. These are not forecasts; they are probabilistic zones where the market most often reveals whether current conditions are stabilizing, transitioning, or deteriorating.
The scenario framing provided is symmetric and disciplined. A break above 7444.5000 with volume would be the market’s way of resolving the current mixed state—short-term weakness versus MA50 but longer-term MA alignment still constructive—into a more coherent continuation structure. Conversely, a close below 6126.8390 would represent an adverse outcome for the present consolidation thesis, especially given the negative momentum backdrop (e.g., MACD histogram -74.9971 and RSI(14) 43.27), which would then have less “room” to mean-revert without trend damage.
The technical stack also supports treating these levels as the primary arbiter. The overall technical score is -0.489 (Bearish), and when technical confluence is negative, upside follow-through is typically more dependent on clear level breaks and participation rather than incremental improvement in oscillators. Until a boundary is resolved, the more probable market behavior in a compressed regime is rotation around the range rather than persistent directional extension.
5) Quant Technical Dashboard (18 Signals)
KGNAI AI Technical Analysis Score (Deep Reinforcement Learning): Rank #1320 out of 1425 (Rank 1 represents the strongest technical positioning and a higher probability of favorable price behavior. As ranks increase toward the maximum, the probability of favorable outcomes weakens and bearish positioning becomes more dominant.) | Label: Bearish | Score: -0.853
18-Signal Technical Confluence Score: -0.333 (Bearish)
Overall Technical Score (18-signal confluence + DRL rank blend): -0.489 (Bearish)
Note: The blended score reflects signal strength weighted against broader AI technical ranking, which may temporarily diverge.
Blended technical score breakdown: -0.489 (Bearish | Bull 4 / Bear 10 / Neutral 4)
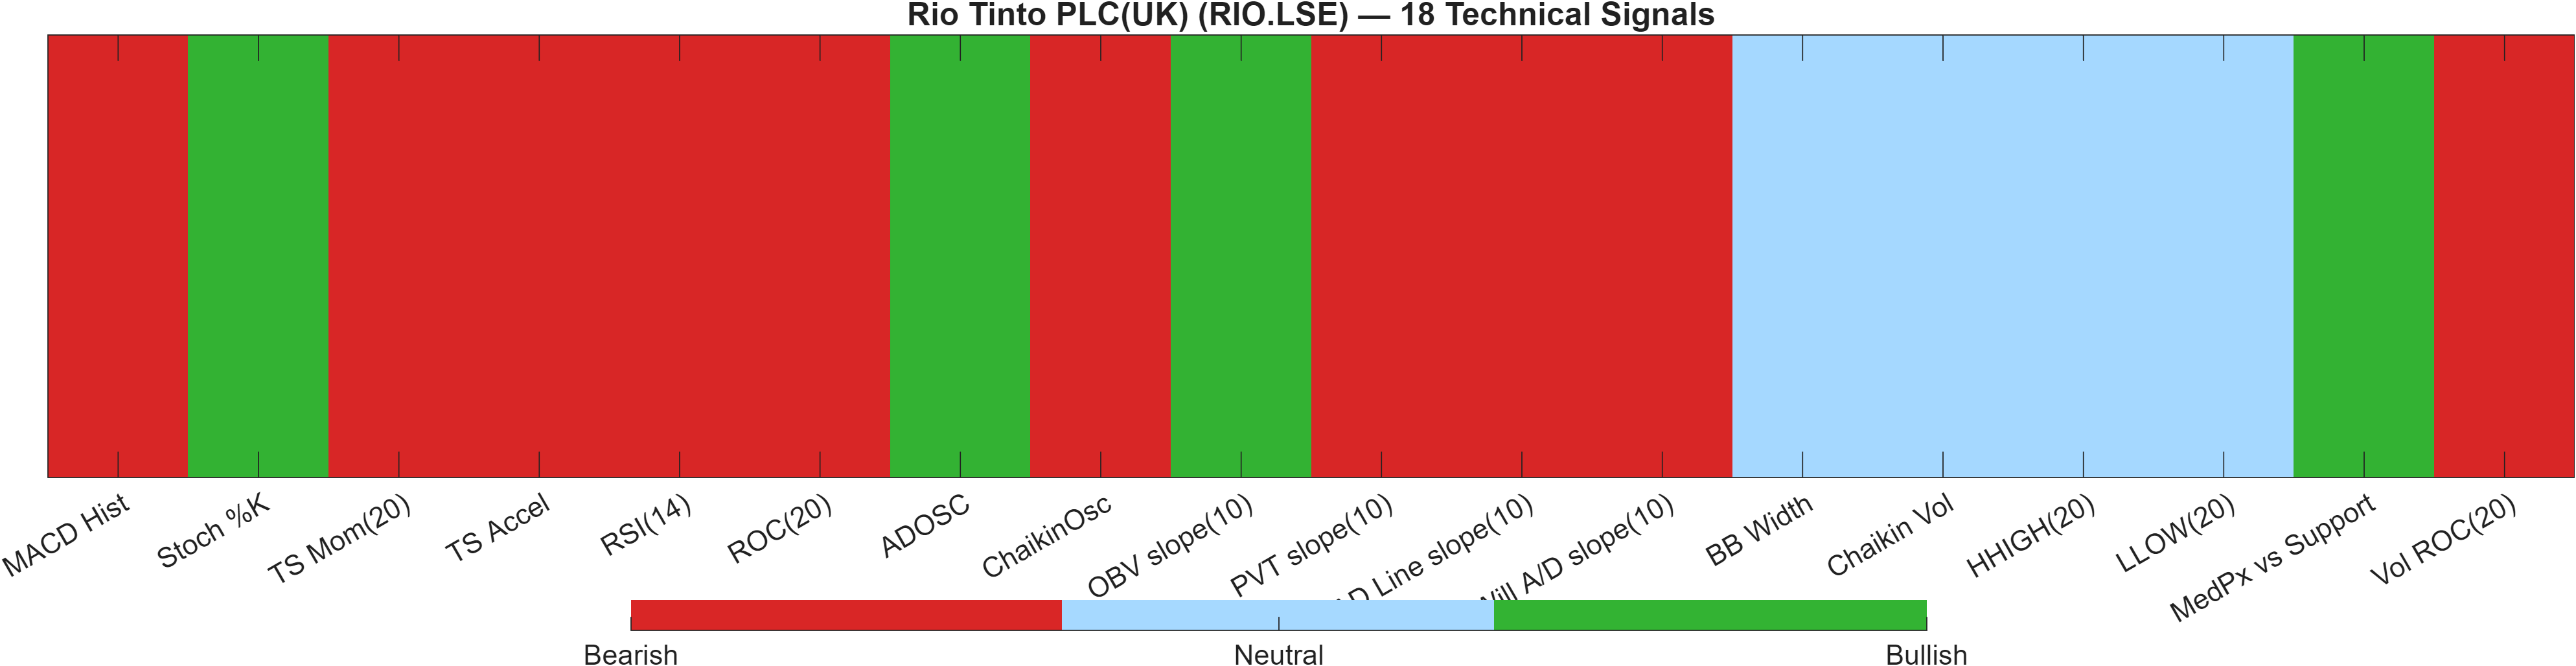
Signal table (Bull/Bear/Neutral)
| Indicator | Value | Signal |
|---|---|---|
| MACD Hist | -75 | Bearish |
| Stoch %K | 2.532 | Bullish |
| TS Mom(20) | -349.3 | Bearish |
| TS Accel | -757.7 | Bearish |
| RSI(14) | 43.27 | Bearish |
| ROC(20) | -2.306 | Bearish |
| ADOSC | 8.235 | Bullish |
| ChaikinOsc | -1.974e+06 | Bearish |
| OBV slope(10) | 1.093e+07 | Bullish |
| PVT slope(10) | -1.67e+05 | Bearish |
| AD Line slope(10) | -1.073e+07 | Bearish |
| Will A/D slope(10) | -331.5 | Bearish |
| BB Width | 0.07465 | Neutral |
| Chaikin Vol | -33.7 | Neutral |
| HHIGH(20) | 7557 | Neutral |
| LLOW(20) | 6197 | Neutral |
| MedPx vs Support | 767.7 | Bullish |
| Vol ROC(20) | -21.07 | Bearish |
Interpretation: Indicator-level signals form the base confluence, which is then adjusted using a separate AI-driven technical ranking model. The final technical score summarizes this combined view.
Confluence diagnosis: breadth is bearish even as a few accumulation measures improve
The technical layer is unambiguously negative on the blended framework: the 18-signal confluence score is -0.333 (Bearish) and the overall technical score is -0.489 (Bearish). The composition (Bull 4 / Bear 10 / Neutral 4) indicates the bearish outcome is driven by breadth across indicators rather than a single outlier.
The Deep Reinforcement Learning output adds a separate “state” assessment, and it is also bearish: rank #1320 out of 1425 with a score of -0.853. That placement sits in the lowest decile of the universe and tends to be consistent with markets where rallies are less persistent and downside impulses are harder to neutralize.
Not all components are risk-off. A few volume/flow signals are constructive (e.g., ADOSC 8.235 and OBV slope(10) 1.093e+07 are bullish), which can occur when accumulation is selective or when price weakness is not accompanied by uniformly adverse flow. However, the dominant momentum and trend metrics remain bearish (e.g., MACD Hist -75, RSI(14) 43.27, and Vol ROC(20) -21.07), so the technical picture is better characterized as attempted stabilization under negative impulse than a confirmed transition to strength.
6) News sentiment + extractive gist
Note: Some headlines were matched using a looser (title-only) rule to avoid missing relevant coverage.
Sentiment score (avg): 0.104 | Positive: 50% | Neutral: 50% | Negative: 0%
KGNAI AI News Sentiment Score (normalized -1 to +1): 1.00 (as of 2026-03-04) | Label: Bullish | Overall news score: 0.89
Positive Developments
Recent coverage across major financial outlets indicates a mechanically constructive sentiment profile for RIO.LSE within KGNAI’s processing window. The structured scoring reflects no negative items (0%) in the captured set and a split between positive (50%) and neutral (50%), which supports the model’s normalized sentiment score of 1.00 (overall news score 0.89). In the context of market behavior, this kind of positive bias can help explain why downside follow-through sometimes remains limited even when technical momentum is soft (e.g., MACD hist -74.9971). However, the news layer here should be treated as context rather than confirmation: the extracted items appear to include content that may not be directly tied to company-specific drivers, consistent with the stated “title-only” matching note. As a result, the most robust use of the news score is as a bias indicator that must be validated by price action around 6126.8390 and 7444.5000.
Neutral / Mixed Developments
The neutral component is non-trivial: with 50% neutral in the distribution and an average sentiment score of 0.104, the tone is positive but not strongly one-sided. That matters because a high normalized reading can coexist with comparatively modest average sentiment if the sample is small or dominated by non-directional language. Mixed relevance is also implied by the extraction note; when item matching is broadened to avoid missing coverage, it can increase inclusion of informational stories that do not map cleanly to equity-specific catalysts. For an institutional reader, the practical consequence is to lean on technical confirmation rather than treating sentiment as a standalone signal. In this report, that means weighing news tone against the Bearish technical blend (-0.489) and the lack of cross-horizon rank leadership (e.g., monthly #561 and yearly #578 out of 1425).
Negative / Risk Signals
The quantified news layer reports 0% negative items, so “risk signals” in this section are better framed as model-integrity and alignment risks rather than adverse headline pressure. The primary risk is a sentiment–price mismatch: the news model is bullish (normalized 1.00) while the technical blend is bearish (-0.489) and the DRL technical rank is deep in the lower decile (#1320 of 1425). In such cases, markets can remain range-bound as bullish narrative fails to translate into sustained bid, or they can break lower if negative momentum dominates and key supports fail. The framework’s explicit deterioration condition—a close below 6126.8390—becomes the higher-signal risk marker than any single article tone. Until momentum improves (e.g., MACD histogram recovering from -74.9971) or resistance is reclaimed, the bearish technical state remains the more binding constraint.
- Whether price holds 6126.8390 on a closing basis as momentum remains negative.
- Whether any upside attempt can clear 7444.5000 with confirming volume, consistent with the scenario view.
- Whether the technical blend (-0.489) begins converging toward ranks (e.g., daily #318) rather than diverging.
Sources referenced: Reuters, Bloomberg, Yahoo Finance, MarketWatch, Investing.com
Snapshot: AI Rank (Short–Mid–Long): Neutral (Neutral–Neutral–Neutral) · Technical Confluence: Bearish · Key Levels: Support ~6126.84 | Resistance ~7444.50 · News Sentiment: Neutral
7) Sources
Not available in the provided data.
You may also like: How KGNAI AI ranks instruments across global markets
Disclaimer: KGNAI provides AI-generated analytics and educational market commentary only. This is not financial advice. Markets involve risk. Always do your own research.