
SVN.IC — Sildarvinnslan Hf.(Iceland) | 01-Mar-2026 Technical Confluence Bullish, Rank Profile Mixed (Neutral Short-Term)
Sildarvinnslan Hf.(Iceland) (SVN.IC) is currently characterized by stronger mid-horizon relative positioning alongside a neutral near-term rank stance, a combination that often appears when price structure is constructive but short-term cross-sectional behavior is not decisively advantaged. Within KGNAI’s ranked universe of 1425 European instruments, SVN.IC shows notably stronger weekly-to-6-month ranks (including #10 over 6 months) while the daily rank sits near the mid-pack at #726. Technically, the signal stack is broadly constructive: the blended technical view is Bullish with an overall score of 0.778, supported by momentum measures such as RSI(14) at 65.93 and a positive MACD histogram at 0.08209. Volatility remains relatively contained, with Bollinger Bandwidth near 0.0350, making the 98.0000 support and 110.5000 resistance zones especially relevant for decision-making.
- Rank stance: Short-term Neutral | Mid-term Bullish | Long-term Neutral
- Technical confluence label: Bullish (Overall Technical Score 0.778; 18-signal confluence 0.722)
- Key levels: Support ~ 98.0000 | Resistance ~ 110.5000
- News sentiment bias: Neutral (avg sentiment 0.026; Neutral share 88%)
- Confirmation / invalidation: A sustained push above 110.5000 aligns with continuation framing; a close below 98.0000 increases deterioration risk per the scenario view.
What KGNAI Measures
KGNAI evaluates assets using large cross-sectional datasets built from millions of structured data points. Inputs incorporate fundamental metrics, technical structures, and systematically processed news sentiment. Statistical models, machine learning, and AI frameworks are used to assess relative positioning, signal alignment, and probabilistic behavior across broad universes.
How to Read This Report
- Ranks are comparative across the tracked universe, not absolute price targets.
- Confluence reflects alignment among independent signal groups.
- Support/resistance levels are probabilistic decision zones, not guarantees.
- Sentiment provides contextual bias within the broader analytical framework.
1) KGNAI AI Analysis
Region: EUROPE | Total universe size: 1425 ranked instruments
- Daily rank: #726 out of 1425 — Neutral
- Weekly rank: #32 out of 1425 — Bullish
- Monthly rank: #141 out of 1425 — Bullish
- 3-Monthly rank: #23 out of 1425 — Bullish
- 6-Monthly rank: #10 out of 1425 — Bullish
- Yearly rank: #616 out of 1425 — Neutral
The rank profile shows a time-horizon divergence: SVN.IC is neutral on the daily horizon (#726, roughly mid-universe), yet it screens in the upper decile on the 6-month horizon (#10) and remains strong across weekly (#32) and 3-month (#23) windows. That pattern is commonly associated with a market that has been behaving well over intermediate horizons, while short-term behavior is less distinct versus peers—often due to consolidation, mean reversion, or a brief participation pause.
KGNAI’s stated term view—Short-term Neutral, Mid-term Bullish, Long-term Neutral—is consistent with that divergence. The mid-term dominance suggests the instrument has maintained comparatively favorable characteristics (trend, momentum persistence, or participation stability) when evaluated against the broader set of 1425 instruments, while the long-term neutrality (yearly #616) implies the multi-quarter backdrop is not uniformly strong across regimes.
For positioning discipline, the practical implication is less about “direction” and more about regime confirmation: mid-term ranks can remain supportive even as daily ranks drift, but the signal quality typically improves when the daily rank begins to migrate toward the weekly/monthly strength cluster. Until that happens, the setup reads as constructive but not urgent—a market where confirmation matters more than anticipation.
2) Price & trend overview
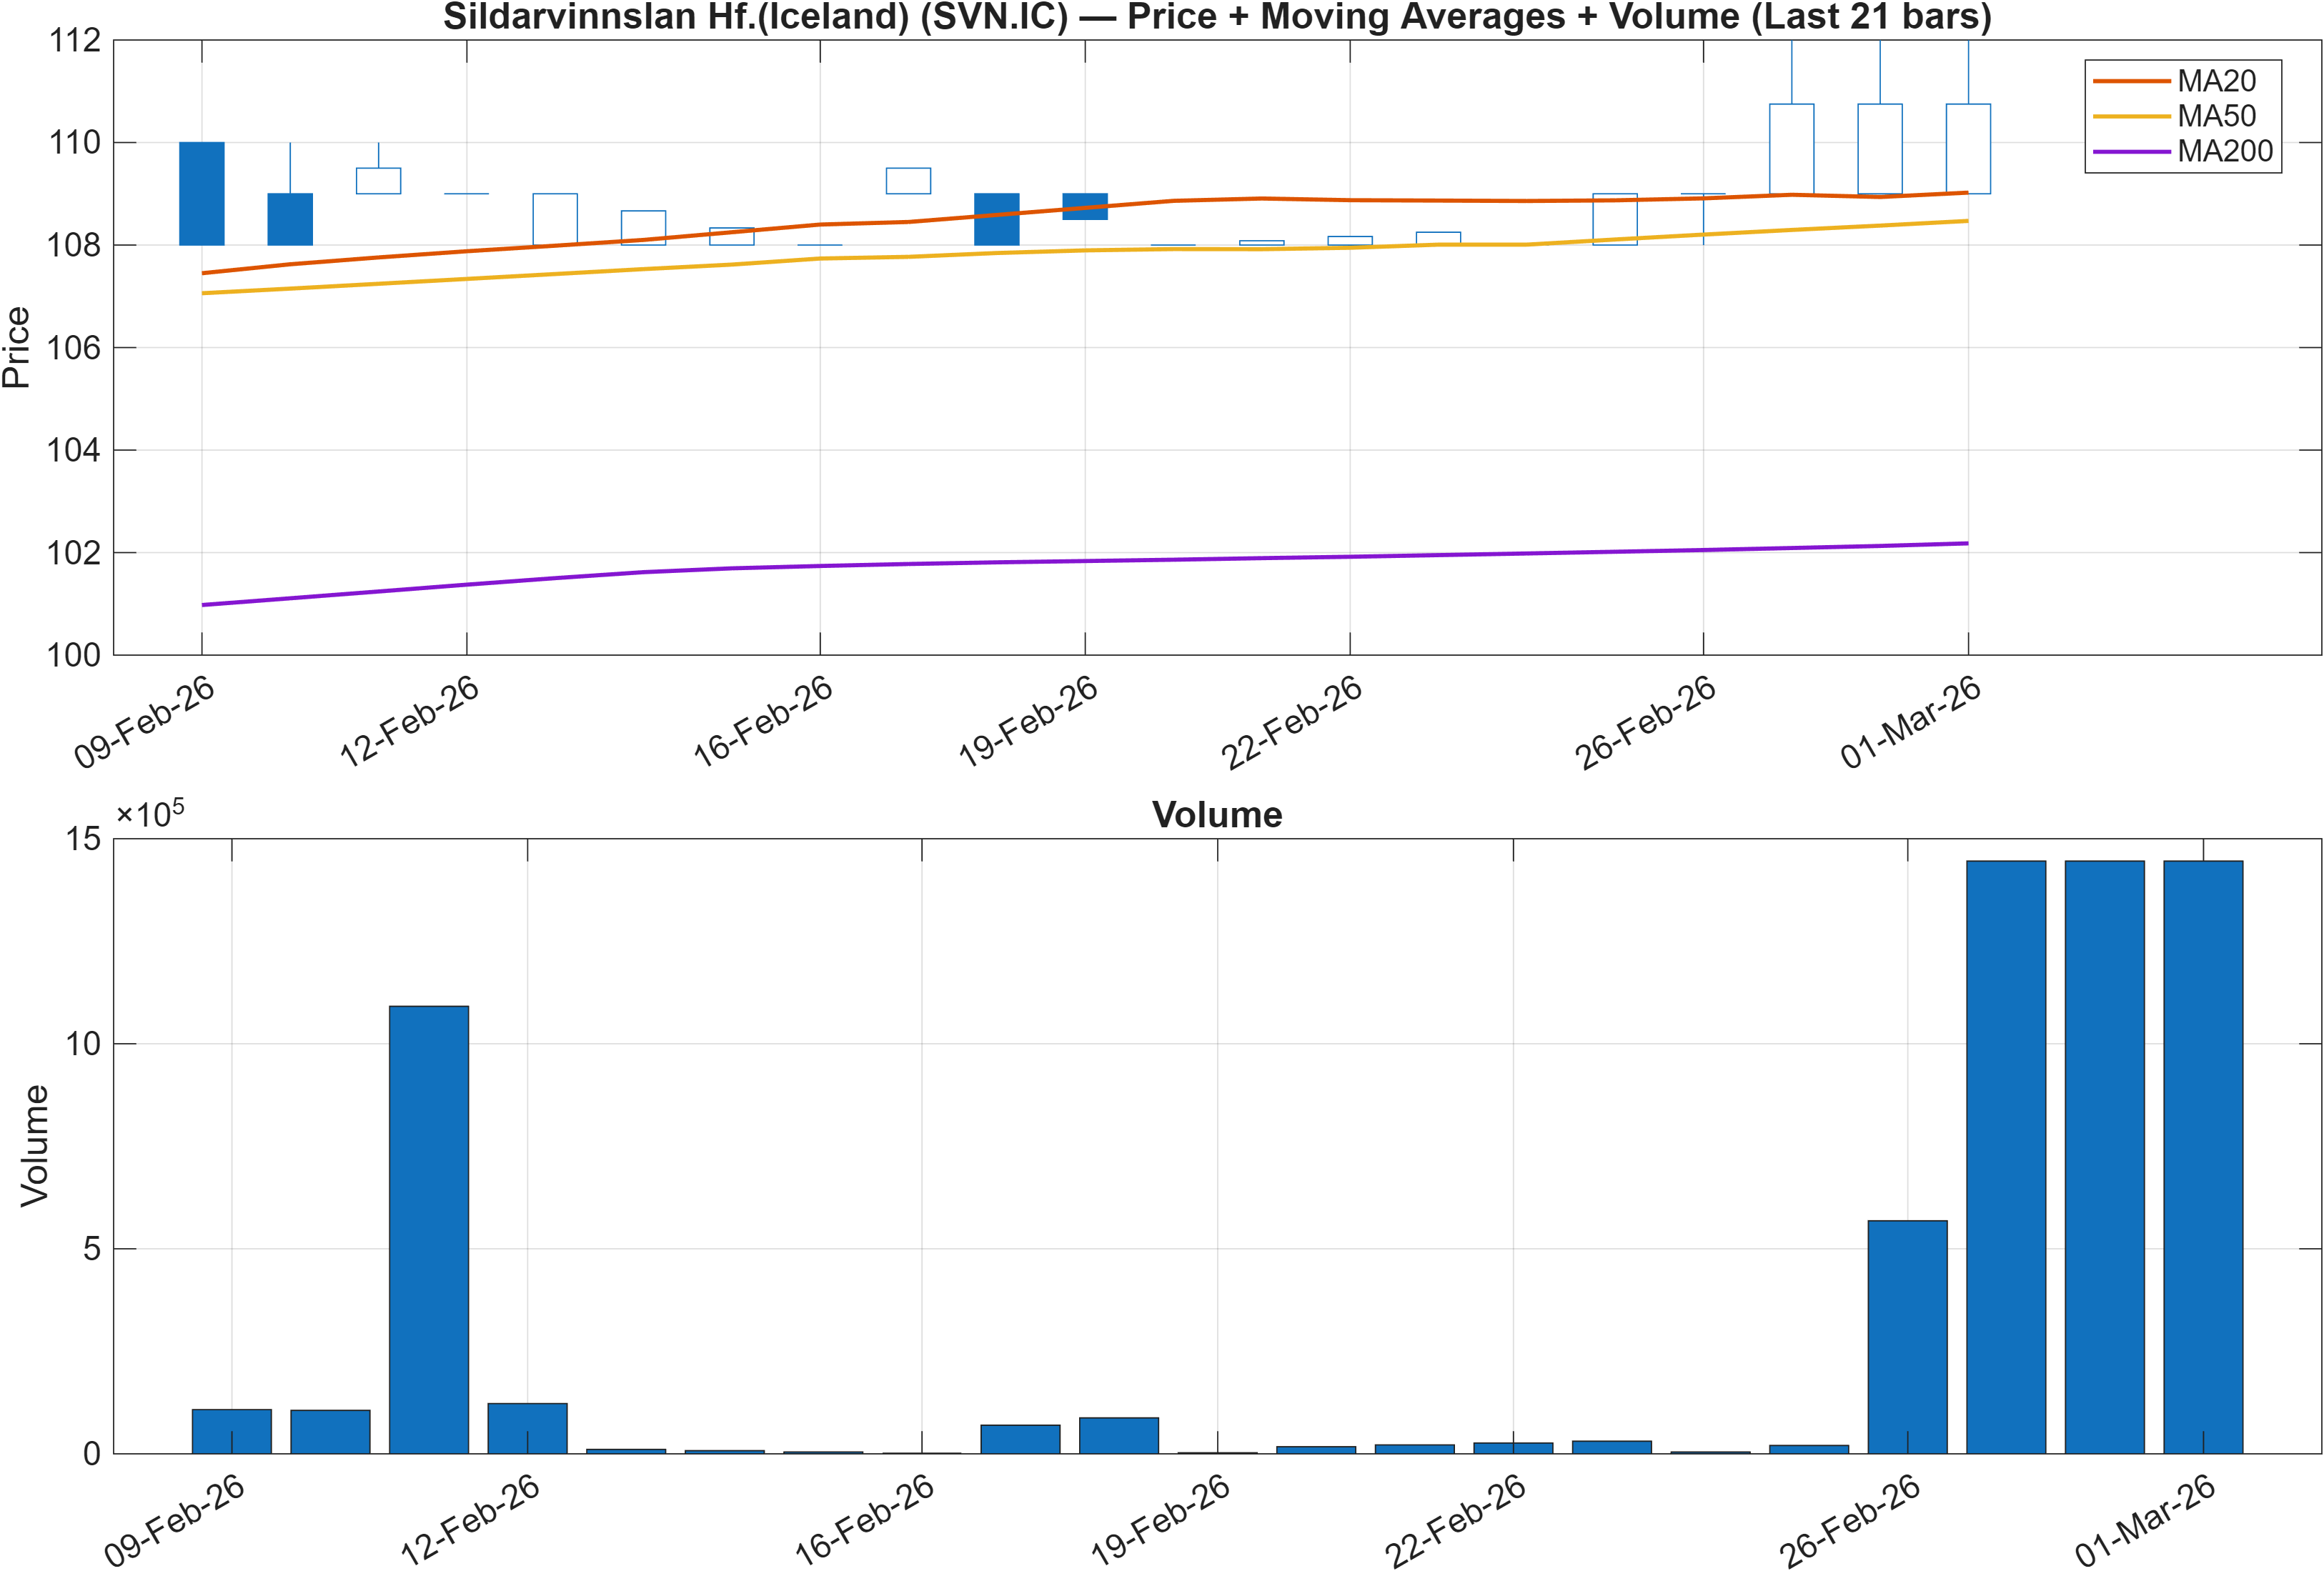
Interpretation: Close vs MA50 = Bullish, MA50 vs MA200 = Bullish.
Trend alignment vs timing risk
The moving-average structure is a clear point of alignment: price is above the MA50 and the MA50 is above the MA200, a configuration typically associated with an established uptrend rather than a fragile rebound. This is directionally consistent with the intermediate ranks (for example, #32 weekly and #10 over 6 months), which tend to reward trend persistence and orderly price behavior across a peer set.
The nuance is timing. A bullish MA stack can coexist with a neutral short-term rank (#726 daily) when the market transitions from expansion to digestion—i.e., trend remains intact, but the incremental edge in the most recent window is less pronounced across the universe. In those conditions, the support/resistance frame becomes more informative than the slope alone: the stated zones at 98.0000 and 110.5000 effectively bracket the range where trend continuation is confirmed versus where the trend thesis becomes more contested.
Volume is included in Figure 1, and while the report does not provide a numeric volume statistic in text, the broader technical stack later shows participation-sensitive measures leaning constructive (e.g., OBV slope(10) is bullish in the signal set). That combination—bullish trend structure with participation measures broadly aligned—typically reduces the probability that the MA configuration is purely lagging. Still, the daily neutrality argues for requiring price acceptance near resistance rather than assuming immediate follow-through.
3) Momentum & volatility dashboard
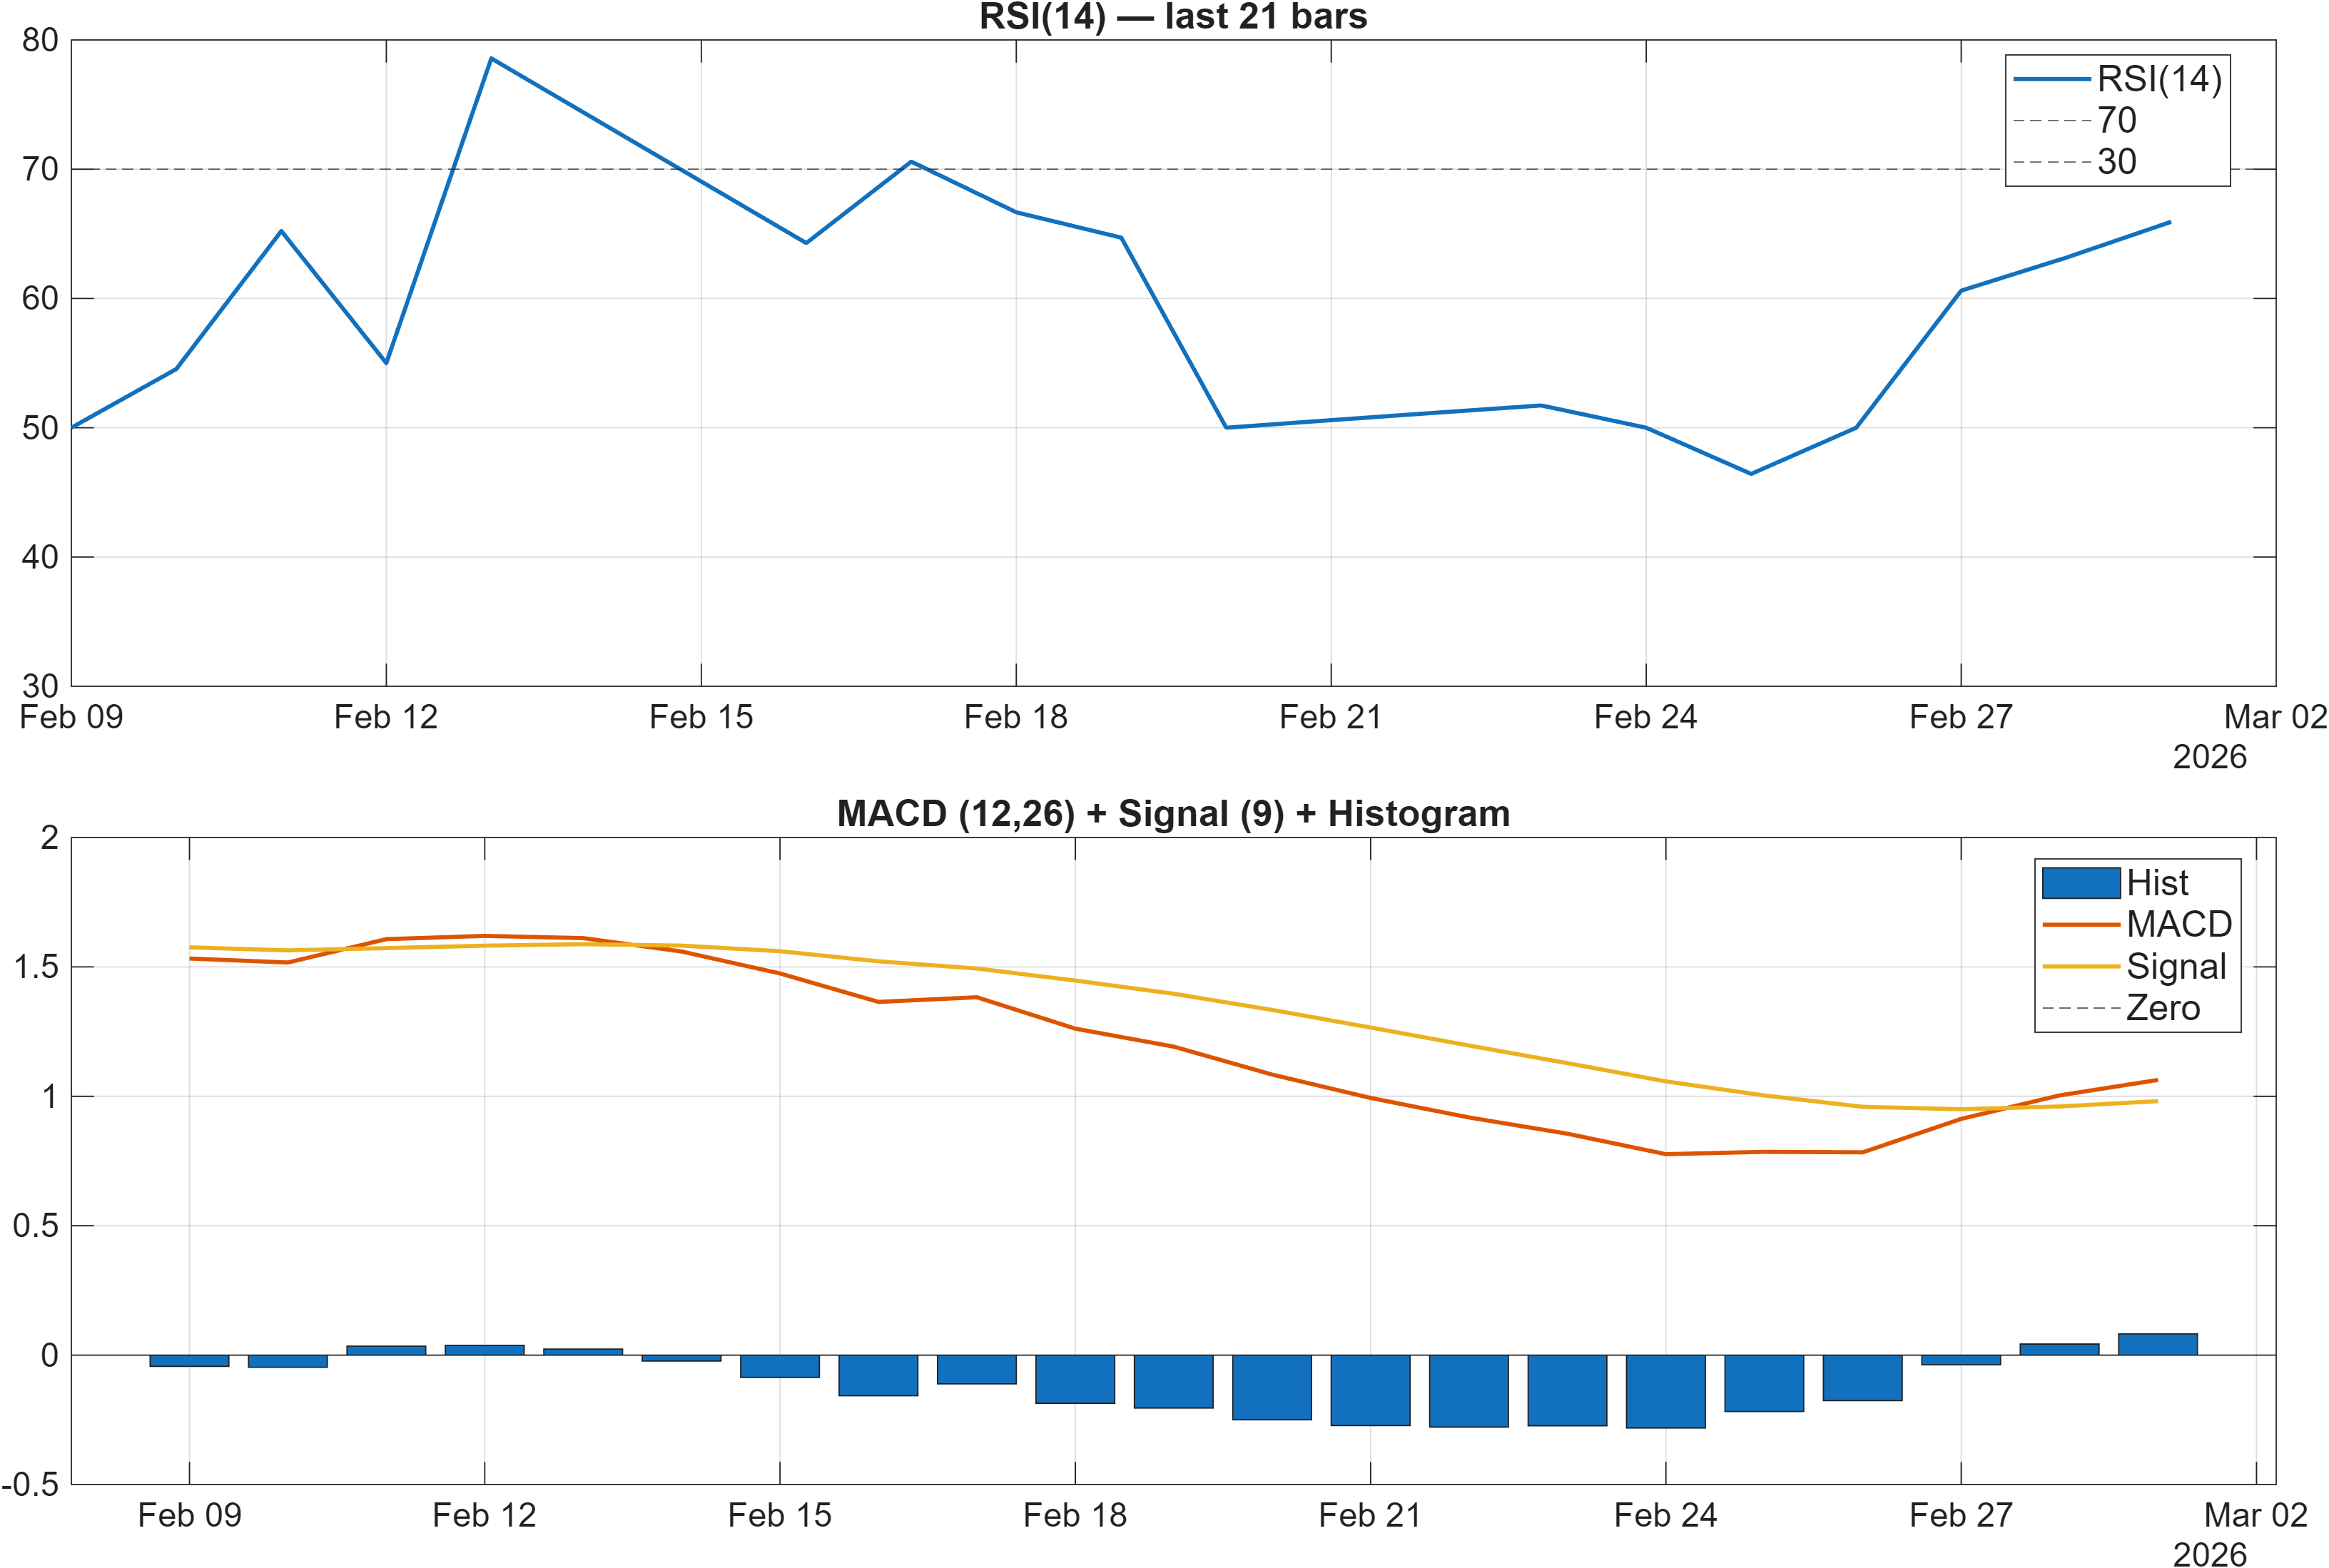
Interpretation: RSI bias = Bullish, MACD hist = 0.0821.
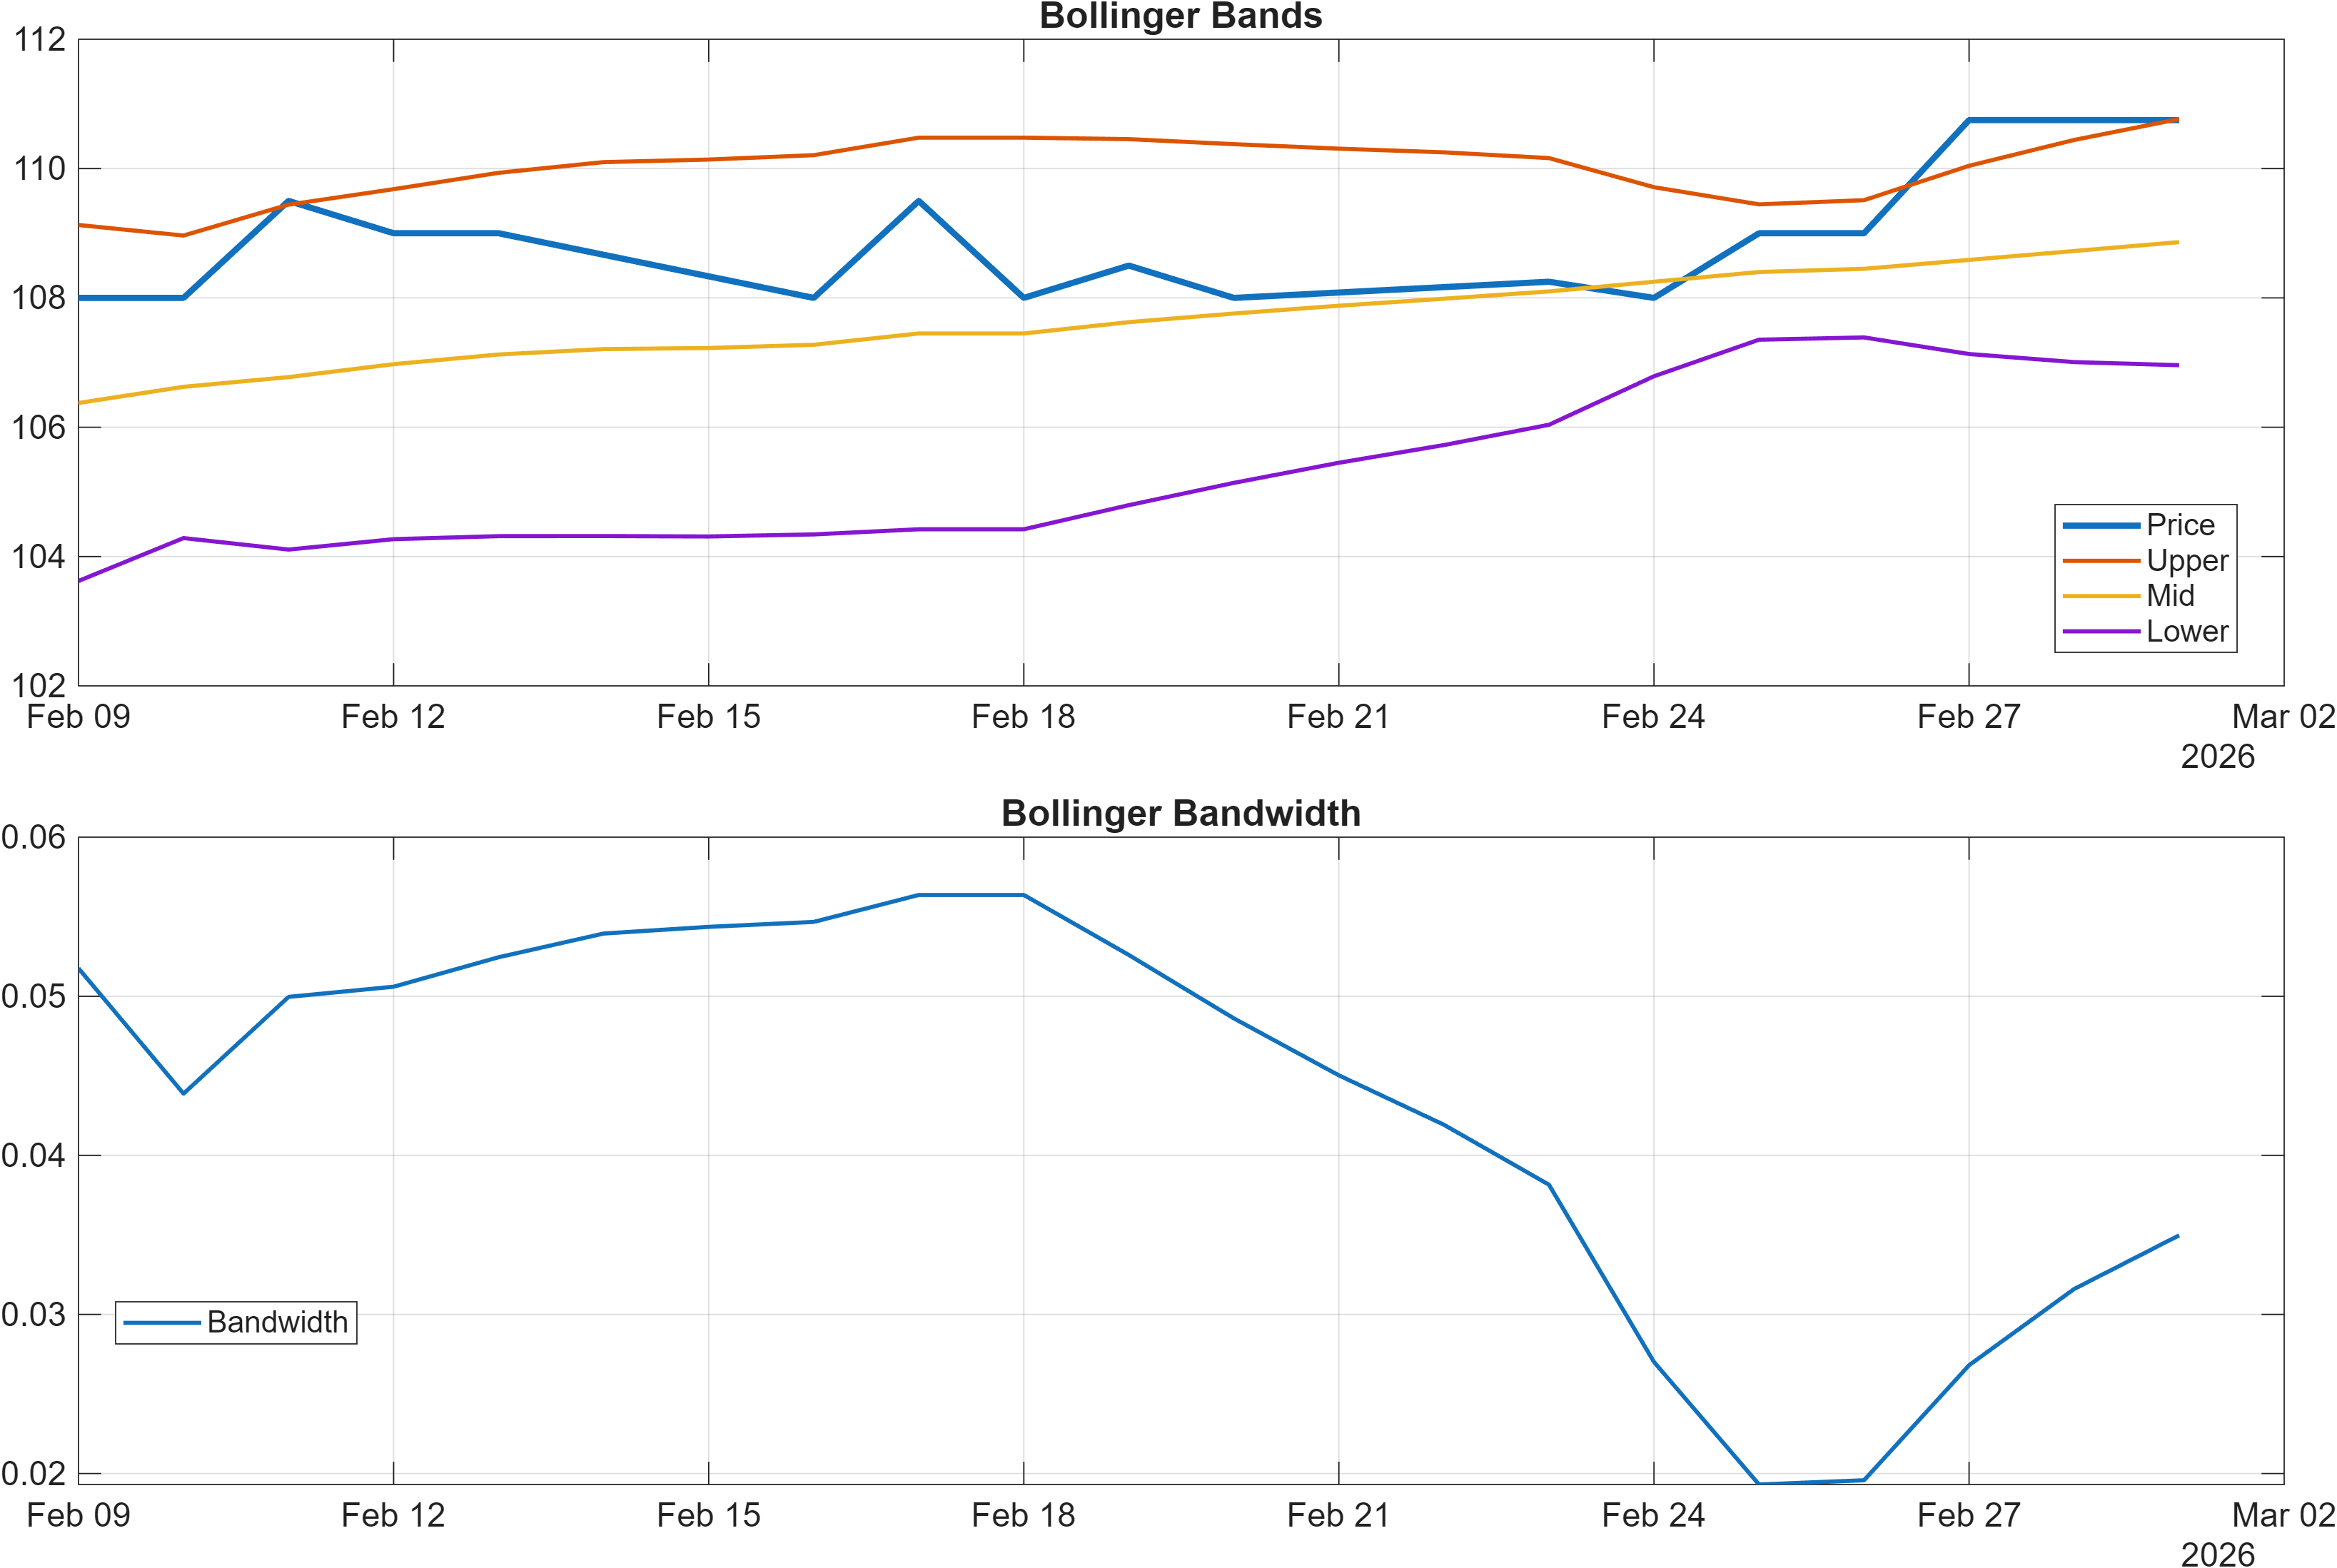
Interpretation: Bandwidth (volatility regime) latest = 0.0350.
Momentum persistence with contained volatility
Momentum indicators are leaning supportive without signaling an obvious volatility “blow-off.” RSI is flagged bullish and the signal table specifies RSI(14) at 65.93, which is consistent with positive momentum while not necessarily indicating an extreme condition. In parallel, MACD remains constructive, with a positive histogram reading (0.0821 in the dashboard; 0.08209 in the signal table), reinforcing that momentum is still net supportive rather than fading.
Volatility conditions look comparatively restrained. Bollinger Bandwidth is shown at 0.0350 (and 0.03497 in the signal table), suggesting a compressed-to-moderate volatility regime rather than wide dispersions. This matters for interpreting break levels: in lower bandwidth regimes, “breaks” can be more prone to false starts unless accompanied by participation confirmation, while successful expansions can also be more impactful once volatility re-prices.
The internal consistency across momentum and rate-of-change measures adds weight to the bullish technical read: ROC(20) at 2.546 and TS Mom(20) at 2.75 are both marked bullish, indicating that strength is present across different constructions of momentum (price change vs time-series momentum frameworks). The one explicit caution inside the 18-signal set is that not all volatility inputs agree—Chaikin Vol at 132.3 is labeled bearish—implying that volatility-of-flow or range dynamics may not be uniformly supportive even as directional momentum remains positive.
4) Support / Resistance zones
Support ~ 98.0000 | Resistance ~ 110.5000
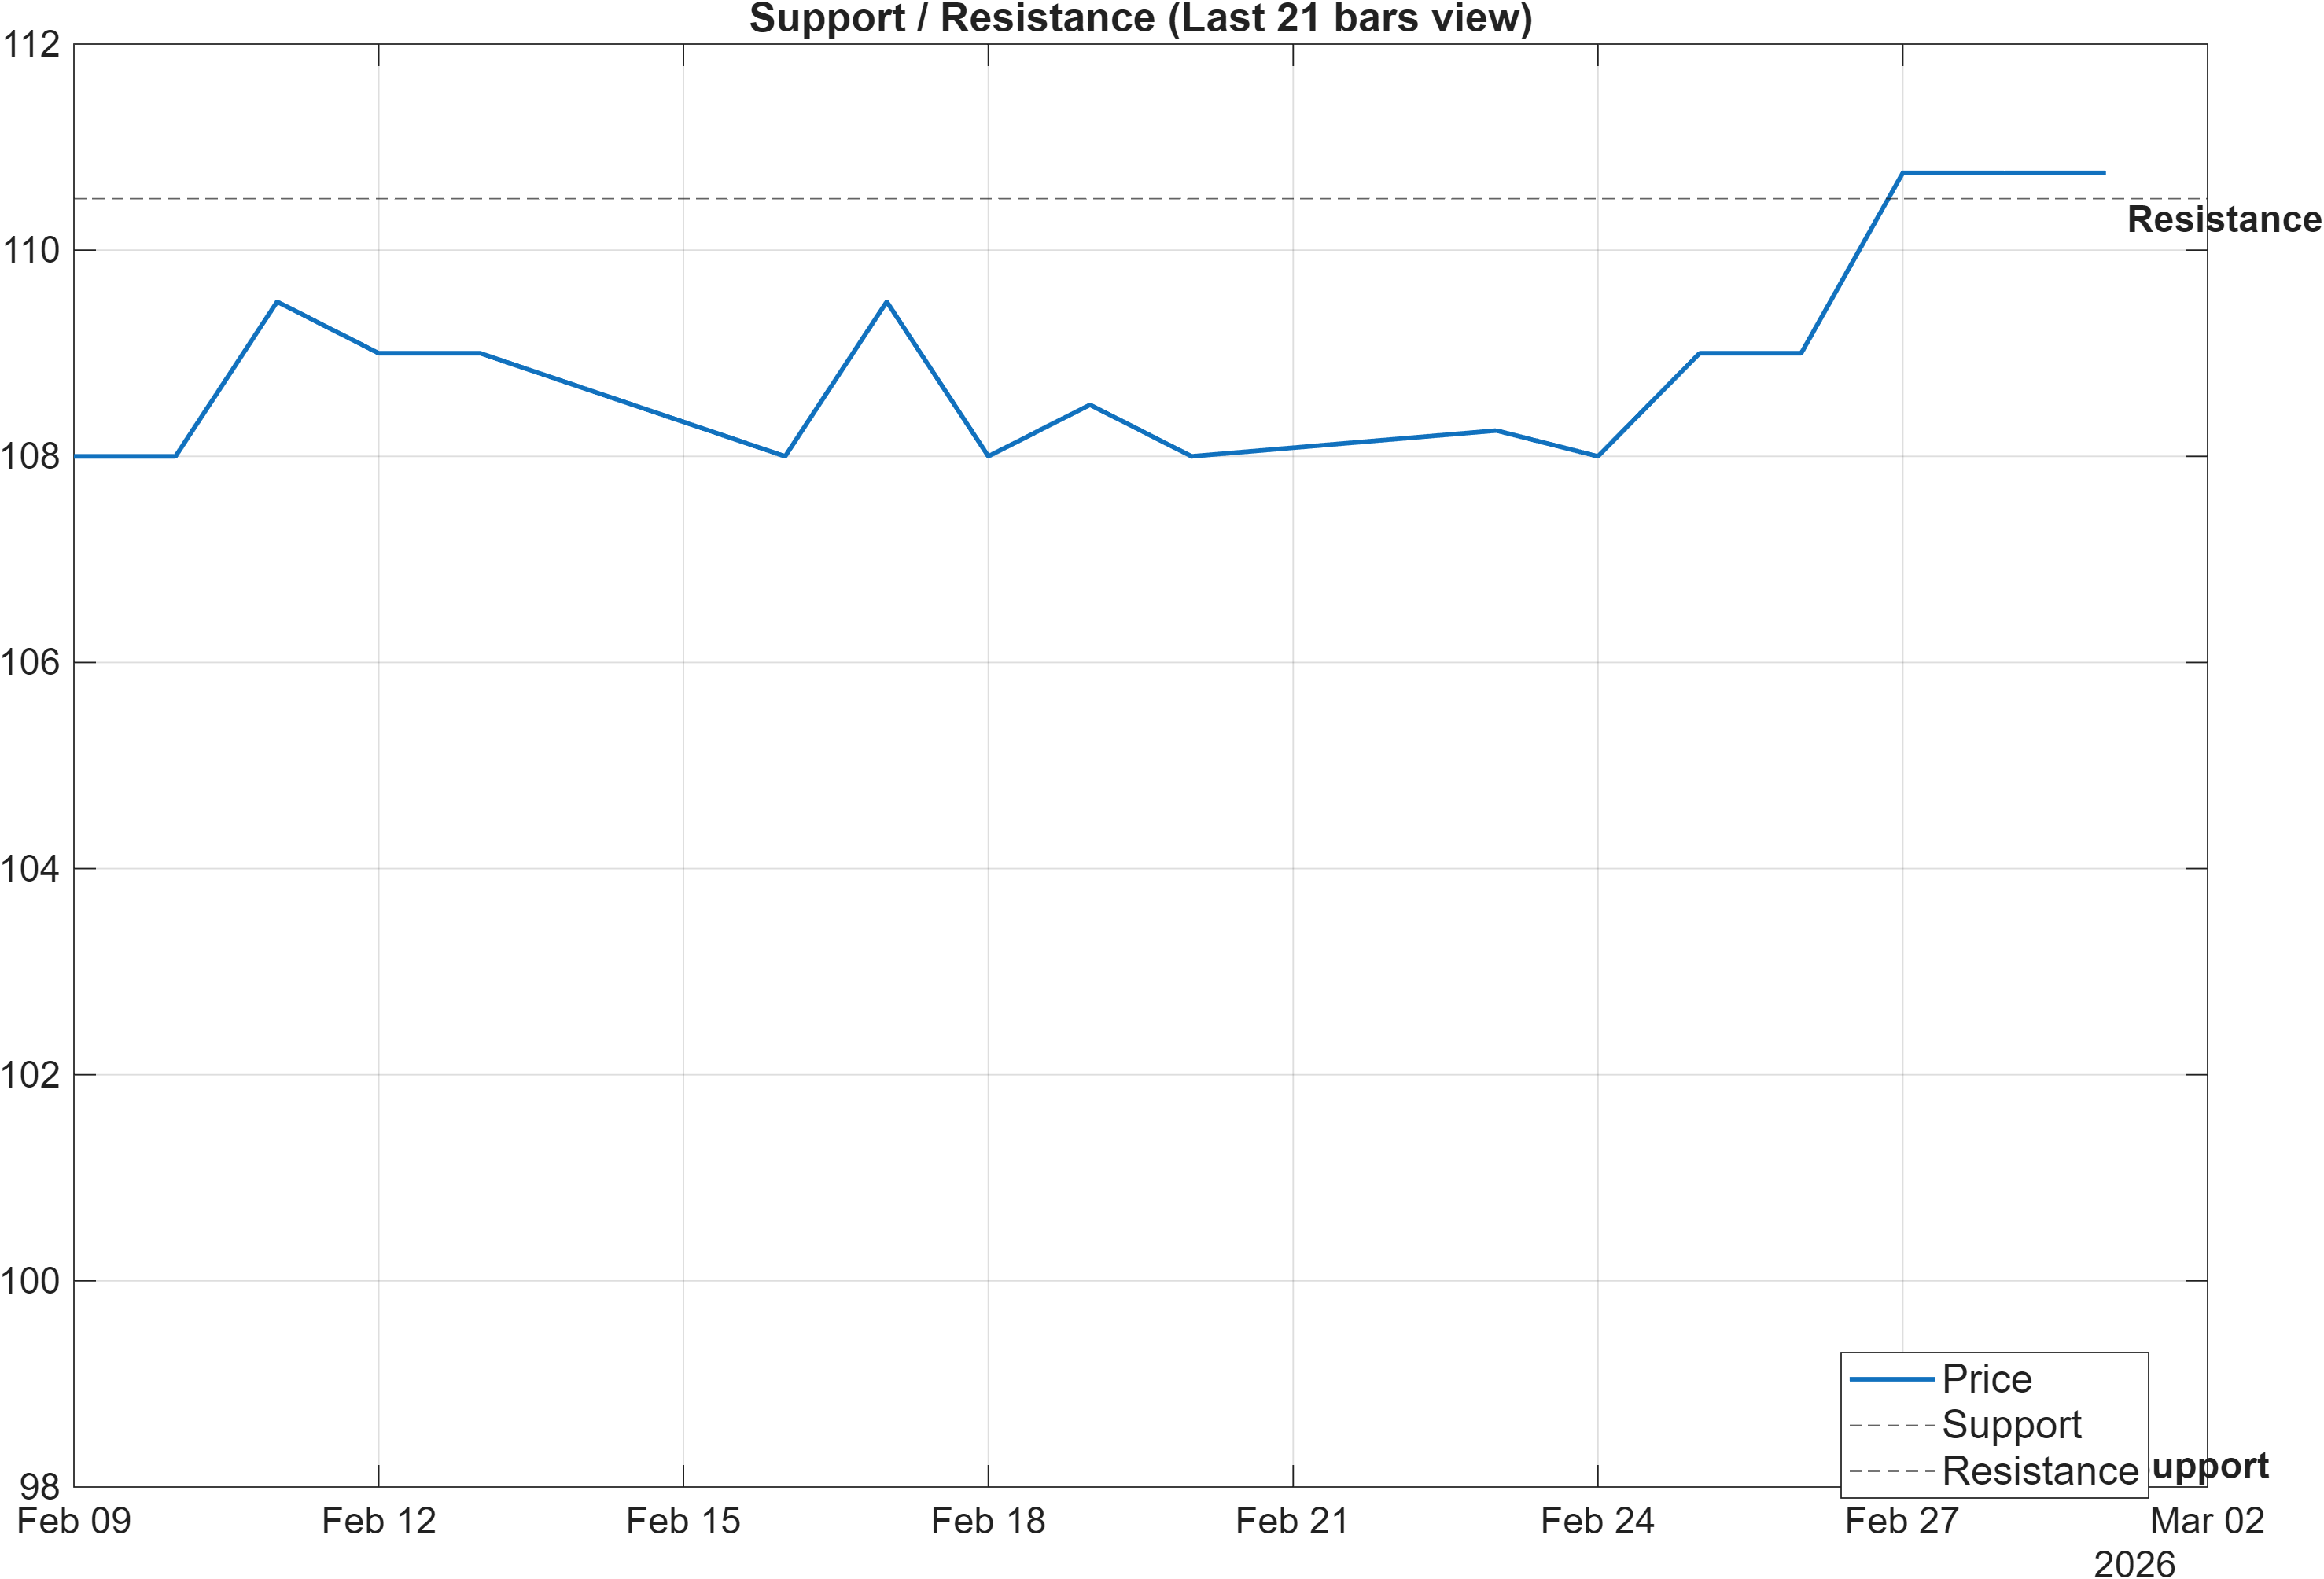
Scenario view: Break above resistance with volume → continuation. Close below support → signal deterioration risk.
Decision zones and regime validation
The 98.0000 support and 110.5000 resistance zones define a clean probabilistic decision frame. With the trend structure bullish (close above MA50; MA50 above MA200) and momentum constructive (RSI bullish; MACD histogram positive), the primary analytical question becomes whether the market can convert resistance into acceptance rather than merely tagging it.
The scenario language explicitly elevates volume as the qualifier for a resistance break. That emphasis is coherent with the indicator mix: participation-oriented slopes are broadly bullish in the signal set (e.g., OBV slope(10) and AD Line slope(10) are bullish), but the daily rank remains neutral at #726. When ranks lag the technical stack, it often means the market needs a clearer “event” in price/participation terms to become distinctive versus peers. A confirmed break is one such event; a failed break can keep the instrument in a neutral short-term bucket despite mid-term strength.
On the downside, the report’s deterioration condition is unambiguous: a close below 98.0000 would conflict with the supportive technical confluence (0.722) and the bullish blended technical score (0.778). In that case, the technical stack would likely begin to transition from alignment to divergence—momentum could remain positive briefly, but the price structure would be undermined, raising the bar for a rapid recovery.
5) Quant Technical Dashboard (18 Signals)
KGNAI AI Technical Analysis Score (Deep Reinforcement Learning): Rank #65 out of 1425 (Rank 1 represents the strongest technical positioning and a higher probability of favorable price behavior. As ranks increase toward the maximum, the probability of favorable outcomes weakens and bearish positioning becomes more dominant.) | Label: Bullish | Score: 0.909
18-Signal Technical Confluence Score: 0.722 (Bullish)
Overall Technical Score (18-signal confluence + DRL rank blend): 0.778 (Bullish)
Note: The blended score reflects signal strength weighted against broader AI technical ranking, which may temporarily diverge.
Blended technical score breakdown: 0.778 (Bullish | Bull 14 / Bear 1 / Neutral 3)
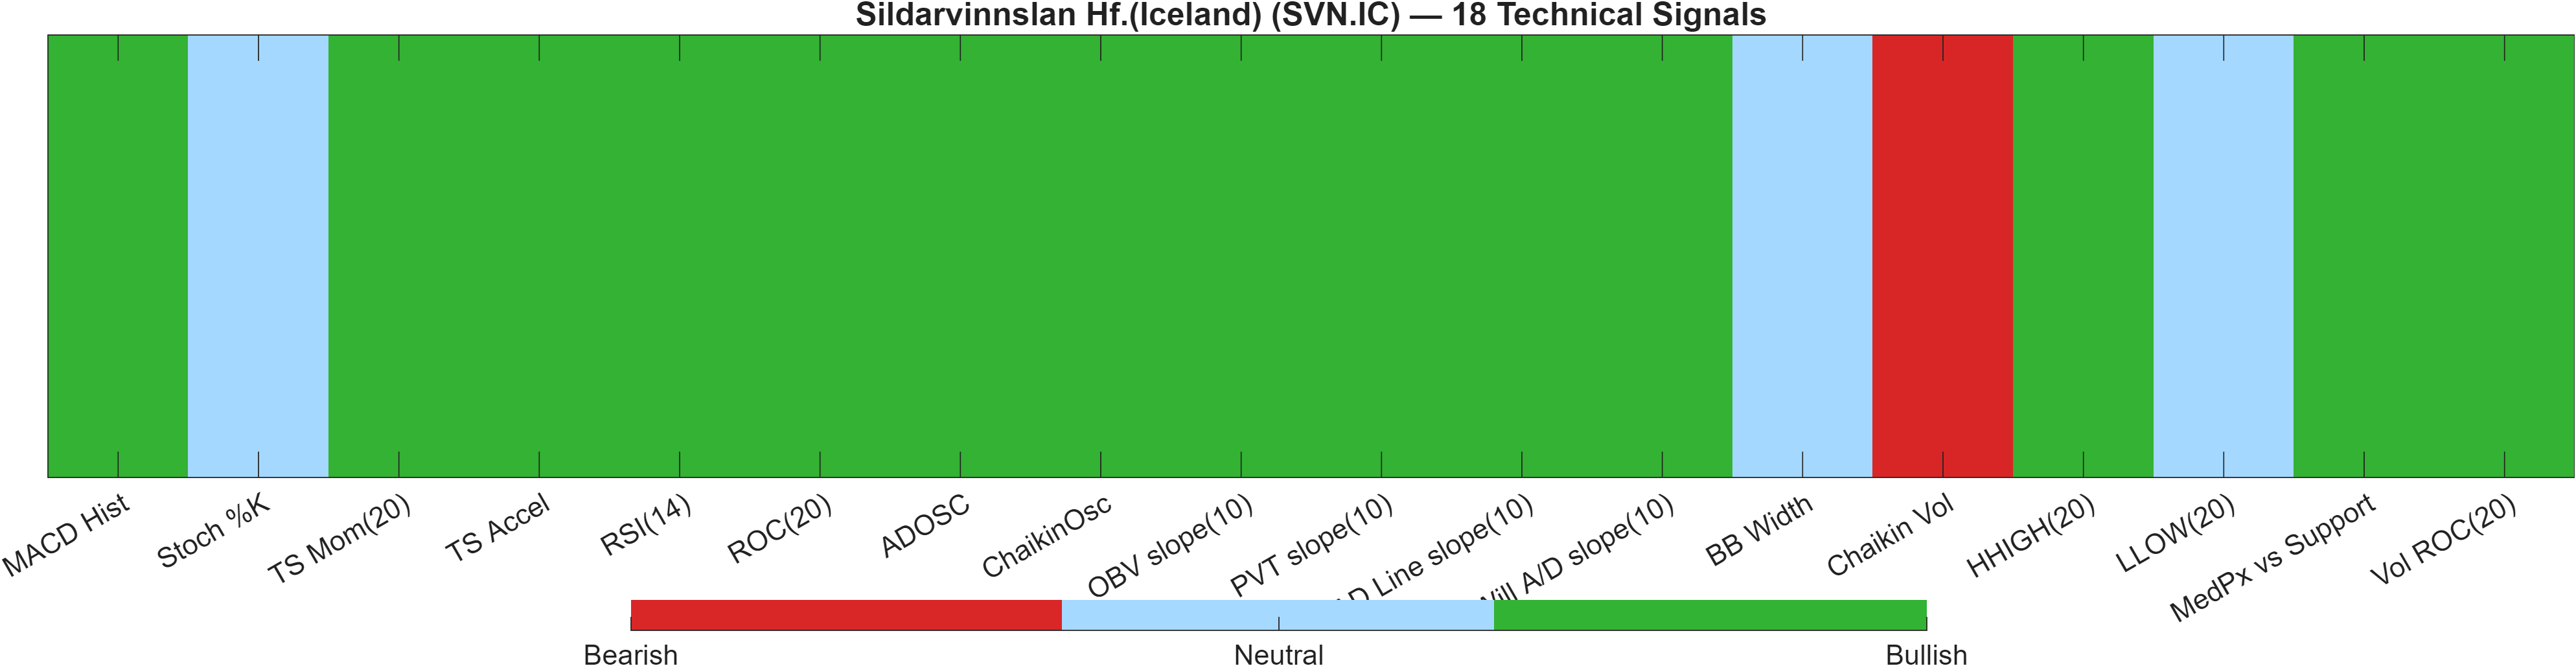
Signal table (Bull/Bear/Neutral)
| Indicator | Value | Signal |
|---|---|---|
| MACD Hist | 0.08209 | Bullish |
| Stoch %K | 68.75 | Neutral |
| TS Mom(20) | 2.75 | Bullish |
| TS Accel | 1.25 | Bullish |
| RSI(14) | 65.93 | Bullish |
| ROC(20) | 2.546 | Bullish |
| ADOSC | 79.17 | Bullish |
| ChaikinOsc | 4.408e+05 | Bullish |
| OBV slope(10) | 1.523e+06 | Bullish |
| PVT slope(10) | 2.337e+04 | Bullish |
| AD Line slope(10) | 1.39e+06 | Bullish |
| Will A/D slope(10) | 2.5 | Bullish |
| BB Width | 0.03497 | Neutral |
| Chaikin Vol | 132.3 | Bearish |
| HHIGH(20) | 112 | Bullish |
| LLOW(20) | 108 | Neutral |
| MedPx vs Support | 12.5 | Bullish |
| Vol ROC(20) | 1264 | Bullish |
Interpretation: Indicator-level signals form the base confluence, which is then adjusted using a separate AI-driven technical ranking model. The final technical score summarizes this combined view.
Confluence strength vs model divergence risk
The technical layer is unusually cohesive: the 18-signal confluence is 0.722 (Bullish) and the blended overall technical score is 0.778 (Bullish), with Bull 14 / Bear 1 / Neutral 3. That breadth reduces reliance on any single indicator and supports the interpretation that the trend/momentum posture is not narrowly constructed.
The Deep Reinforcement Learning technical rank (#65 out of 1425) and score (0.909) place SVN.IC in the upper tier on the model’s technical positioning framework, reinforcing the idea that the technical state is favorable in cross-sectional terms. This contrasts with the daily overall rank (#726) from Section 1, highlighting a key analytical tension: technical setup looks strong, but short-window relative behavior is not yet confirming.
Inside the indicator set, the bullish backbone is largely momentum and participation aligned: MACD Hist 0.08209, RSI(14) 65.93, and Vol ROC(20) 1264 are all bullish, while BB Width 0.03497 is neutral, consistent with a market that is constructive but not in a volatility expansion phase. The lone bearish print—Chaikin Vol 132.3—suggests monitoring whether volatility-of-flow begins to normalize; if it does not, it can be a subtle constraint on breakout reliability near 110.5000.
6) News sentiment + extractive gist
Note: Instrument-specific news matches were not found, so the digest includes broader market/sector headlines. Links are provided for verification.
Sentiment score (avg): 0.026 | Positive: 12% | Neutral: 88% | Negative: 0%
KGNAI AI News Sentiment Score (normalized -1 to +1): Not available (as of —) | Label: Not available | Overall news score: 0.03
Positive Developments
Recent coverage across major financial outlets indicates a backdrop that is not overtly risk-on, but also not uniformly destabilizing from a market-impact perspective. The sentiment mix is dominated by neutral classification (88%) with a smaller positive share (12%), consistent with a tape where macro narratives are being processed rather than decisively re-priced. Constructive elements in the digest reflect themes such as policy support expectations and the potential for energy-market stabilization measures, which can help limit volatility spillovers into broader equities. For SVN.IC, this matters less as a direct fundamental driver (instrument-specific matches were not found) and more as an ambient risk filter that can influence correlation regimes and liquidity appetite. With the technical posture already bullish (overall technical score 0.778), a stable macro-news tone can make it easier for price to respect technical levels and for momentum (e.g., RSI(14) 65.93) to persist without sharp mean-reversion shocks.
Neutral / Mixed Developments
The dataset’s sentiment average (0.026) sits close to flat, which is consistent with mixed messaging and a market that is attempting to balance cross-currents rather than repricing a single dominant thesis. Neutral-labeled items dominate, reinforcing the idea that many headlines are being treated as informational rather than catalytic. In practice, such an environment can coincide with volatility compression—a condition also reflected in Bollinger Bandwidth near 0.0350—where price moves become more dependent on technical triggers (support/resistance) and less dependent on incremental news flow. That dynamic tends to elevate the importance of confirmation around the 110.5000 resistance zone and the durability of the 98.0000 support level. Absent instrument-specific news, the central takeaway is contextual: the sentiment backdrop is not providing a strong directional impulse, leaving technical structure as the primary decision tool.
Negative / Risk Signals
While the sentiment breakdown shows 0% negative classification in the provided mix, the narrative content in the broader digest includes elevated geopolitical risk themes, which can introduce episodic volatility even when aggregate scoring remains neutral. This is a common limitation of headline-level aggregation: markets can remain “neutral” on average while still being exposed to tail-risk repricing during specific events. For SVN.IC, the key analytical point is how such shocks would interact with the current technical state—bullish momentum (MACD histogram 0.08209) and a supportive moving-average configuration can remain intact through moderate pullbacks, but a disorderly move that forces a close below 98.0000 would directly challenge the deterioration threshold described in Section 4. In short, the risk is less about sentiment direction and more about whether exogenous volatility temporarily overrides the otherwise constructive technical alignment.
What to monitor next
- Whether price action can sustain acceptance above 110.5000 alongside improving short-term rank behavior versus peers (daily rank currently #726).
- Whether volatility remains contained (Bandwidth near 0.0350) or begins to expand, changing the reliability of breakout/mean-reversion dynamics.
- Whether downside tests remain above 98.0000, preserving the bullish confluence (0.722) and overall technical score (0.778).
Sources referenced: Reuters, Bloomberg, Yahoo Finance, MarketWatch, Investing.com
7) Sources
The original source list and links were provided in the base draft. In this publication format, the news section is summarized to emphasize sentiment regime and monitoring items rather than reproducing headline lists.
You may also like: How KGNAI AI ranks instruments across global markets
Disclaimer: KGNAI provides AI-generated analytics and educational market commentary only. This is not financial advice. Markets involve risk. Always do your own research.