
BBVA.MC — Banco Bilbao Vizcaya Argentaria SA (Spain) on 20-Mar-2026: Neutral ranks with mixed technical alignment
Banco Bilbao Vizcaya Argentaria SA (Spain) (BBVA.MC) is currently priced in a market phase where the cross-horizon KGNAI rank set remains Neutral, while classical trend structure shows bearish moving-average alignment. The Daily rank (#624 out of 1423) and Weekly rank (#673) sit near the middle of the tracked European universe, indicating neither broad relative leadership nor clear relative stress. Technically, the 18-signal framework is also Neutral (confluence 0.111; blended score 0.182), but the internal composition—Bull 8 / Bear 6 / Neutral 4—suggests a market that is not one-sided. Momentum is similarly split: MACD histogram is positive (0.0161), yet RSI(14) at 41.89 leans toward softer participation. Volatility remains contained with Bollinger Bandwidth at 0.0889, increasing the importance of defined decision zones. Key levels are Support ~17.7325 and Resistance ~21.6767, while news sentiment skews constructive (avg 0.168; 38% positive vs 12% negative).
- Rank stance (Short / Mid / Long): Neutral / Neutral / Neutral (Daily #624, Weekly #673, Yearly #307 out of 1423)
- Technical confluence label: Neutral (18-signal confluence 0.111; blended score 0.182)
- Key levels: Support ~17.7325; Resistance ~21.6767
- News sentiment bias: Bullish (avg 0.168; 38% positive / 12% negative; normalized 1.00 as of 2026-01-07)
- Confirmation / invalidation condition: A break above 21.6767 with volume supports continuation; a close below 17.7325 increases deterioration risk
What KGNAI Measures
KGNAI evaluates assets using large cross-sectional datasets built from millions of structured data points. Inputs incorporate fundamental metrics, technical structures, and systematically processed news sentiment. Statistical models, machine learning, and AI frameworks are used to assess relative positioning, signal alignment, and probabilistic behavior across broad universes.
How to Read This Report
- Ranks are comparative across the tracked universe, not absolute price targets.
- Confluence reflects alignment among independent signal groups.
- Support/resistance levels are probabilistic decision zones, not guarantees.
- Sentiment provides contextual bias within the broader analytical framework.
1) KGNAI AI Analysis
Region: EUROPE | Total universe size: 1423 ranked instruments
- Daily rank: #624 out of 1423 — Neutral
- Weekly rank: #673 out of 1423 — Neutral
- Monthly rank: #409 out of 1423 — Neutral
- 3-Monthly rank: #935 out of 1423 — Neutral
- 6-Monthly rank: #383 out of 1423 — Neutral
- Yearly rank: #307 out of 1423 — Neutral
Cross-horizon positioning: balanced, not leadership
BBVA.MC’s rank profile is internally consistent: Neutral across every reported horizon, with the Yearly rank at #307 sitting in the upper portion of the universe relative to the Daily/Weekly readings, while the 3-Monthly rank at #935 flags a weaker intermediate stretch. This dispersion—stronger longer-horizon standing alongside softer 3‑month relative positioning—often coincides with a market transitioning from trend persistence to consolidation, rather than a clean continuation regime.
The Monthly rank at #409 and 6-Monthly rank at #383 cluster closer to the upper quartile boundary, but do not reach a threshold typically associated with clear relative leadership. Meanwhile, Daily #624 and Weekly #673 indicate that near-term behavior is more “market-like” than “idiosyncratic,” which increases the value of confirming price action with participation and level behavior rather than relying on rank inflections alone.
Term view remains Neutral (Short/Mid/Long), so the analytical burden shifts to whether price can reclaim trend structure (moving averages and resistance) and whether internal breadth signals (volume-flow and momentum) can stabilize. Where ranks are flat, invalidation discipline becomes central: risk management should be framed around level breaks rather than narrative conviction.
2) Price & trend overview
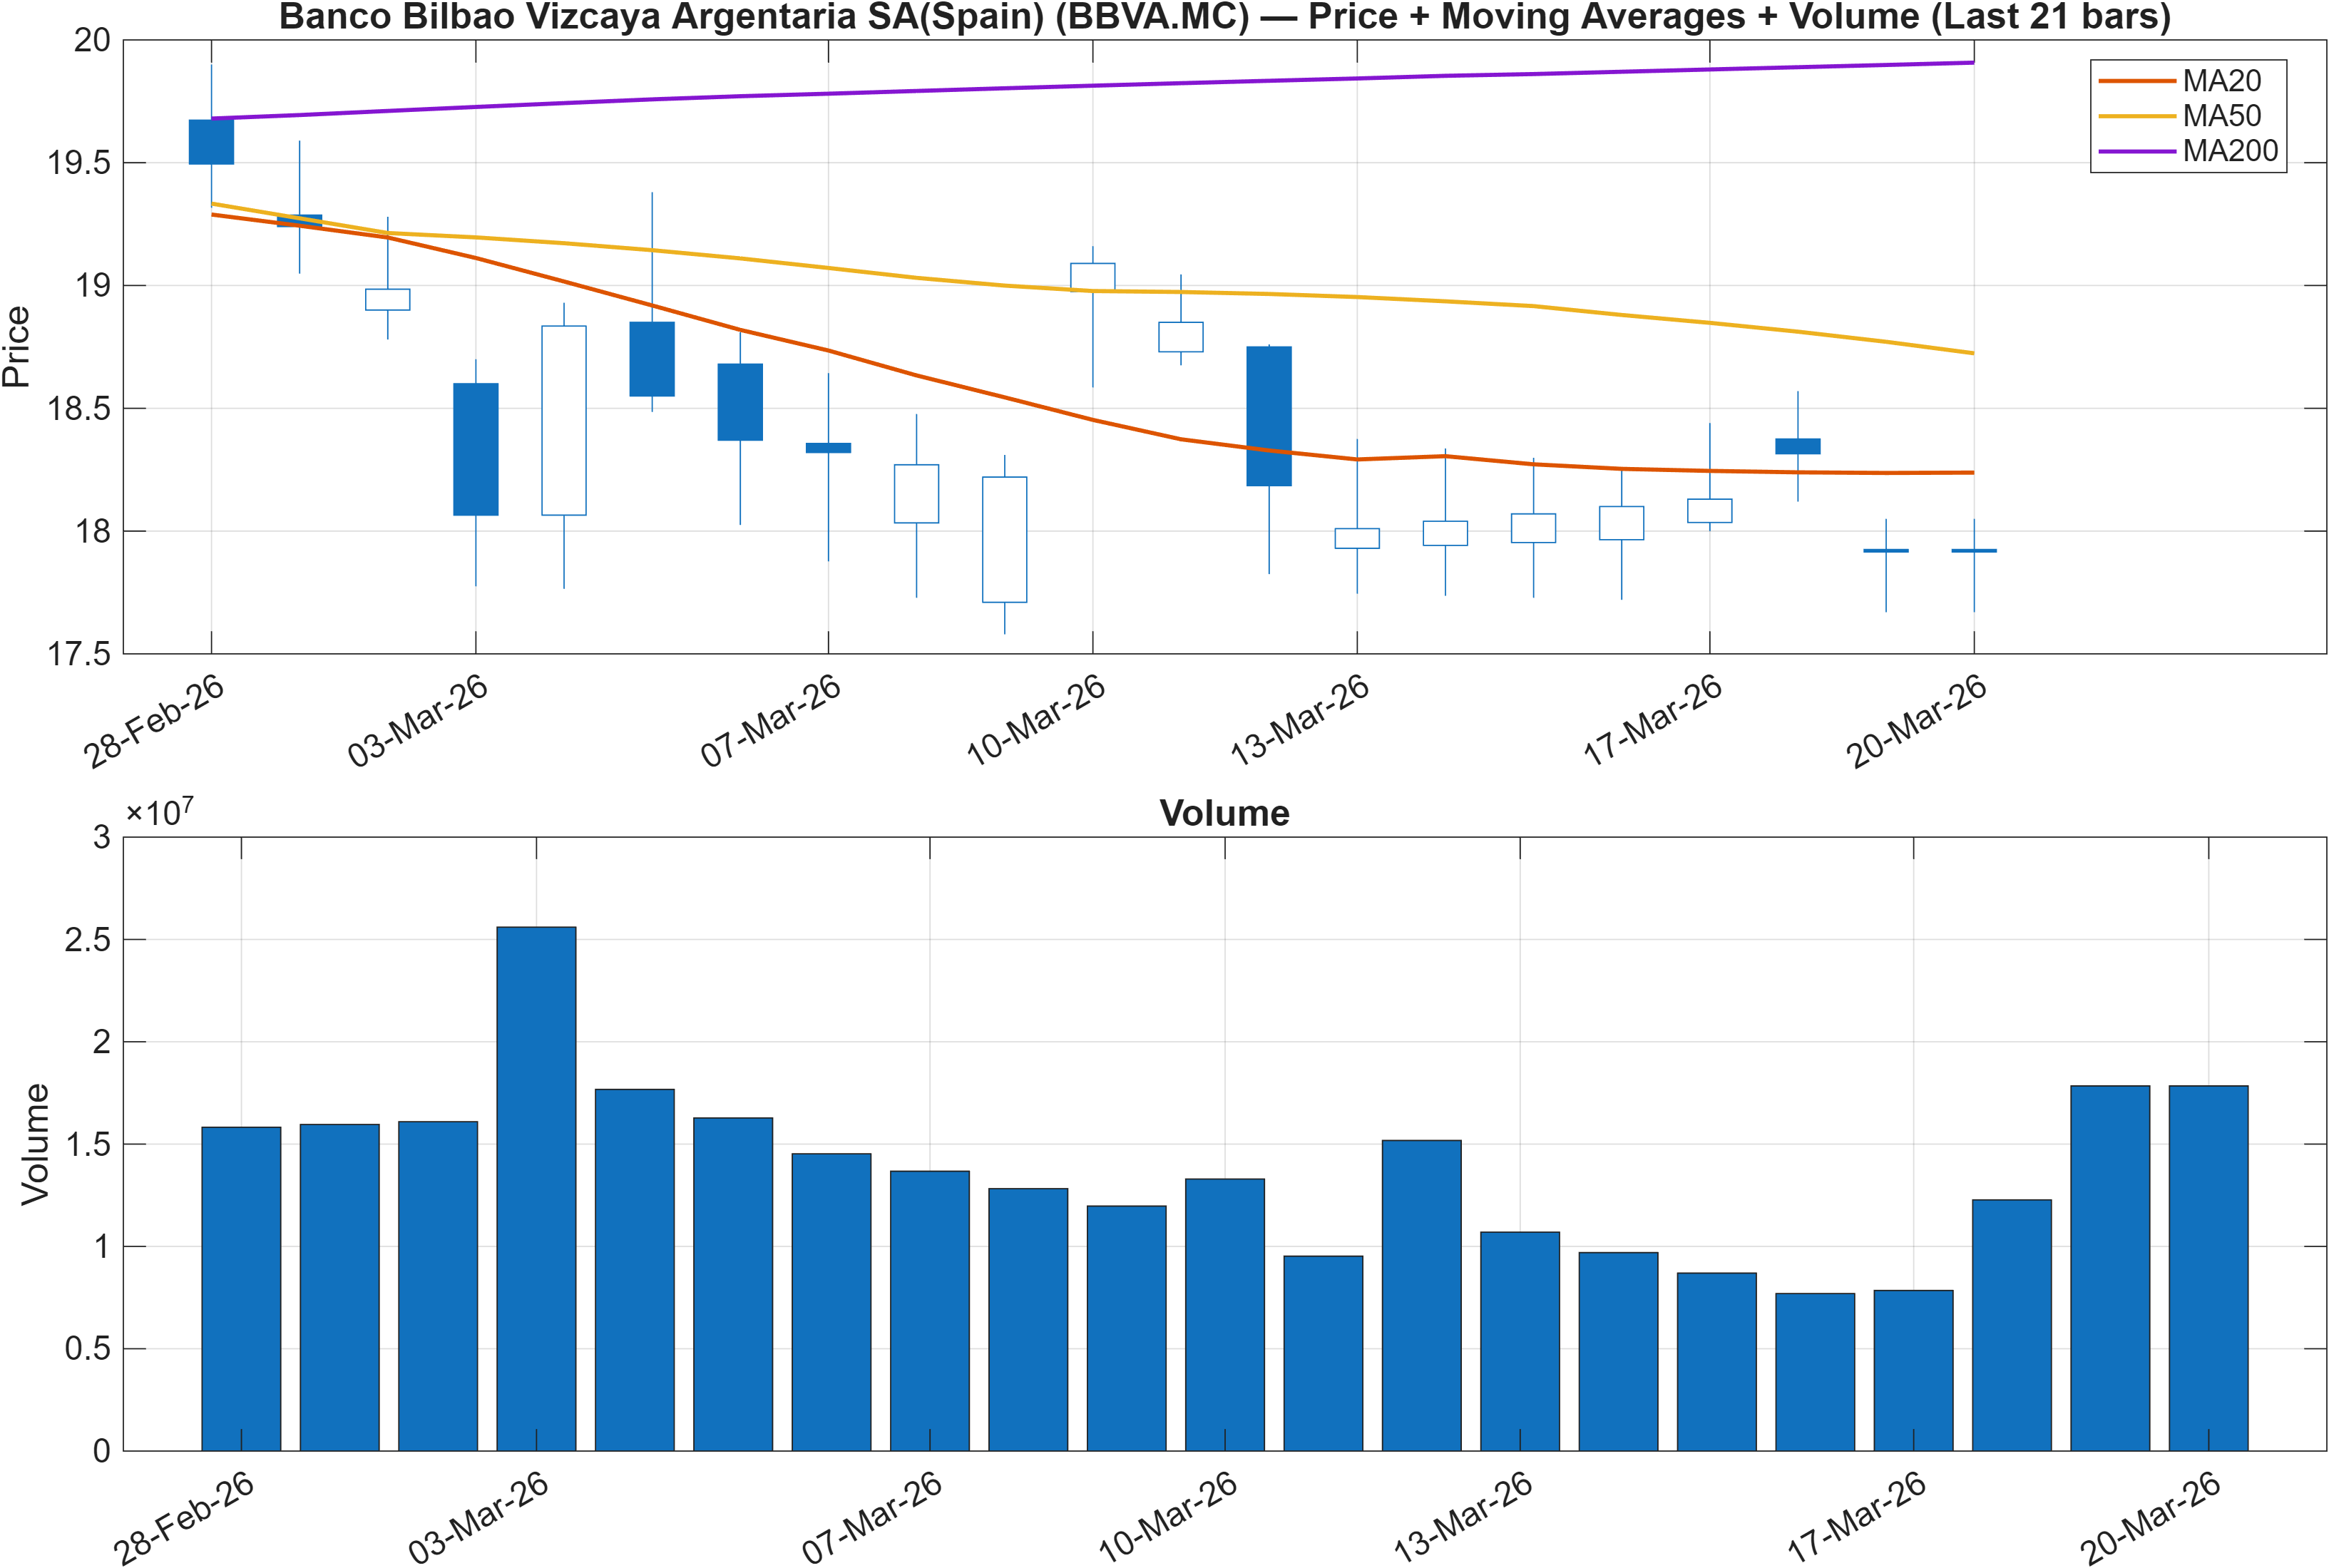
Interpretation: Close vs MA50 = Bearish, MA50 vs MA200 = Bearish.
Trend structure: bearish alignment, awaiting reversal proof
The moving-average configuration is unambiguous: price is below the MA50 and the MA50 is below the MA200, a combination that typically defines a bearish trend template. In this setting, rallies often need additional confirmation—either improving momentum or supportive volume-flow—because moving averages can act as dynamic supply zones until reclaimed and held.
At the same time, the broader scoring does not confirm a strongly bearish regime. The overall technical score is Neutral (0.182), and the instrument’s rank set remains Neutral (for example, Daily #624 out of 1423). This creates a practical divergence: trend is bearish, while cross-sectional positioning is not decisively weak. Divergences of this type often resolve through a level-based decision: either the market grinds higher and forces moving-average compression, or downside extends and pulls additional indicators into bearish agreement.
The support/resistance framework reinforces that the market is operating inside a bounded range defined by 17.7325 and 21.6767. With trend bearish, the higher-probability requirement for improved confidence is not simply “up days,” but a sequence that reduces the distance to the MA50 while simultaneously holding above support. Absent those confirmations, the MA stack remains the dominant regime descriptor.
3) Momentum & volatility dashboard
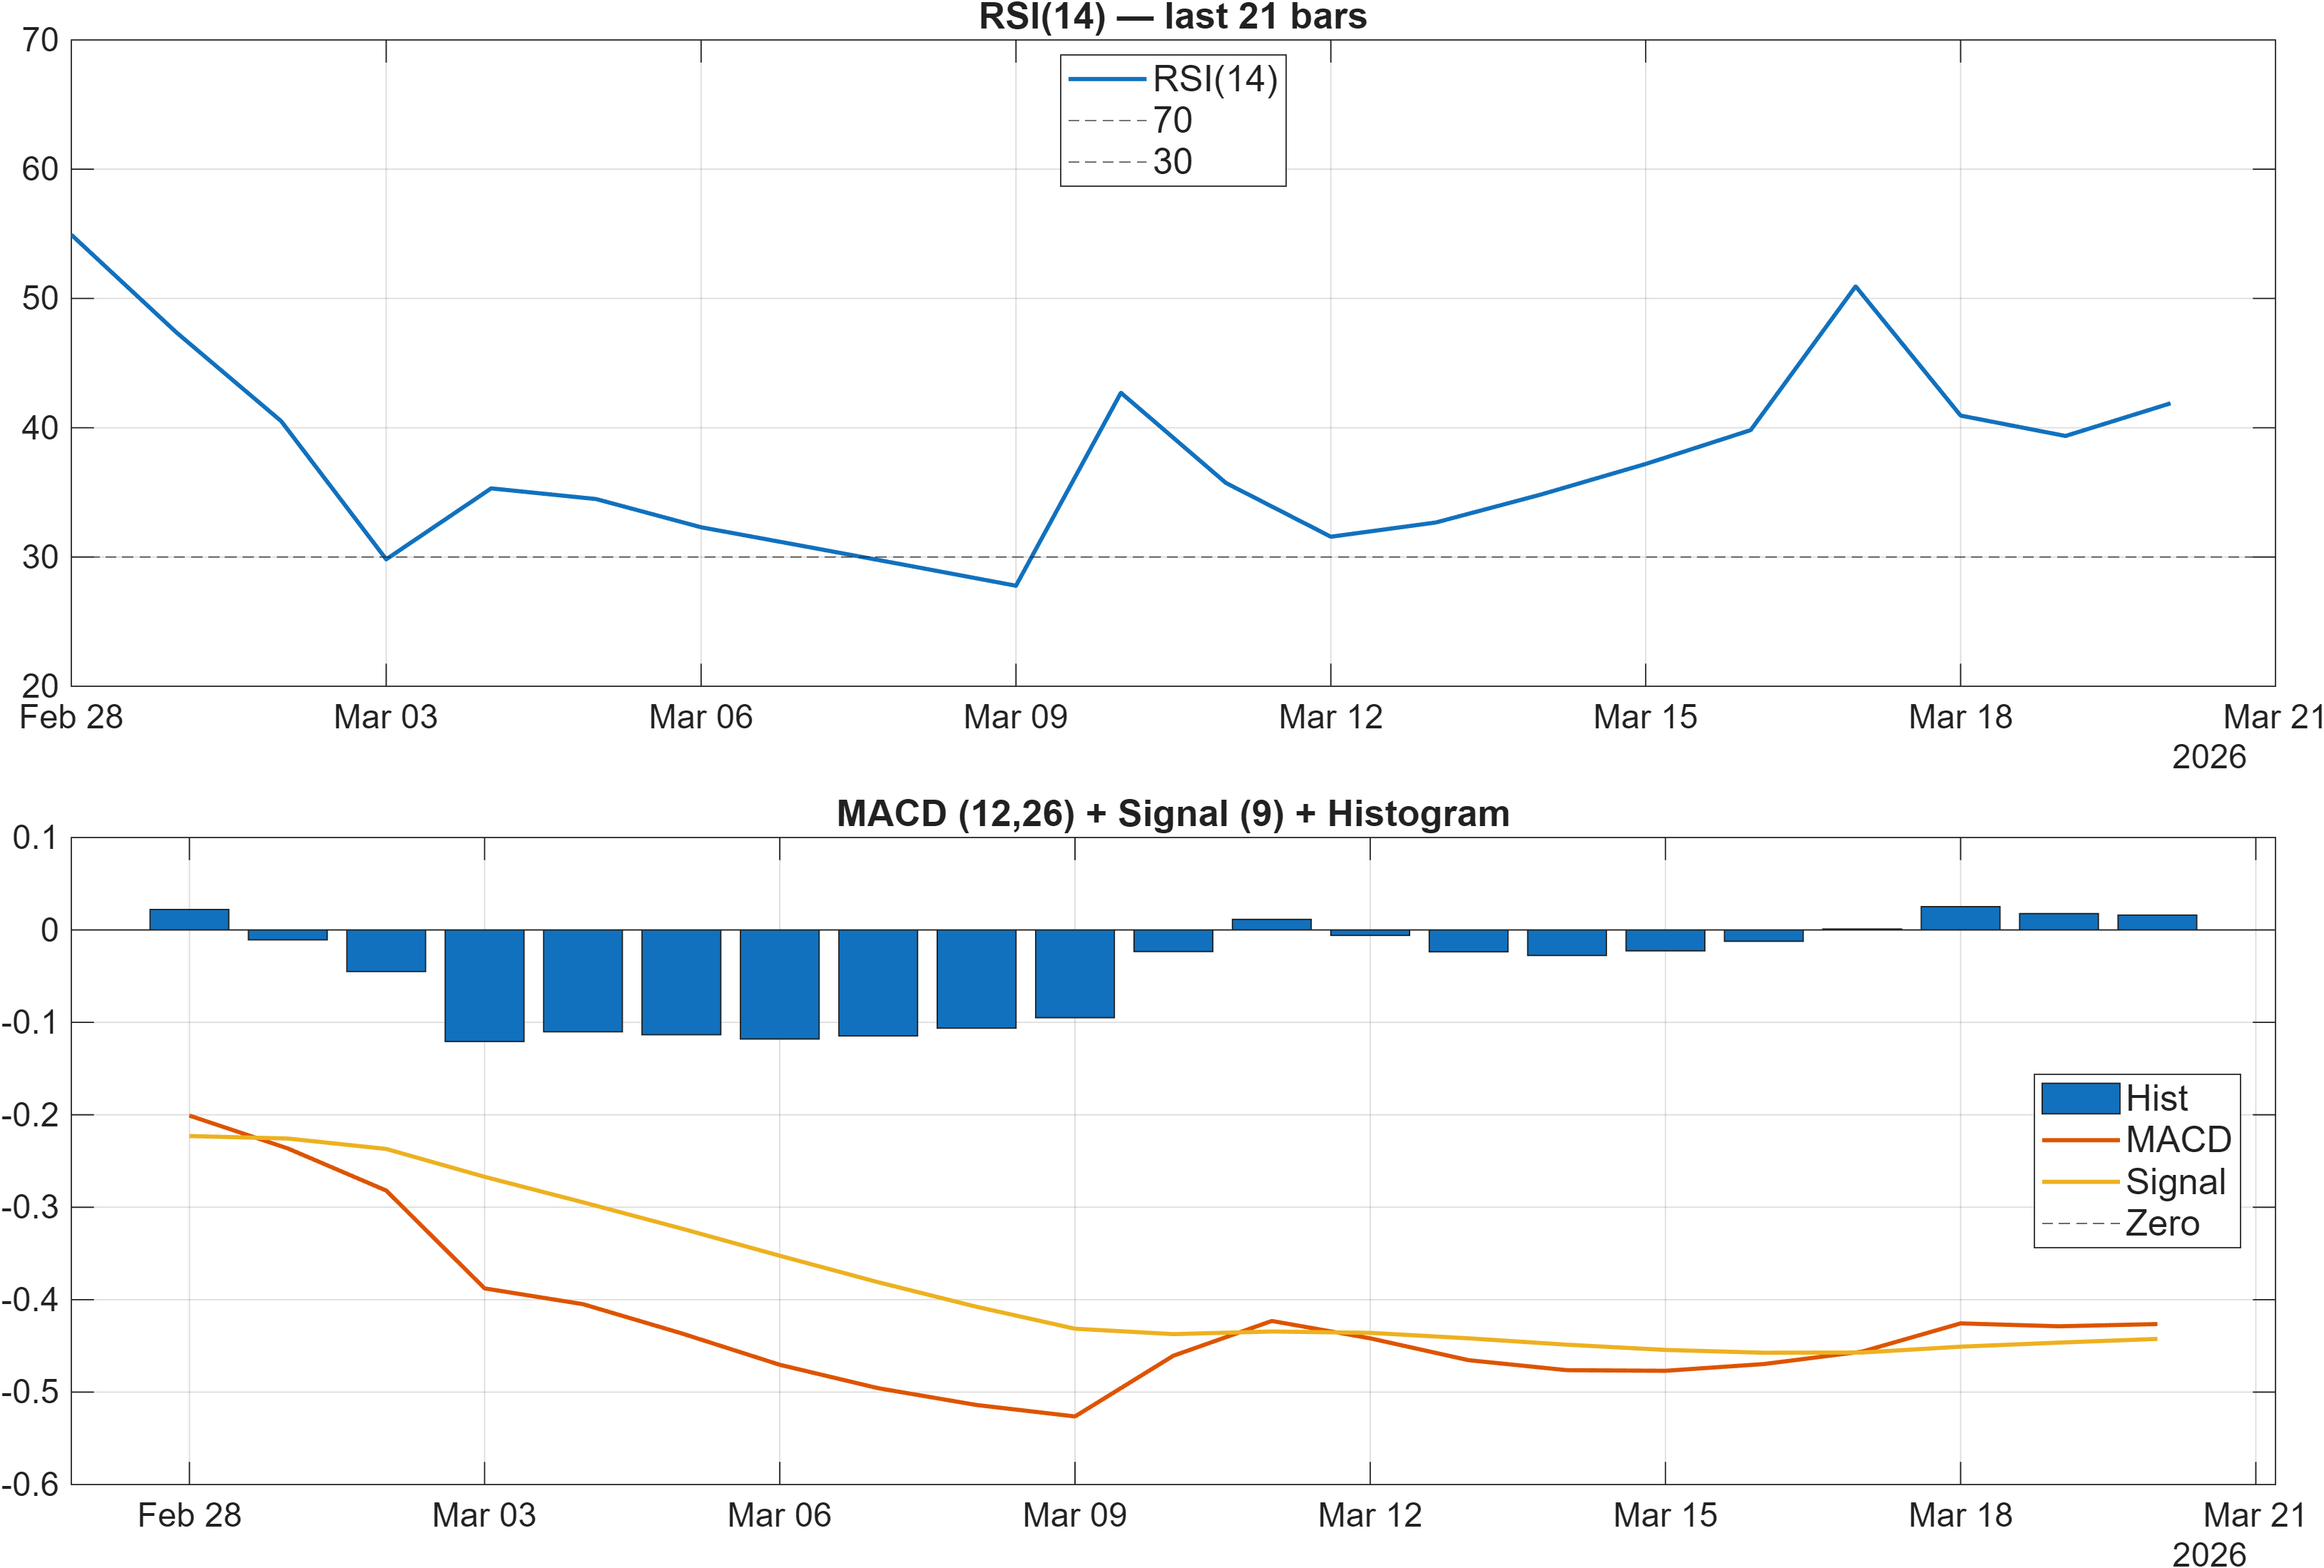
Interpretation: RSI bias = Neutral, MACD hist = 0.0161.
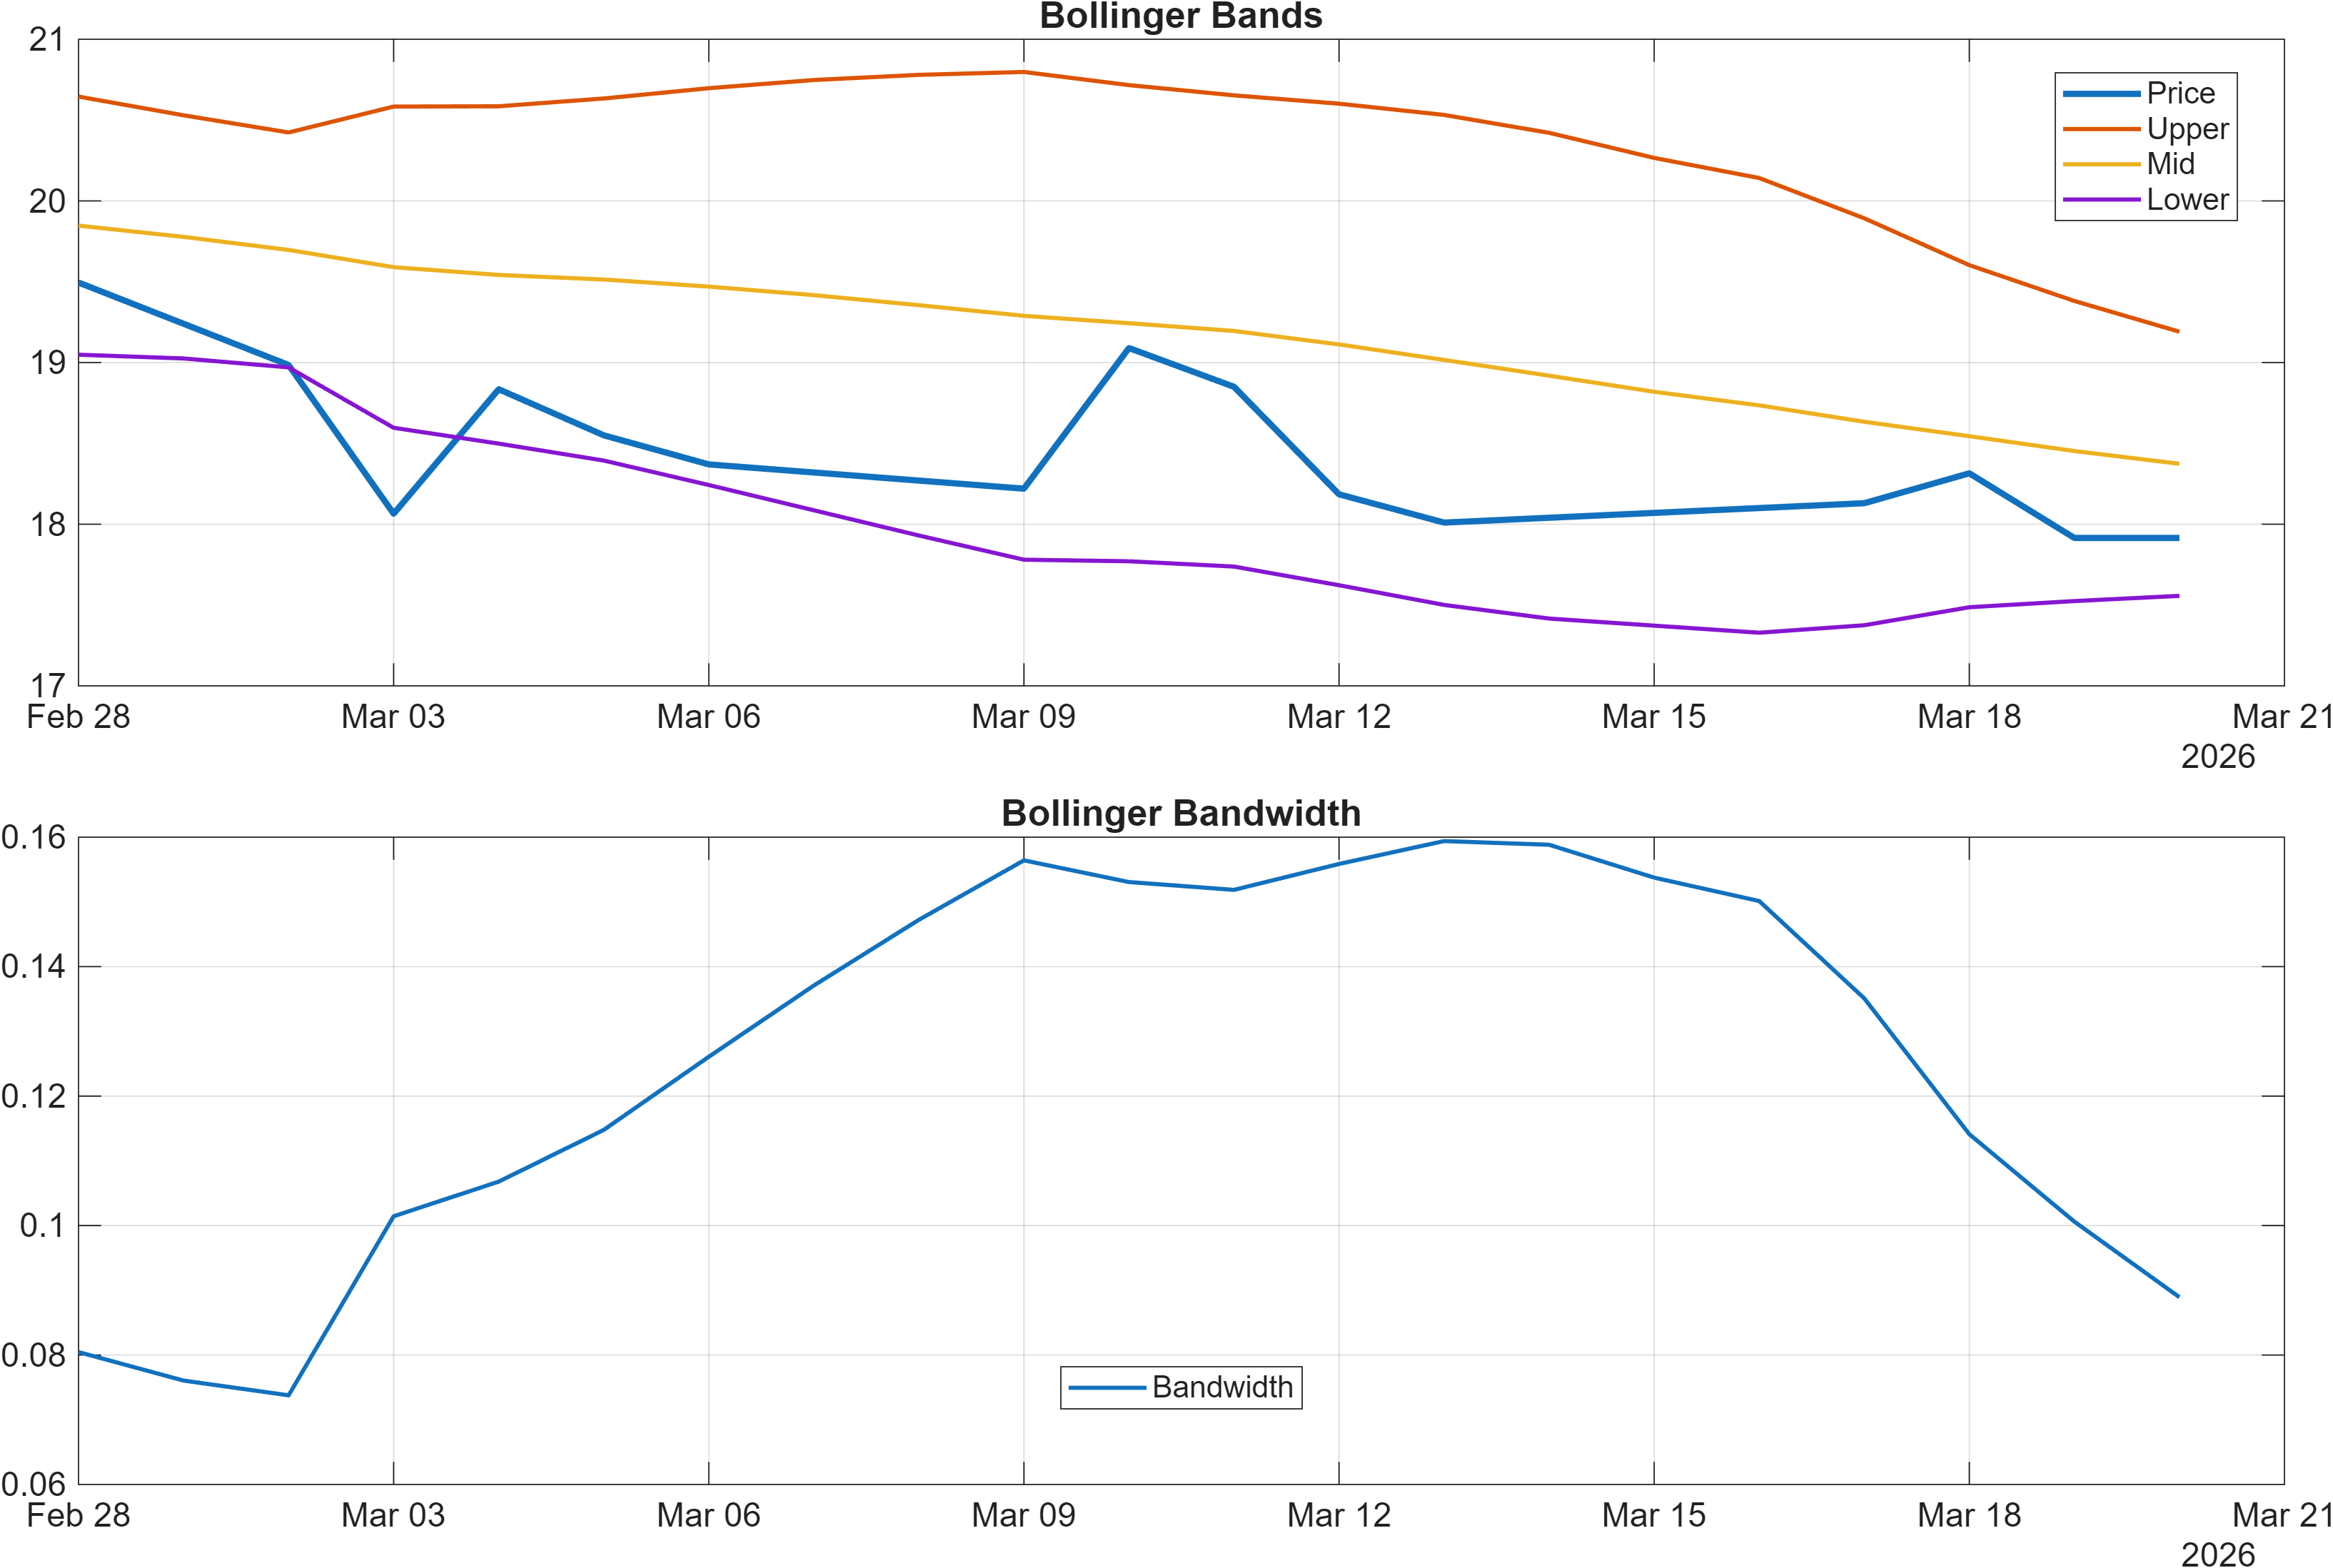
Interpretation: Bandwidth (volatility regime) latest = 0.0889.
Momentum: early stabilization signals vs residual weakness
Momentum is split in a way that fits a “market seeks direction” phase. The MACD histogram is positive at 0.0161, which can indicate incremental improvement in short-cycle momentum. However, RSI(14) is 41.89 in the signal table (Bearish), implying the bounce has not yet translated into stronger underlying demand conditions typically associated with more durable trend reversals.
Additional rate-of-change measures reinforce the mixed picture. ROC(20) is -6.887 and TS Mom(20) is -1.325, both Bearish, which is consistent with the bearish moving-average regime. Against that, the oscillator complex contains evidence of potential mean-reversion pressure: Stoch %K at 17.82 is Bullish, often aligned with oversold/turn attempts, and TS Accel at 0.035 is Bullish, suggesting the downside impulse may be losing force.
Volatility: contained regime increases the importance of level breaks
Volatility remains comparatively constrained with Bollinger Bandwidth at 0.0889 (and BB Width 0.08893 marked Neutral in the signal table). When bandwidth is not expanding, directional conviction often arrives through a discrete breakout or breakdown rather than a gradual trend acceleration. In practical terms, this pushes attention toward the established zones—17.7325 and 21.6767—and toward whether volume-flow confirms any attempted escape from the range.
4) Support / Resistance zones
Support ~ 17.7325 | Resistance ~ 21.6767
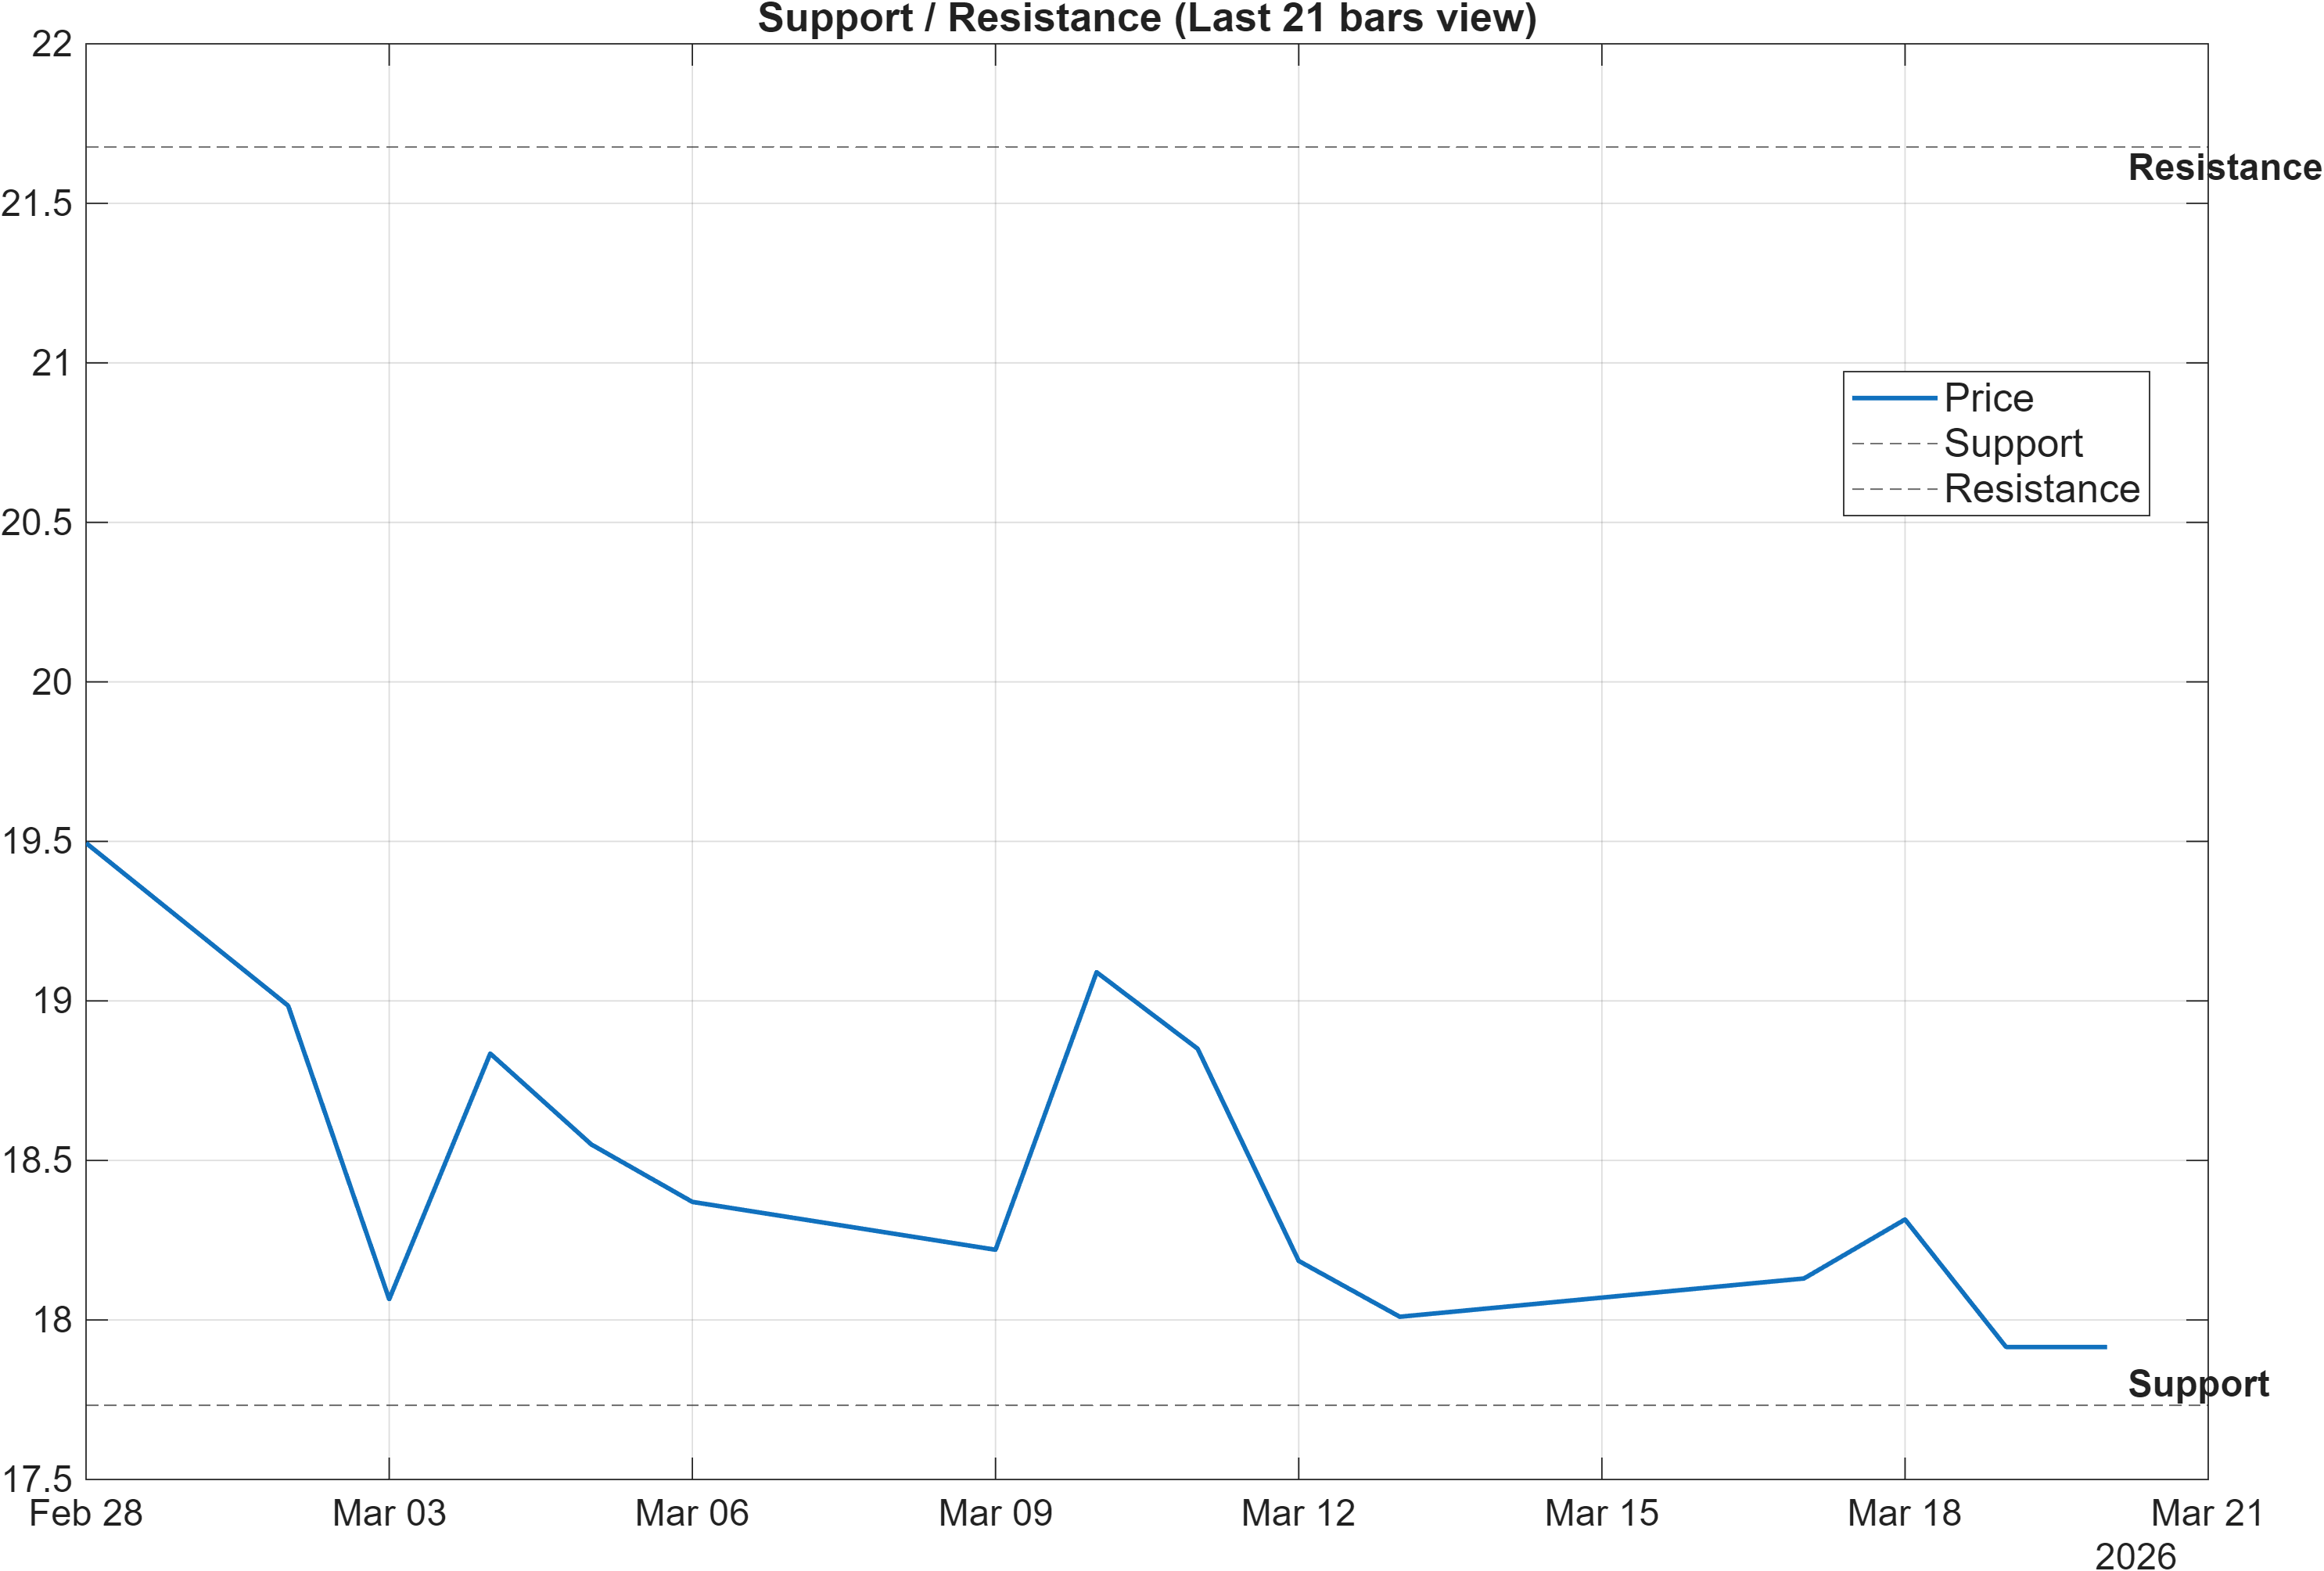
Scenario view: Break above resistance with volume → continuation. Close below support → signal deterioration risk.
Decision zones: where confirmation replaces interpretation
The current structure is best managed as a two-boundary problem. Support near 17.7325 is the primary invalidation reference: a close below that zone is explicitly framed as deterioration risk and would likely pull more of the mixed indicators into bearish agreement. This matters because several momentum and rate-of-change measures are already negative (e.g., ROC(20) -6.887 and RSI(14) 41.89).
On the upside, 21.6767 is the key confirmation threshold. Because the moving-average posture is bearish (Close vs MA50 Bearish; MA50 vs MA200 Bearish), an upside move is higher quality when it is accompanied by participation signals rather than a low-volume drift. Within the 18-signal set, volume and accumulation indicators are not uniformly weak—ADOSC 48.68 is Bullish and AD Line slope(10) 4.754e+06 is Bullish—so a resistance break that aligns with these measures would represent a clearer regime shift than price alone.
The range width between 17.7325 and 21.6767 is large enough to accommodate multiple failed attempts. With BB Width 0.08893 Neutral, a decisive move is more likely to be recognizable via a level event than via gradually rising volatility. As a result, the most robust process is to treat the boundaries as probabilistic decision zones and to require confirmation before reclassifying the trend state.
5) Quant Technical Dashboard (18 Signals)
KGNAI AI Technical Analysis Score (Deep Reinforcement Learning): Rank #465 out of 1423 (Rank 1 represents the strongest technical positioning and a higher probability of favorable price behavior. As ranks increase toward the maximum, the probability of favorable outcomes weakens and bearish positioning becomes more dominant.) | Label: Neutral | Score: 0.346
18-Signal Technical Confluence Score: 0.111 (Neutral)
Overall Technical Score (18-signal confluence + DRL rank blend): 0.182 (Neutral)
Note: The blended score reflects signal strength weighted against broader AI technical ranking, which may temporarily diverge.
Blended technical score breakdown: 0.182 (Neutral | Bull 8 / Bear 6 / Neutral 4)
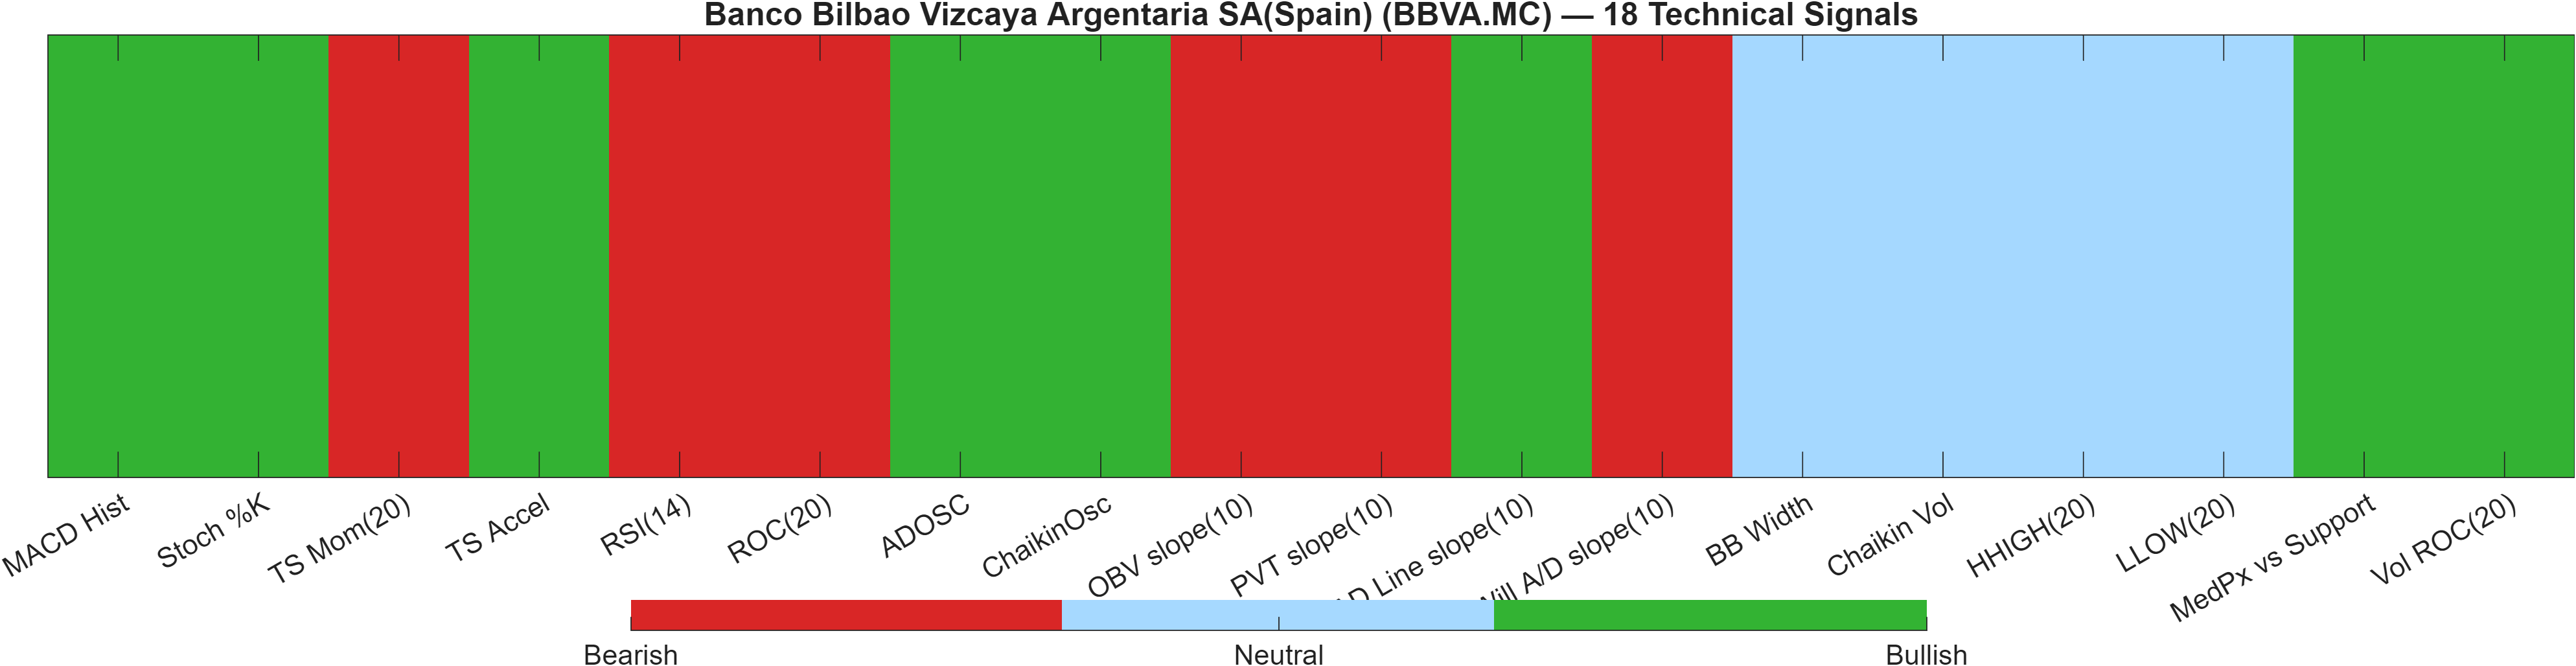
Signal balance: constructive pockets without trend confirmation
The quantitative dashboard communicates neutrality by composition rather than by uniform readings. The 18-signal confluence score is 0.111 (Neutral), and the blended score is 0.182 (Neutral), but the signal mix (8 Bullish vs 6 Bearish) shows that BBVA.MC currently has enough supportive internals to prevent a clean bearish consensus—despite bearish moving-average alignment.
On the constructive side, momentum and participation are not absent: MACD Hist 0.01605 is Bullish, and accumulation measures like ADOSC 48.68 and AD Line slope(10) 4.754e+06 are Bullish. The Vol ROC(20) 11.8 Bullish reading also suggests that volume dynamics have recently been more favorable than pure price momentum would imply.
Counterbalancing that, several bearish components still match the prevailing trend template: RSI(14) 41.89, ROC(20) -6.887, and OBV slope(10) -7.03e+06 are Bearish, indicating that any recovery attempt has not yet flipped the broader footprint of demand. With volatility measures largely Neutral (e.g., BB Width 0.08893), the dashboard reads like a market in compression: enough constructive inputs to attempt stabilization, but insufficient agreement to call a regime change without a breakout above 21.6767 or a breakdown below 17.7325.
Signal table (Bull/Bear/Neutral)
| Indicator | Value | Signal |
|---|---|---|
| MACD Hist | 0.01605 | Bullish |
| Stoch %K | 17.82 | Bullish |
| TS Mom(20) | -1.325 | Bearish |
| TS Accel | 0.035 | Bullish |
| RSI(14) | 41.89 | Bearish |
| ROC(20) | -6.887 | Bearish |
| ADOSC | 48.68 | Bullish |
| ChaikinOsc | 4.337e+06 | Bullish |
| OBV slope(10) | -7.03e+06 | Bearish |
| PVT slope(10) | -9.661e+05 | Bearish |
| AD Line slope(10) | 4.754e+06 | Bullish |
| Will A/D slope(10) | -0.32 | Bearish |
| BB Width | 0.08893 | Neutral |
| Chaikin Vol | -21.2 | Neutral |
| HHIGH(20) | 19.59 | Neutral |
| LLOW(20) | 17.58 | Neutral |
| MedPx vs Support | 0.1275 | Bullish |
| Vol ROC(20) | 11.8 | Bullish |
Interpretation: Indicator-level signals form the base confluence, which is then adjusted using a separate AI-driven technical ranking model. The final technical score summarizes this combined view.
6) News sentiment + extractive gist
Sentiment score (avg): 0.168 | Positive: 38% | Neutral: 50% | Negative: 12%
KGNAI AI News Sentiment Score (normalized -1 to +1): 1.00 (as of 2026-01-07) | Label: Bullish | Overall news score: 0.85
Positive Developments
Recent coverage across major financial outlets indicates a generally constructive tone around BBVA, with sentiment distribution skewed toward positive (38%) versus negative (12%), and a supportive normalized sentiment reading of 1.00 (as of 2026-01-07). The positive narrative cluster is largely consistent with external viewpoint framing around valuation context and strategic direction, which can reinforce incremental demand during consolidation phases—particularly when price is operating above a clearly defined support like 17.7325. From a market-structure perspective, constructive sentiment is most impactful when it coincides with technical stabilization: BBVA.MC shows early improvement markers such as a positive MACD histogram (0.0161) and multiple Bullish participation signals (e.g., ADOSC). Still, the broader technical regime remains Neutral, so sentiment should be treated as contextual bias rather than a standalone driver until price behavior confirms through resistance interaction near 21.6767.
Neutral / Mixed Developments
The neutral share of coverage is substantial at 50%, consistent with a market that is still assessing direction rather than repricing quickly. This aligns with BBVA.MC’s technical state: volatility is contained (Bandwidth 0.0889), which typically coexists with incremental, headline-agnostic trading and a focus on levels. Mixed reporting clusters can reduce immediate information advantage because they often generate two-sided flows—participants position around support/resistance rather than extend directional bets. With the cross-horizon ranks remaining Neutral (Daily #624, Weekly #673 out of 1423), the market signal suggests “wait for confirmation” conditions: neutral news flow is more likely to maintain the current range behavior unless it coincides with a participation change visible in volume-flow indicators.
Negative / Risk Signals
Negative coverage is smaller in share (12%) but still relevant because the technical trend template is not yet repaired: Close vs MA50 and MA50 vs MA200 are both Bearish. In that context, even a limited negative impulse can matter if it triggers a level event—especially a decisive close below 17.7325, which is already defined as a deterioration risk. The indicator set also contains residual weakness that can amplify downside sensitivity: RSI(14) 41.89 and ROC(20) -6.887 remain Bearish, and OBV slope is negative, suggesting demand has not fully rotated back. The practical takeaway is not that risk is dominant, but that the market’s “room for error” may be smaller while price remains below key trend references and before a confirmed break above 21.6767.
What to monitor next:
- Whether sentiment remains supportive if price retests 17.7325.
- Any shift in participation signals (e.g., ADOSC / AD Line slope) during approaches to 21.6767.
- Whether volatility expands meaningfully from the current Bandwidth baseline (0.0889), signaling a regime transition.
Sources referenced: Reuters, Bloomberg, Yahoo Finance, MarketWatch, Investing.com
7) Sources
News source links are not reproduced here. Sources referenced: Reuters, Bloomberg, Yahoo Finance, MarketWatch, Investing.com
Snapshot: AI Rank (Short–Mid–Long): Neutral (Neutral–Neutral–Neutral) · Technical Confluence: Neutral · Key Levels: Support ~17.73 | Resistance ~21.68 · News Sentiment: Positive
You may also like: How KGNAI AI ranks instruments across global markets
Disclaimer: KGNAI provides AI-generated analytics and educational market commentary only. This is not financial advice. Markets involve risk. Always do your own research.