
IDL.PA — ID Logistics Group SA (France) | 22-Mar-2026 — Mid/Long-term rank strength vs bearish technical pressure
ID Logistics Group SA (IDL.PA) screens as a rank-led constructive setup with a near-term technical drawdown profile. Across KGNAI’s 1422-instrument European universe, IDL.PA sits in the upper quartile to top decile on most multi-month horizons (notably #15 monthly and #5 3-month), while the daily rank (#553) is closer to neutral. That split is reinforced by classical signals: the price/MA structure reads bearish (close vs MA50 and MA50 vs MA200), momentum is weak with RSI(14) at 22.75 and MACD histogram at -2.9349, and volume/flow gauges skew negative despite selective upticks. Key decision zones are well-defined at support ~322.6667 and resistance ~421.7500. News tone is supportive on balance, with sentiment metrics showing 0% negative and a normalized news score of 1.00, but the tape still requires confirmation through level recapture and stabilization.
- Rank stance: Short-term Neutral | Mid-term Bullish | Long-term Bullish
- Technical confluence: Bearish (18-signal confluence -0.556; blended score -0.584)
- Key levels: Support 322.6667 | Resistance 421.7500
- News sentiment bias: Positive (avg 0.168; Positive 57%, Negative 0%; normalized 1.00)
- Confirmation / invalidation: Sustained acceptance above 421.7500 would improve continuation odds; a close below 322.6667 increases deterioration risk.
What KGNAI Measures
KGNAI evaluates assets using large cross-sectional datasets built from millions of structured data points. Inputs incorporate fundamental metrics, technical structures, and systematically processed news sentiment. Statistical models, machine learning, and AI frameworks are used to assess relative positioning, signal alignment, and probabilistic behavior across broad universes.
How to Read This Report
- Ranks are comparative across the tracked universe, not absolute price targets.
- Confluence reflects alignment among independent signal groups.
- Support/resistance levels are probabilistic decision zones, not guarantees.
- Sentiment provides contextual bias within the broader analytical framework.
1) KGNAI AI Analysis
Region: EUROPE
Total universe size: 1422 ranked instruments
- Daily rank: #553 out of 1422 — Neutral
- Weekly rank: #52 out of 1422 — Bullish
- Monthly rank: #15 out of 1422 — Bullish
- 3-Monthly rank: #5 out of 1422 — Bullish
- 6-Monthly rank: #57 out of 1422 — Bullish
- Yearly rank: #17 out of 1422 — Bullish
The rank stack for IDL.PA is defined by timeframe divergence: near-term positioning is comparatively soft, while multi-month and annual horizons remain strong. The daily rank (#553) is consistent with a market that is still digesting recent price action, yet the weekly rank (#52) and especially the monthly (#15) and 3-month (#5) ranks place the stock in the upper tier of the tracked European universe.
This configuration often reflects a regime where the broader positioning framework is constructive, but the path dependency is noisy—price can remain technically heavy while longer-horizon tests keep scoring favorably. The yearly rank (#17) adds weight to the idea that the instrument has retained relative strength characteristics over a full cycle, even if current conditions are not yet confirming through short-horizon trend filters.
Practically, the analytical burden shifts to whether shorter-term signals can stop detracting and begin to converge toward the mid/long profile. With the stated term view (Short-term: Neutral; Mid-term: Bullish; Long-term: Bullish), the highest-quality read is to treat weakness as a confirmation problem rather than an immediate reversal verdict. The rank ladder suggests IDL.PA remains better positioned than most peers on longer lookbacks, but it still needs technical repair for that advantage to become tradable with tighter risk definitions.
Term view: Short-term: Neutral. Mid-term: Bullish. Long-term: Bullish.
Want the full universe and complete rank tables? Unlock full access on KGNAI: https://www.kgnai.com/pricing
2) Price & trend overview
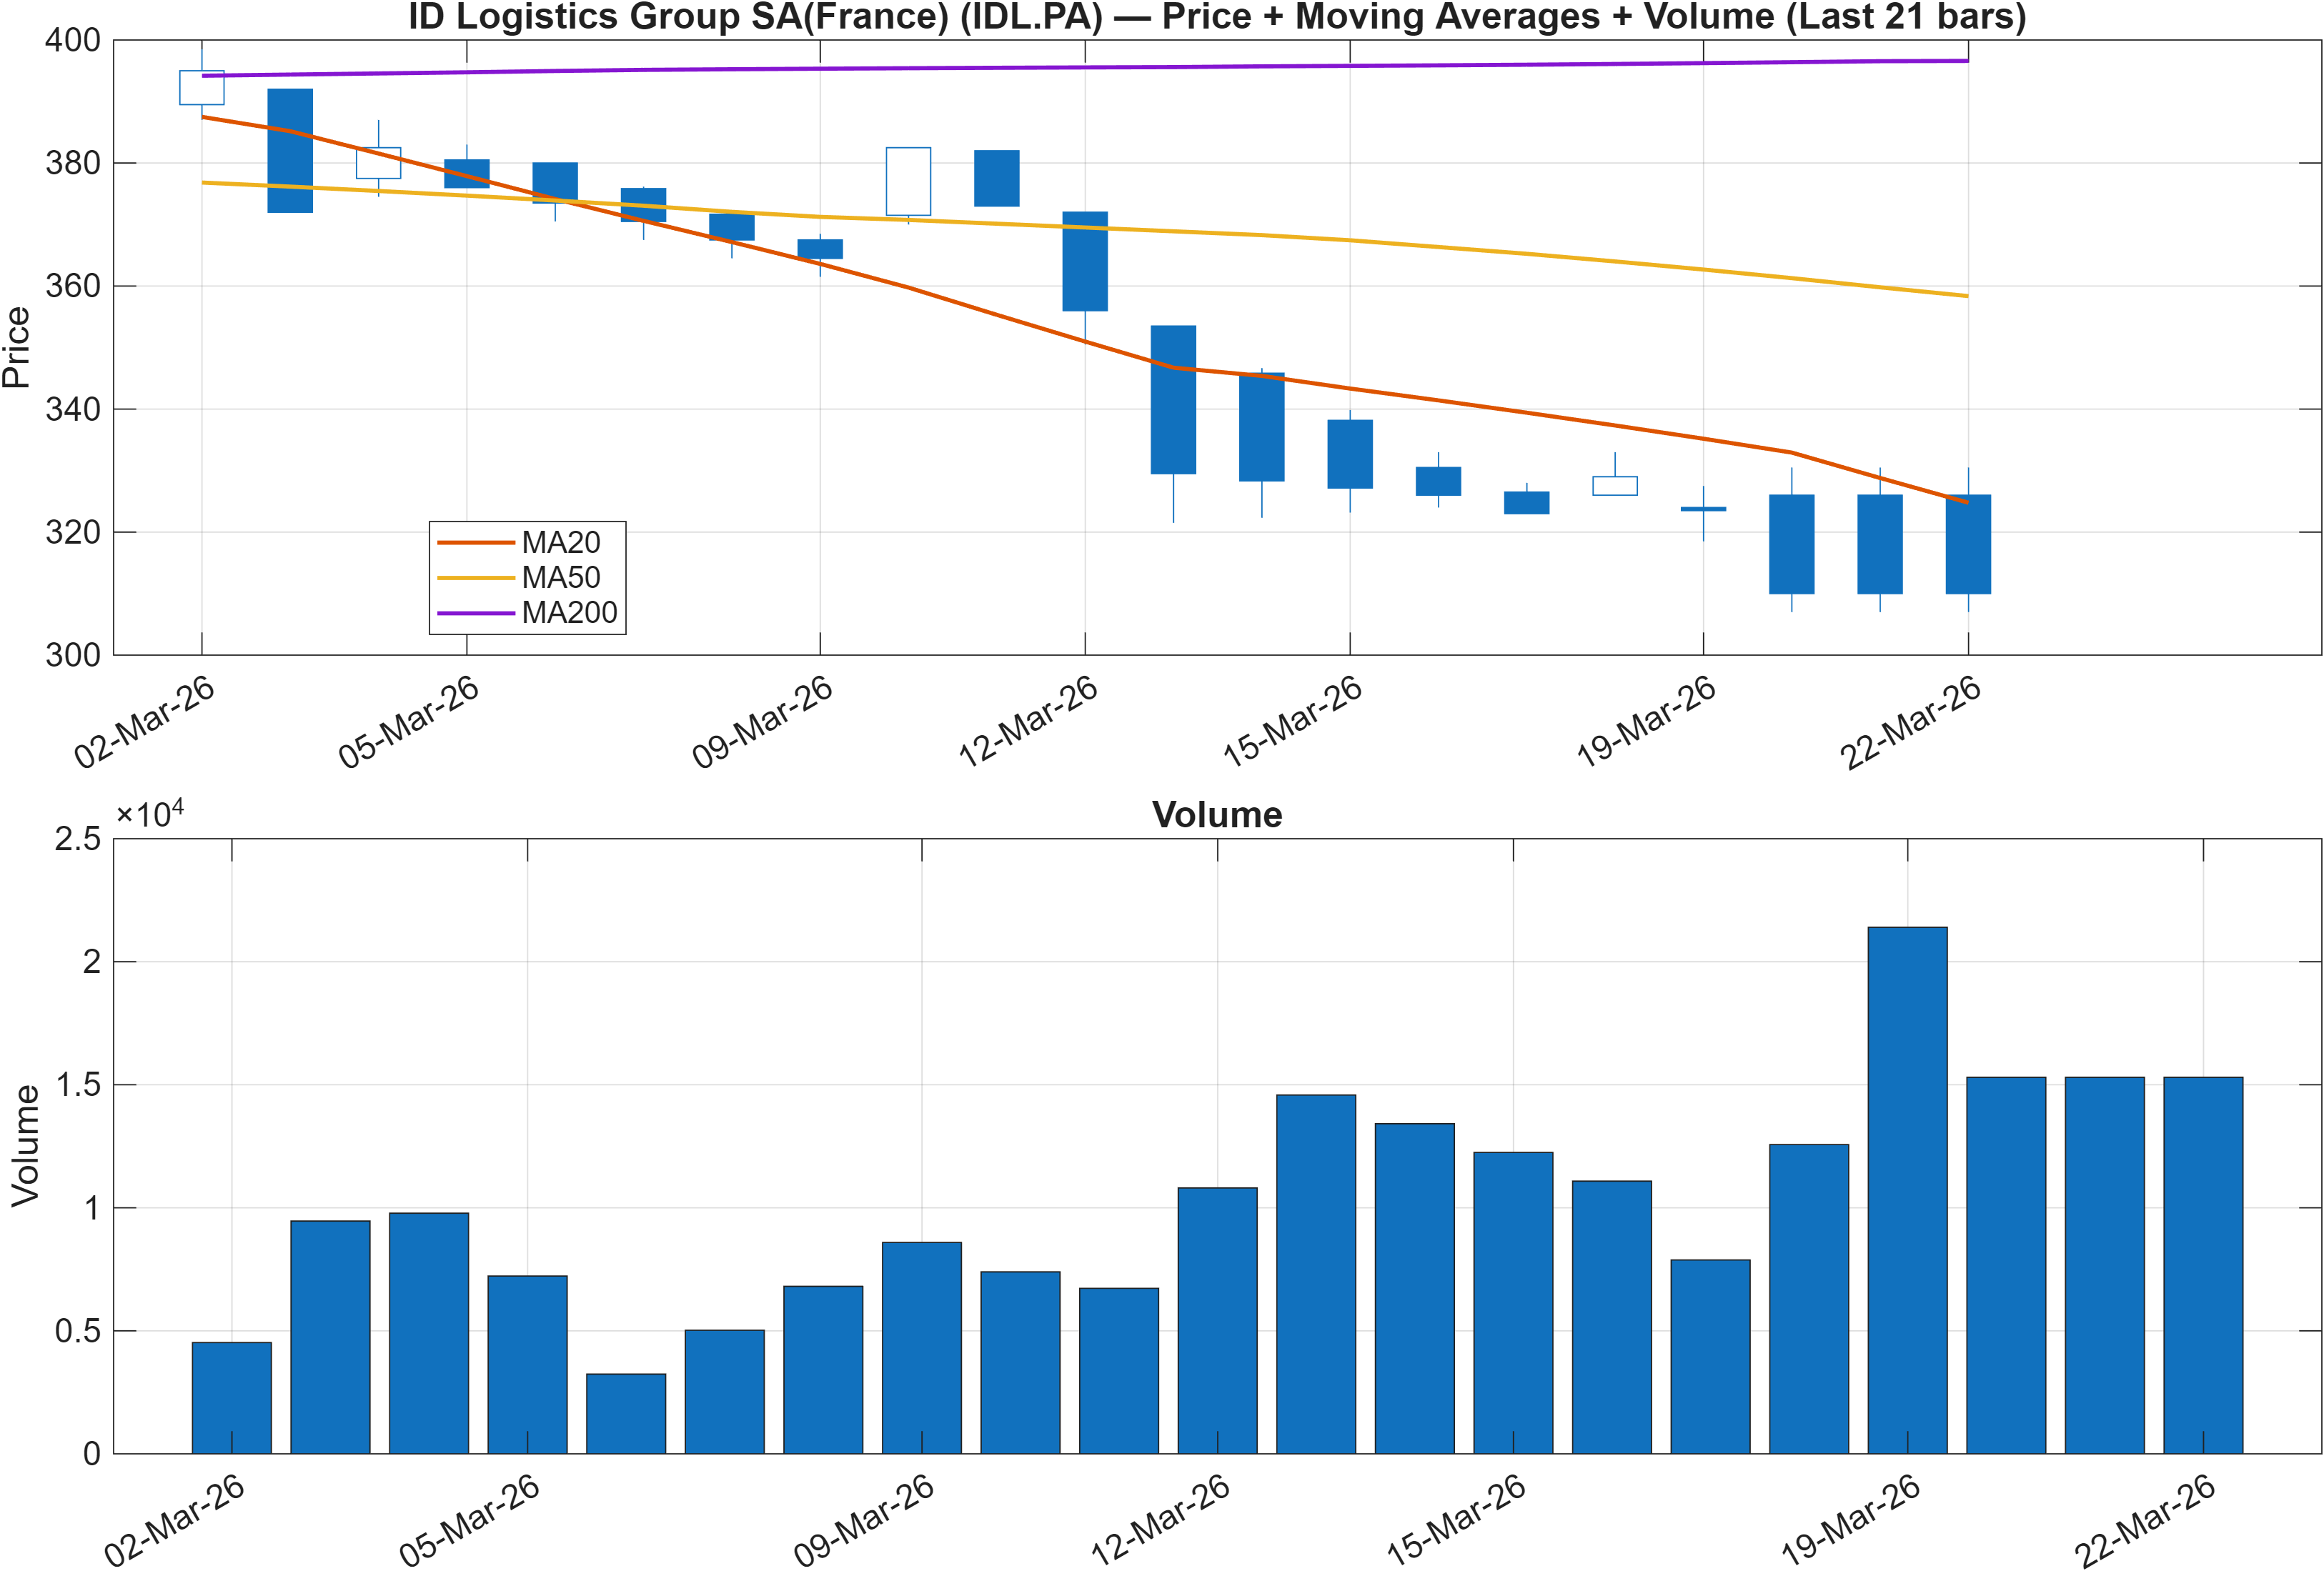
The current trend read is dominated by a bearish moving-average structure: close vs MA50 = Bearish and MA50 vs MA200 = Bearish. In market-structure terms, this combination typically signals that the shorter trend is not only weak, but also embedded beneath the longer trend filter—an environment where rallies frequently face supply before the larger trend can reassert itself.
The key point is not the moving averages in isolation, but how they interact with the broader ranking profile. With multi-horizon ranks still strong (e.g., #15 monthly and #5 3-month), the MA configuration implies either (a) a corrective phase inside a stronger longer-horizon context, or (b) a transition period where the ranking models have not yet fully repriced the deterioration seen in trend filters. Distinguishing between those two requires a level-based approach (see Section 4) and momentum stabilization (Section 3).
From a positioning standpoint, traders often watch for early signs of trend repair: reduced downside follow-through, improved close-to-close behavior, and eventual recapture dynamics that flip close vs MA50 away from bearish. Until that happens, the tape remains vulnerable to “sell-the-rally” behavior even if the broader comparative profile stays resilient. The support/resistance map at 322.6667 and 421.7500 provides a clean framework for assessing whether the current trend weakness is merely contained or beginning to propagate.
Interpretation: Close vs MA50 = Bearish, MA50 vs MA200 = Bearish.
3) Momentum & volatility dashboard
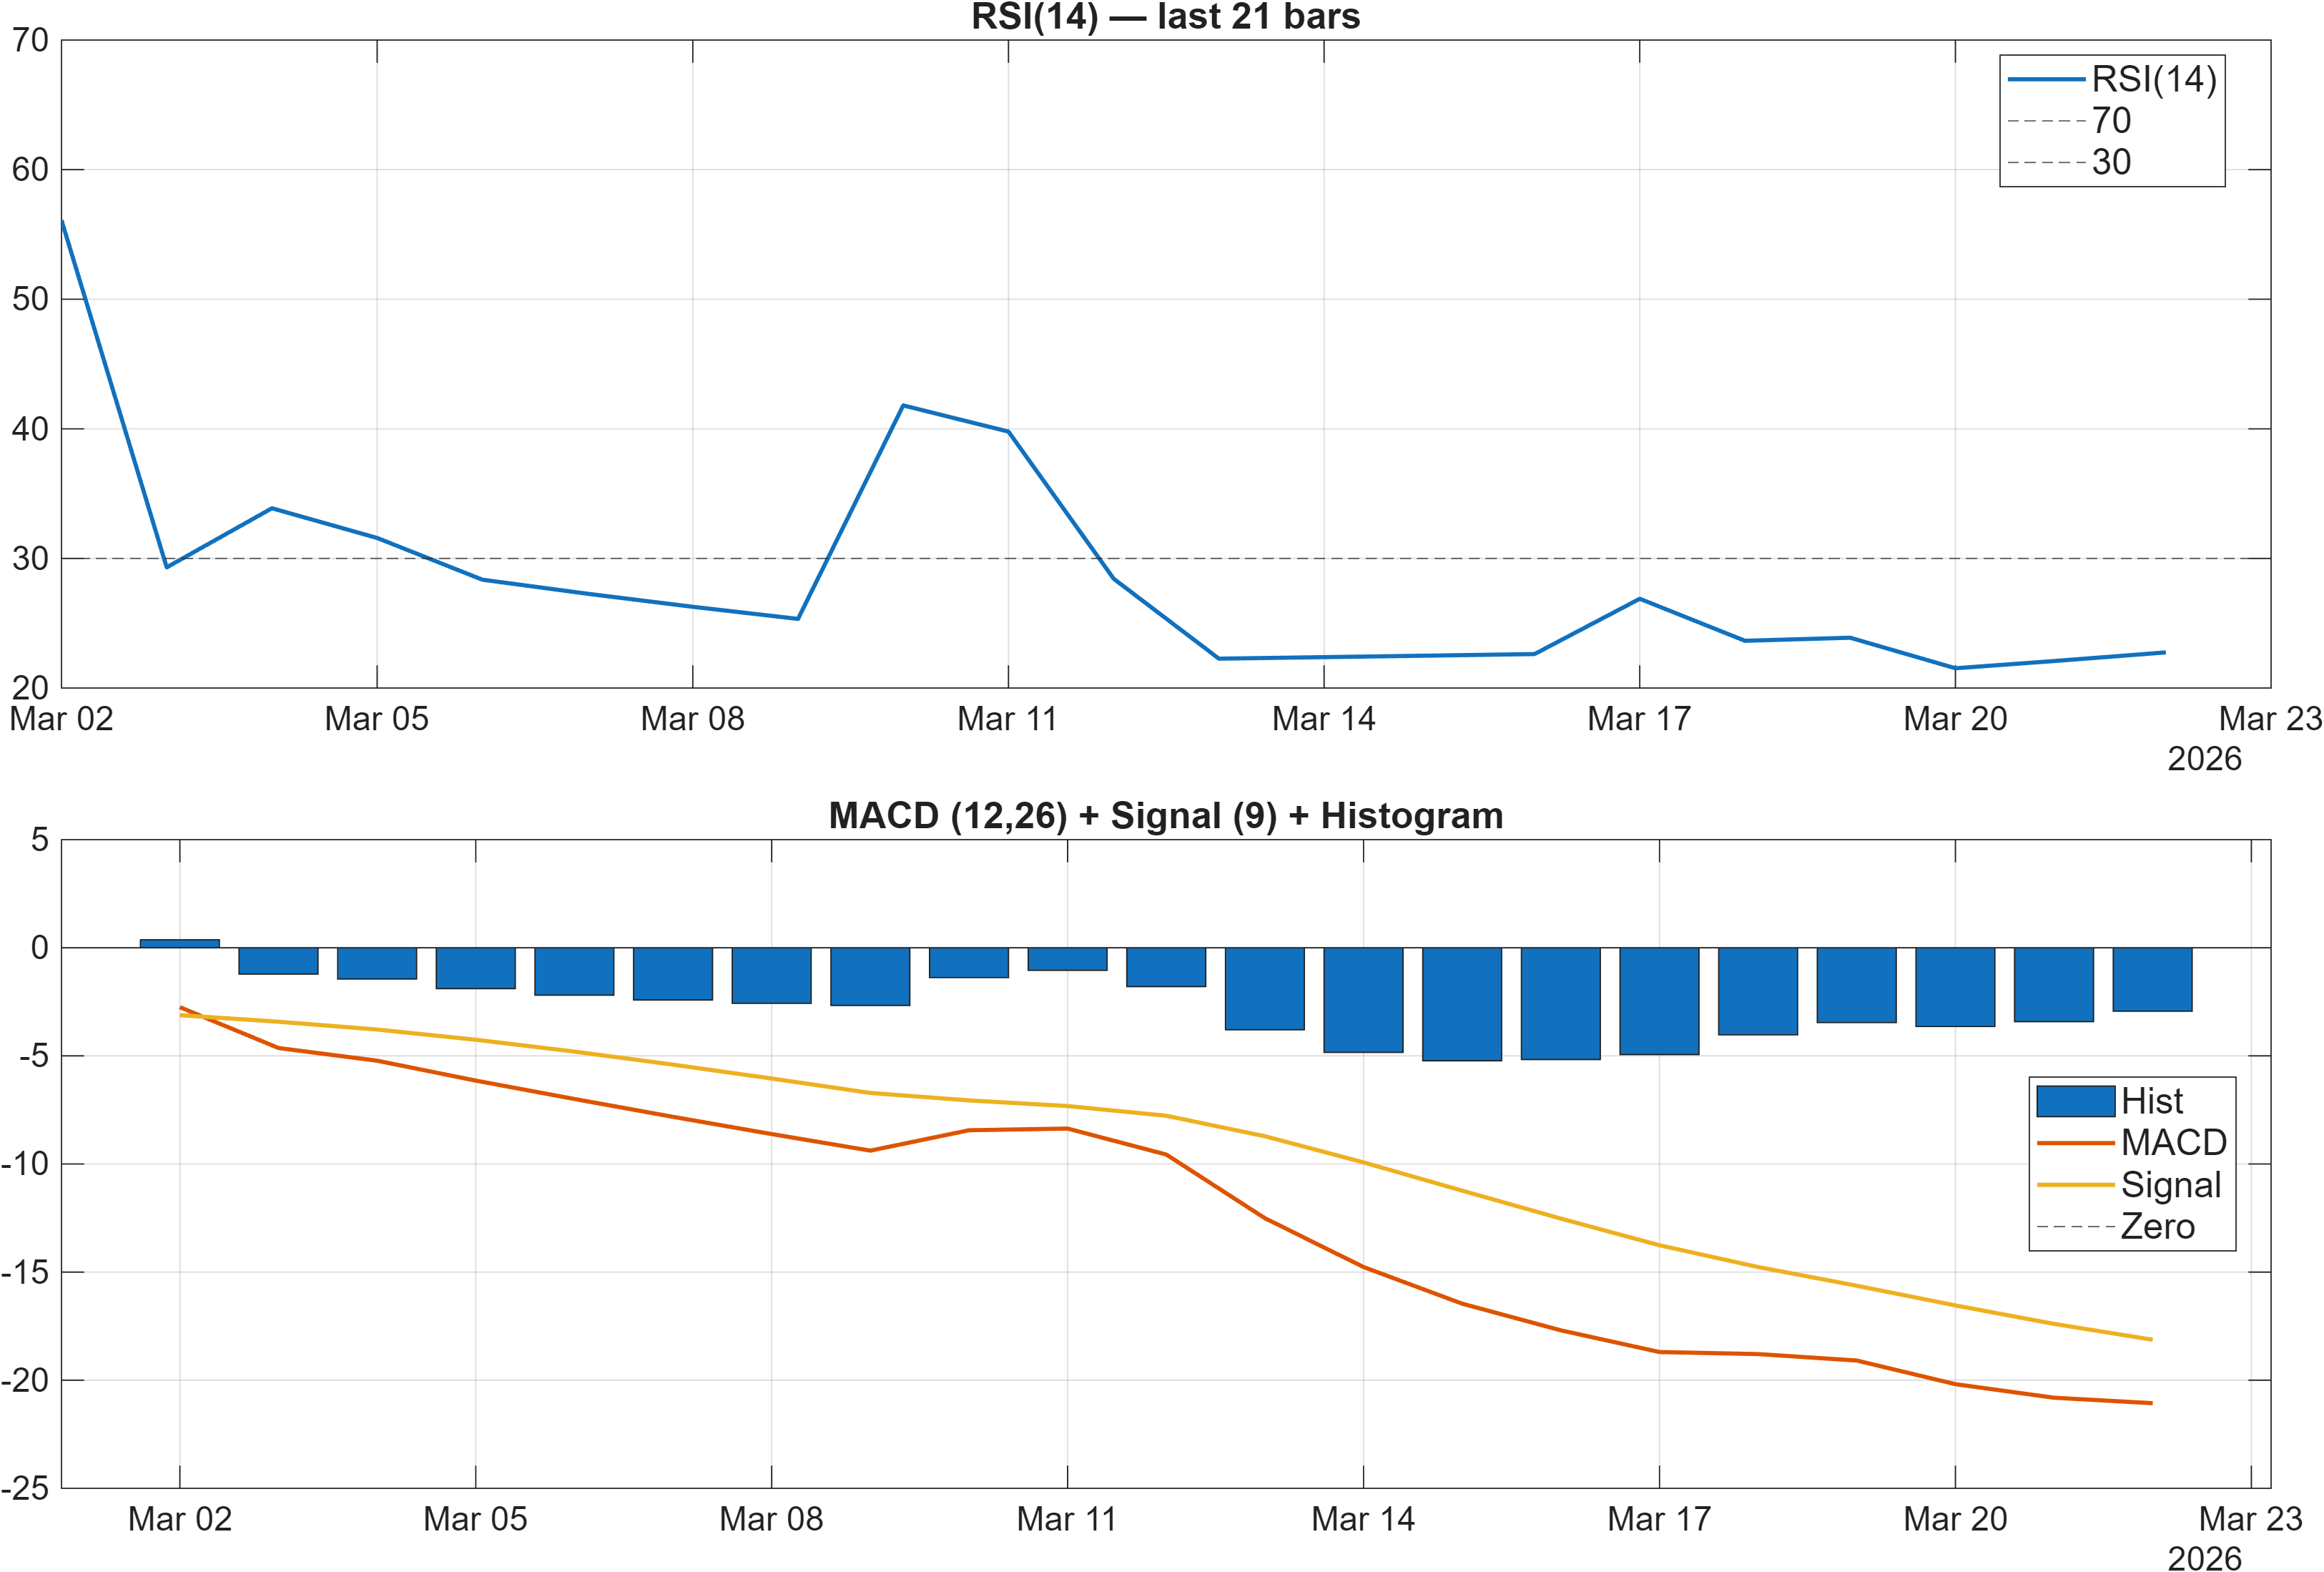
Momentum is currently skewed toward exhaustion risk without confirmation of reversal. The dashboard flags RSI bias = Bearish, with RSI(14) at 22.75—a level that often coincides with oversold conditions, but oversold readings alone do not imply a durable turn. In parallel, the MACD histogram at -2.9349 indicates negative momentum remains embedded, consistent with the bearish MA configuration.
The signal-level mix supports this: while some fast oscillators can flip earlier, broader momentum and rate-of-change remain heavy. For example, ROC(20) at -16.67 and TS Mom(20) at -62 align with a market still printing negative impulse. This is the typical “weak momentum, early-stabilization watch” regime—where the first change investors look for is not a bullish signal, but a reduction in bearish intensity (e.g., MACD histogram rising toward zero, RSI lifting out of the low zone).
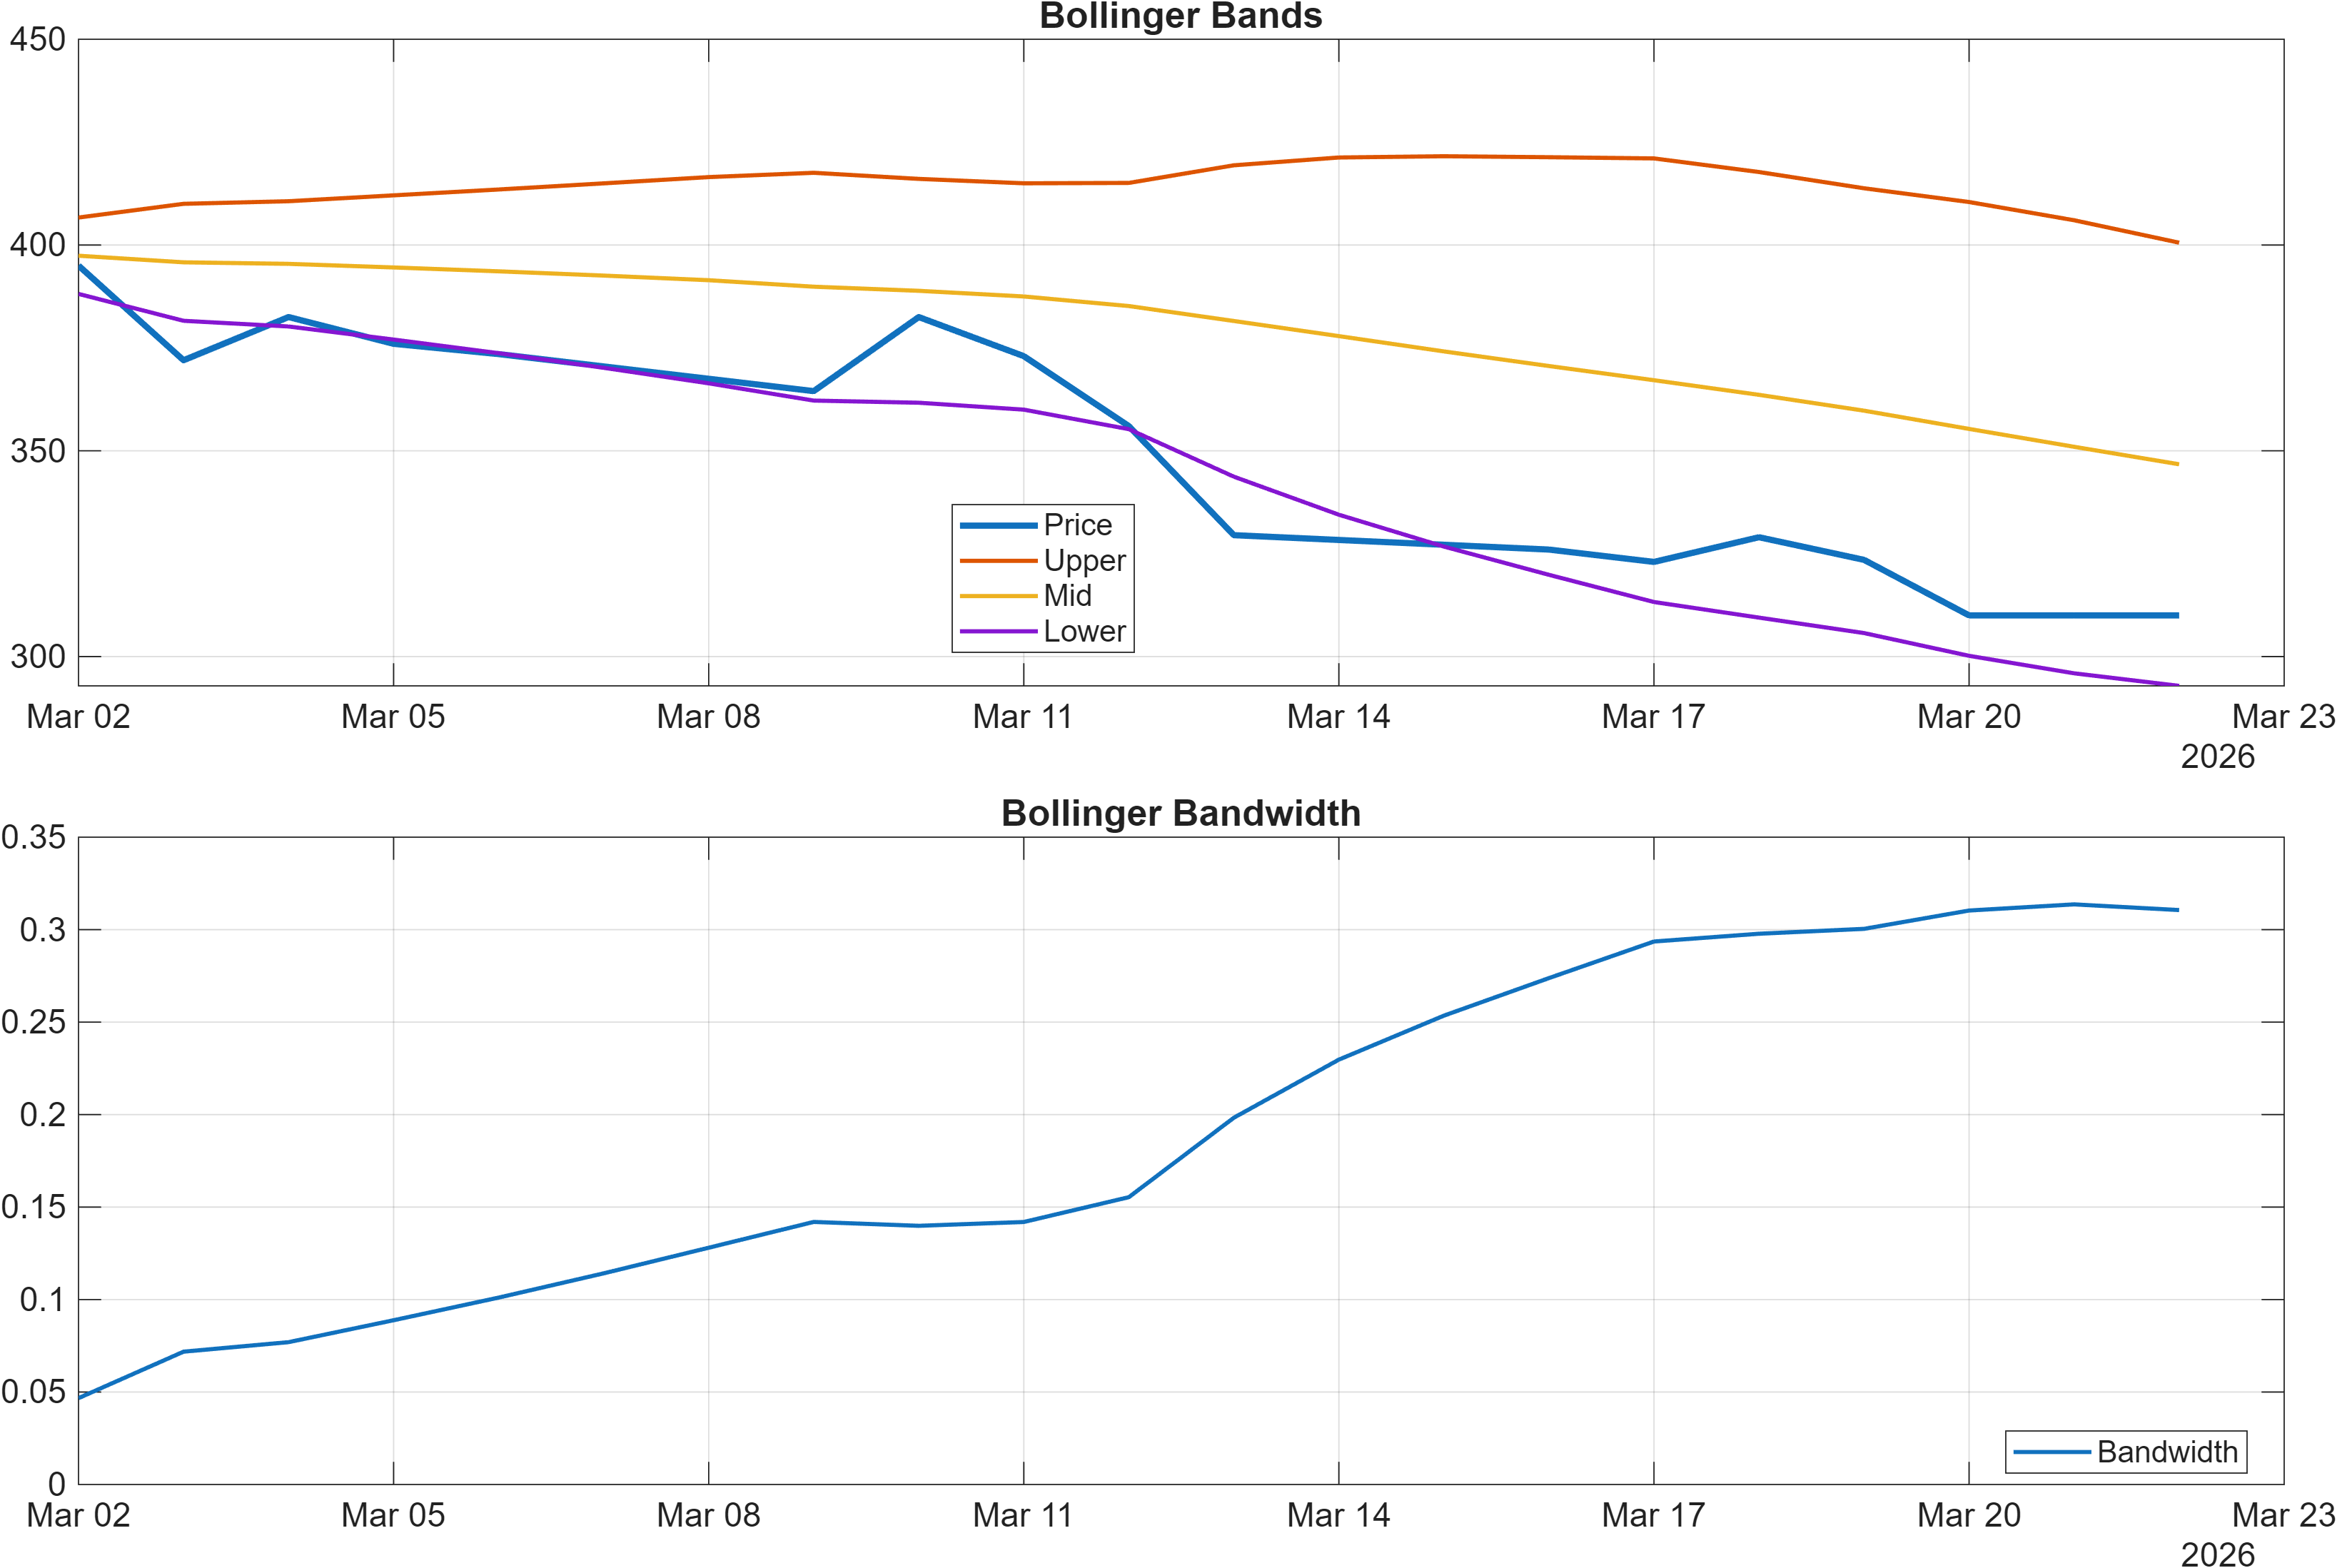
Volatility conditions add a second dimension. The latest Bollinger Bandwidth is 0.3106 (also reflected as BB Width 0.3106 in the signal table), which is best treated as a regime descriptor rather than a directional call. In practice, a stabilized bandwidth level can coincide with either consolidation before continuation or consolidation before reversal; the deciding inputs become level interaction and momentum trajectory.
For IDL.PA, the combined read is that downside momentum has been strong enough to drive RSI deep, but the next decision point is whether volatility and momentum begin to compress in a way that allows price to reclaim key structures. Without that, the signal set remains consistent with bearish persistence rather than a completed reset.
Interpretation: RSI bias = Bearish, MACD hist = -2.9349.
Interpretation: Bandwidth (volatility regime) latest = 0.3106.
4) Support / Resistance zones
Support ~ 322.6667 | Resistance ~ 421.7500
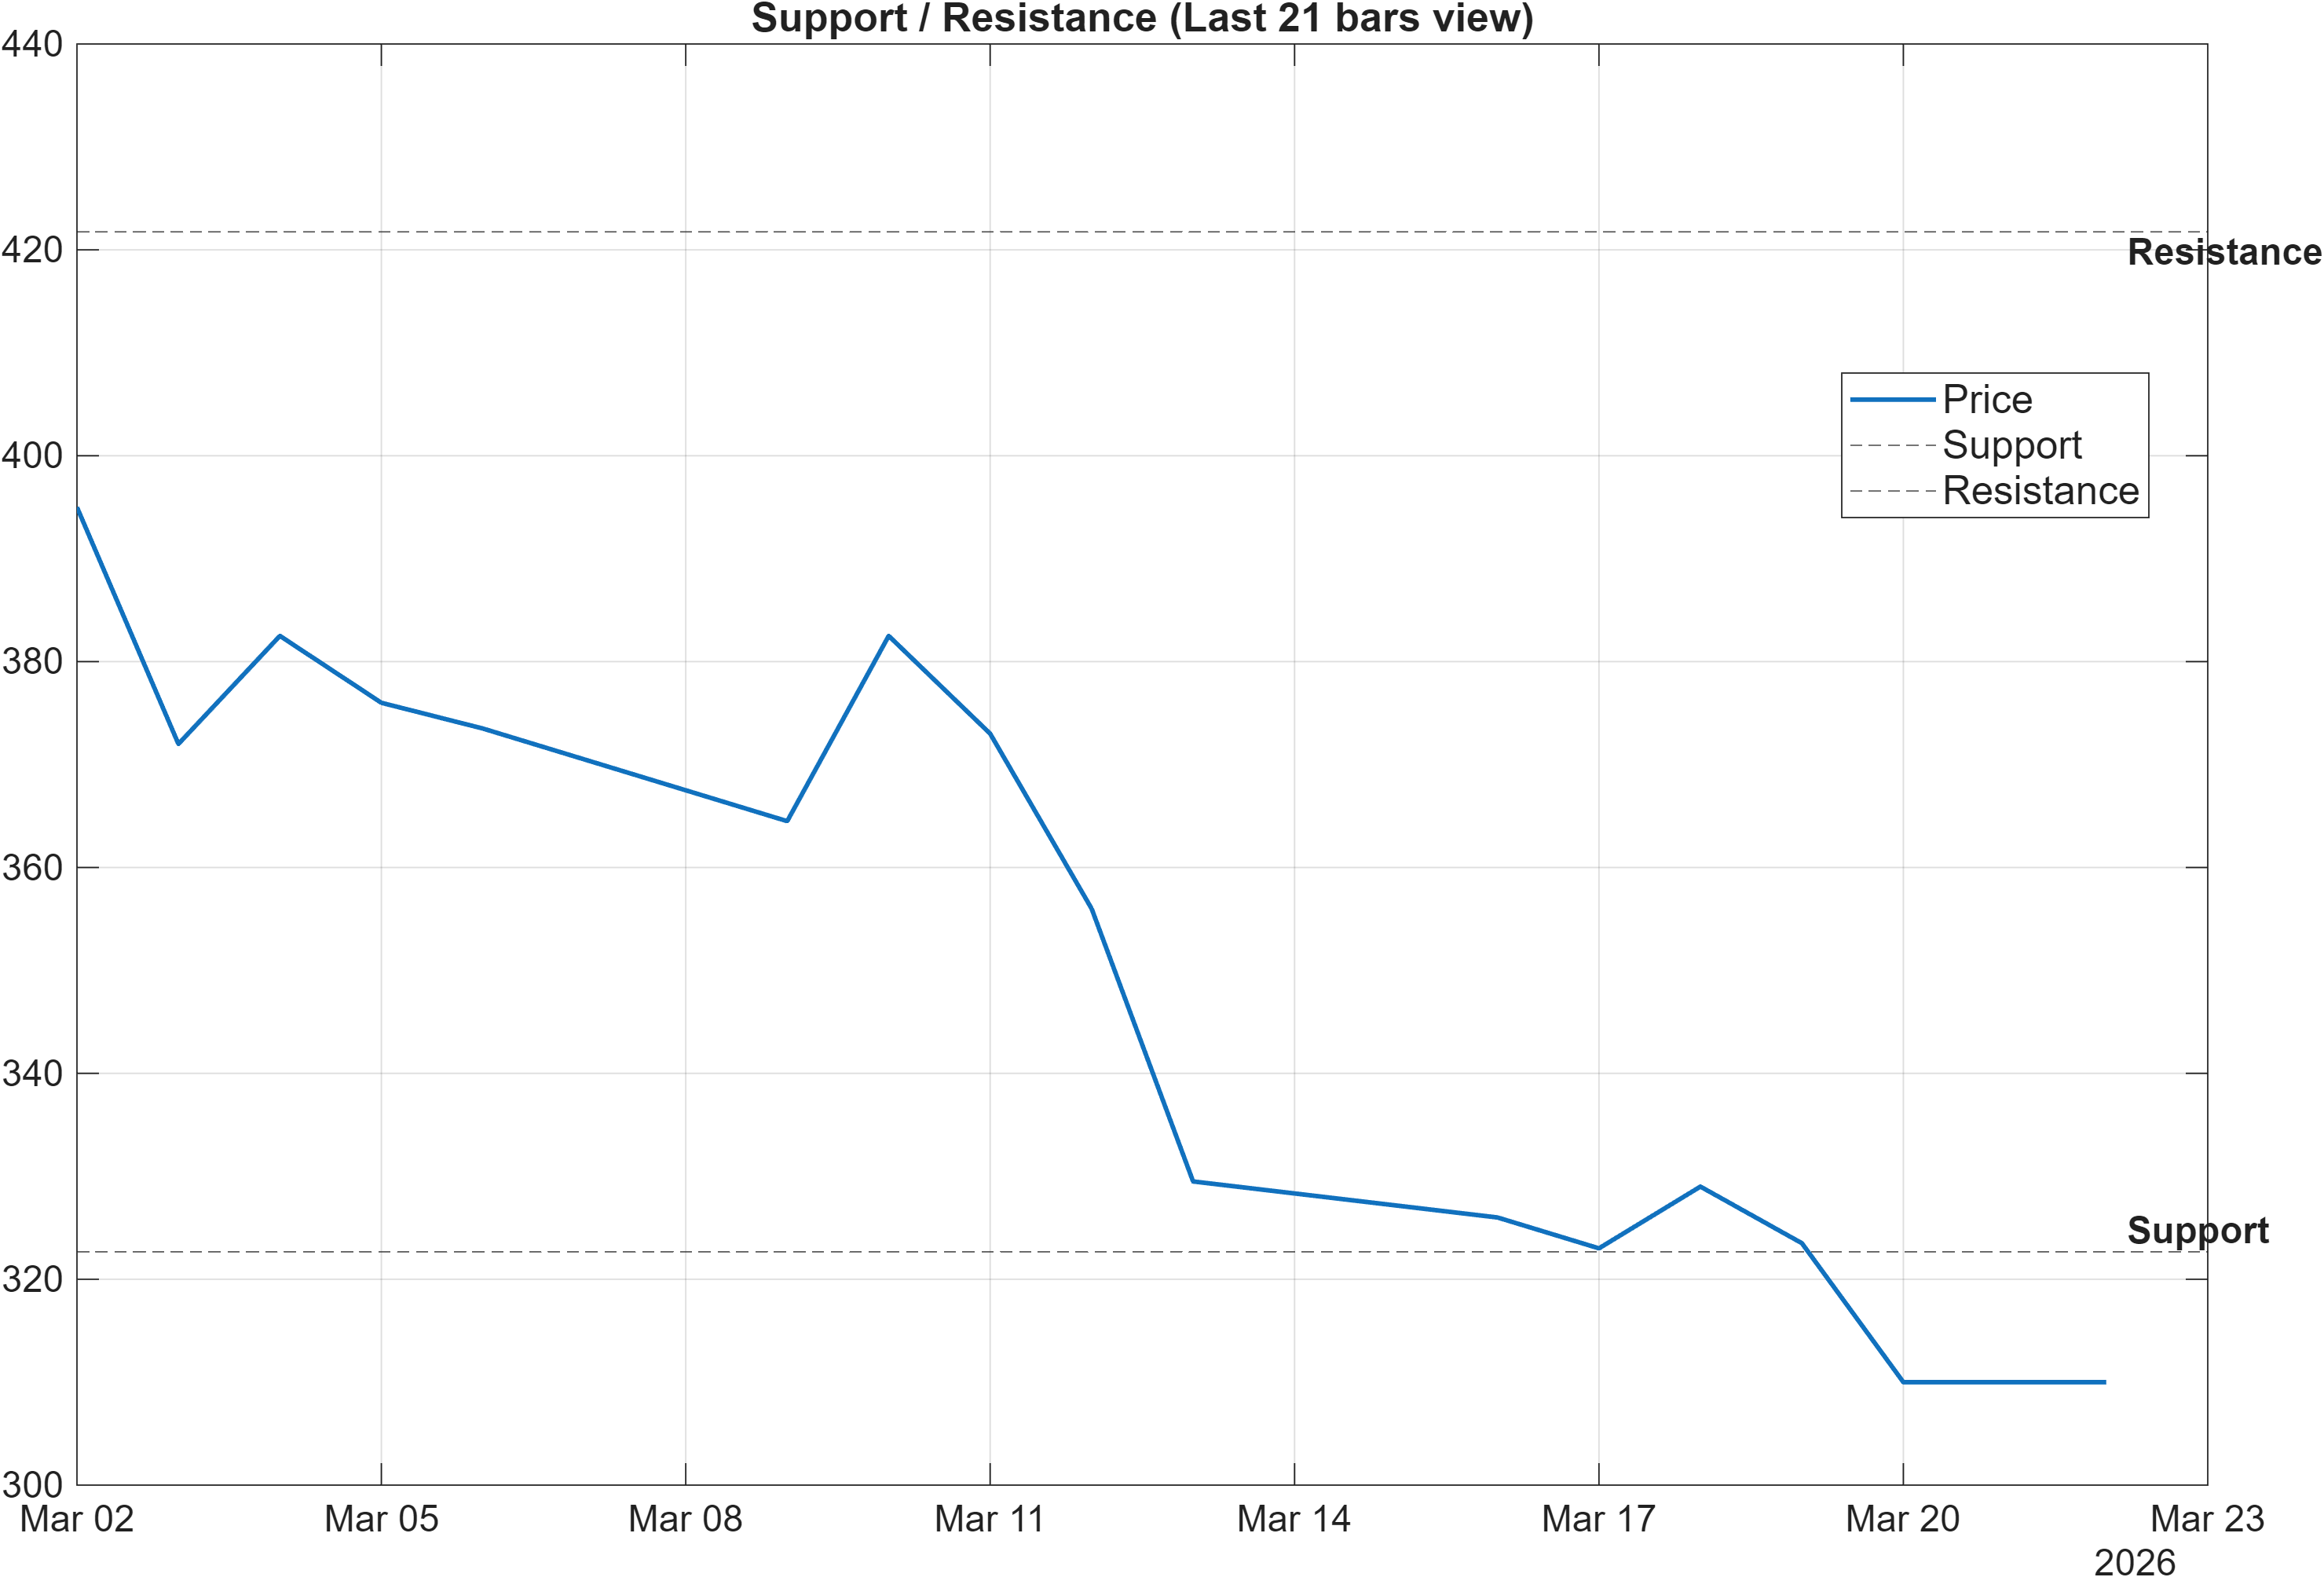
IDL.PA’s current map is unusually clean: 322.6667 defines the primary support decision zone, while 421.7500 marks the key resistance ceiling. With moving averages bearish and momentum depressed (RSI 22.75, MACD histogram -2.9349), the support level functions as the first practical test of whether the decline is being contained or becoming a broader structural breakdown.
Support zones matter most when they coincide with technical stress. The signal table’s MedPx vs Support at -3.917 frames price as positioned below the reference support anchor used in the model, which increases sensitivity to any additional weakness. A sustained failure through the support area would not only challenge the immediate tape; it would also increase the likelihood that the stronger mid/long ranks begin to deteriorate as the lookback windows absorb the drawdown.
On the upside, the resistance at 421.7500 is best read as a validation threshold for trend repair rather than a routine target. In many cases, the first attempt into resistance fails in bearish MA regimes; what improves the setup is acceptance above the zone with improved participation. This connects directly to the scenario guidance: break above resistance with volume → continuation, while close below support → signal deterioration risk.
Operationally, these two levels bracket the probability space: holding above support can allow momentum to stabilize and the rank advantage to reassert, whereas persistent trading below support can shift the regime from “corrective weakness” toward “structural repricing.”
Scenario view: Break above resistance with volume → continuation. Close below support → signal deterioration risk.
5) Quant Technical Dashboard (18 Signals)
KGNAI AI Technical Analysis Score (Deep Reinforcement Learning): Rank #1174 out of 1422 (Rank 1 represents the strongest technical positioning and a higher probability of favorable price behavior. As ranks increase toward the maximum, the probability of favorable outcomes weakens and bearish positioning becomes more dominant.) | Label: Bearish | Score: -0.651
18-Signal Technical Confluence Score: -0.556 (Bearish)
Overall Technical Score (18-signal confluence + DRL rank blend): -0.584 (Bearish)
Note: The blended score reflects signal strength weighted against broader AI technical ranking, which may temporarily diverge.
Blended technical score breakdown: -0.584 (Bearish | Bull 3 / Bear 13 / Neutral 2)
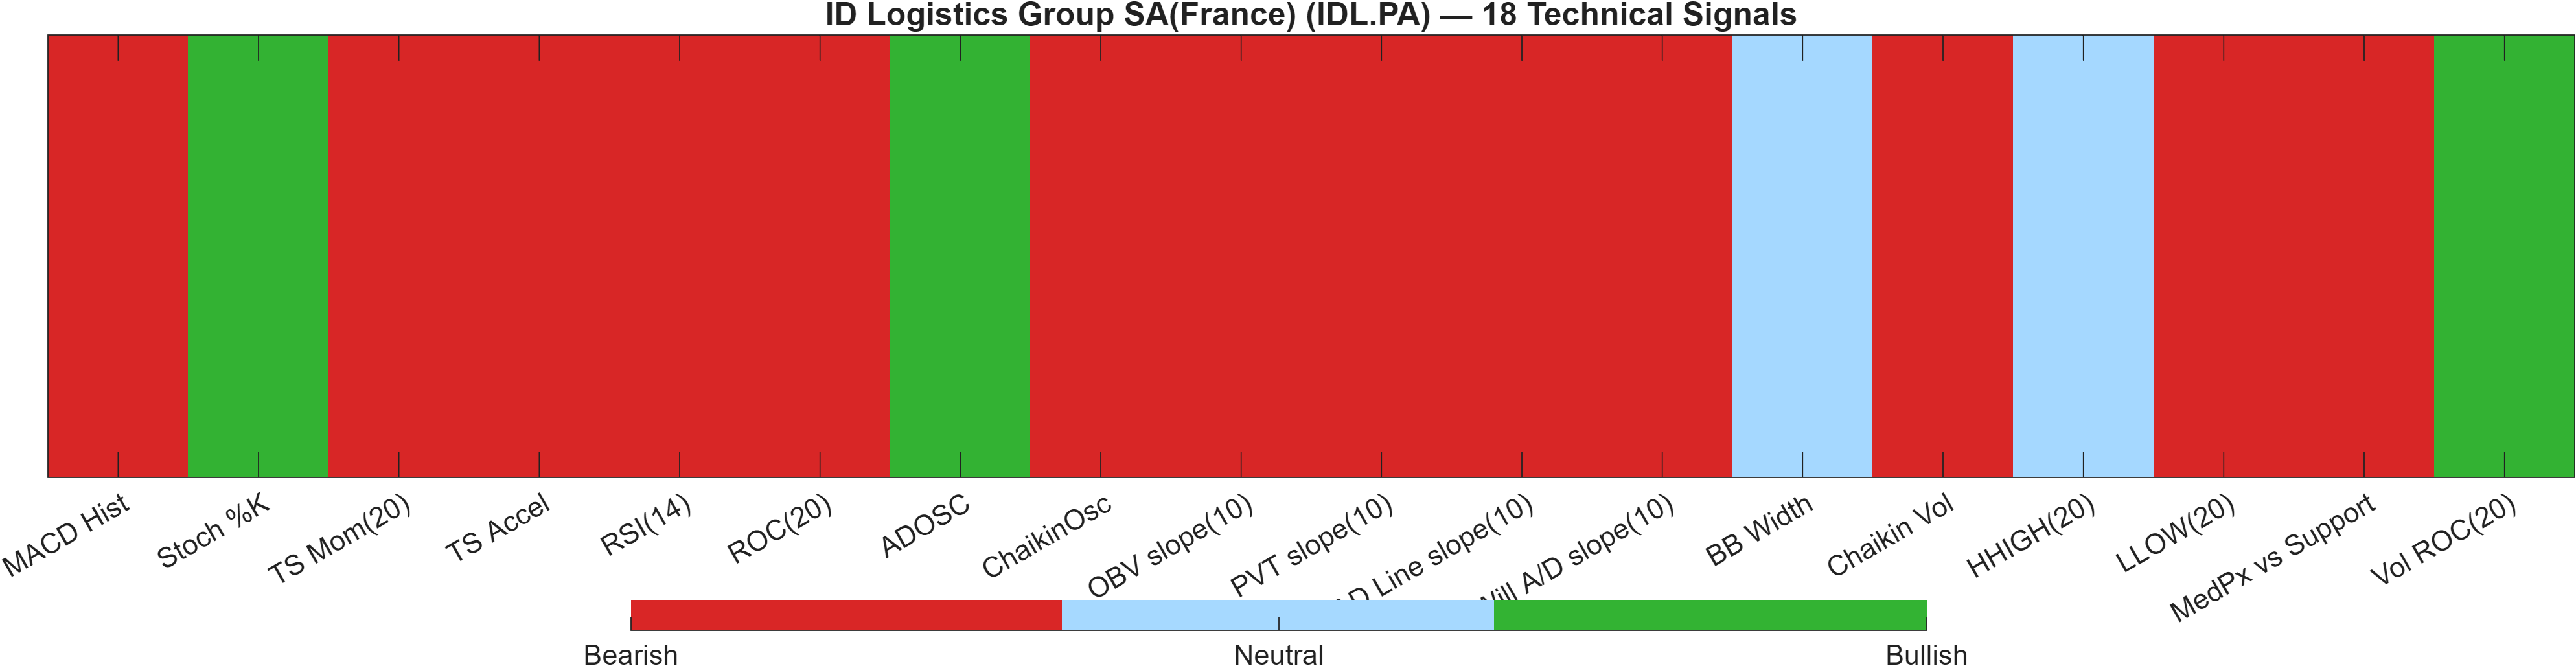
The quantitative technical layer is unambiguous: IDL.PA is currently scored as Bearish across both the rule-based confluence and the AI technical ranking overlay. The DRL technical rank (#1174 of 1422) sits in the weaker tail of the universe, and the overall technical score (-0.584) is consistent with broad signal agreement rather than a narrow indicator anomaly.
The composition matters: the breakdown shows Bear 13 / Neutral 2 / Bull 3. That kind of skew typically indicates that weakness is present across multiple independent clusters—trend, momentum, and several volume/accumulation proxies. In the signal table, the momentum complex aligns with this bias (MACD Hist -2.935, RSI(14) 22.75, ROC(20) -16.67), suggesting the bearish read is not dependent on a single oscillator.
Importantly, a few signals point to potential early-stage stabilization rather than a clean continuation. Stoch %K at 6.452 is flagged bullish, often occurring near short-term washout zones, and Vol ROC(20) at 61.78 is also bullish, which can accompany turning points if price confirms. However, these are outweighed by broader flow slopes (e.g., negative OBV/PVT/AD line slopes) and the composite score remains decisively negative.
The practical implication is signal compression vs. expansion: bulls generally want to see bearish breadth shrink (more neutrals, fewer bears) alongside price reclaiming key levels. Until then, the quant dashboard argues for respecting downside risk even as longer-horizon ranks remain supportive.
Signal table (Bull/Bear/Neutral)
| Indicator | Value | Signal |
|---|---|---|
| MACD Hist | -2.935 | Bearish |
| Stoch %K | 6.452 | Bullish |
| TS Mom(20) | -62 | Bearish |
| TS Accel | -44 | Bearish |
| RSI(14) | 22.75 | Bearish |
| ROC(20) | -16.67 | Bearish |
| ADOSC | 15.96 | Bullish |
| ChaikinOsc | -2.11e+04 | Bearish |
| OBV slope(10) | -8.335e+04 | Bearish |
| PVT slope(10) | -2052 | Bearish |
| AD Line slope(10) | -6.811e+04 | Bearish |
| Will A/D slope(10) | -89.5 | Bearish |
| BB Width | 0.3106 | Neutral |
| Chaikin Vol | 10.48 | Bearish |
| HHIGH(20) | 392 | Neutral |
| LLOW(20) | 307 | Bearish |
| MedPx vs Support | -3.917 | Bearish |
| Vol ROC(20) | 61.78 | Bullish |
Interpretation: Indicator-level signals form the base confluence, which is then adjusted using a separate AI-driven technical ranking model. The final technical score summarizes this combined view.
6) News sentiment + extractive gist
Sentiment score (avg): 0.168 | Positive: 57% | Neutral: 43% | Negative: 0%
KGNAI AI News Sentiment Score (normalized -1 to +1): 1.00 (as of 2026-03-11) | Label: Bullish | Overall news score: 0.96
Positive Developments
Recent coverage across major financial outlets indicates a constructive fundamental narrative centered on reported operating and revenue performance. The news sentiment distribution is notably clean, with 57% positive, 43% neutral, and 0% negative, producing an average sentiment of 0.168. KGNAI’s normalized news sentiment score at 1.00 (with an overall news score of 0.96) is consistent with a broadly supportive flow of updates rather than a contested information backdrop. For market behavior, positive news tone can act as a stabilizer when price is technically stressed (e.g., RSI 22.75) by reducing headline-driven downside pressure. However, the highest informational value comes when supportive tone coincides with better price acceptance near the defined decision zones (support ~322.6667 and resistance ~421.7500).
Neutral / Mixed Developments
A meaningful portion of the item flow appears administrative or informational in nature, which is consistent with the 43% neutral share in the sentiment mix. This type of reporting typically does not shift price discovery on its own, but it can affect microstructure conditions—such as liquidity expectations and market participation—especially when the technical backdrop is fragile. With the tape still reading bearish across trend and momentum filters (including MA structure bearish and MACD histogram -2.9349), neutral updates tend to matter most for what they do not introduce: surprise risk. In other words, the current news composition supports a “wait for confirmation” posture rather than forcing a reassessment of the technical probabilities already implied by the dashboard.
Negative / Risk Signals
While the quantitative sentiment feed shows 0% negative, risk monitoring remains relevant because the market’s technical state is still weak (e.g., overall technical score -0.584 and DRL rank #1174). In this setting, even non-negative headlines can fail to support price if positioning and flows remain adverse. Risk should therefore be framed as implementation and confirmation risk: the key question is whether supportive coverage can translate into improved participation and level defense. If price fails to hold 322.6667, the narrative tailwind may be insufficient to offset the mechanical selling pressure implied by multiple bearish flow slopes and negative momentum readings. Conversely, a successful repair toward 421.7500 would reduce the asymmetry implied by the current technical regime.
- Whether price can repeatedly defend 322.6667 as momentum attempts to lift from RSI 22.75.
- Any improvement in bearish breadth (currently Bear 13) alongside a less negative MACD histogram (from -2.9349 toward zero).
- Acceptance above 421.7500 with volume, consistent with the stated continuation condition.
Sources referenced: Reuters, Bloomberg, Yahoo Finance, MarketWatch, Investing.com
Snapshot: AI Rank (Short–Mid–Long): Mixed (Bullish tilt) (Neutral–Bullish–Bullish) · Technical Confluence: Bearish · Key Levels: Support ~322.67 | Resistance ~421.75 · News Sentiment: Positive
7) Sources
Source links were present in the provided data; URLs are not reproduced here per publication formatting rules for this section. Not available in the provided data.
You may also like: How KGNAI AI ranks instruments across global markets
Disclaimer: KGNAI provides AI-generated analytics and educational market commentary only. This is not financial advice. Markets involve risk. Always do your own research.