
Norconsult ASA (NORCO.OL) — 15-Mar-2026 Technical Stance: Bullish Ranks with Mixed Trend Structure
Norconsult ASA (NORCO.OL) screens as a high-conviction relative leader in KGNAI’s cross-asset Europe universe, with the daily rank #8, weekly rank #3, and monthly rank #7 out of 1424 instruments. That short-to-mid ranking strength contrasts with a more cautious trend read: the price is flagged Bearish vs MA50, and MA50 vs MA200 is also Bearish, implying that leadership is currently being driven by factors beyond classic moving-average alignment. Momentum inputs are more balanced—RSI(14) 48.79 is neutral while MACD histogram 0.1599 is constructive—within a relatively contained volatility regime (Bollinger bandwidth latest 0.0419). Key decision levels remain well-defined at support ~38.9500 and resistance ~45.7500, with news sentiment scoring strongly positive (avg 0.379; normalized score 1.00).
Key Takeaways
- Rank stance: Short-term Bullish (Daily #8) | Mid-term Bullish (Weekly #3; Monthly #7) | Long-term: Not available
- Technical confluence: 18-signal score 0.389 and overall technical score 0.369 both Bullish, despite a Neutral DRL technical rank (#482/1424).
- Key levels: Support ~38.9500 | Resistance ~45.7500.
- News sentiment bias: Positive (avg 0.379; normalized 1.00).
- Confirmation / invalidation: A break above 45.7500 with volume supports continuation; a close below 38.9500 raises deterioration risk.
What KGNAI Measures
KGNAI evaluates assets using large cross-sectional datasets built from millions of structured data points. Inputs incorporate fundamental metrics, technical structures, and systematically processed news sentiment. Statistical models, machine learning, and AI frameworks are used to assess relative positioning, signal alignment, and probabilistic behavior across broad universes.
How to Read This Report
- Ranks are comparative across the tracked universe, not absolute price targets.
- Confluence reflects alignment among independent signal groups.
- Support/resistance levels are probabilistic decision zones, not guarantees.
- Sentiment provides contextual bias within the broader analytical framework.
1) KGNAI AI Analysis
As of: 15-Mar-2026 | Ticker: NORCO.OL | Region: EUROPE | Total universe size: 1424 ranked instruments
- Daily rank: #8 out of 1424 — Bullish
- Weekly rank: #3 out of 1424 — Bullish
- Monthly rank: #7 out of 1424 — Bullish
- 3-Monthly rank: Not available for this horizon — Not available
- 6-Monthly rank: Not available for this horizon — Not available
- Yearly rank: Not available for this horizon — Not available
NORCO.OL sits in the top decile of the tracked universe across the daily, weekly, and monthly horizons, with ranks clustered at #8, #3, and #7 out of 1424. That type of cross-horizon consistency tends to matter more than any single reading because it suggests the instrument is repeatedly surfacing across independent tests rather than benefiting from one transitory signal.
The key analytical tension is that the rank behavior is decisively Bullish on short and mid horizons while longer-horizon ranks are Not available in the provided data. In practice, this means the report can speak with higher confidence about relative positioning now than about longer-cycle stability. Readers should frame the signal as an institutional-style “relative strength screen” rather than a full-cycle view.
Within KGNAI’s framing, lower ranks imply stronger probability of favorable performance behavior relative to peers. With NORCO.OL ranking inside the first 10 names daily and monthly, the bar for invalidation typically becomes more technical: whether price action can convert relative strength into sustainable trend structure around the key levels (38.9500 support and 45.7500 resistance) and whether momentum stays constructive (e.g., MACD hist 0.1599) without RSI overheating (RSI(14) 48.79 is currently neutral).
Term view: Short-term: Bullish. Mid-term: Bullish. Long-term: Not available.
Want the full universe and complete rank tables? Unlock full access on KGNAI: https://www.kgnai.com/pricing
2) Price & trend overview
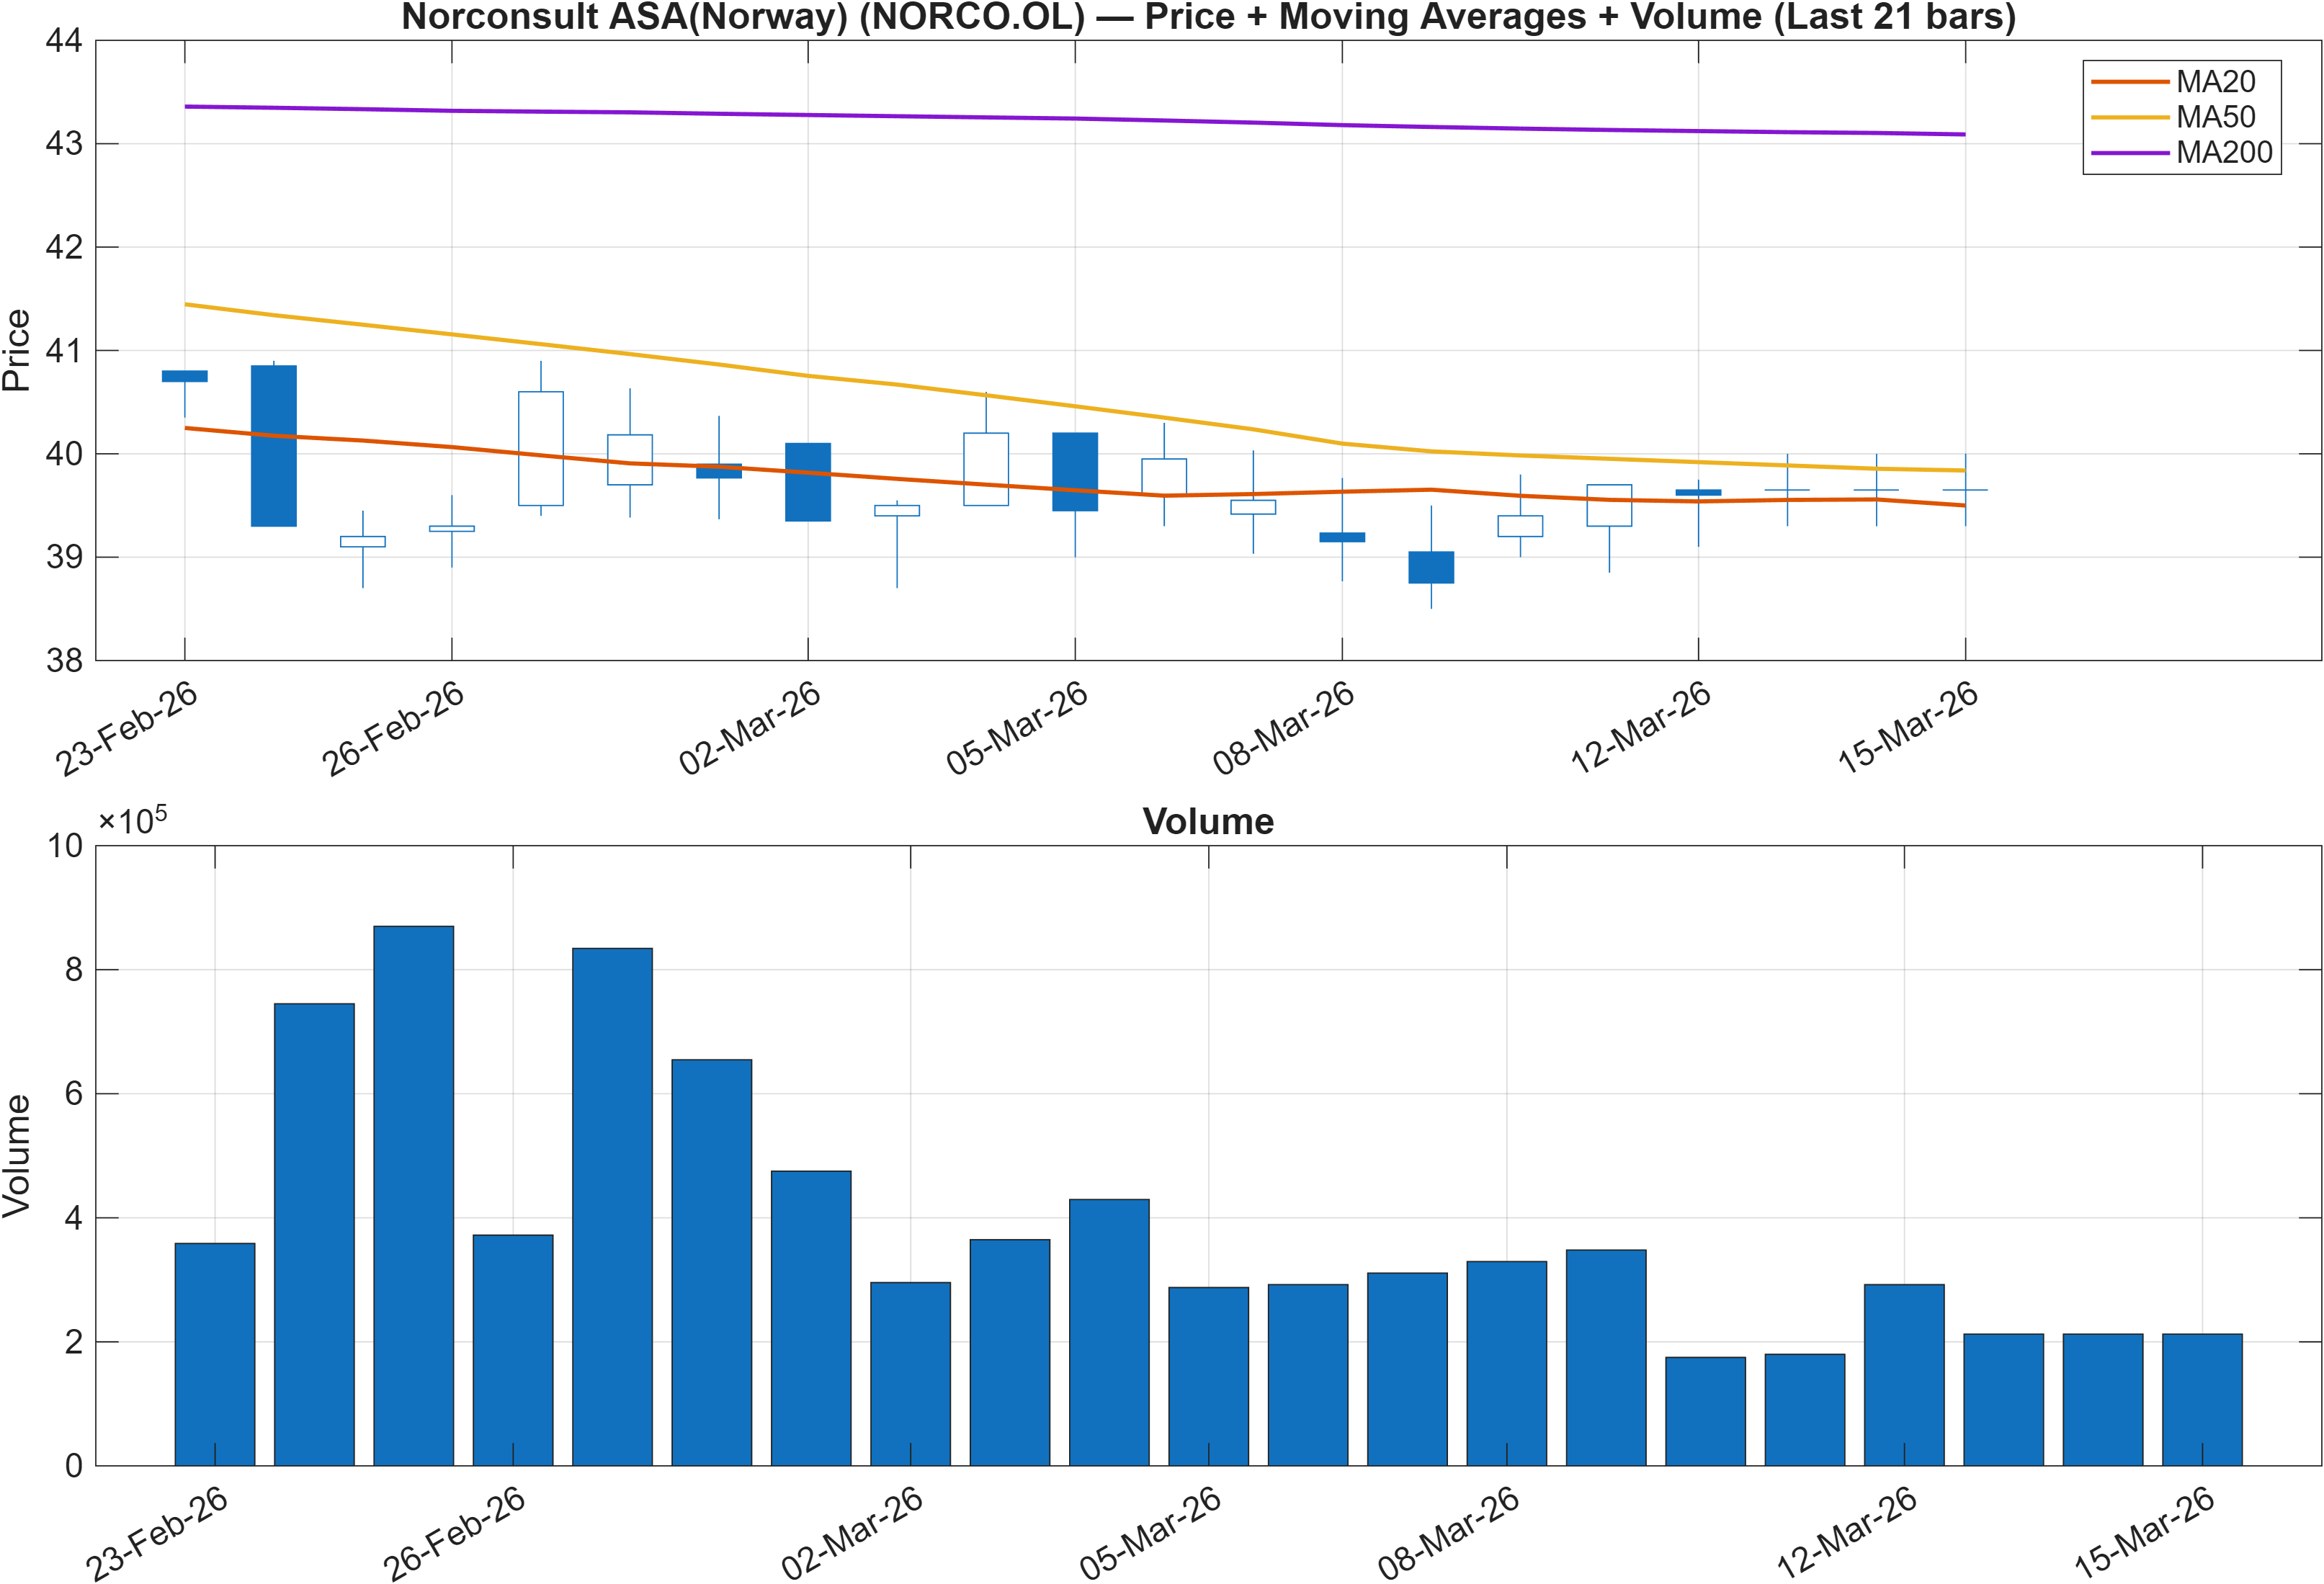
The moving-average structure is currently flagged as Bearish in two important ways: close vs MA50 is bearish, and MA50 vs MA200 is bearish. Taken together, this indicates the market has not yet transitioned into a classic trend-following “positive stack” even though the KGNAI ranks are strongly bullish (weekly #3, monthly #7). That divergence is analytically useful: it suggests the instrument may be behaving like a relative-strength name that is still repairing its longer trend scaffolding.
In these configurations, institutional readers often focus on whether price can reclaim intermediate trend proxies while maintaining risk-defined levels. Here, the most actionable zones are the report’s support and resistance levels: 38.9500 as the downside decision point and 45.7500 as the upside inflection. A market that is genuinely strengthening will often start to hold above support on pullbacks while repeatedly pressuring the resistance band.
The trend read should also be interpreted alongside volatility conditions. With Bollinger bandwidth latest at 0.0419, the regime is not characterized as highly expanded. That matters because low-to-moderate bandwidth conditions can allow moving-average signals to lag—particularly if the name is transitioning from consolidation into an early-stage advance. The rank persistence across daily/weekly/monthly horizons keeps the focus on whether the next push can change the moving-average diagnostics from bearish to neutral/constructive without losing the 38.9500 floor.
Interpretation (from provided data): Close vs MA50 = Bearish, MA50 vs MA200 = Bearish.
3) Momentum & volatility dashboard
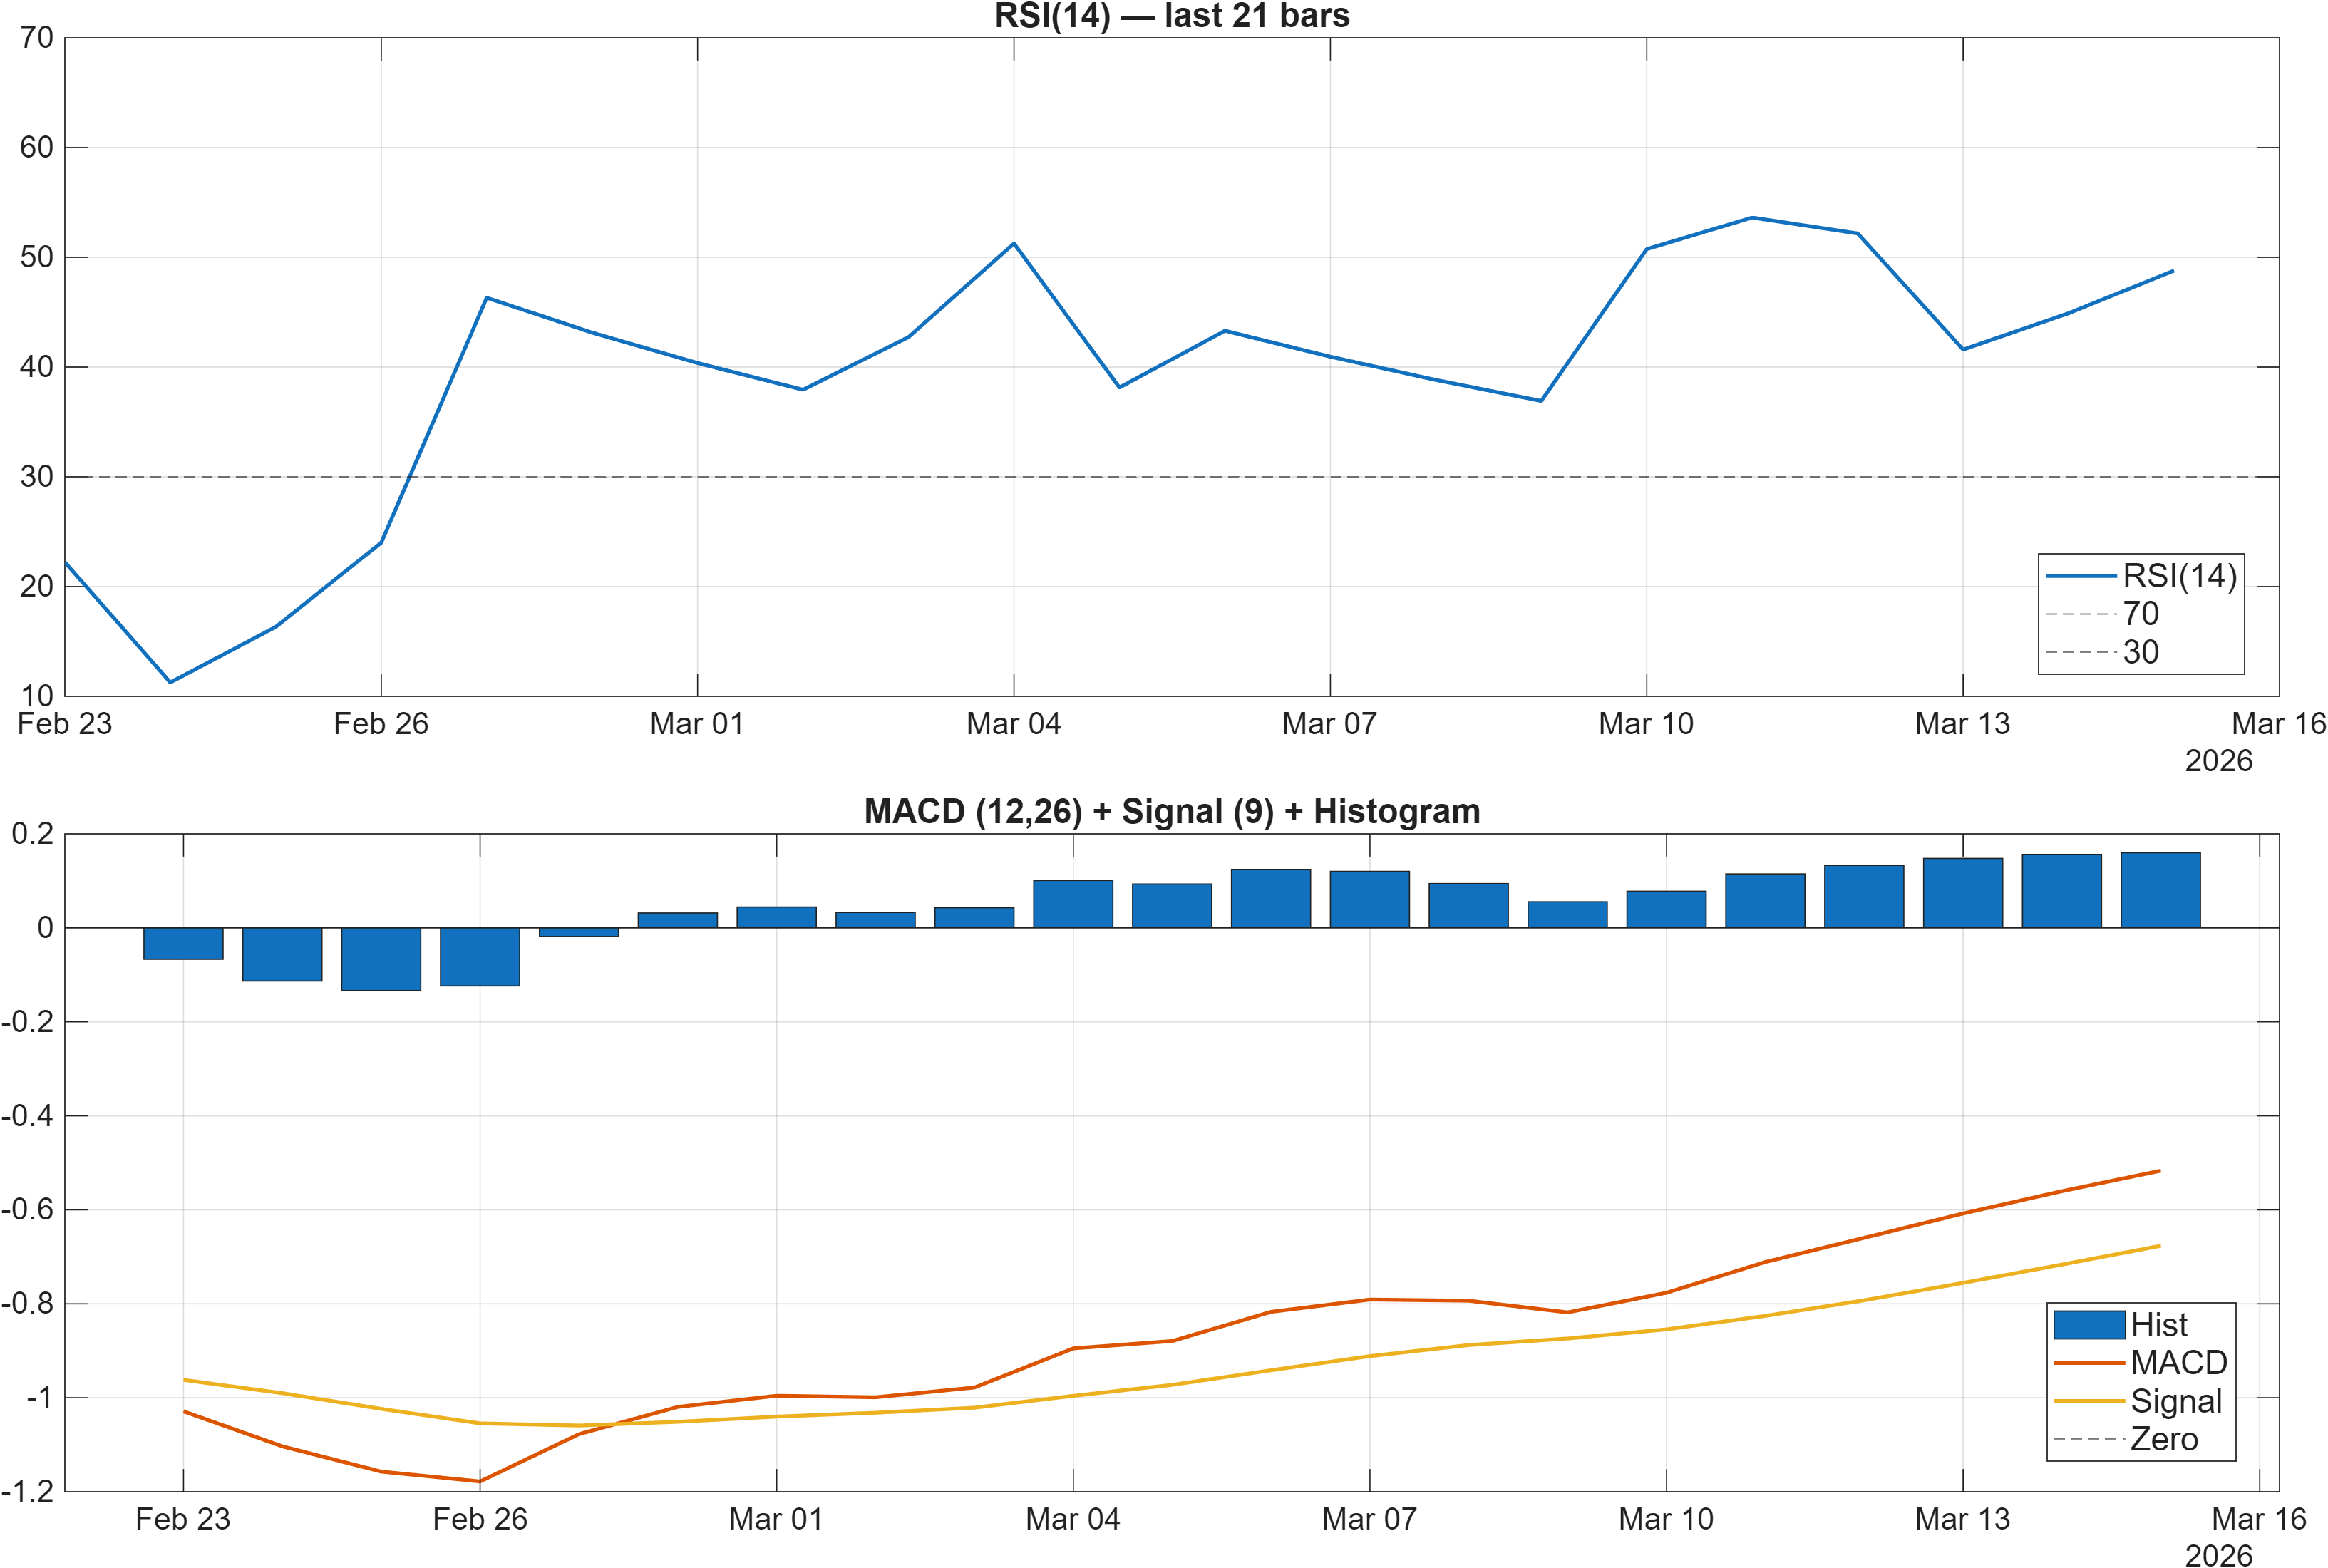
Momentum is best described as constructive but not extended. RSI(14) 48.79 is explicitly neutral, which typically aligns with “range-to-early-trend” behavior rather than an overbought impulse. In contrast, the MACD histogram at 0.1599 is positive, pointing to improving underlying momentum even if price has not yet produced a decisive trend confirmation through the moving averages.
This RSI–MACD split is often seen when a market is transitioning: RSI hovers near the midline while MACD improves as the faster components of price action begin to recover. The analytical question becomes whether MACD strength can persist long enough to pull RSI upward into a more directional zone, or whether the positive MACD reading fades back as price stalls under resistance (45.7500).
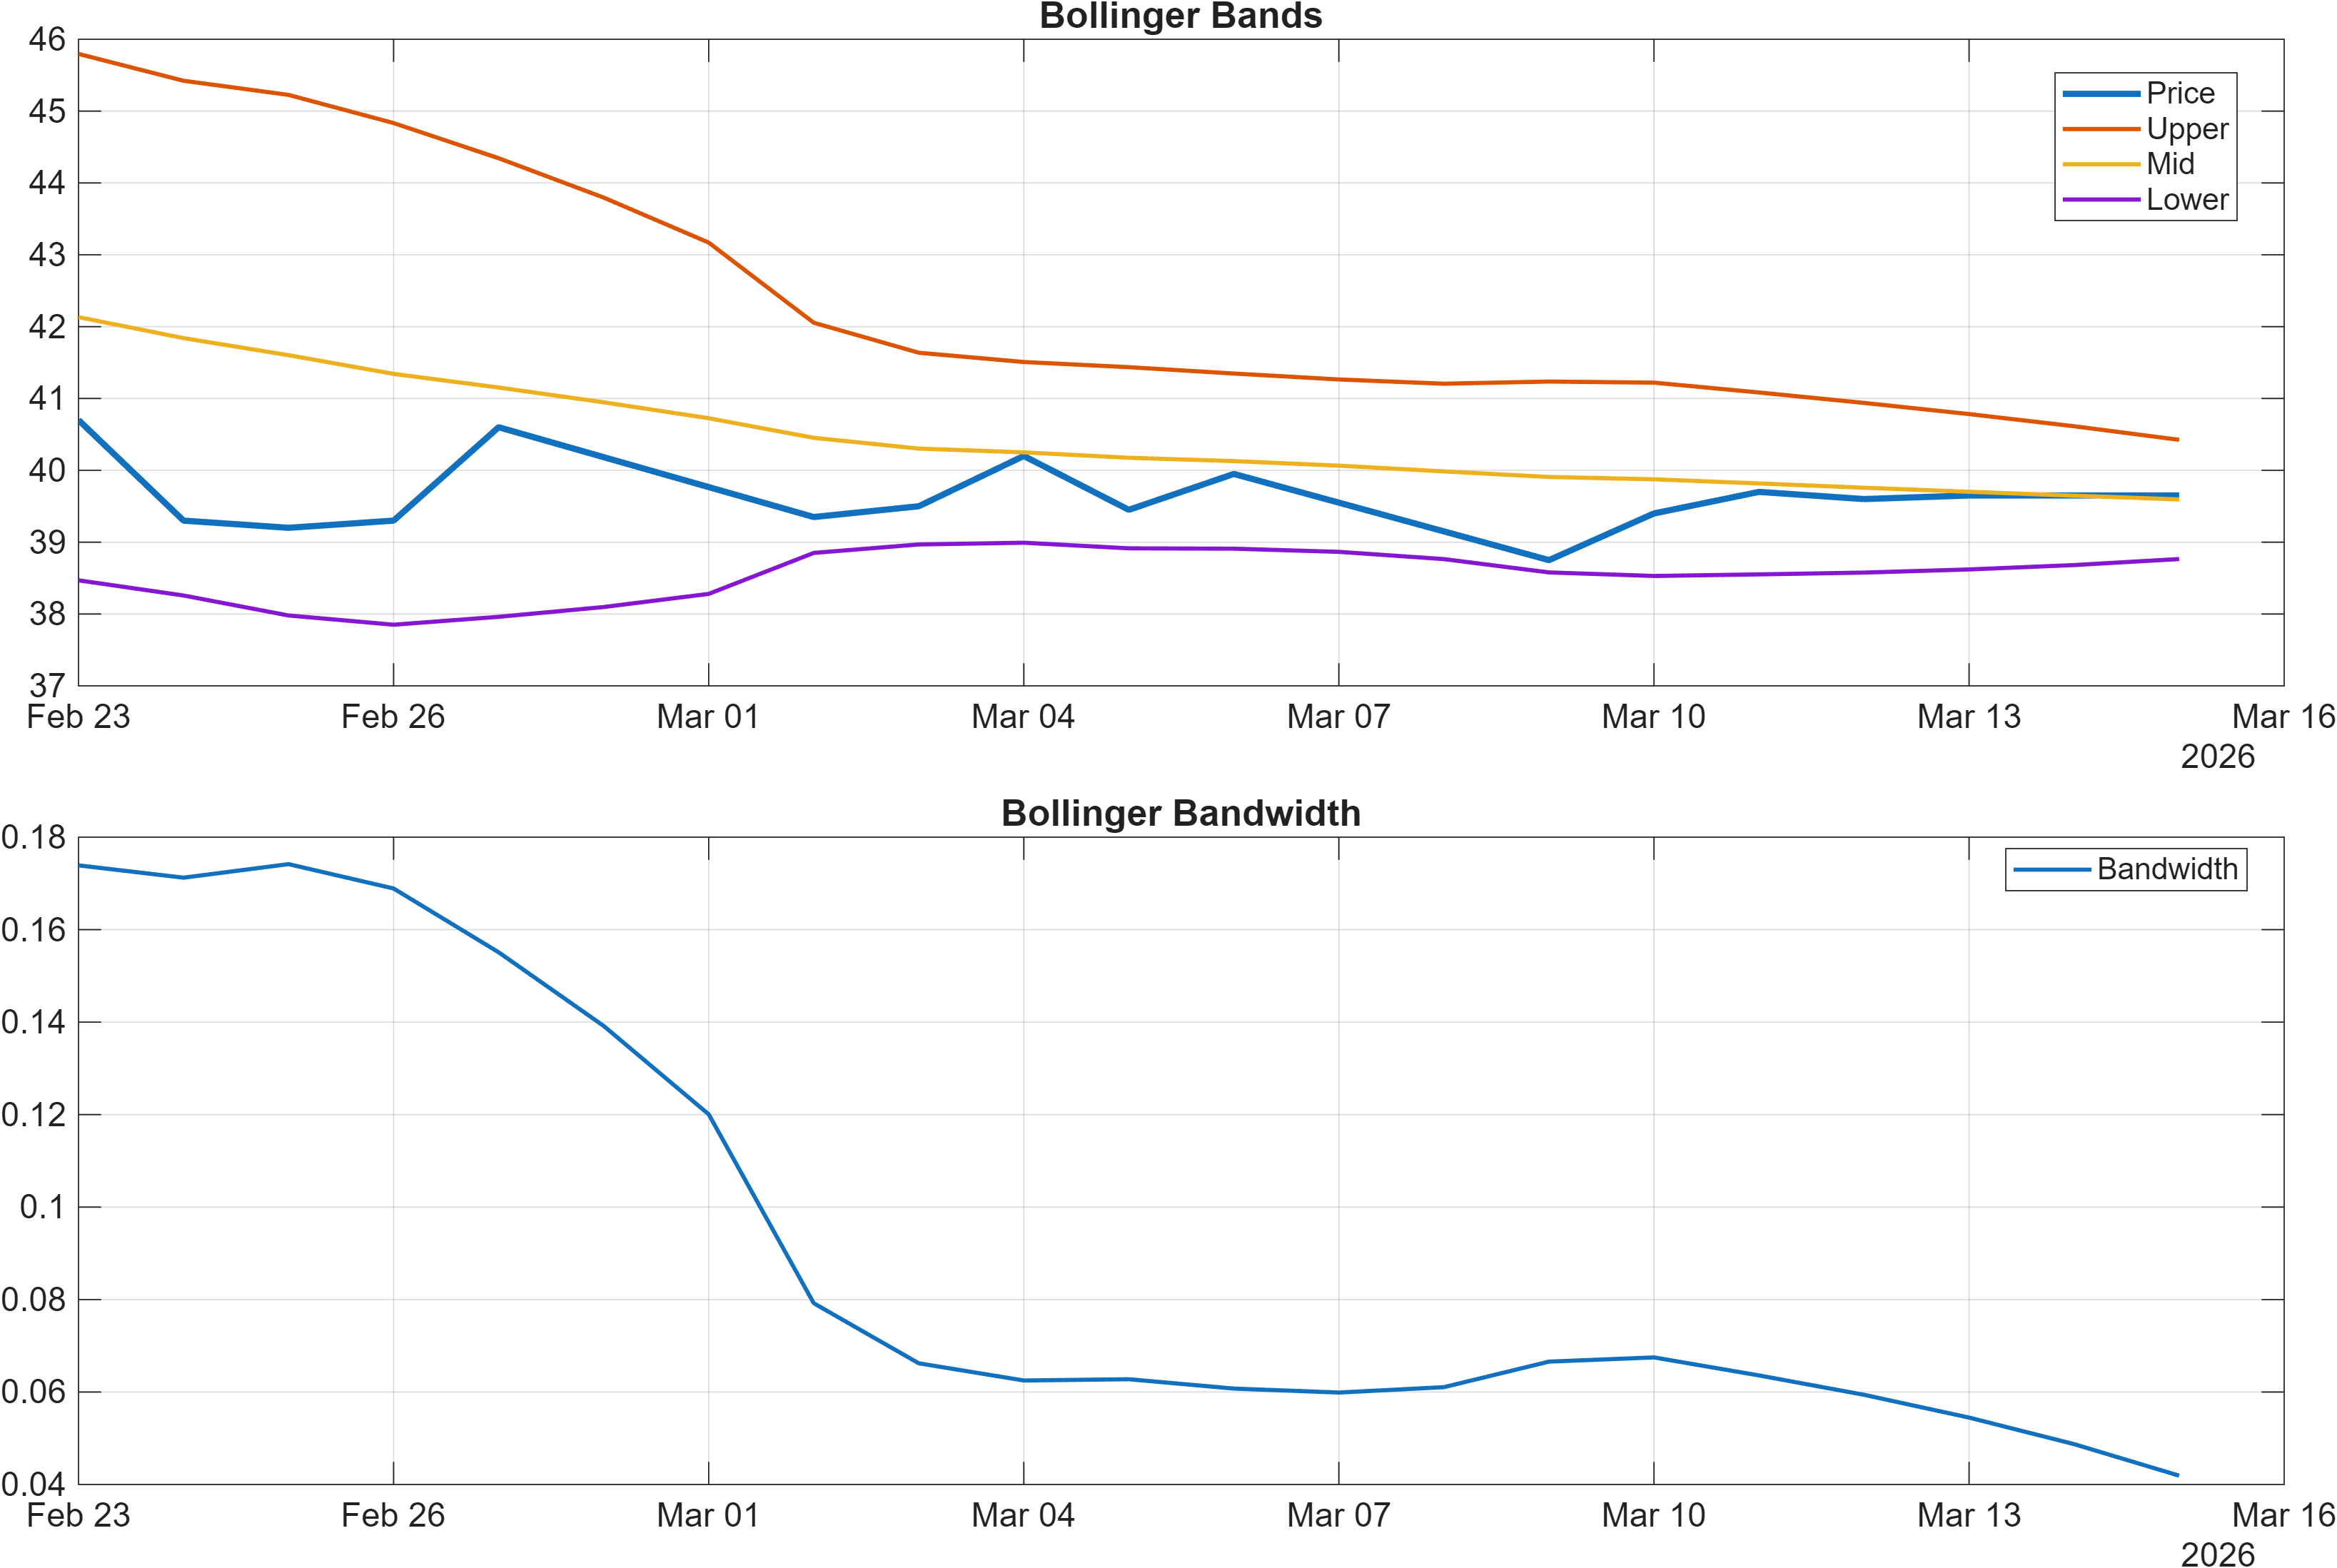
Volatility remains comparatively contained with the latest bandwidth at 0.0419 (table shows 0.04191), which can be interpreted as a lower-expansion regime versus high-volatility breakouts. In this context, breakouts—if they occur—often require clearer catalysts in order flow or volume rather than being “carried” by volatility expansion alone. That makes the resistance level (45.7500) and the report’s volume condition especially relevant.
Interpretation (from provided data): RSI bias = Neutral, MACD hist = 0.1599. Bandwidth latest = 0.0419.
4) Support / Resistance zones
Support ~ 38.9500 | Resistance ~ 45.7500
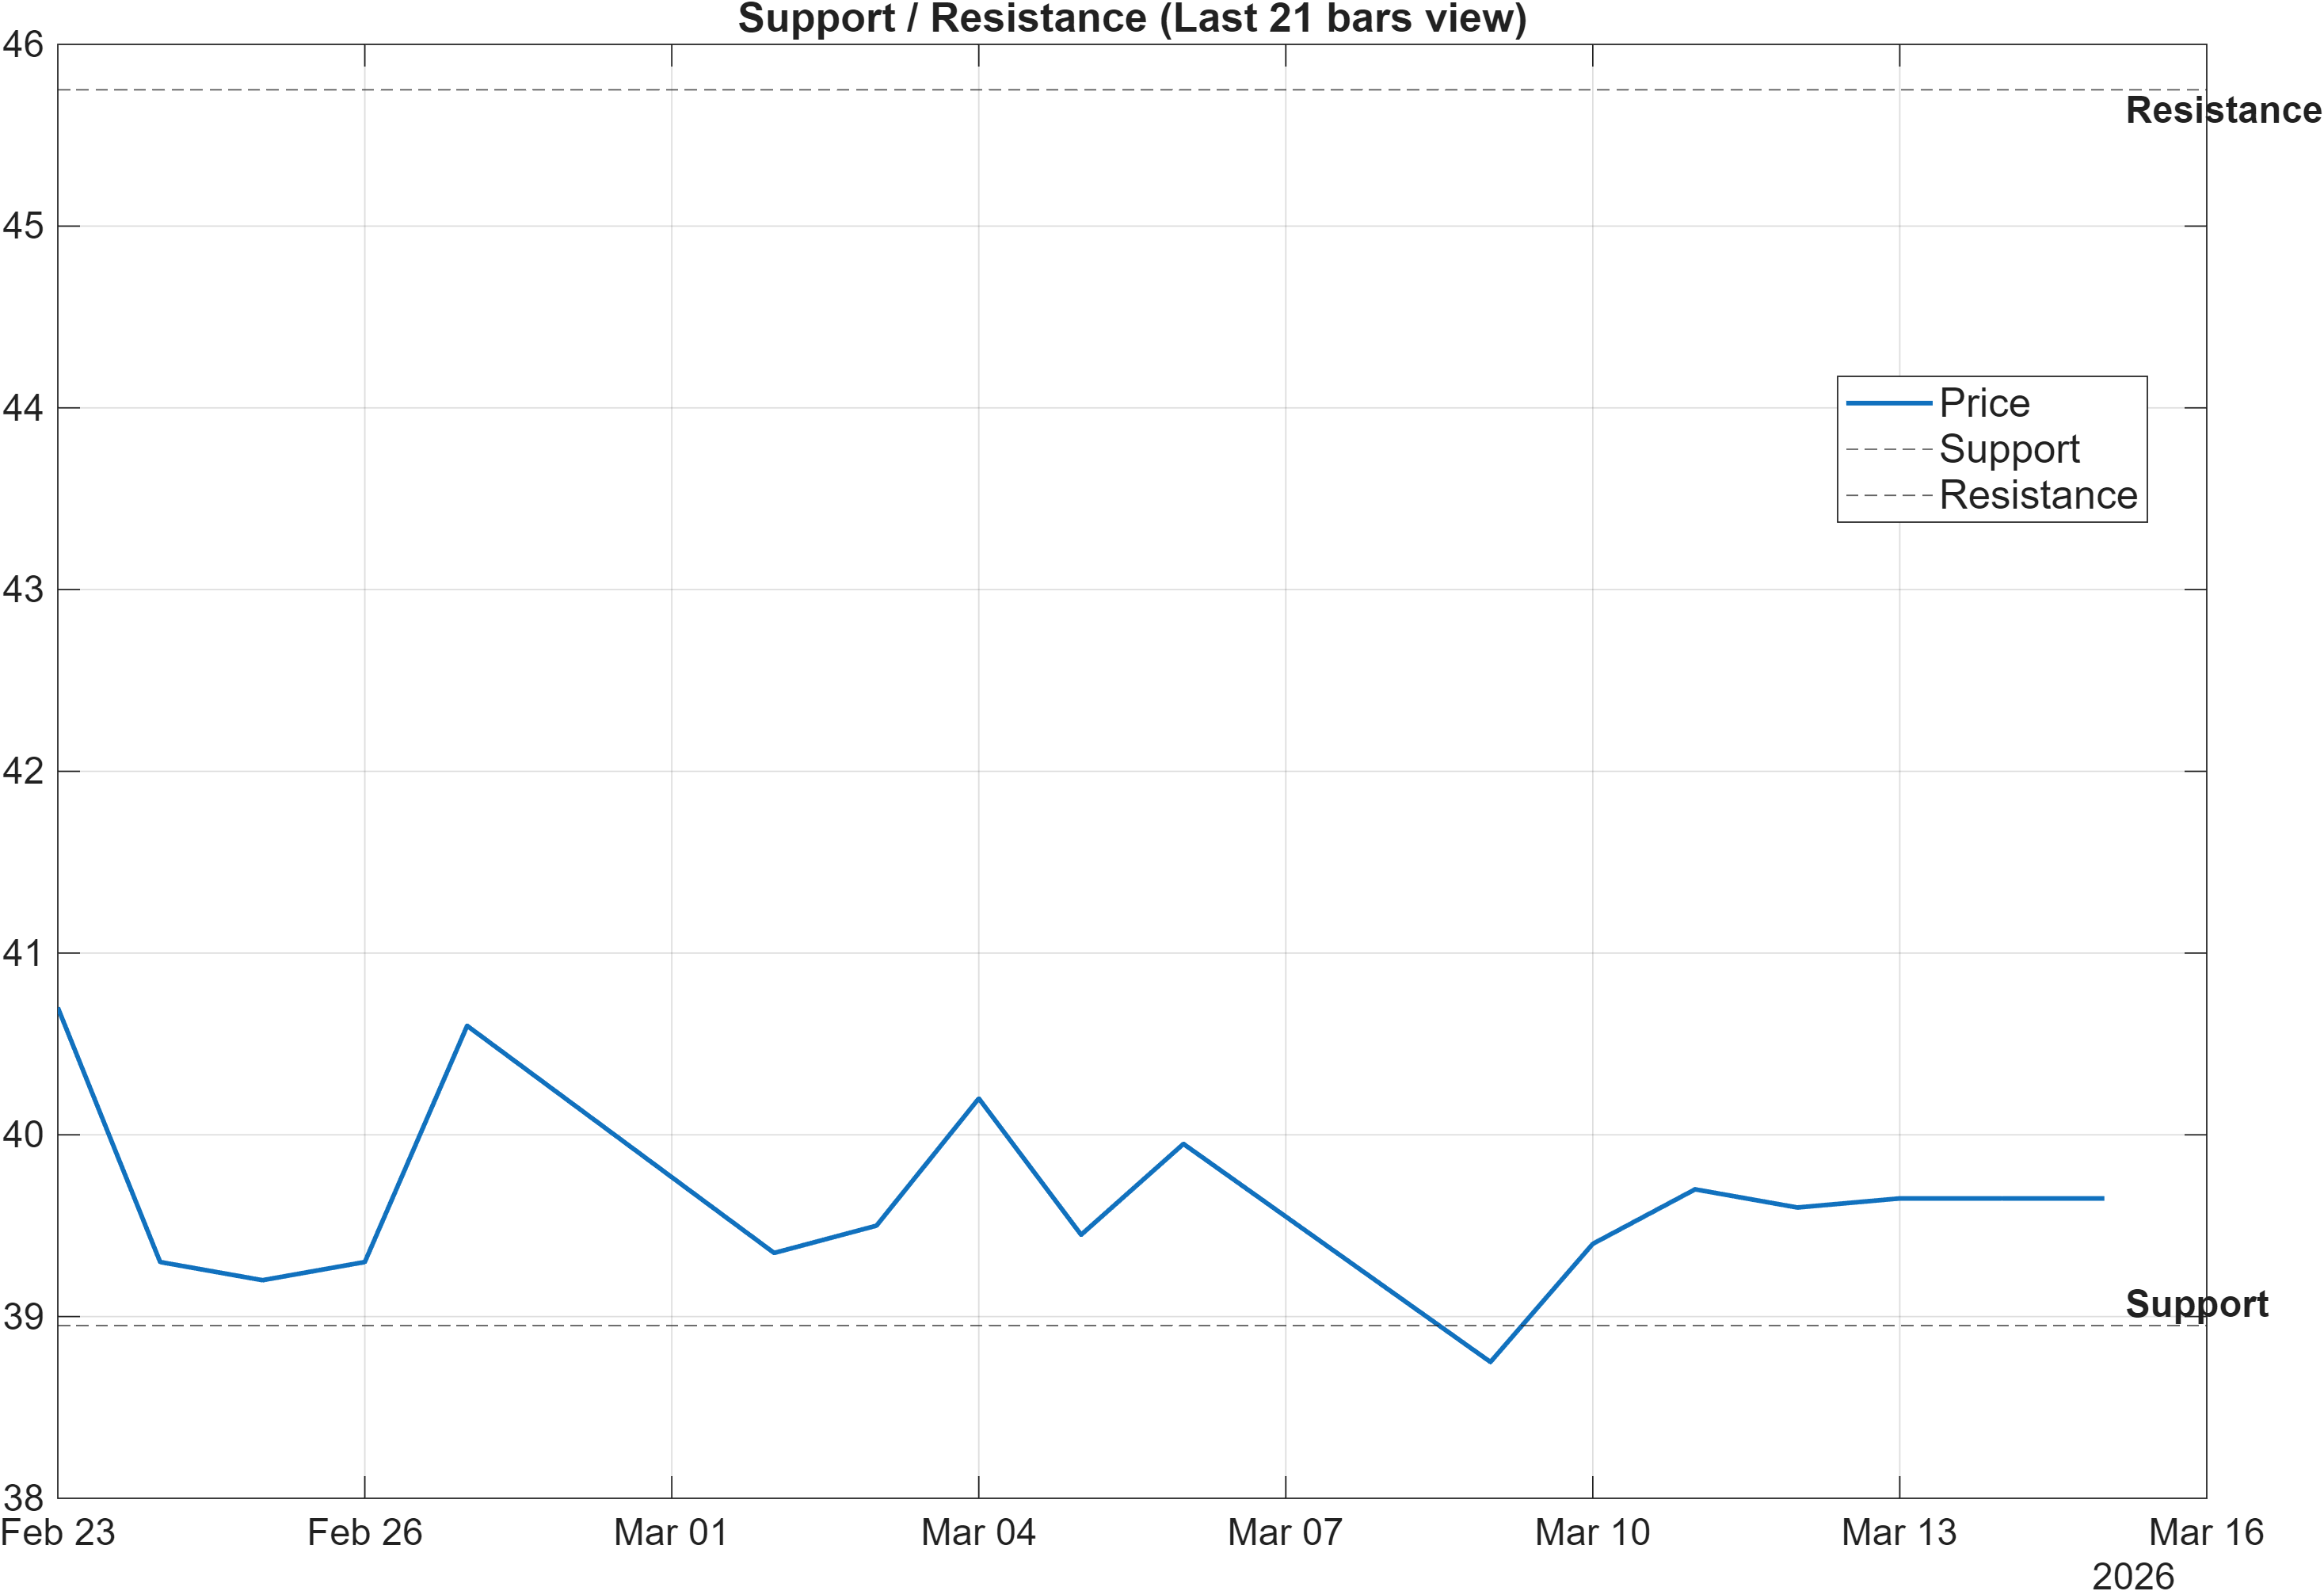
The current structure presents a clean two-sided framework: 38.9500 defines the near-term downside boundary, while 45.7500 marks the upside threshold where continuation becomes more plausible. Because the moving-average read is bearish (close vs MA50 and MA50 vs MA200), these horizontal levels carry extra weight—trend-following confirmation is not yet doing the “risk management work,” so levels become the primary probabilistic decision zones.
A key feature of this setup is the interaction between levels and volatility regime. With Bollinger bandwidth at 0.0419, the market is not signaling a high-expansion environment; therefore, breaks can be more failure-prone unless they are accompanied by stronger participation. That aligns with the scenario statement that a break above resistance with volume supports continuation.
On the downside, a close below 38.9500 would represent a meaningful deterioration signal in this report’s framework because it would violate the defined support zone while the moving-average trend is already bearish. In that case, even positive momentum readings such as MACD hist 0.1599 can lose interpretive value if price fails at the most visible structural boundary. Conversely, continued defense of support while repeatedly probing 45.7500 would keep the rank strength (daily #8, weekly #3) aligned with improving price structure.
Scenario view (from provided data): Break above resistance with volume → continuation. Close below support → signal deterioration risk.
5) Quant Technical Dashboard (18 Signals)
KGNAI AI Technical Analysis Score (Deep Reinforcement Learning): Rank #482 out of 1424 (Rank 1 represents the strongest technical positioning and a higher probability of favorable price behavior. As ranks increase toward the maximum, the probability of favorable outcomes weakens and bearish positioning becomes more dominant.) | Label: Neutral | Score: 0.323
18-Signal Technical Confluence Score: 0.389 (Bullish)
Overall Technical Score (18-signal confluence + DRL rank blend): 0.369 (Bullish)
Note: The blended score reflects signal strength weighted against broader AI technical ranking, which may temporarily diverge.
Blended technical score breakdown: 0.369 (Bullish | Bull 10 / Bear 3 / Neutral 5)
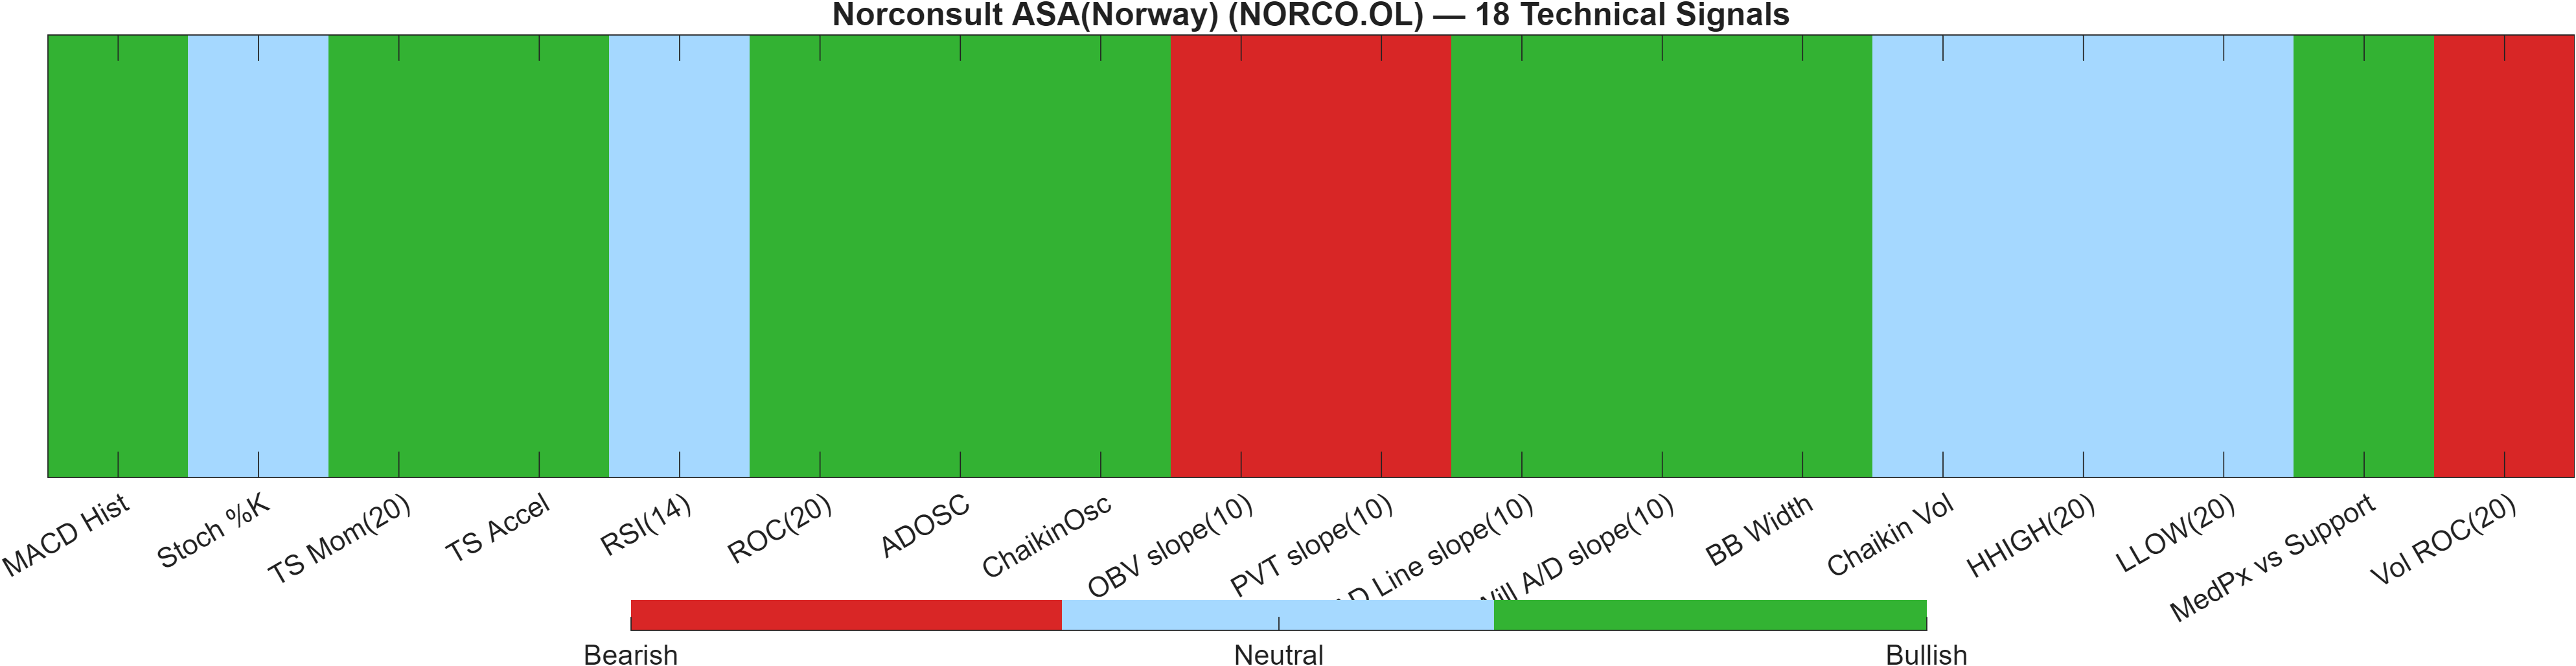
The technical dashboard highlights a meaningful alignment/divergence split. The 18-signal confluence score (0.389) and the overall technical score (0.369) both label as Bullish, and the signal count is skewed positive (Bull 10 vs Bear 3). However, the separate DRL technical rank is #482 with a Neutral label and score 0.323. That mismatch indicates the discrete indicator stack is constructive, while the broader pattern-recognition ranking is less enthusiastic.
Looking beneath the blend, momentum and rate-of-change inputs are supportive—MACD hist 0.1599 is bullish and ROC(20) 0.8906 is bullish—consistent with improving short-run tone. At the same time, a few participation/volume-based signals introduce friction: OBV slope(10) -4.211e+05 and Vol ROC(20) -71.5 are bearish. That configuration often reads as “price/momentum improvement without broad volume confirmation,” which can help explain why the DRL rank stays neutral despite bullish confluence.
Volatility structure is supportive rather than disruptive. The table flags BB Width 0.04191 as bullish, aligning with the report’s view that the regime is contained (0.0419 stated in the dashboard). Contained regimes can favor stepwise advances, but they also increase the importance of level-based validation: follow-through typically needs repeated acceptance above resistance (45.7500) rather than single prints.
Signal table (Bull/Bear/Neutral)
| Indicator | Value | Signal |
|---|---|---|
| MACD Hist | 0.1599 | Bullish |
| Stoch %K | 63.89 | Neutral |
| TS Mom(20) | 0.35 | Bullish |
| TS Accel | 5 | Bullish |
| RSI(14) | 48.79 | Neutral |
| ROC(20) | 0.8906 | Bullish |
| ADOSC | 50 | Bullish |
| ChaikinOsc | 1.09e+05 | Bullish |
| OBV slope(10) | -4.211e+05 | Bearish |
| PVT slope(10) | -2461 | Bearish |
| AD Line slope(10) | 1.843e+05 | Bullish |
| Will A/D slope(10) | 0.5 | Bullish |
| BB Width | 0.04191 | Bullish |
| Chaikin Vol | -21.95 | Neutral |
| HHIGH(20) | 40.9 | Neutral |
| LLOW(20) | 38.5 | Neutral |
| MedPx vs Support | 0.7 | Bullish |
| Vol ROC(20) | -71.5 | Bearish |
Interpretation (from provided data): Indicator-level signals form the base confluence, which is then adjusted using a separate AI-driven technical ranking model. The final technical score summarizes this combined view.
6) News sentiment + extractive gist
Sentiment score (avg): 0.379 | Positive: 100% | Neutral: 0% | Negative: 0%
KGNAI AI News Sentiment Score (normalized -1 to +1): 1.00 (as of 2025-12-25) | Label: Bullish | Overall news score: 1.00
Positive Developments
Recent coverage across major financial outlets indicates a distinctly constructive tone around Norconsult ASA, consistent with the sentiment snapshot showing 100% positive classification and an average sentiment score of 0.379. The normalized KGNAI news sentiment reading at 1.00 (dated 2025-12-25) suggests the text-level narrative has been unambiguously favorable over the sampled items. From a market-structure perspective, strong sentiment can support relative ranking persistence (daily #8, weekly #3, monthly #7) even when price trend metrics lag, as it may help stabilize dips toward defined support (38.9500) and keep attention on the next resistance test (45.7500). Still, sentiment should be treated as context rather than a substitute for confirmation: the moving-average interpretation remains bearish, so the most useful role of positive coverage is potentially to reinforce the probability of follow-through if price can break the 45.7500 ceiling with participation.
Neutral / Mixed Developments
Despite the strongly positive aggregate scoring, the most actionable “neutral” interpretation is that sentiment strength alone has not yet translated into a fully aligned trend profile. The report flags close vs MA50 as bearish and MA50 vs MA200 as bearish, while momentum indicators present a more balanced picture (RSI(14) 48.79 neutral versus MACD hist 0.1599 bullish). This mix is consistent with a market that may be digesting information while remaining range-aware, particularly in a relatively contained volatility regime (bandwidth latest 0.0419). As a result, “mixed” does not need to imply negative news flow; it can simply reflect that narrative support and short-run momentum are present, but price structure still requires level-based confirmation at 45.7500 to reduce the risk of mean reversion back toward 38.9500.
Negative / Risk Signals
The primary risk signal in the provided data is not negative headline content (negative classification is 0%), but rather the possibility of sentiment–price divergence. A bullish news profile (1.00 normalized score) can sometimes coincide with crowded expectations; if price fails to validate with structure, the unwind can be technical rather than narrative-driven. This is particularly relevant here because several participation metrics are bearish in the 18-signal set, including OBV slope(10) -4.211e+05 and Vol ROC(20) -71.5, suggesting weaker volume impulse even as other indicators tilt bullish. In that configuration, a failed attempt at 45.7500 without volume confirmation increases the probability of chop or retracement. A close below 38.9500 remains the clearest deterioration condition in the report’s scenario framing.
What to monitor next
- Whether a move through 45.7500 is accompanied by stronger participation (volume confirmation).
- Whether price continues to defend 38.9500 on pullbacks while RSI remains stable (currently 48.79).
- Whether bullish momentum (e.g., MACD hist 0.1599) persists without a renewed deterioration in volume-sensitive signals.
Snapshot: AI Rank (Short–Mid–Long): Bullish (Bullish–Bullish–Not available) · Technical Confluence: Bullish · Key Levels: Support ~38.95 | Resistance ~45.75 · News Sentiment: Positive
Sources referenced: Reuters, Bloomberg, Yahoo Finance, MarketWatch, Investing.com
7) Sources
Not available in the provided data.
You may also like: How KGNAI AI ranks instruments across global markets
Disclaimer: KGNAI provides AI-generated analytics and educational market commentary only. This is not financial advice. Markets involve risk. Always do your own research.