
BOWL.LSE (Hollywood Bowl Group PLC) — 03-May-2026 Technicals bearish near support despite bullish long-horizon ranks
Hollywood Bowl Group PLC (BOWL.LSE) is currently characterized by a pronounced timeframe split: KGNAI’s longer-horizon ranks remain constructive while shorter-term market structure and momentum gauges are weak. In the ranked European universe (1419 instruments), the daily rank is #1352 (bearish positioning), yet the 3‑month and 6‑month ranks are #46 and #29 respectively, consistent with stronger longer-run relative behavior. Technically, the blended framework is bearish, with an overall technical score of -0.595 and a DRL technical rank at the weak end of the distribution. Momentum indicators reinforce pressure: RSI(14) is 31.21 and the MACD histogram is -1.6793. Volatility is not extreme, with Bollinger bandwidth at 0.0913, suggesting a market that may still be in a controlled, trend-driven phase rather than a panic regime. Key decision zones remain well-defined around support ~233.7500 and resistance ~275.0000.
Key Takeaways
- Rank stance: Short-term Bearish | Mid-term Neutral | Long-term Bullish
- Technical confluence: Bearish (overall technical score -0.595; confluence -0.500)
- Key levels: Support 233.7500 | Resistance 275.0000
- News sentiment bias: Quant label Bullish with 1.00, while the broader distribution is heavily neutral (Neutral 88%)
- Confirmation / invalidation condition: A close below 233.7500 increases deterioration risk; a break above 275.0000 with volume is the clearest continuation confirmation per the provided scenario framing.
What KGNAI Measures
KGNAI evaluates assets using large cross-sectional datasets built from millions of structured data points. Inputs incorporate fundamental metrics, technical structures, and systematically processed news sentiment. Statistical models, machine learning, and AI frameworks are used to assess relative positioning, signal alignment, and probabilistic behavior across broad universes.
How to Read This Report
- Ranks are comparative across the tracked universe, not absolute price targets.
- Confluence reflects alignment among independent signal groups.
- Support/resistance levels are probabilistic decision zones, not guarantees.
- Sentiment provides contextual bias within the broader analytical framework.
1) KGNAI AI Analysis
Region: EUROPE
Total universe size: 1419 ranked instruments
- Daily rank: #1352 out of 1419 — Bearish
- Weekly rank: #774 out of 1419 — Neutral
- Monthly rank: #575 out of 1419 — Neutral
- 3-Monthly rank: #46 out of 1419 — Bullish
- 6-Monthly rank: #29 out of 1419 — Bullish
- Yearly rank: #135 out of 1419 — Bullish
The rank stack for BOWL.LSE is best read as a regime transition rather than a single-direction message. On a short horizon, the instrument sits in the weak tail of the universe, with a daily rank of #1352 out of 1419—consistent with near-term fragility and a higher probability of unfavorable behavior relative to peers. That contrasts sharply with the intermediate-to-long horizon where ranks compress into the upper tier: the 3‑month rank (#46) and 6‑month rank (#29) imply the asset has exhibited stronger longer-run relative properties than most of the universe.
The weekly and monthly readings—#774 and #575—sit closer to the center of the distribution, acting as a “bridge” timeframe that has not yet fully resolved the conflict between short-term weakness and longer-horizon strength. This configuration often shows up when price action has pulled back meaningfully inside a broader constructive profile, or when a previously strong profile begins to lose persistence.
KGNAI’s stated term view summarizes this split directly: Short-term bearish, mid-term neutral, long-term bullish. Analytically, that combination places higher weight on confirmation from market structure (support/resistance behavior) and momentum stabilization, because the long-horizon ranks alone are not sufficient to offset near-term technical deterioration when the daily rank is positioned this weakly.
KGNAI ranks each instrument across large universes using multiple proprietary AI tests and statistical models (millions of data points). Lower ranks generally indicate stronger probability of favorable performance behavior, while higher ranks indicate weaker probability and more bearish positioning.
Term view: Short-term: Bearish. Mid-term: Neutral. Long-term: Bullish.
Want the full universe and complete rank tables? Unlock full access on KGNAI: https://www.kgnai.com/pricing
2) Price & trend overview
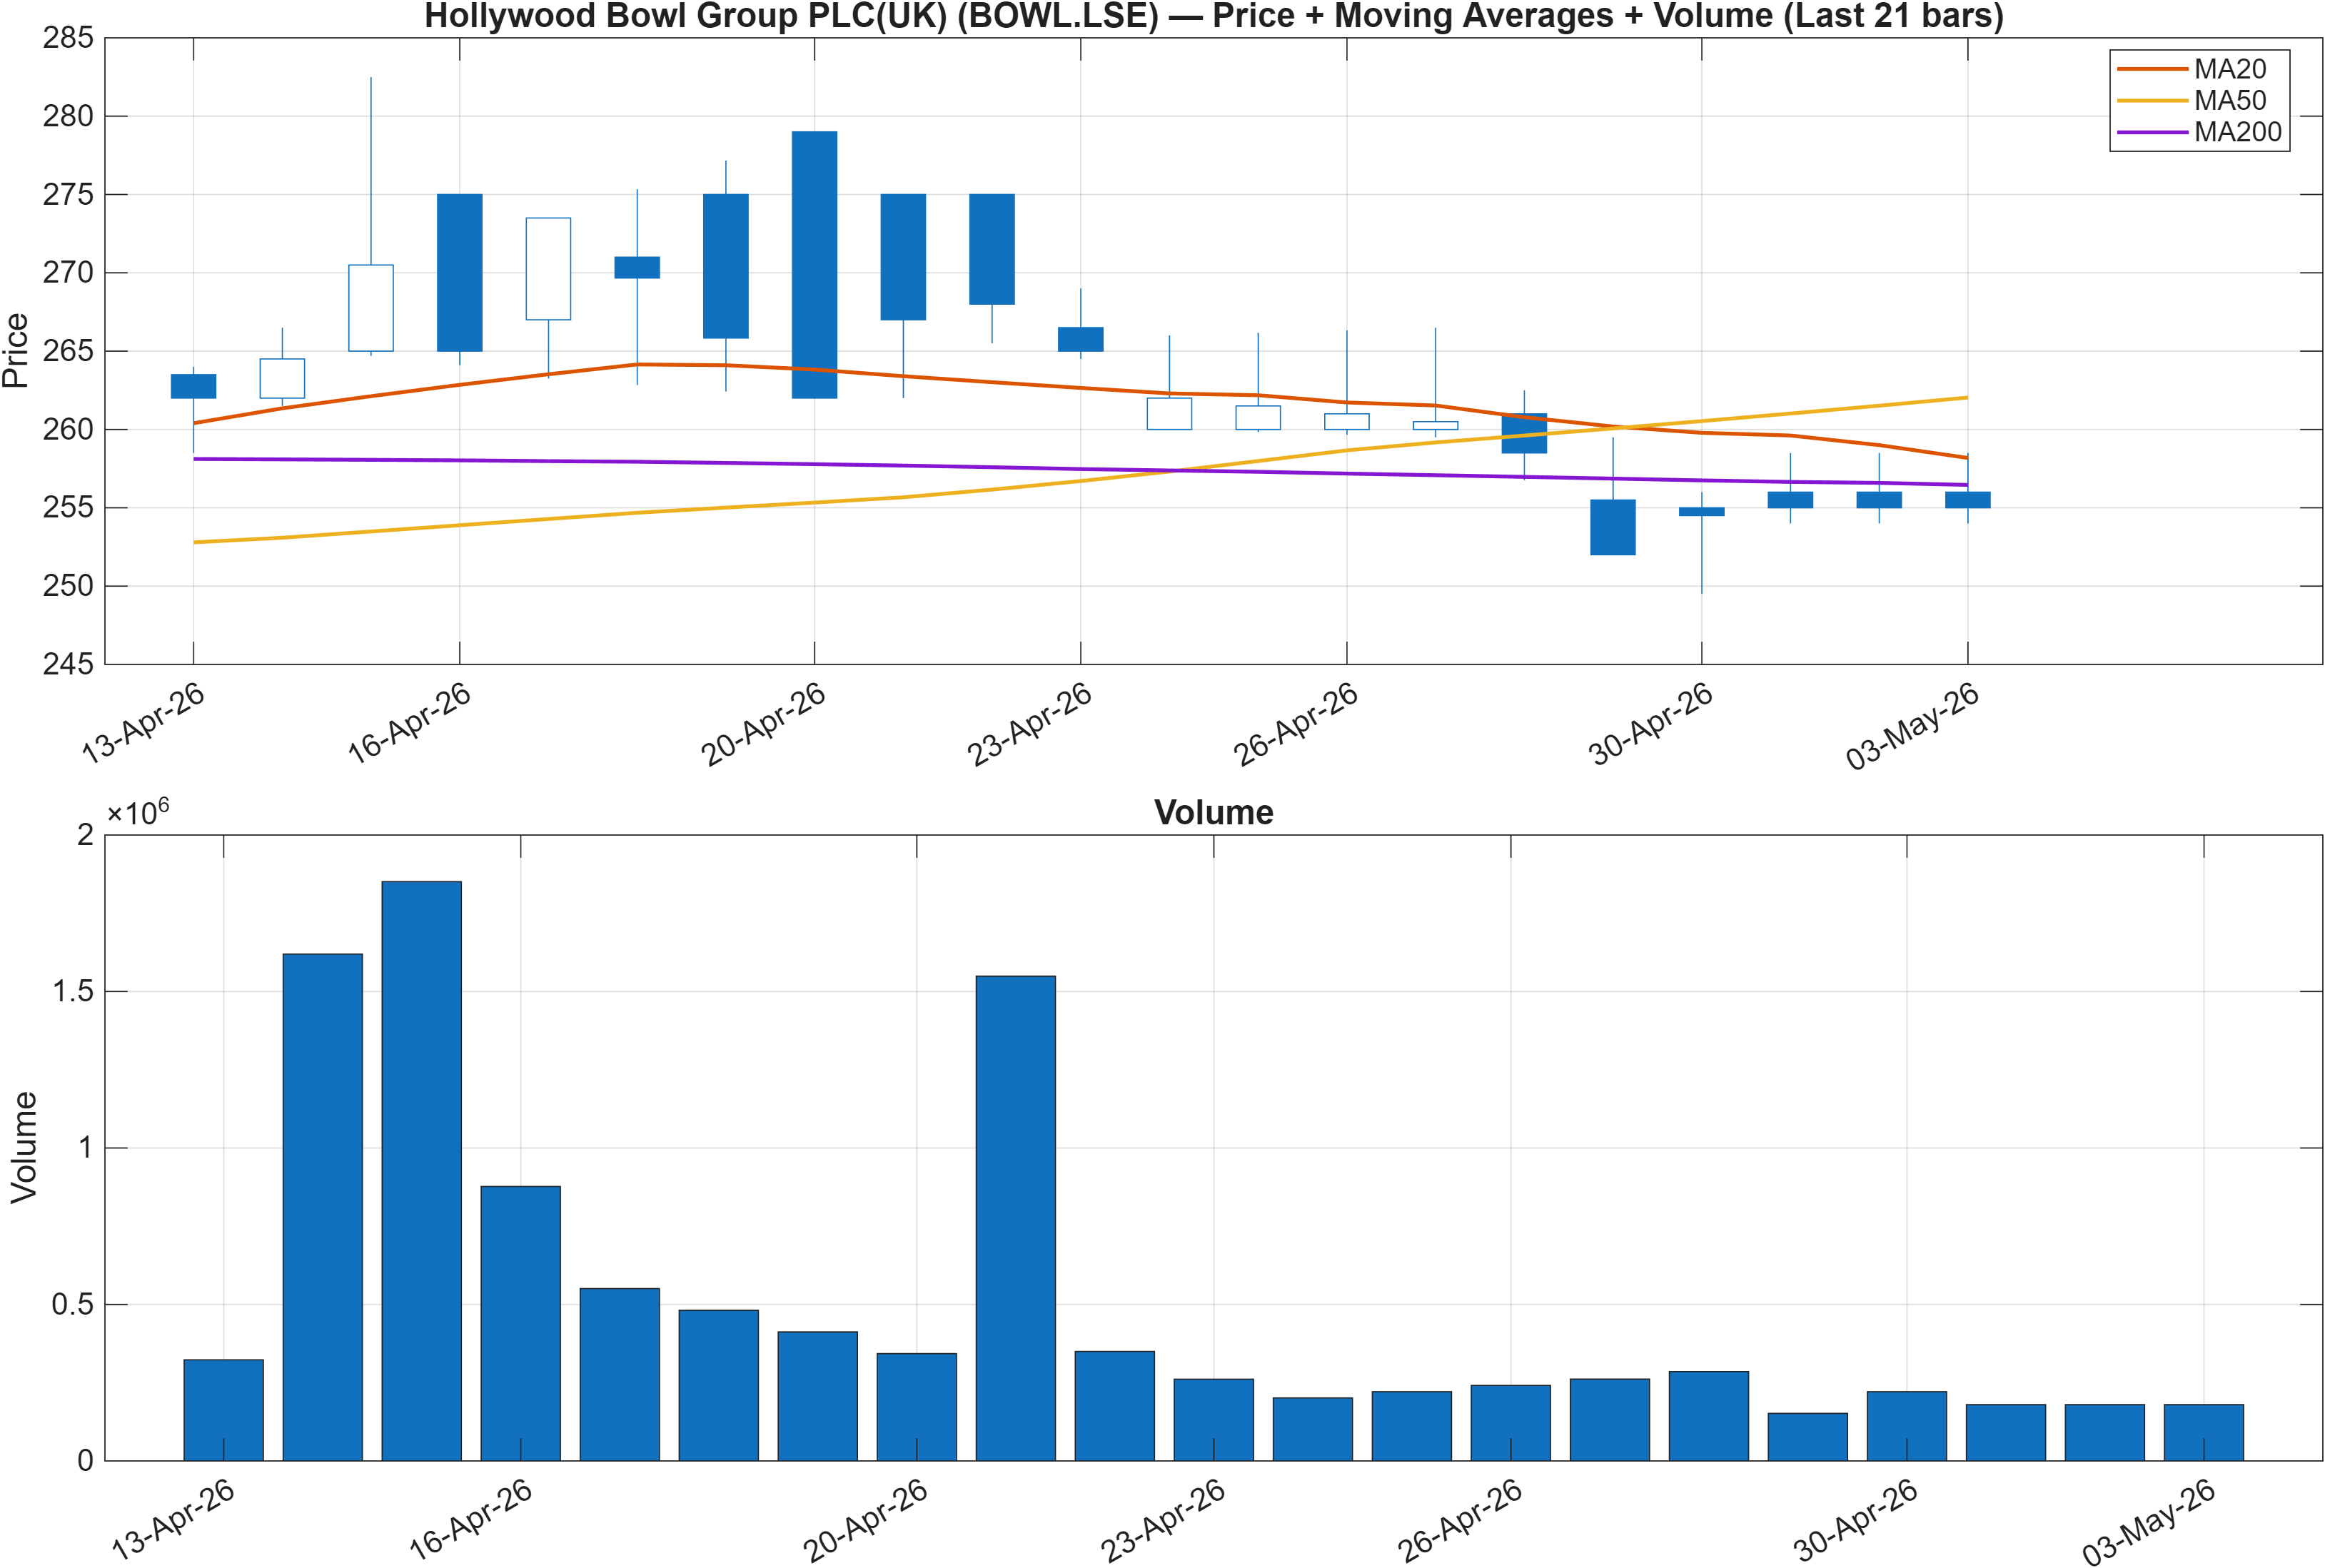
Interpretation: Close vs MA50 = Bearish, MA50 vs MA200 = Bullish.
Moving-average alignment: short-term damage inside a longer-term structure
The trend read is explicitly mixed: close vs MA50 is bearish, while MA50 vs MA200 is bullish. That combination typically signals that the longer-term structure has not fully rolled over, but price is currently trading in a weaker short-term posture within that framework. In practical market-structure terms, it often corresponds to a retracement or distribution phase where mean-reversion forces compete with the residual slope of the longer moving-average stack.
Rank dispersion vs price behavior
The rank profile reinforces this interpretation. Longer-horizon ranks—#29 (6‑month) and #135 (yearly)—suggest BOWL.LSE has been comparatively resilient over broader windows, while the #1352 daily rank indicates a sharp deterioration in recent trading behavior versus the peer set. When these diverge, the tactical question becomes whether the pullback is contained (support holds, momentum stabilizes) or whether it evolves into a more persistent downtrend that eventually drags the longer-term signals lower.
Volume and follow-through risk
Without introducing new volume statistics, the framework still highlights an important point: the report’s continuation criteria later require a break above resistance with volume. This indicates that trend repair is not just a matter of price reclaiming levels—confirmation is expected via participation. Until that occurs, the MA configuration argues for treating rebounds as structurally unproven while the price remains below the MA50, even if the longer MA relationship stays constructive.
3) Momentum & volatility dashboard
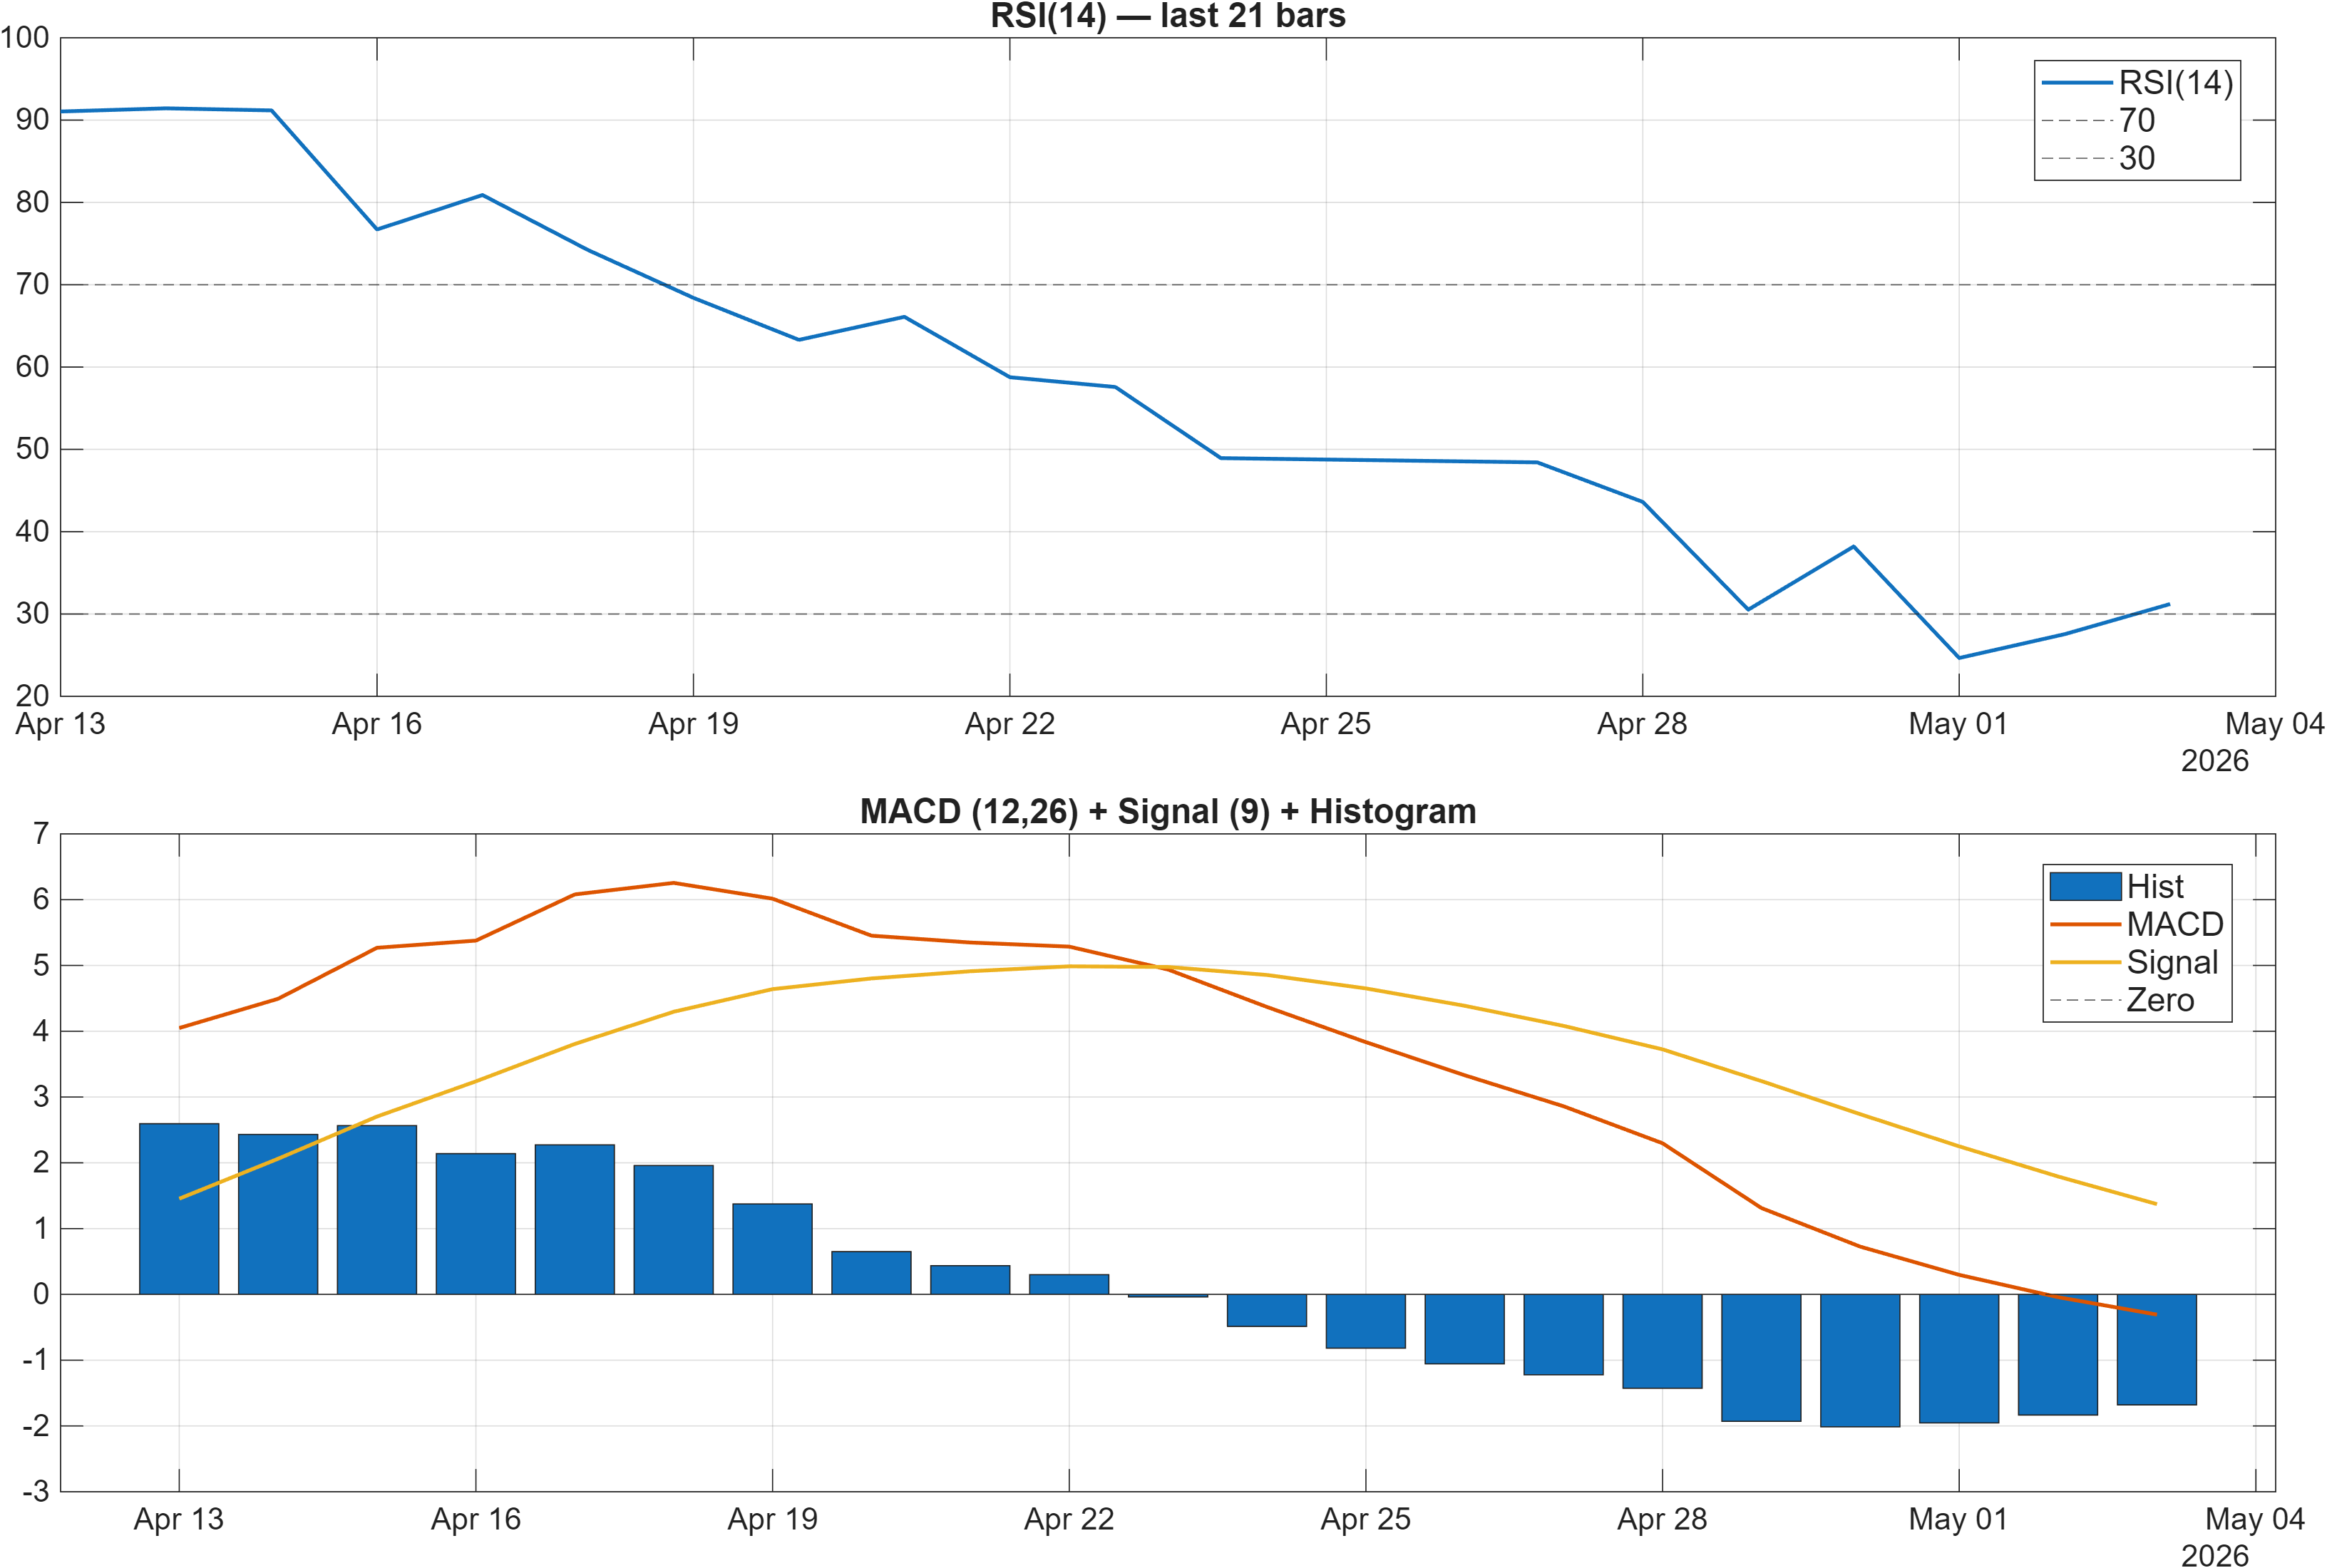
Interpretation: RSI bias = Bearish, MACD hist = -1.6793.
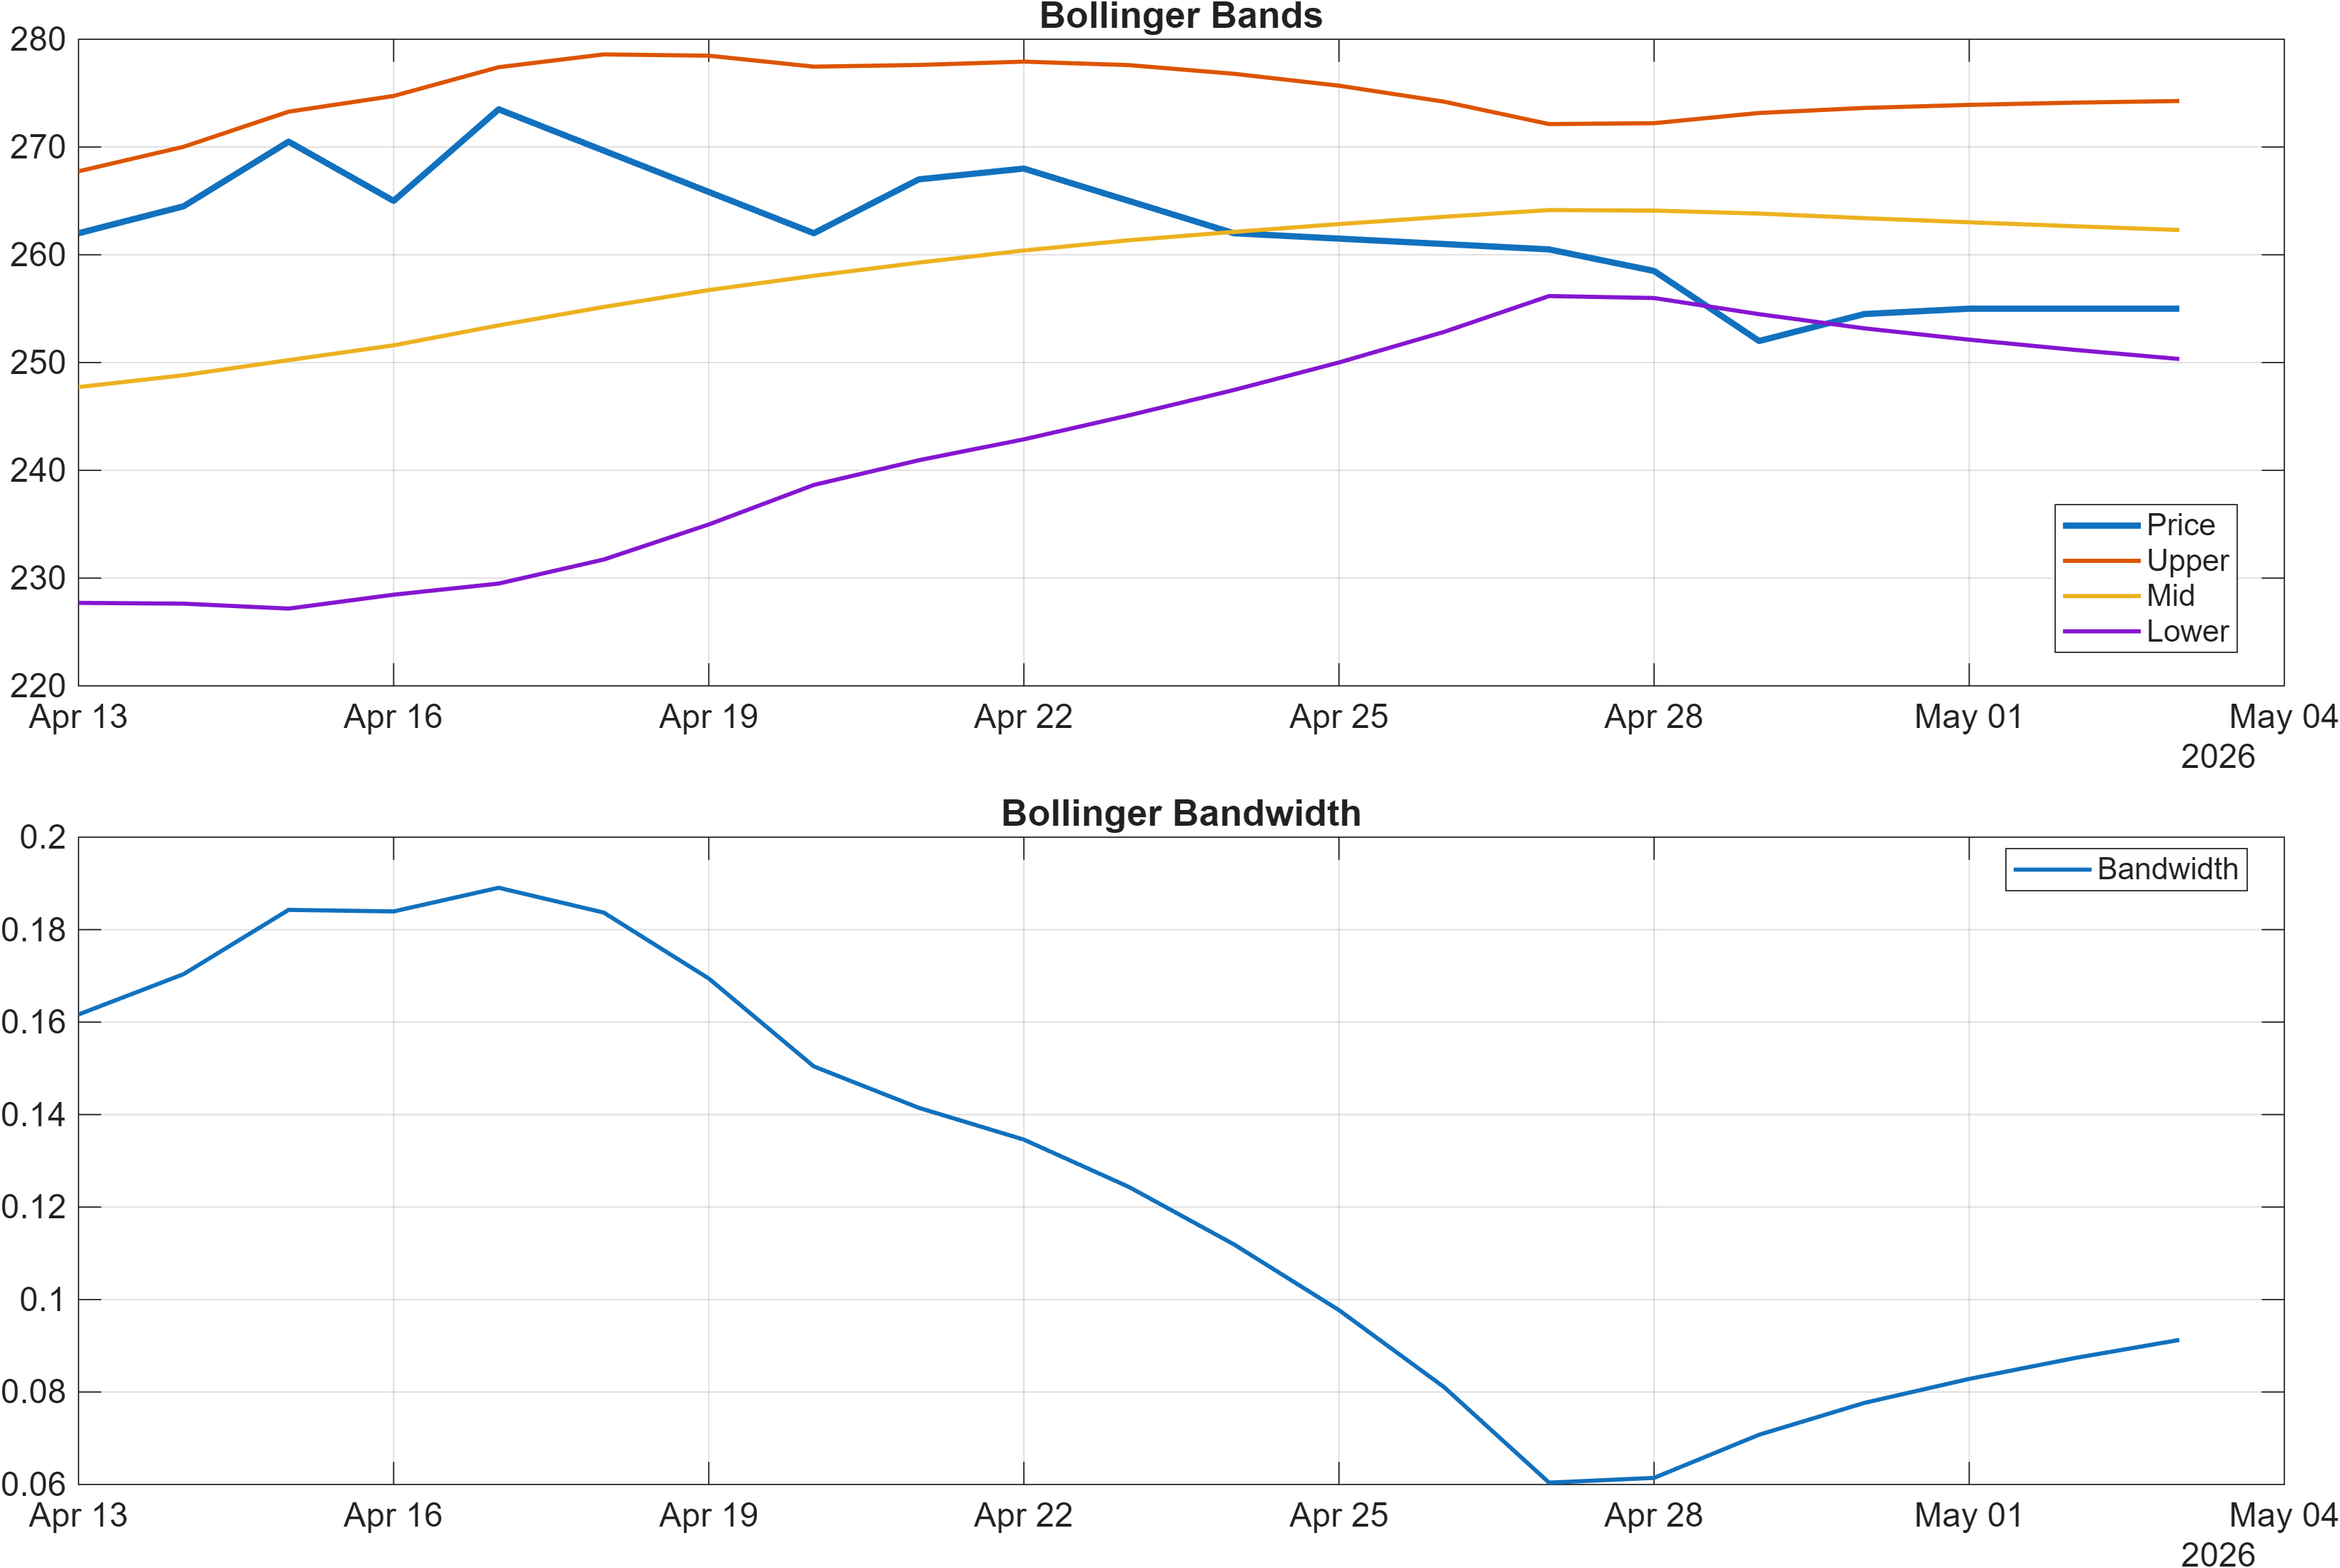
Interpretation: Bandwidth (volatility regime) latest = 0.0913.
Momentum persistence: oversold-leaning RSI with negative MACD impulse
Momentum readings skew bearish and, importantly, are not contradictory. RSI(14) at 31.21 places the instrument near a commonly watched oversold boundary, but RSI alone is not a reversal signal—its role here is to describe the intensity of downside pressure. The MACD histogram at -1.6793 supports the same conclusion: downside momentum remains dominant rather than merely stretched.
Volatility context: compression rather than dislocation
Volatility sits in a relatively contained regime with Bollinger bandwidth at 0.0913. When bandwidth is not expanding aggressively, selloffs can still persist, but they tend to do so through more orderly sequences—lower highs, failed rebounds, and gradual trend pressure—rather than through abrupt gap-like dislocations. That nuance matters because it often shifts the analytic focus toward level-based confirmation (support/resistance) and moving-average recapture rather than expecting volatility-driven snapbacks.
Cross-check with the 18-signal dashboard
The momentum picture is consistent with the broader technical layer: within the signal table, TS Mom(20) is -9.5 and ROC(20) is -3.592, both bearish, aligning with the negative MACD impulse and low RSI. Taken together with the bandwidth reading, the dashboard suggests a market that is weak and potentially near exhaustion, but still requires evidence of stabilization—particularly given the pronounced weakness implied by the daily universe rank.
4) Support / Resistance zones
Support ~ 233.7500 | Resistance ~ 275.0000
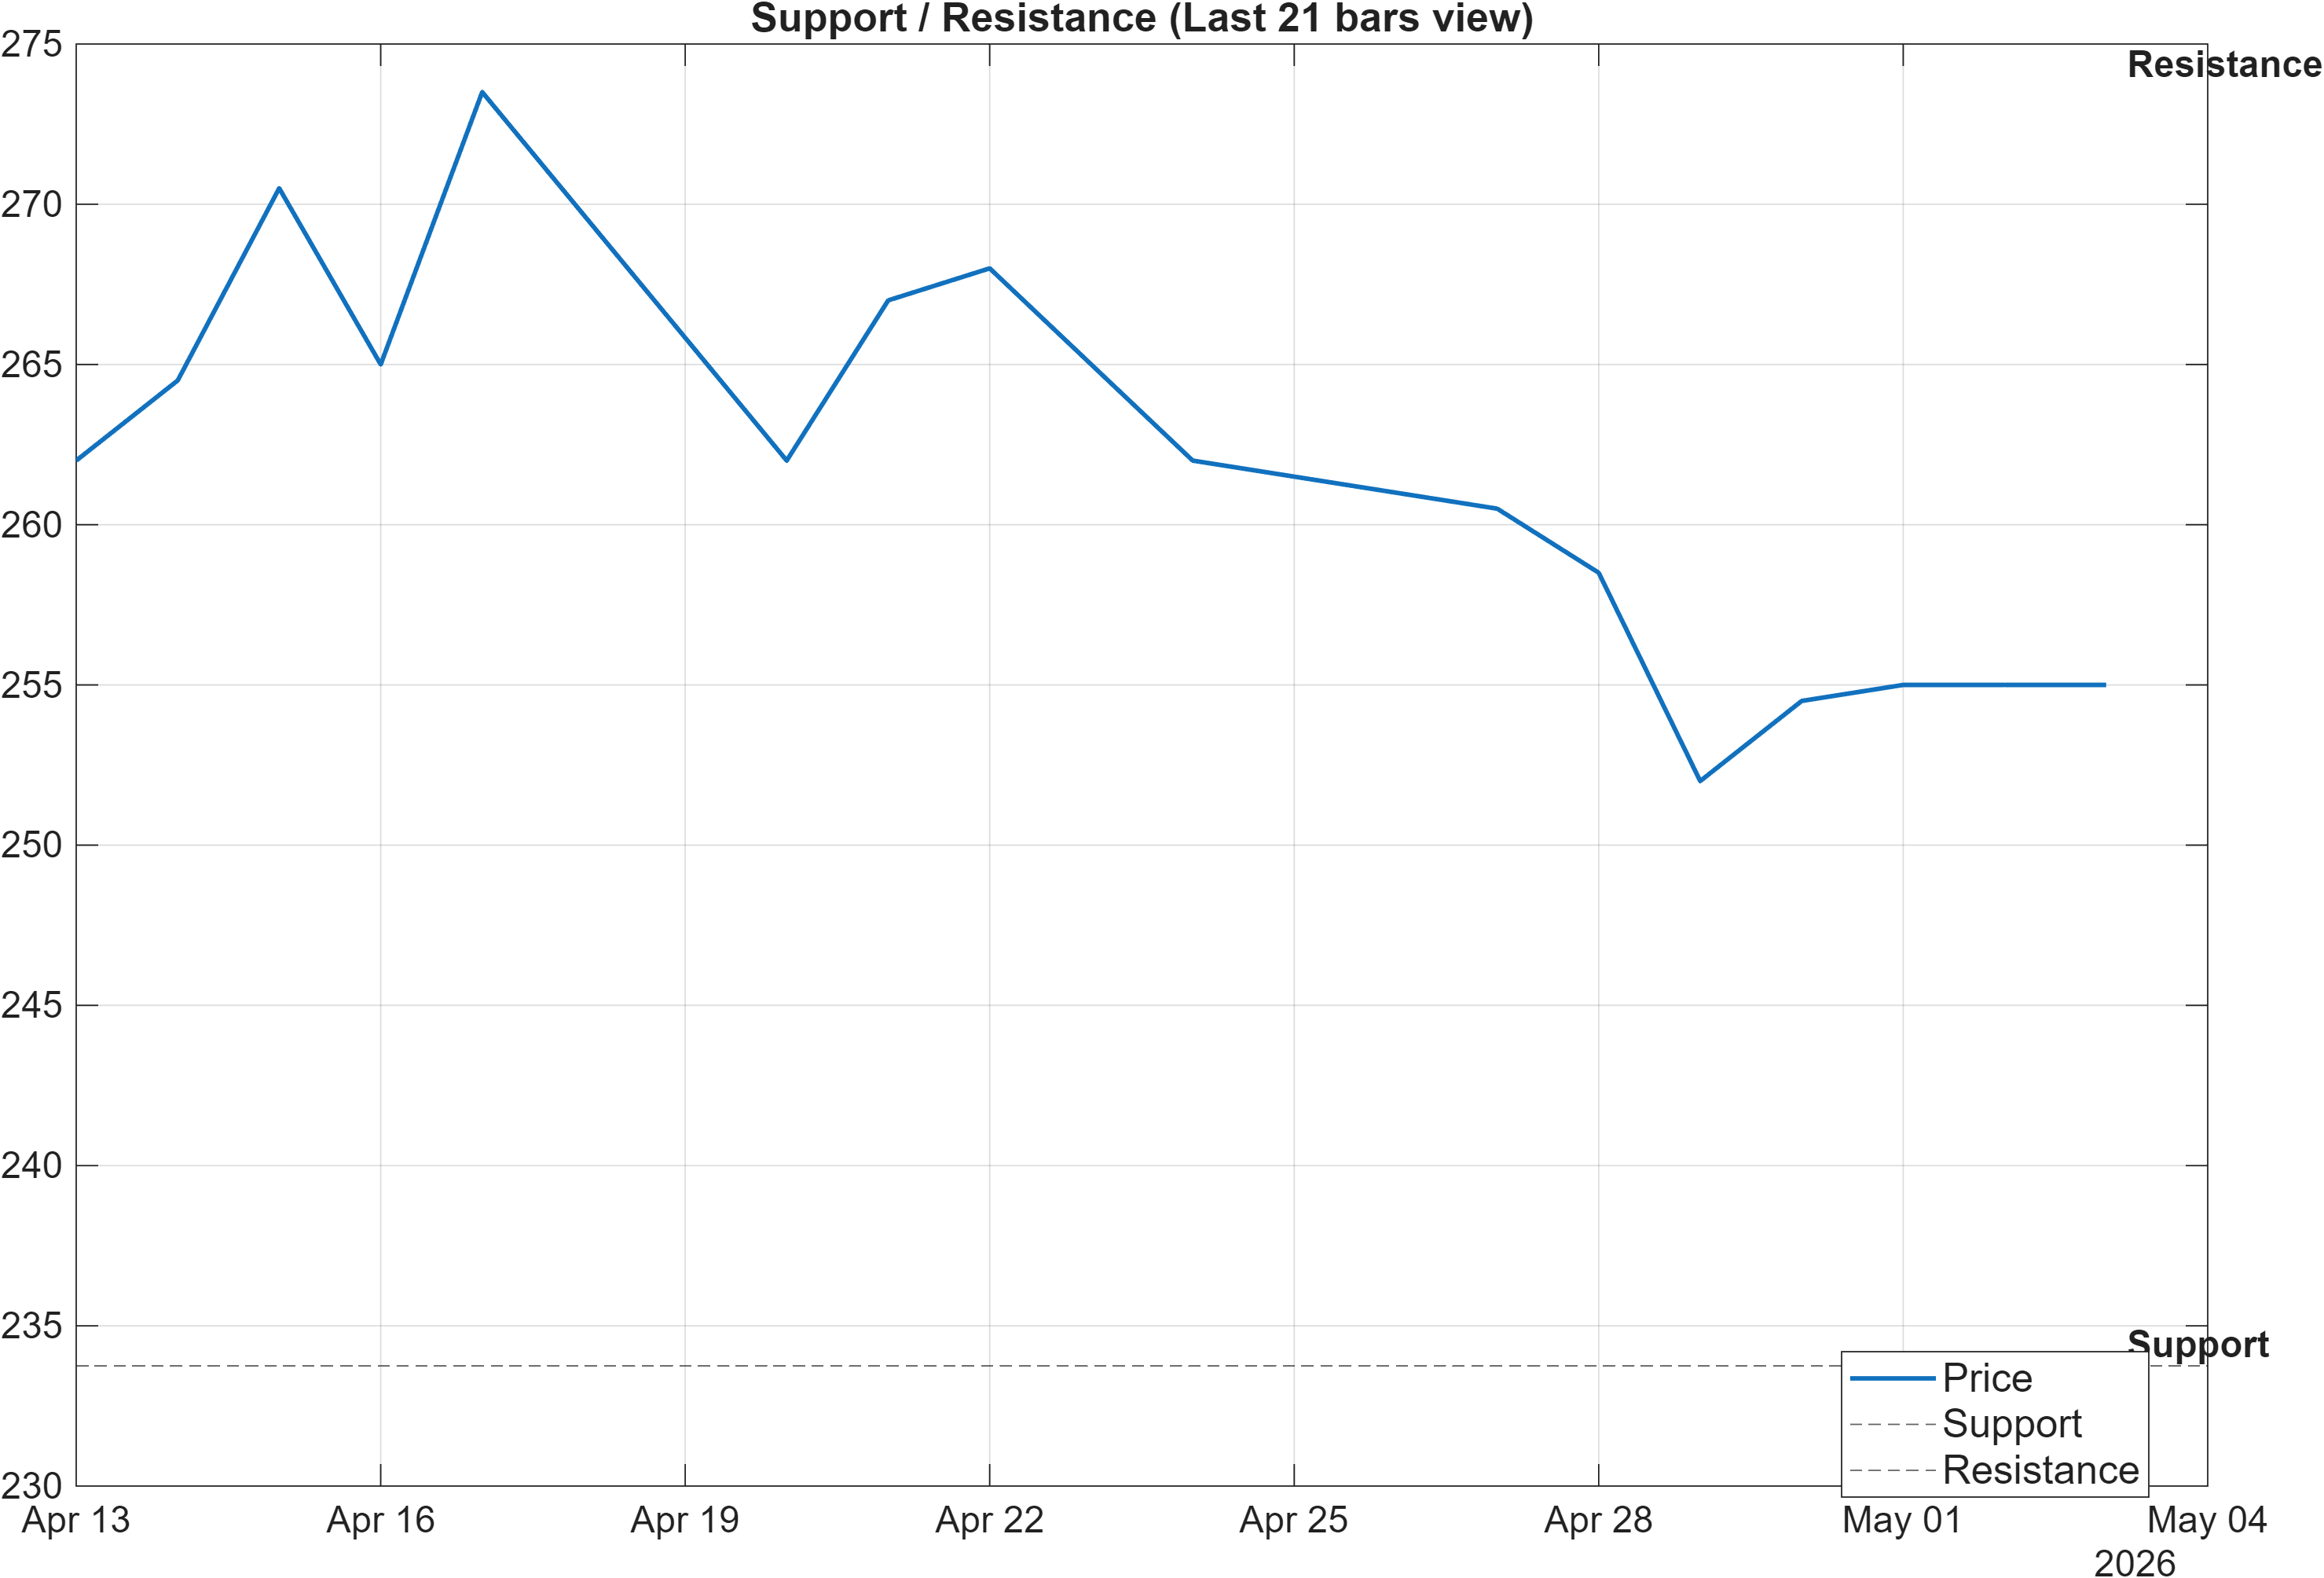
Scenario view: Break above resistance with volume → continuation. Close below support → signal deterioration risk.
Decision zones: where the timeframe conflict is resolved
The current setup concentrates decision-making into two levels: support ~233.7500 and resistance ~275.0000. With short-term ranks and technical confluence bearish, support becomes the primary reference for whether weakness remains a contained pullback or becomes a deeper deterioration. The report’s own scenario framework is explicit: a close below support raises deterioration risk—particularly relevant given the negative impulse readings such as MACD hist -1.6793.
Resistance as validation, not merely a target
Resistance at 275.0000 serves a different purpose than “upside potential”; it is a validation threshold. The stated continuation condition requires a break above resistance with volume, implying that price must not only reclaim a key level but do so with participation consistent with trend resumption. This is a higher bar than a simple bounce, and it aligns with the broader picture where close vs MA50 is bearish—a reminder that the market is currently trading below an important trend reference.
Range logic and risk framing
The spacing between 233.7500 and 275.0000 also frames a practical range in which signals can remain conflicted: inside the band, rebounds and pullbacks may alternate without resolving the longer-horizon bullish ranks versus the short-horizon bearish readings. A clean resolution—either a break/hold above resistance (continuation) or a close below support (deterioration)—would reduce ambiguity and likely bring better alignment across ranks, momentum, and the 18-signal dashboard.
5) Quant Technical Dashboard (18 Signals)
KGNAI AI Technical Analysis Score (Deep Reinforcement Learning): Rank #1289 out of 1419 (Rank 1 represents the strongest technical positioning and a higher probability of favorable price behavior. As ranks increase toward the maximum, the probability of favorable outcomes weakens and bearish positioning becomes more dominant.) | Label: Bearish | Score: -0.817
18-Signal Technical Confluence Score: -0.500 (Bearish)
Overall Technical Score (18-signal confluence + DRL rank blend): -0.595 (Bearish)
Note: The blended score reflects signal strength weighted against broader AI technical ranking, which may temporarily diverge.
Blended technical score breakdown: -0.595 (Bearish | Bull 2 / Bear 11 / Neutral 5)
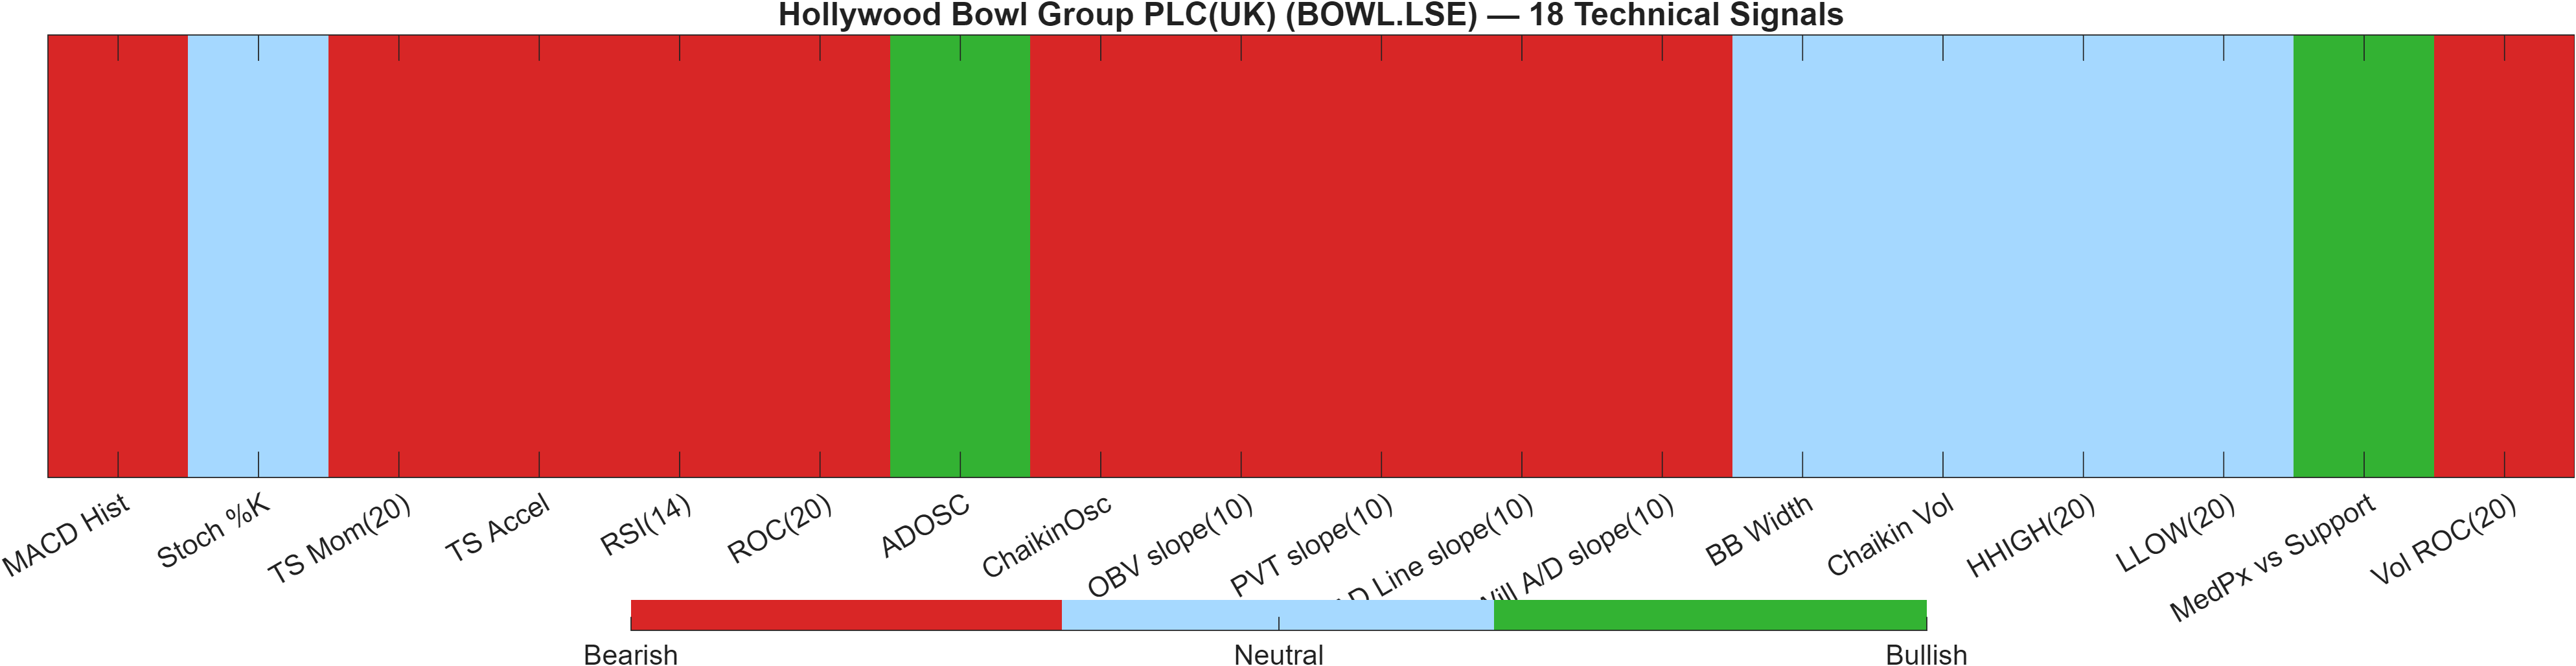
Confluence vs AI rank blend: breadth of bearish signals dominates
The technical layer is not ambiguous: the 18-signal confluence score is -0.500 (bearish) and the overall technical score is -0.595 (bearish). The distribution—Bull 2 / Bear 11 / Neutral 5—indicates that weakness is broad-based rather than isolated to a single indicator family. That breadth is also consistent with the very weak AI technical rank: #1289 out of 1419, paired with a DRL score of -0.817, placing BOWL.LSE in the lower tail of the universe on this technical model.
Where bearish pressure is concentrated
Momentum and rate-of-change signals lean negative: RSI(14) 31.21 and MACD histogram -1.679 are both bearish at the indicator level, reinforced by TS Accel -31.5 and Vol ROC(20) -88.89. The combination suggests downside pressure has both direction (negative momentum) and participation stress (weak volume change), which can make recoveries less reliable until participation improves.
Notable offsets: limited bullish pockets without broad reversal confirmation
There are small countervailing signals, but they are not yet dominant. ADOSC 38.89 registers bullish and MedPx vs Support 22.5 is also bullish, implying some accumulation/level-supportive behavior may be present. Meanwhile, volatility measures are not aggressively bearish—BB Width 0.09126 is neutral—suggesting the bearish regime is not necessarily accompanied by volatility expansion. Overall, however, the blend of breadth (11 bearish signals) and the weak DRL rank argues that isolated bullish pockets should be treated as tactical, not as a confirmed regime shift, unless price behavior improves at the defined resistance zone.
Signal table (Bull/Bear/Neutral)
| Indicator | Value | Signal |
|---|---|---|
| MACD Hist | -1.679 | Bearish |
| Stoch %K | 32.35 | Neutral |
| TS Mom(20) | -9.5 | Bearish |
| TS Accel | -31.5 | Bearish |
| RSI(14) | 31.21 | Bearish |
| ROC(20) | -3.592 | Bearish |
| ADOSC | 38.89 | Bullish |
| ChaikinOsc | -3.426e+05 | Bearish |
| OBV slope(10) | -9.616e+05 | Bearish |
| PVT slope(10) | -7129 | Bearish |
| AD Line slope(10) | -9.487e+05 | Bearish |
| Will A/D slope(10) | -25.5 | Bearish |
| BB Width | 0.09126 | Neutral |
| Chaikin Vol | -35.93 | Neutral |
| HHIGH(20) | 282.5 | Neutral |
| LLOW(20) | 249.5 | Neutral |
| MedPx vs Support | 22.5 | Bullish |
| Vol ROC(20) | -88.89 | Bearish |
Interpretation: Indicator-level signals form the base confluence, which is then adjusted using a separate AI-driven technical ranking model. The final technical score summarizes this combined view.
6) News sentiment + extractive gist
Note: Instrument-specific news matches were not found, so the digest includes broader market/sector headlines. Links are provided for verification.
Sentiment score (avg): 0.000 | Positive: 6% | Neutral: 88% | Negative: 6%
KGNAI AI News Sentiment Score (normalized -1 to +1): 1.00 (as of 2026-04-17) | Label: Bullish | Overall news score: 1.00
Positive Developments
Recent coverage across major financial outlets indicates a generally constructive tone in parts of global equity and technology-adjacent narratives, with risk appetite supported by themes tied to AI-related investment and longer-run capital allocation discipline. In the KGNAI digest, this backdrop aligns with a normalized news sentiment score of 1.00 (bullish label), even though the broader distribution is overwhelmingly neutral. For BOWL.LSE specifically, the key point is not direct company-level catalysts—those are not available in the provided data—but rather that the prevailing “macro-news” complexion is not uniformly risk-off. In environments where broader sentiment is not sharply negative, assets showing a longer-horizon constructive rank profile (for example #29 over 6 months) sometimes find it easier to stabilize once technical selling pressure fades. That said, the price and signal set still require confirmation through levels and momentum repair.
Neutral / Mixed Developments
The digest is dominated by neutrality: Neutral reads are 88% with an average sentiment score of 0.000. This suggests the news flow being sampled is not consistently pushing directional conviction and may be better treated as background context than as a tradable driver. The practical implication is that BOWL.LSE’s near-term behavior is more likely to be governed by technical structure—such as the 233.7500 support and the bearish momentum cluster (e.g., RSI 31.21)—than by a steady stream of incremental headlines. In addition, the note that instrument-specific matches were not found increases the likelihood that “sentiment” here is a proxy for general market tone rather than a security-specific impulse.
Negative / Risk Signals
Risk signals in the digest emphasize geopolitical and policy uncertainty themes. Even when the quantitative news label is bullish (1.00), the presence of downside macro risk topics can raise the bar for follow-through in technically weak names—particularly those already positioned poorly in short-horizon ranks (e.g., daily rank #1352). In this setup, negative macro surprises can interact with an already bearish technical profile (overall technical score -0.595) by reducing buyers’ willingness to defend support aggressively. As a result, the most actionable interpretation is conditional: news risk does not automatically imply deterioration, but it can amplify the consequences if price were to close below 233.7500 or if recoveries fail near 275.0000.
- What to monitor next: Whether price action holds above 233.7500 during broader market volatility.
- What to monitor next: Whether recoveries can reclaim 275.0000 with volume, consistent with the continuation condition.
- What to monitor next: Whether momentum stabilizes (e.g., RSI(14) lifting from 31.21 alongside improving MACD dynamics).
Sources referenced: Reuters, Bloomberg, Yahoo Finance, MarketWatch, Investing.com
Snapshot: AI Rank (Short–Mid–Long): Mixed (Bearish–Neutral–Bullish) · Technical Confluence: Bearish · Key Levels: Support ~233.75 | Resistance ~275.00 · News Sentiment: Neutral
7) Sources
Instrument-specific source linkage is not available in the provided data because the included digest is based on broader market/sector headlines and the output requirements prohibit reproducing headline lists or URLs here.
You may also like: How KGNAI AI ranks instruments across global markets
Disclaimer: KGNAI provides AI-generated analytics and educational market commentary only. This is not financial advice. Markets involve risk. Always do your own research.