
CaixaBank SA (CABK.MC) — 13-Mar-2026 Technical State Shows Broad Weakness With Mixed Confirmation
CaixaBank SA (CABK.MC) enters 13-Mar-2026 with a short-term bearish KGNAI rank profile and a bearish long-horizon posture, while the mid-term remains more neutral. Across a universe of 1424 European instruments, the daily rank sits deep in the lower tail (#1203), consistent with deteriorating near-term behavior. Trend structure also leans defensive: price relative to the MA50 is flagged bearish and the MA50 vs MA200 relationship is likewise bearish, indicating a downtrend configuration rather than a simple pullback. Momentum shows pressure with RSI(14) at 30.79 and a negative MACD histogram (-0.0161), while volatility regime is moderate (Bollinger bandwidth 0.1403). Notably, the 18-signal confluence reads -0.111 (Neutral), but the blended technical view is -0.347 (Bearish), implying that broader model context is less forgiving than the raw indicator mix alone. News sentiment is constructive in scoring terms, creating a measurable sentiment-versus-price tension.
- Rank stance: Short Bearish | Mid Neutral | Long Bearish
- Technical confluence: Neutral on the 18-signal layer (-0.111), but Bearish on the blended technical score (-0.347)
- Key levels: Support ~ 9.7940 | Resistance ~ 11.1975
- News sentiment bias: Constructive scoring (avg 0.126; normalized 0.96) despite weaker technical posture
- Confirmation / invalidation: A close below 9.7940 increases deterioration risk; sustained strength through 11.1975 with volume is the primary technical improvement condition
KGNAI evaluates assets using large cross-sectional datasets built from millions of structured data points. Inputs incorporate fundamental metrics, technical structures, and systematically processed news sentiment. Statistical models, machine learning, and AI frameworks are used to assess relative positioning, signal alignment, and probabilistic behavior across broad universes.
- Ranks are comparative across the tracked universe, not absolute price targets.
- Confluence reflects alignment among independent signal groups.
- Support/resistance levels are probabilistic decision zones, not guarantees.
- Sentiment provides contextual bias within the broader analytical framework.
1) KGNAI AI Analysis
Region: EUROPE | Total universe size: 1424 ranked instruments
- Daily rank: #1203 out of 1424 — Bearish
- Weekly rank: #800 out of 1424 — Neutral
- Monthly rank: #940 out of 1424 — Neutral
- 3-Monthly rank: #671 out of 1424 — Neutral
- 6-Monthly rank: #1184 out of 1424 — Bearish
- Yearly rank: #1180 out of 1424 — Bearish
CABK.MC shows a time-horizon split that is typical of a market transitioning from prior strength into a more defensive regime. The daily rank (#1203) places the name in the weaker portion of the 1424-instrument universe, suggesting near-term behavior has become less favorable relative to peers. The weekly and monthly ranks (#800 and #940) sit closer to the middle of the distribution, consistent with a market that has not fully repriced the broader trend but is registering short-term fragility.
Longer horizons lean materially weaker: the 6-month rank (#1184) and yearly rank (#1180) point to an unfavorable longer-cycle positioning. When the short-term and long-term ranks both skew bearish while intermediate horizons remain neutral, it often signals that the dominant regime is negative but the market is still deciding whether the current drawdown is a continuation phase or an oversold interruption.
Cross-horizon alignment vs divergence
The most important read-through is the alignment between daily weakness and long-horizon weakness, which reduces the probability that the move is purely noise-driven. However, the 3-month rank (#671) remains closer to the center, indicating that not all model layers have capitulated. This configuration tends to be sensitive to price behavior around key technical levels: stabilization can keep mid-term ranks neutral, while renewed downside typically pulls the mid-term profile into bearish alignment.
Term view: Short-term: Bearish. Mid-term: Neutral. Long-term: Bearish.
Want the full universe and complete rank tables? Unlock full access on KGNAI: https://www.kgnai.com/pricing
2) Price & trend overview
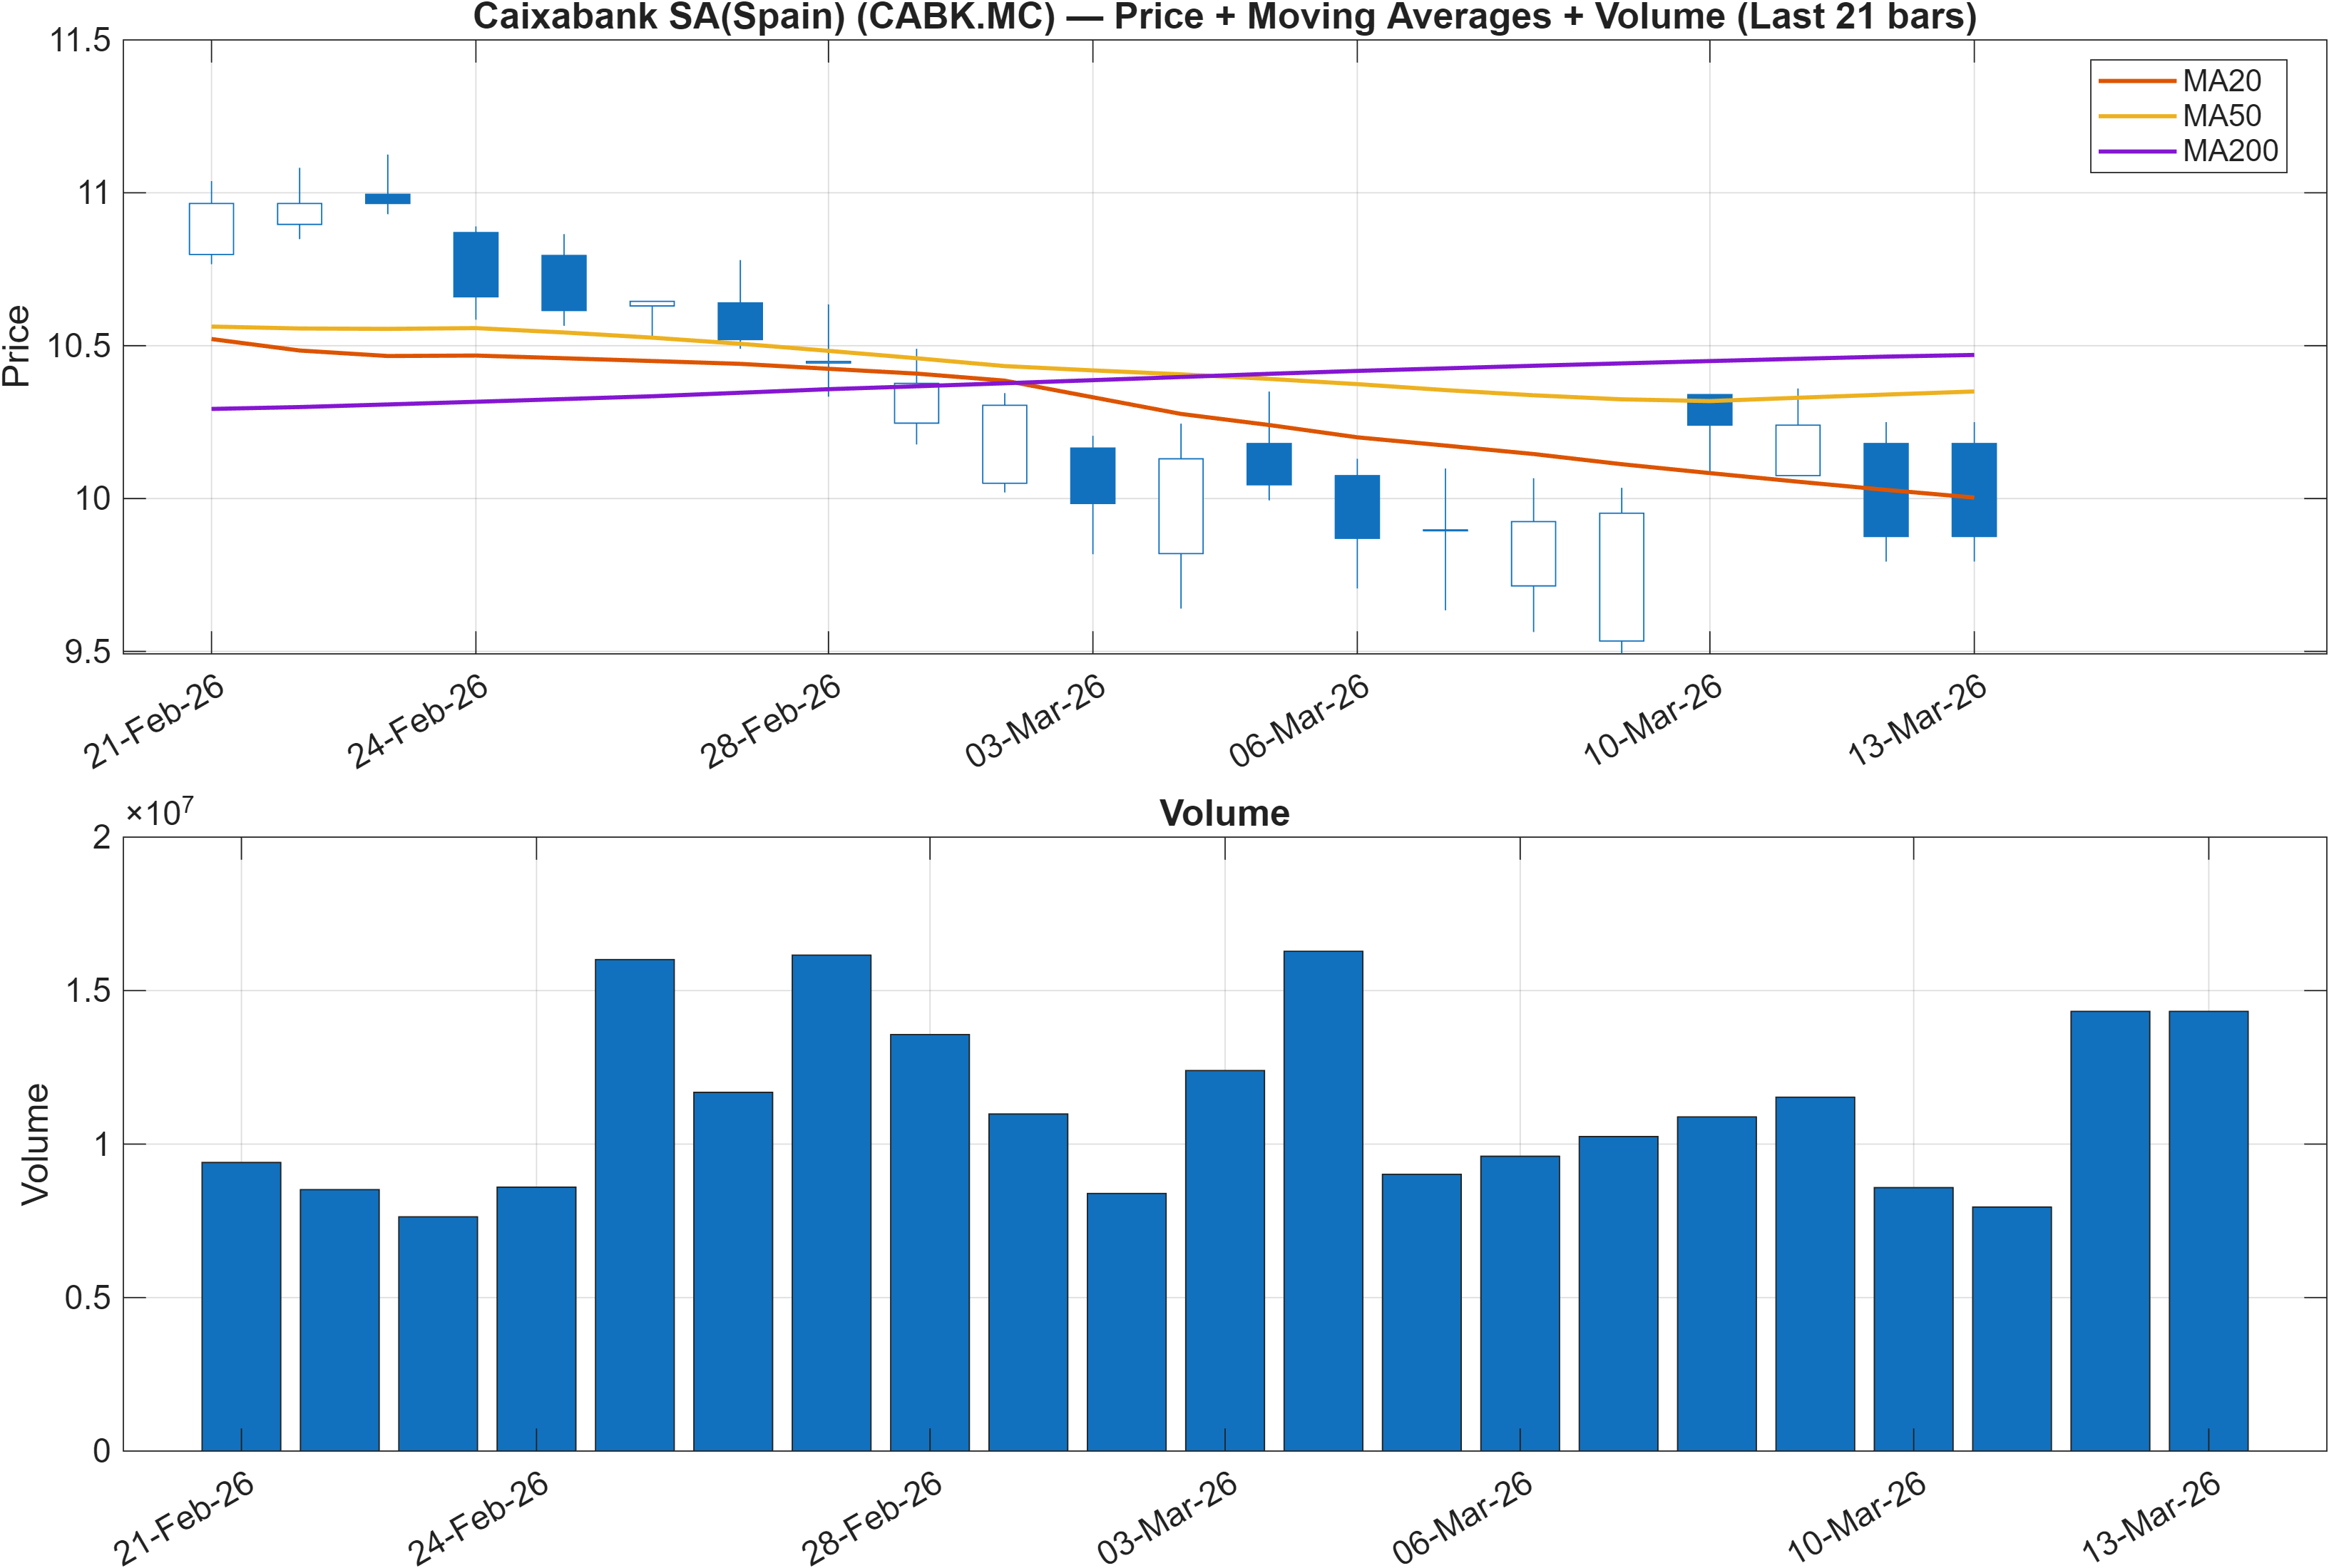
Interpretation: Close vs MA50 = Bearish, MA50 vs MA200 = Bearish.
Trend regime: downside structure dominates
The trend stack is unambiguous: price below the MA50 and a bearish MA50 vs MA200 configuration indicates the market is trading under a declining intermediate trend within a weaker long-term structure. In practical market-structure terms, rallies can be more vulnerable to selling pressure because the MA50 frequently acts as dynamic resistance when the MA50 is below the MA200.
The more nuanced point is how this trend state interacts with the ranked framework. With the daily rank at #1203 and longer horizons also weak (#1184 on 6-month; #1180 on yearly), the moving-average posture is not isolated—it is consistent with broader cross-sectional weakness rather than a single indicator anomaly. That alignment typically matters more than any single moving average crossover event.
Where trend meets decision zones
Trend weakness becomes actionable mainly at the edges: the chart’s behavior around support ~9.7940 and resistance ~11.1975 defines whether the market is still in a controlled retracement or transitioning into deeper deterioration. A bearish trend stack does not preclude bounces, but it often requires a stronger-than-usual catalyst in participation to reclaim the MA50 and reduce the probability of follow-through selling.
Absent confirmation from participation measures, the default interpretation remains that the market is in a regime of lower highs and weaker rebound persistence. This framing becomes more credible when momentum indicators (RSI/MACD) remain bearish, as they do in the current dashboard.
3) Momentum & volatility dashboard
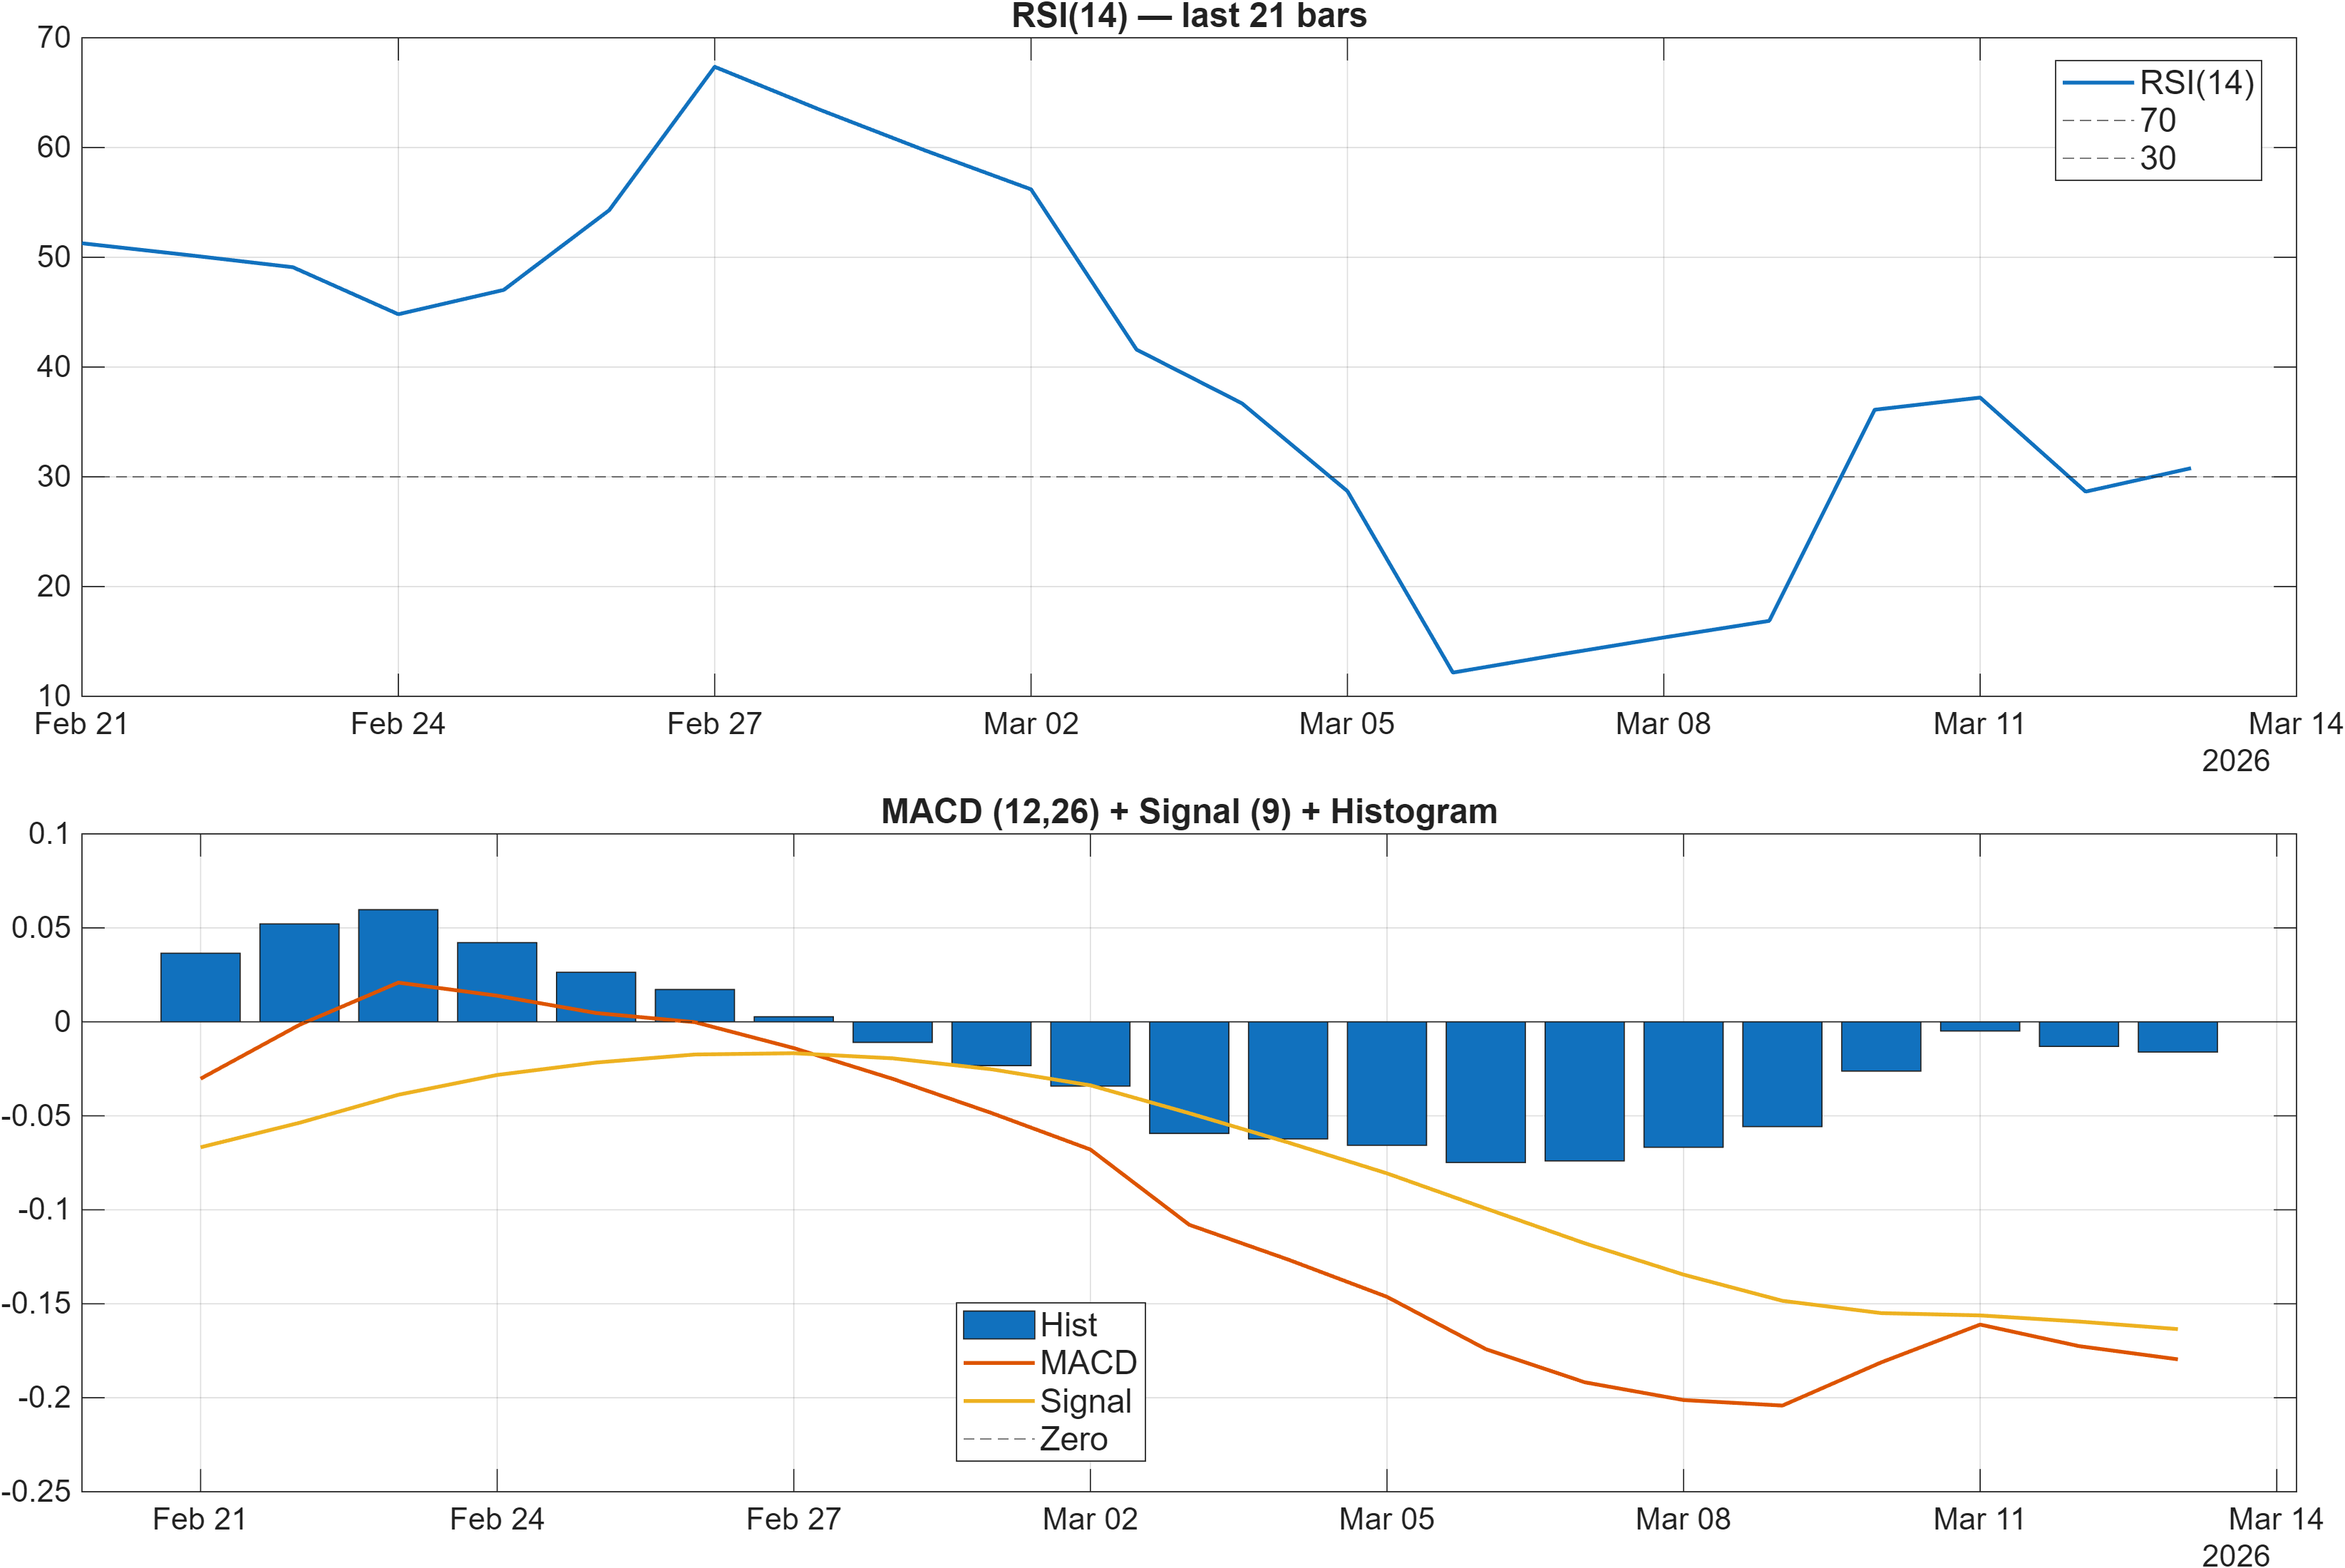
Interpretation: RSI bias = Bearish, MACD hist = -0.0161.
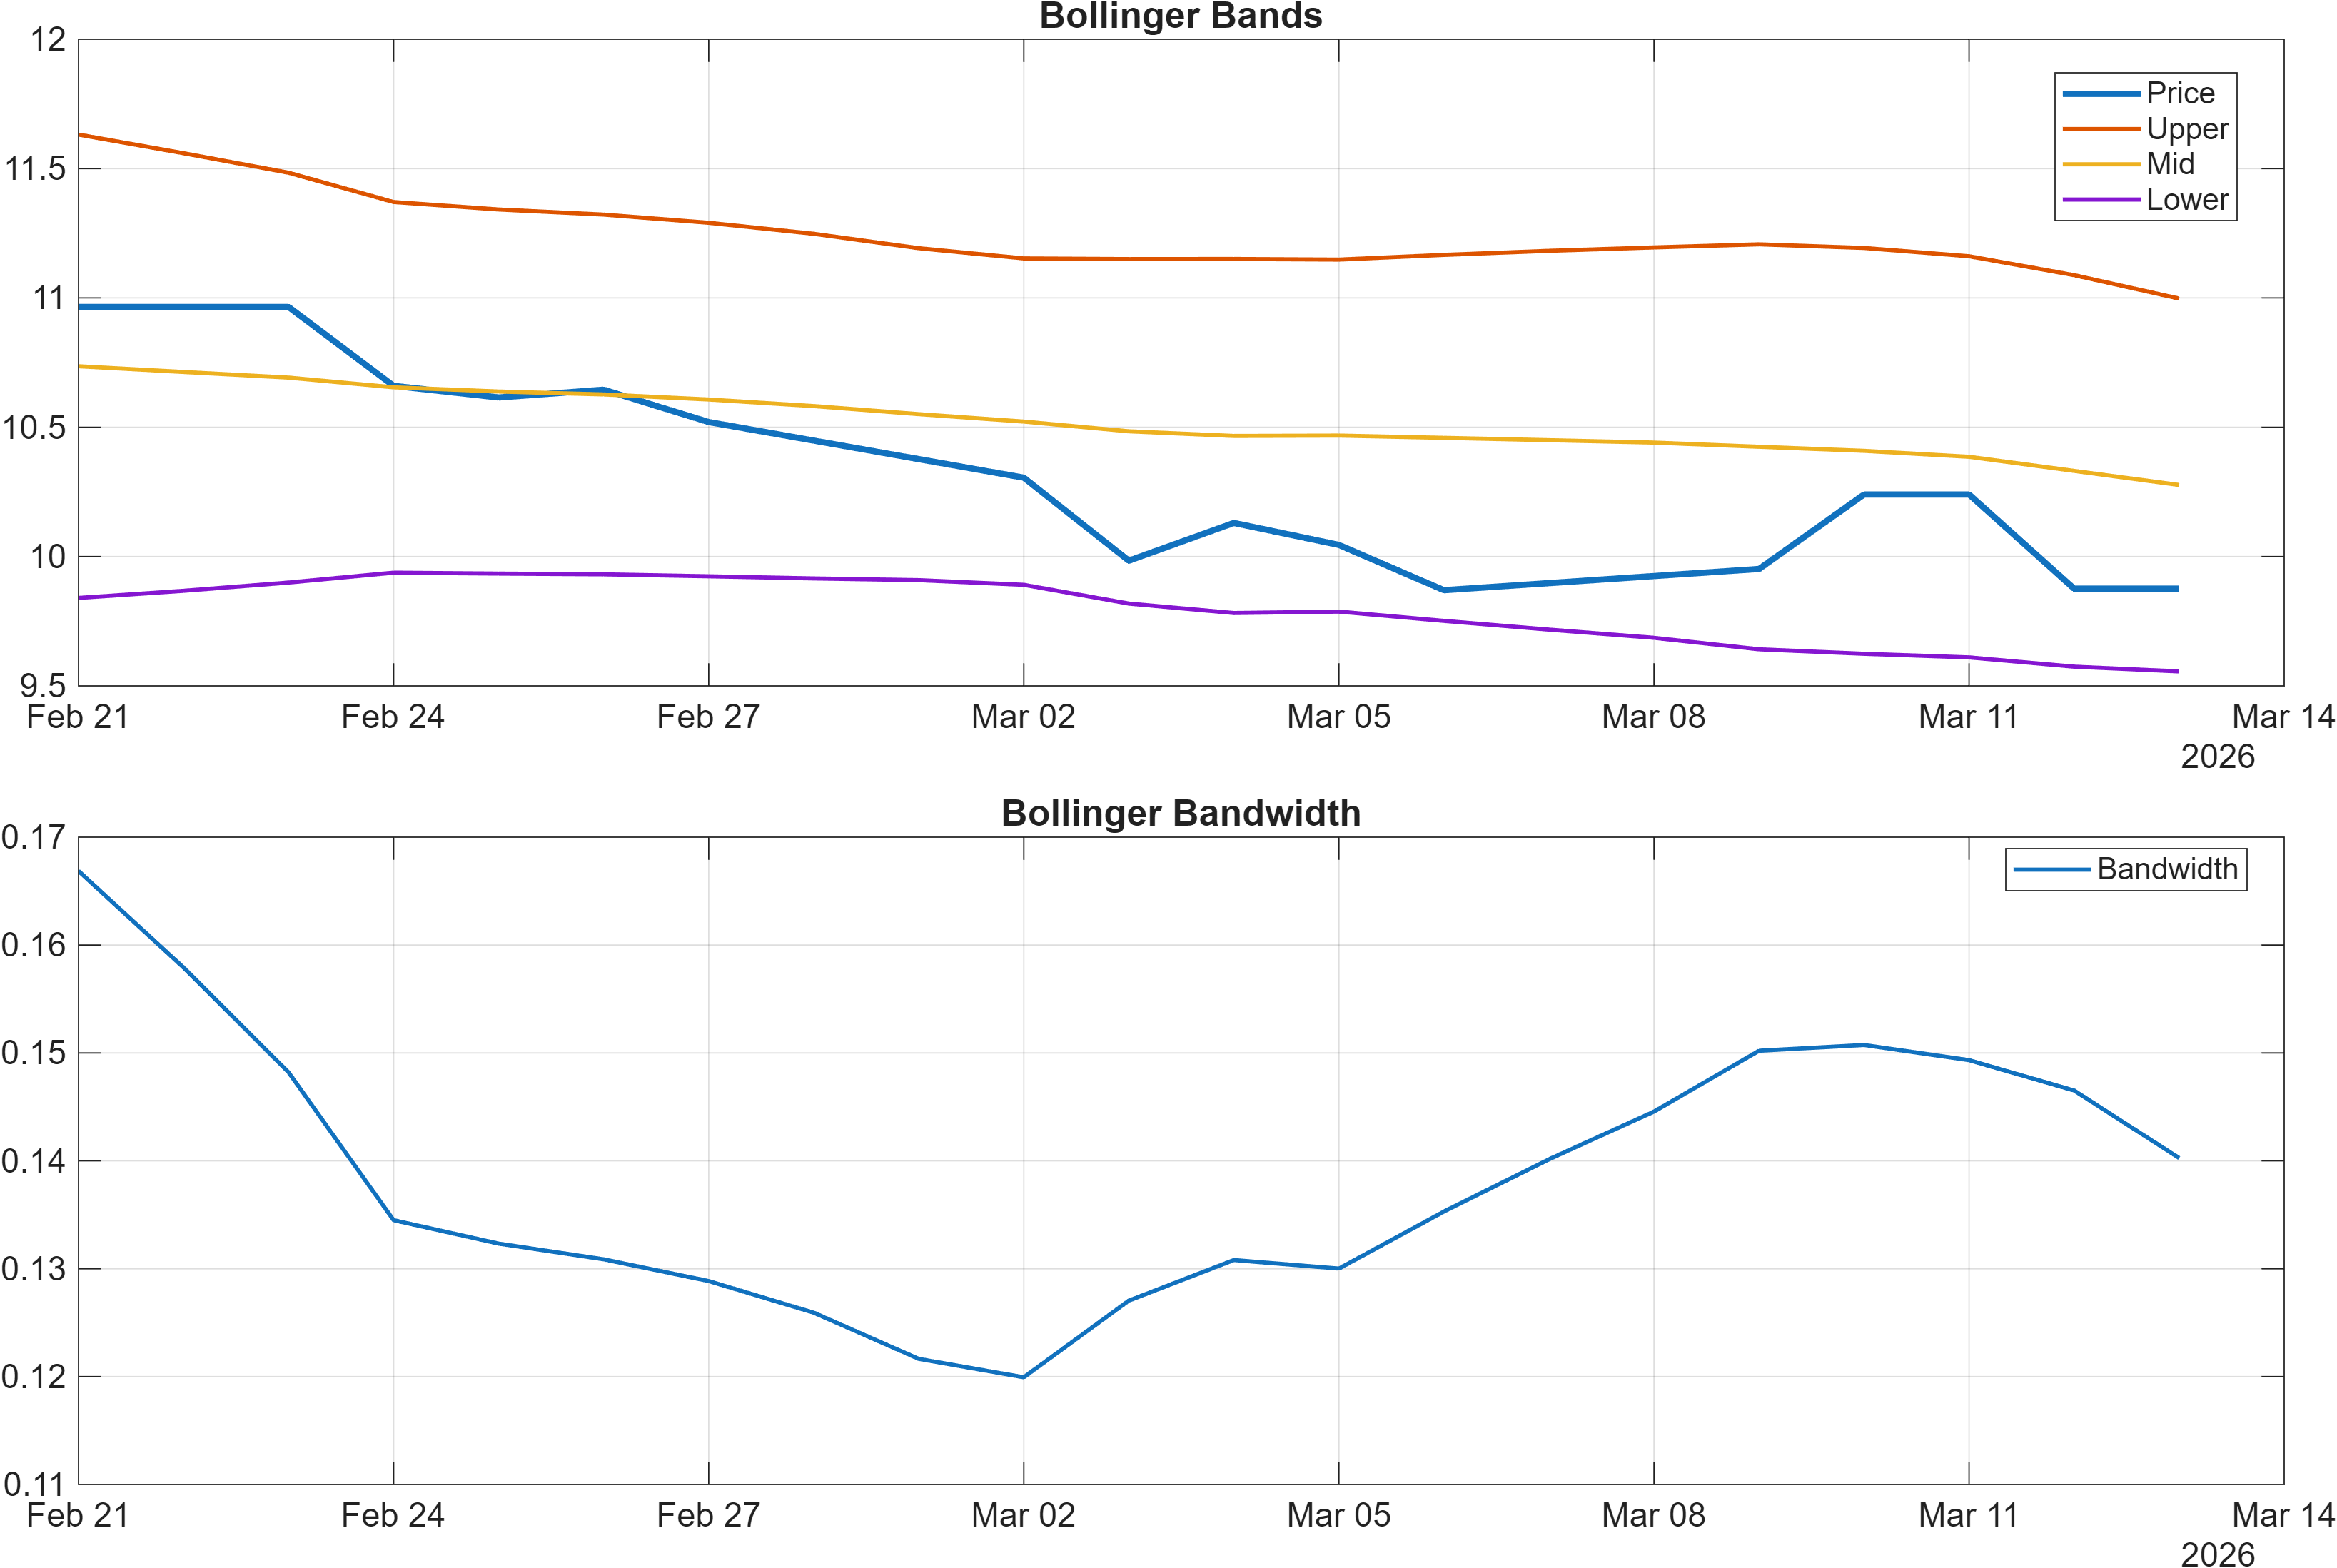
Interpretation: Bandwidth (volatility regime) latest = 0.1403.
Momentum: pressure is evident, but watch for basing behavior
Momentum is skewed to the downside. RSI(14) at 30.79 sits near the oversold boundary, which typically reflects persistent selling pressure rather than a balanced two-way market. Meanwhile, the MACD histogram at -0.0161 indicates that downside momentum remains active; it is not yet signaling a clear positive inflection in the rate of change.
This combination often produces a “weak bounce” profile: rebounds can occur as RSI becomes stretched, but they tend to fail if MACD does not begin to improve and if price cannot recover key moving averages. That interaction is consistent with the broader trend stack (bearish close vs MA50; bearish MA50 vs MA200) and with the poor daily rank (#1203), which implies weakness is not idiosyncratic.
Volatility regime: moderate bandwidth suggests room for expansion
Volatility, as proxied by Bollinger bandwidth at 0.1403, is not at an extreme. Rather than signaling a fully exhausted selloff, it suggests the move has occurred without a blow-off volatility expansion. In regime terms, moderate bandwidth can precede either stabilization (range building) or a renewed directional leg if price breaks a well-defined level.
For CABK.MC, the most relevant read-through is compression versus continuation: if bandwidth begins to expand while price moves away from support ~9.7940 (down) or through resistance ~11.1975 (up), it would represent a more decisive regime outcome than the current “pressure-without-resolution” state.
4) Support / Resistance zones
Support ~ 9.7940 | Resistance ~ 11.1975
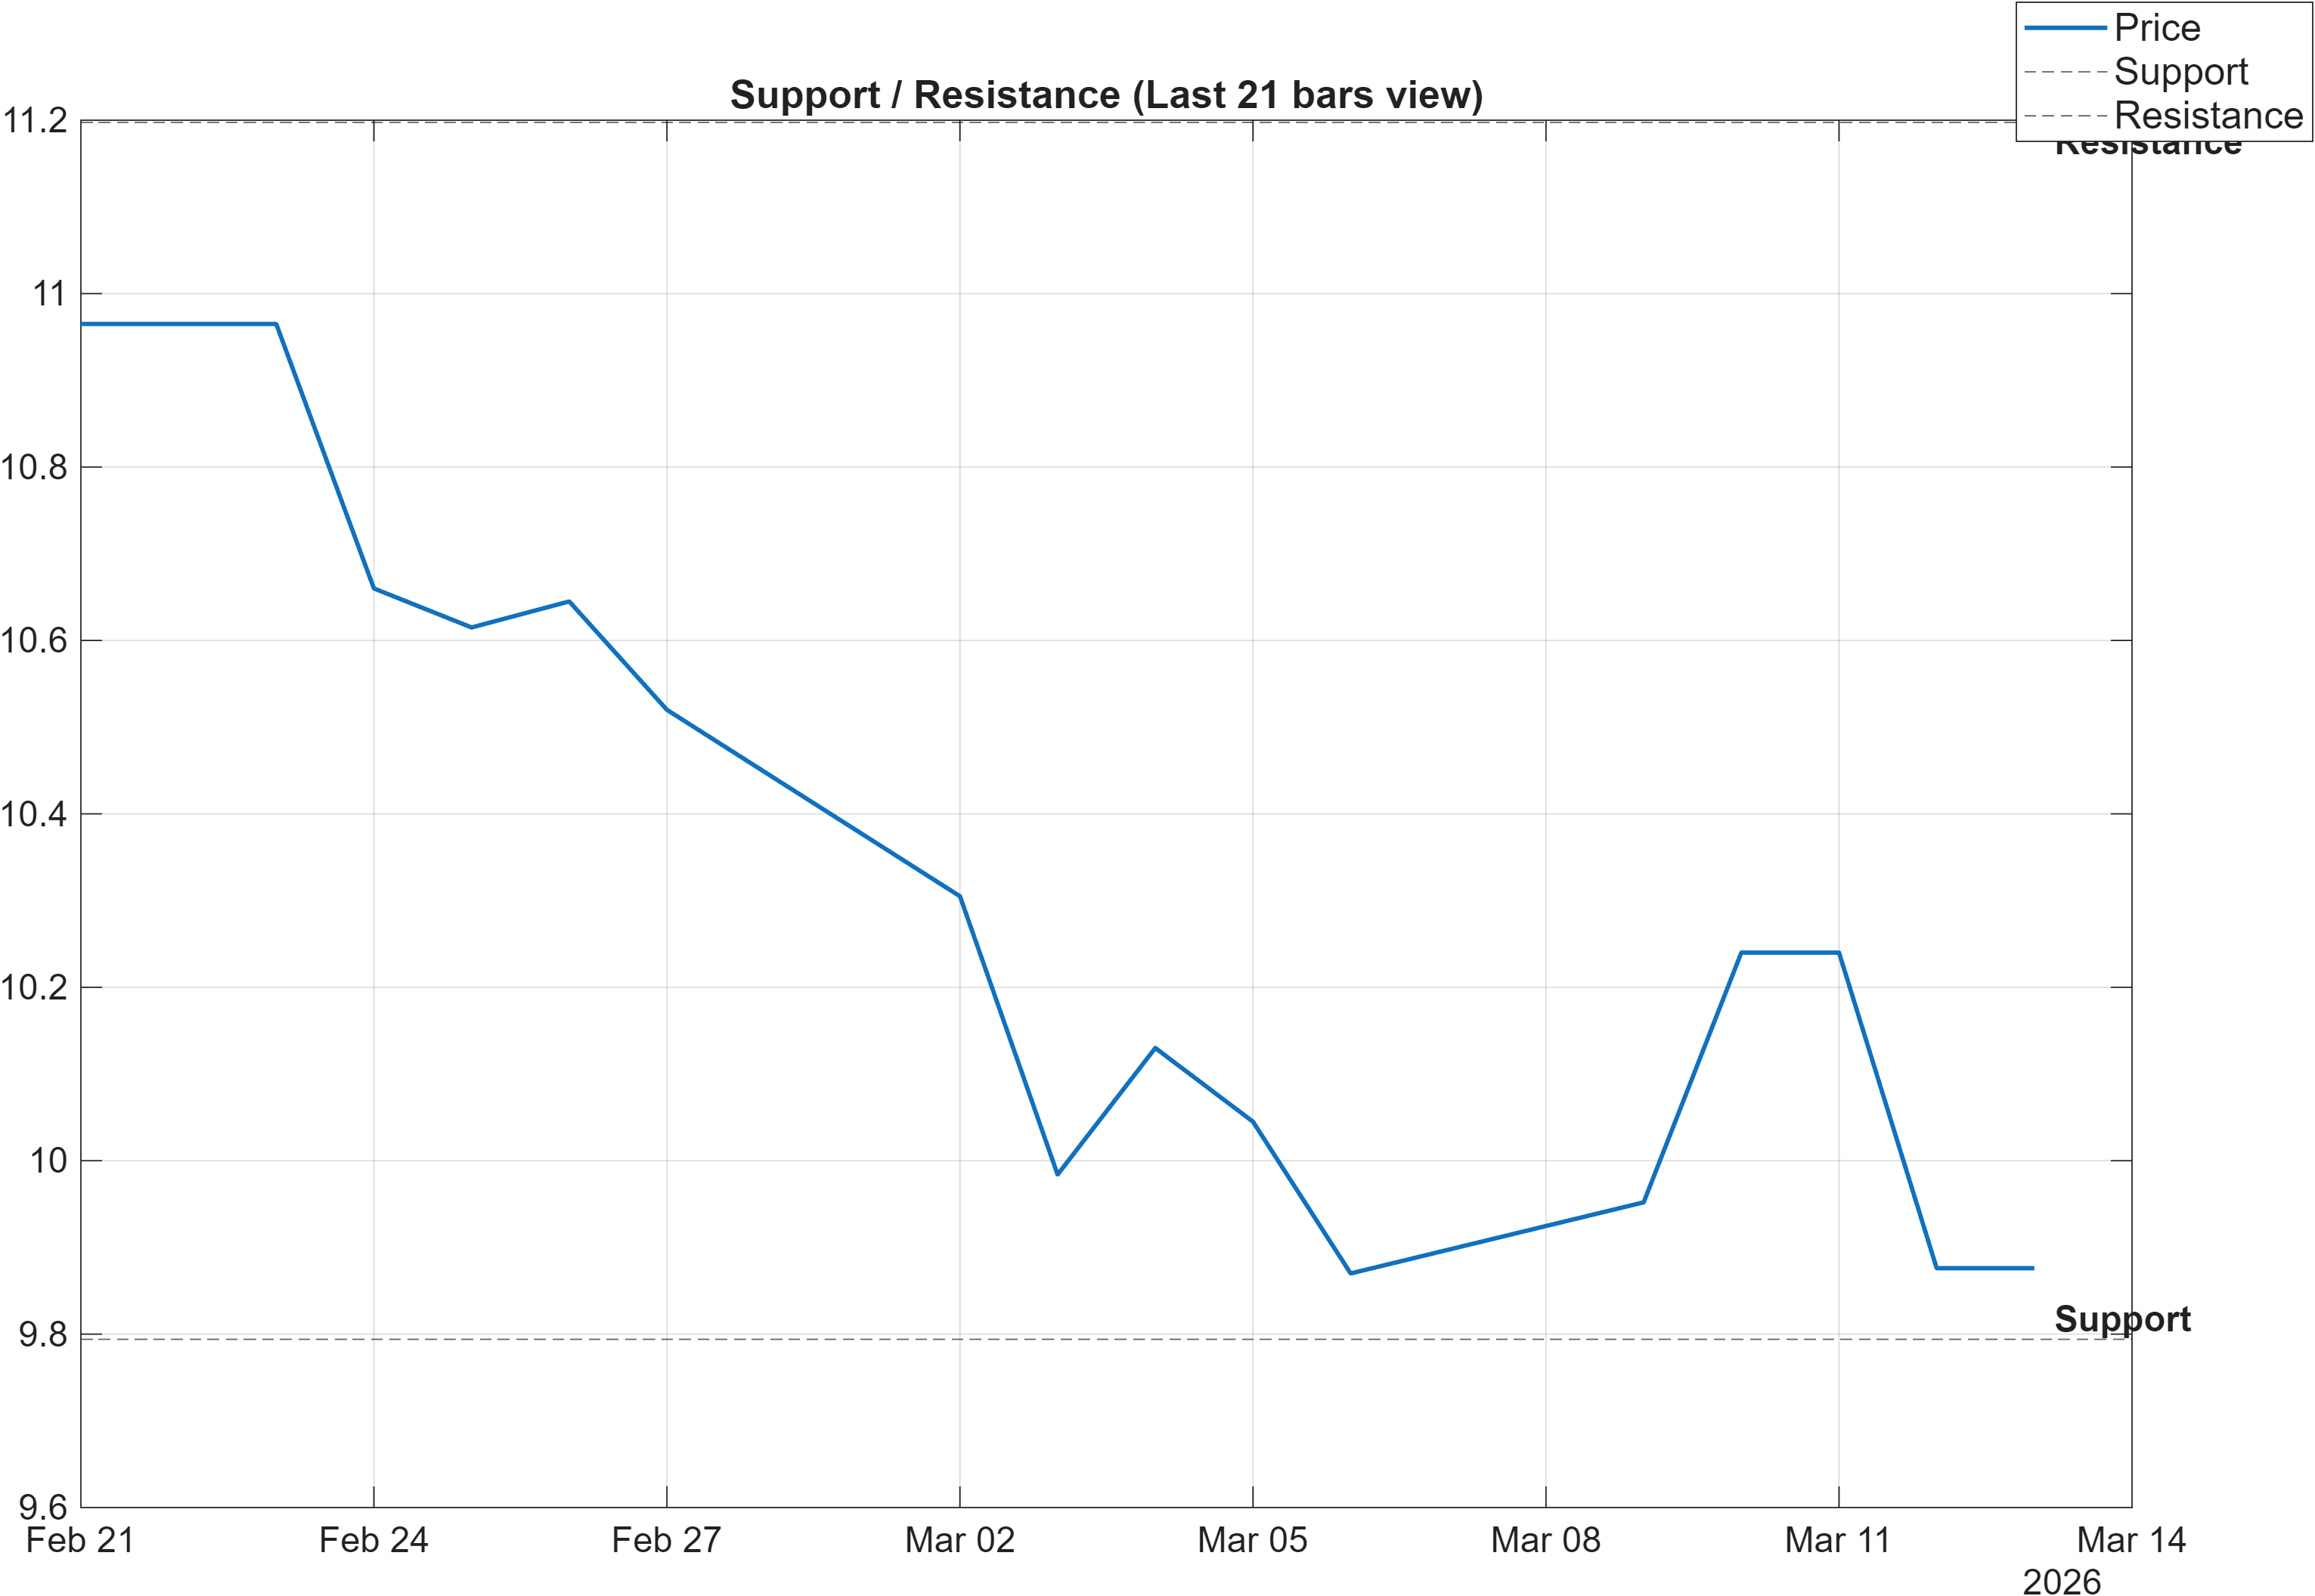
Scenario view: Break above resistance with volume → continuation. Close below support → signal deterioration risk.
Decision zones: where probability shifts tend to occur
The support and resistance bands frame the market’s current “decision geometry.” Support near 9.7940 is the key downside reference: in a bearish trend stack, repeated tests of support can either form a base or erode liquidity until a breakdown occurs. A close below 9.7940 would align with the already weak daily and long-term ranks (#1203, #1184, #1180), increasing the odds that the bearish structure is still in control.
On the upside, resistance near 11.1975 functions as the primary threshold for demonstrating that sellers are losing control of the intermediate range. In a market where RSI bias is bearish and MACD histogram is negative (-0.0161), reclaiming resistance is generally more meaningful when accompanied by improved participation. The scenario guidance explicitly flags the role of volume in validating a break.
Regime transition check: range repair vs continued drift
The most informative path forward is whether CABK.MC can shift from “downtrend rallies” into “range repair.” In that context, the distance between 9.7940 and 11.1975 is not just a map of price levels; it is a probabilistic corridor where the market tests whether the neutral mid-term ranks (weekly #800, monthly #940) will remain stable or migrate toward the bearish longer-term posture.
5) Quant Technical Dashboard (18 Signals)
KGNAI AI Technical Analysis Score (Deep Reinforcement Learning): Rank #1351 out of 1424 (Rank 1 represents the strongest technical positioning and a higher probability of favorable price behavior. As ranks increase toward the maximum, the probability of favorable outcomes weakens and bearish positioning becomes more dominant.) | Label: Bearish | Score: -0.897
18-Signal Technical Confluence Score: -0.111 (Neutral)
Overall Technical Score (18-signal confluence + DRL rank blend): -0.347 (Bearish)
Note: The blended score reflects signal strength weighted against broader AI technical ranking, which may temporarily diverge.
Blended technical score breakdown: -0.347 (Bearish | Bull 6 / Bear 8 / Neutral 4)
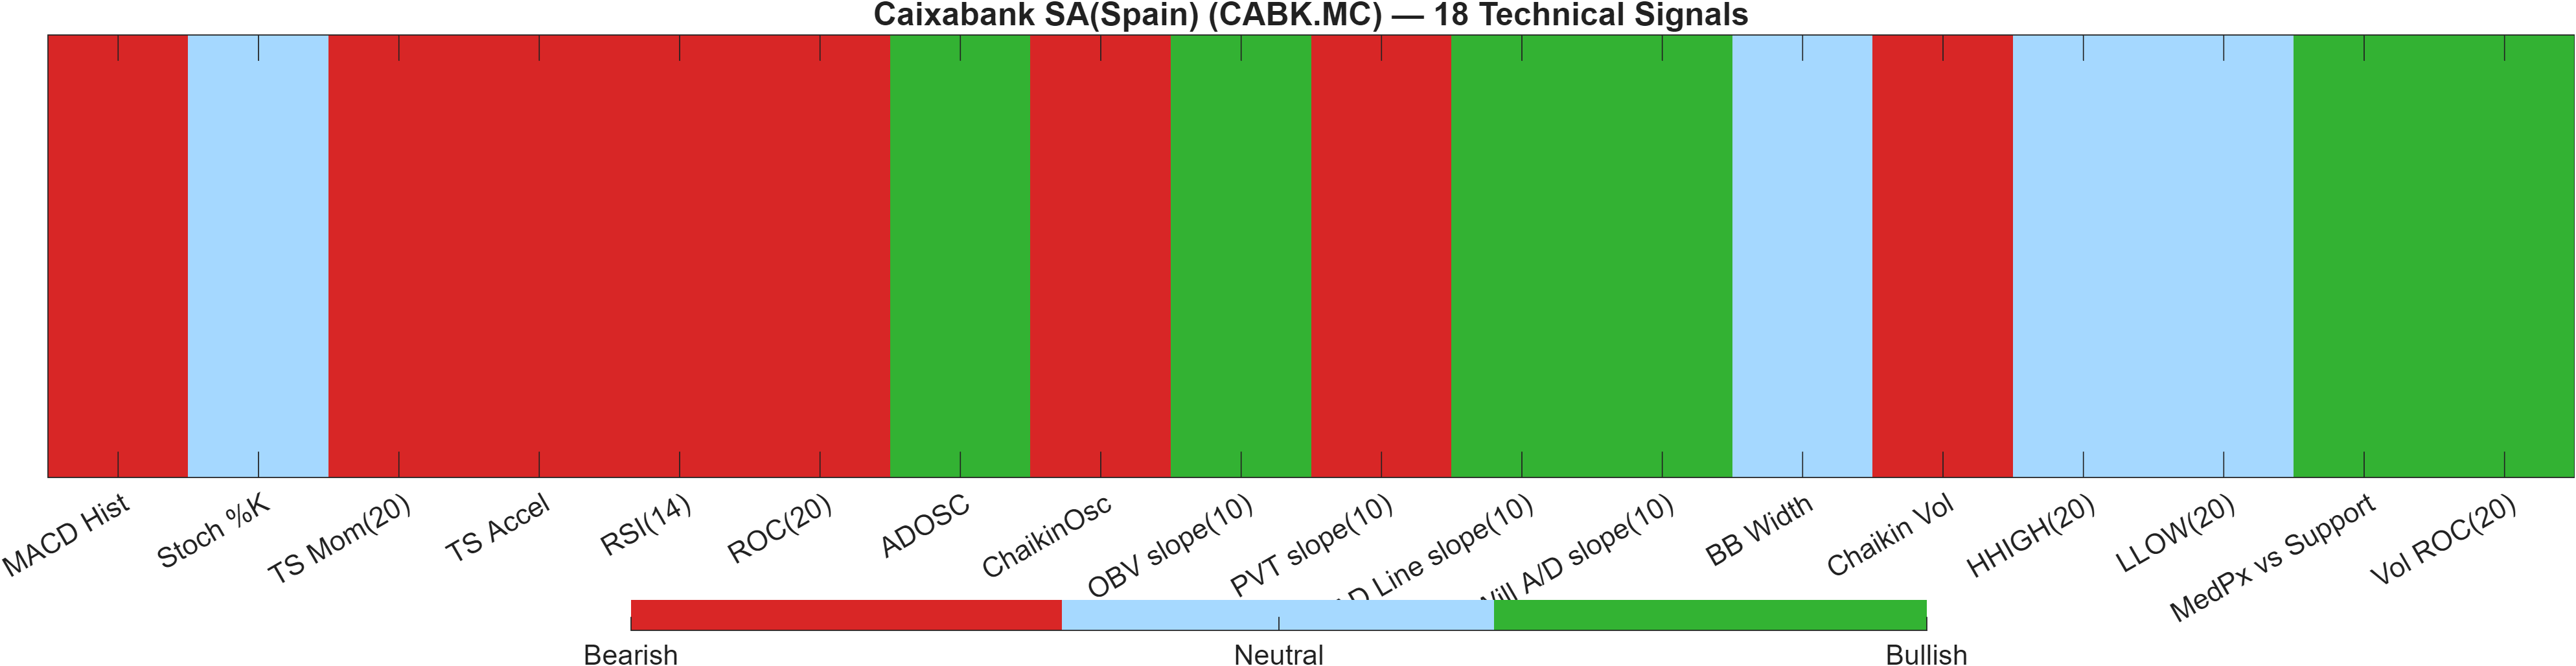
Confluence vs model context: why “neutral” can still resolve bearish
The 18-signal layer is near-flat at -0.111 (Neutral), indicating the indicator set is not unanimously bearish. However, the broader model overlay is notably negative: the Deep Reinforcement Learning technical rank is #1351 (bearish) with a score of -0.897. The resulting blended technical score of -0.347 (Bearish) highlights a common divergence: individual indicators may show partial stabilization while the cross-sectional technical state remains weak.
This is consistent with the signal mix (Bull 6 / Bear 8 / Neutral 4): there are “green shoots” in some volume/accumulation measures, but the balance still leans bearish. In such states, probability tends to hinge on whether bullish sub-signals can translate into price behavior that repairs trend damage—especially with the moving-average stack already bearish.
Indicator-level tension: oversold momentum vs mixed flow
Momentum measures are a key drag: RSI(14) at 30.79 and a negative MACD histogram (-0.01607) reinforce downside pressure, complemented by bearish rate-of-change behavior (ROC(20) -9.932). At the same time, some flow metrics are supportive, with ADOSC 16.67 and a positive OBV slope(10) 2.458e+07, suggesting that not all participation signals are deteriorating in lockstep.
Volatility and boundaries: neutrality can be a “setup,” not a signal
With BB Width 0.1403 and neutral high/low boundary references (e.g., HHIGH(20) 11.12), volatility conditions do not yet force an immediate directional outcome. Instead, the dashboard reads as a setup state: the market is weak on trend and momentum, while some volume-linked measures are not as negative—often a precursor to either a base attempt or a continuation leg depending on how price behaves near 9.7940 and 11.1975.
Signal table (Bull/Bear/Neutral)
| Indicator | Value | Signal |
|---|---|---|
| MACD Hist | -0.01607 | Bearish |
| Stoch %K | 44.24 | Neutral |
| TS Mom(20) | -1.089 | Bearish |
| TS Accel | -0.654 | Bearish |
| RSI(14) | 30.79 | Bearish |
| ROC(20) | -9.932 | Bearish |
| ADOSC | 16.67 | Bullish |
| ChaikinOsc | -1.473e+06 | Bearish |
| OBV slope(10) | 2.458e+07 | Bullish |
| PVT slope(10) | -1.755e+05 | Bearish |
| AD Line slope(10) | 3.56e+05 | Bullish |
| Will A/D slope(10) | 0.923 | Bullish |
| BB Width | 0.1403 | Neutral |
| Chaikin Vol | 13.38 | Bearish |
| HHIGH(20) | 11.12 | Neutral |
| LLOW(20) | 9.492 | Neutral |
| MedPx vs Support | 0.228 | Bullish |
| Vol ROC(20) | 68.2 | Bullish |
Interpretation: Indicator-level signals form the base confluence, which is then adjusted using a separate AI-driven technical ranking model. The final technical score summarizes this combined view.
6) News sentiment + extractive gist
Sentiment score (avg): 0.126 | Positive: 33% | Neutral: 67% | Negative: 0%
KGNAI AI News Sentiment Score (normalized -1 to +1): 0.96 (as of 2026-03-03) | Label: Bullish | Overall news score: 0.97
Positive Developments
Recent coverage across major financial outlets indicates a generally constructive narrative around CaixaBank, centered on valuation framing and capital markets actions. The sentiment mix shows 33% positive and 0% negative, consistent with supportive tone even as price/technical conditions soften. Reported discussion emphasizes funding and balance-sheet management actions, including references to a €1.25b senior bond and a €2.04b consumer loan securitisation, which are typically interpreted as tools to refine funding mix and risk transfer. Within the KGNAI scoring layer, that backdrop translates into a high normalized sentiment reading (0.96) and an overall news score of 0.97. The practical takeaway is not directional certainty, but that the information environment is not the primary driver of the current bearish technical posture; the weakness is more consistent with market mechanics and trend structure than with overtly negative headlines.
Neutral / Mixed Developments
The same aggregated coverage also contains a meaningful neutral component (67% neutral), suggesting that much of the news flow is explanatory rather than catalytic. In this context, neutral sentiment can still matter because it often coincides with “assessment mode,” where investors digest reported results and balance-sheet actions without immediately repricing risk. This aligns with the broader analytical picture: the 18-signal confluence is -0.111 (Neutral), while the blended technical score is -0.347 (Bearish), indicating that a portion of the signal set is not fully synchronized. When news flow is mostly neutral and technical signals are mixed, price tends to anchor to key levels—here, support ~9.7940 and resistance ~11.1975. Monitoring whether subsequent coverage shifts from descriptive to decision-relevant often coincides with volatility expansion from the current bandwidth regime (0.1403).
Negative / Risk Signals
Even with 0% negative in the sentiment breakdown, risk signals are still present—primarily through price behavior that conflicts with constructive narrative. CABK.MC’s technical state remains stressed: RSI(14) is 30.79 with a negative MACD histogram (-0.0161), and trend configuration is bearish (close vs MA50 bearish; MA50 vs MA200 bearish). That divergence can create a “headline resilience, tape weakness” regime, where incremental positive stories do not immediately translate into sustained demand. Another risk is that supportive sentiment may encourage early dip-buying, but if the market closes below 9.7940, it can invalidate stabilization narratives quickly. In short, the near-term risk is less about negative press and more about technical follow-through overwhelming a benign information backdrop.
- What to monitor next: Whether price holds above 9.7940 on a closing basis.
- What to monitor next: Any improvement in momentum confirmation (e.g., MACD histogram moving up from -0.0161) alongside RSI stabilization.
- What to monitor next: Whether a push toward 11.1975 is accompanied by the “with volume” condition stated in the scenario view.
Sources referenced: Reuters, Bloomberg, Yahoo Finance, MarketWatch, Investing.com
7) Sources
Not available in the provided data.
You may also like: How KGNAI AI ranks instruments across global markets
Disclaimer: KGNAI provides AI-generated analytics and educational market commentary only. This is not financial advice. Markets involve risk. Always do your own research.