
NWG.WAR (Newag S.A.) Technical & Rank Outlook — Neutral Near-Term, Bearish Long-Term (11-Mar-2026)
Newag S.A. (NWG.WAR) currently sits in a mixed positioning regime: near-term ranks are neutral, the monthly profile is comparatively strong, and longer-horizon ranks remain weak. In the EUROPE universe of 1424 instruments, the monthly rank at #49 contrasts with a yearly rank at #1307, highlighting a time-horizon divergence that often accompanies regime transitions rather than clean trend continuation. Technically, the dashboard remains Neutral on the blended score (-0.038), but momentum inputs skew softer, with RSI(14) at 31.01 and a MACD histogram at -0.4006. Key decision levels are defined by support near 100.2500 and resistance near 128.1000. With news sentiment broadly neutral (avg -0.013) and instrument-specific matches not found, the setup is better framed as a confirmation/invalidation map than a directional call.
- Rank stance: Short-term Neutral; Mid-term Neutral; Long-term Bearish (monthly stands out as Bullish).
- Technical confluence: Neutral (18-signal confluence -0.222; blended technical -0.038).
- Key levels: Support ~ 100.2500 | Resistance ~ 128.1000.
- News sentiment bias: Neutral (avg -0.013; 94% neutral share).
- Confirmation / invalidation: Strength improves on a break above 128.1000 with volume; risk increases on a close below 100.2500.
KGNAI evaluates assets using large cross-sectional datasets built from millions of structured data points. Inputs incorporate fundamental metrics, technical structures, and systematically processed news sentiment. Statistical models, machine learning, and AI frameworks are used to assess relative positioning, signal alignment, and probabilistic behavior across broad universes.
- Ranks are comparative across the tracked universe, not absolute price targets.
- Confluence reflects alignment among independent signal groups.
- Support/resistance levels are probabilistic decision zones, not guarantees.
- Sentiment provides contextual bias within the broader analytical framework.
1) KGNAI AI Analysis
Region: EUROPE
Total universe size: 1424 ranked instruments
- Daily rank: #986 out of 1424 — Neutral
- Weekly rank: #885 out of 1424 — Neutral
- Monthly rank: #49 out of 1424 — Bullish
- 3-Monthly rank: #1000 out of 1424 — Neutral
- 6-Monthly rank: #1271 out of 1424 — Bearish
- Yearly rank: #1307 out of 1424 — Bearish
NWG.WAR’s rank stack is defined by timeframe disagreement. The monthly rank (#49) places it in the upper tail of the universe, while the daily (#986) and weekly (#885) sit in the neutral range, and the 6-month (#1271) and yearly (#1307) remain in the lower tier. This configuration typically reflects a market that has produced an episodic improvement in intermediate behavior without fully repairing the longer-run profile.
The practical implication is that “neutral” near-term ranks should not be read as an all-clear signal; they more often indicate indecision or consolidation after prior moves. Conversely, the strong monthly print can matter if it is later confirmed by improving 3-month and 6-month ranks, since persistent cross-horizon improvement is usually visible first in intermediate windows.
KGNAI’s framework emphasizes confirmation and invalidation zones over point forecasts. In that context, the current term view (Short-term: Neutral, Mid-term: Neutral, Long-term: Bearish) fits an asset that may be attempting stabilization, but still carries longer-horizon fragility. Any evaluation should be anchored to the defined decision levels (100.2500 and 128.1000) and corroborated by momentum/volume behavior rather than rank alone.
Want the full universe and complete rank tables? Unlock full access on KGNAI: https://www.kgnai.com/pricing
2) Price & trend overview
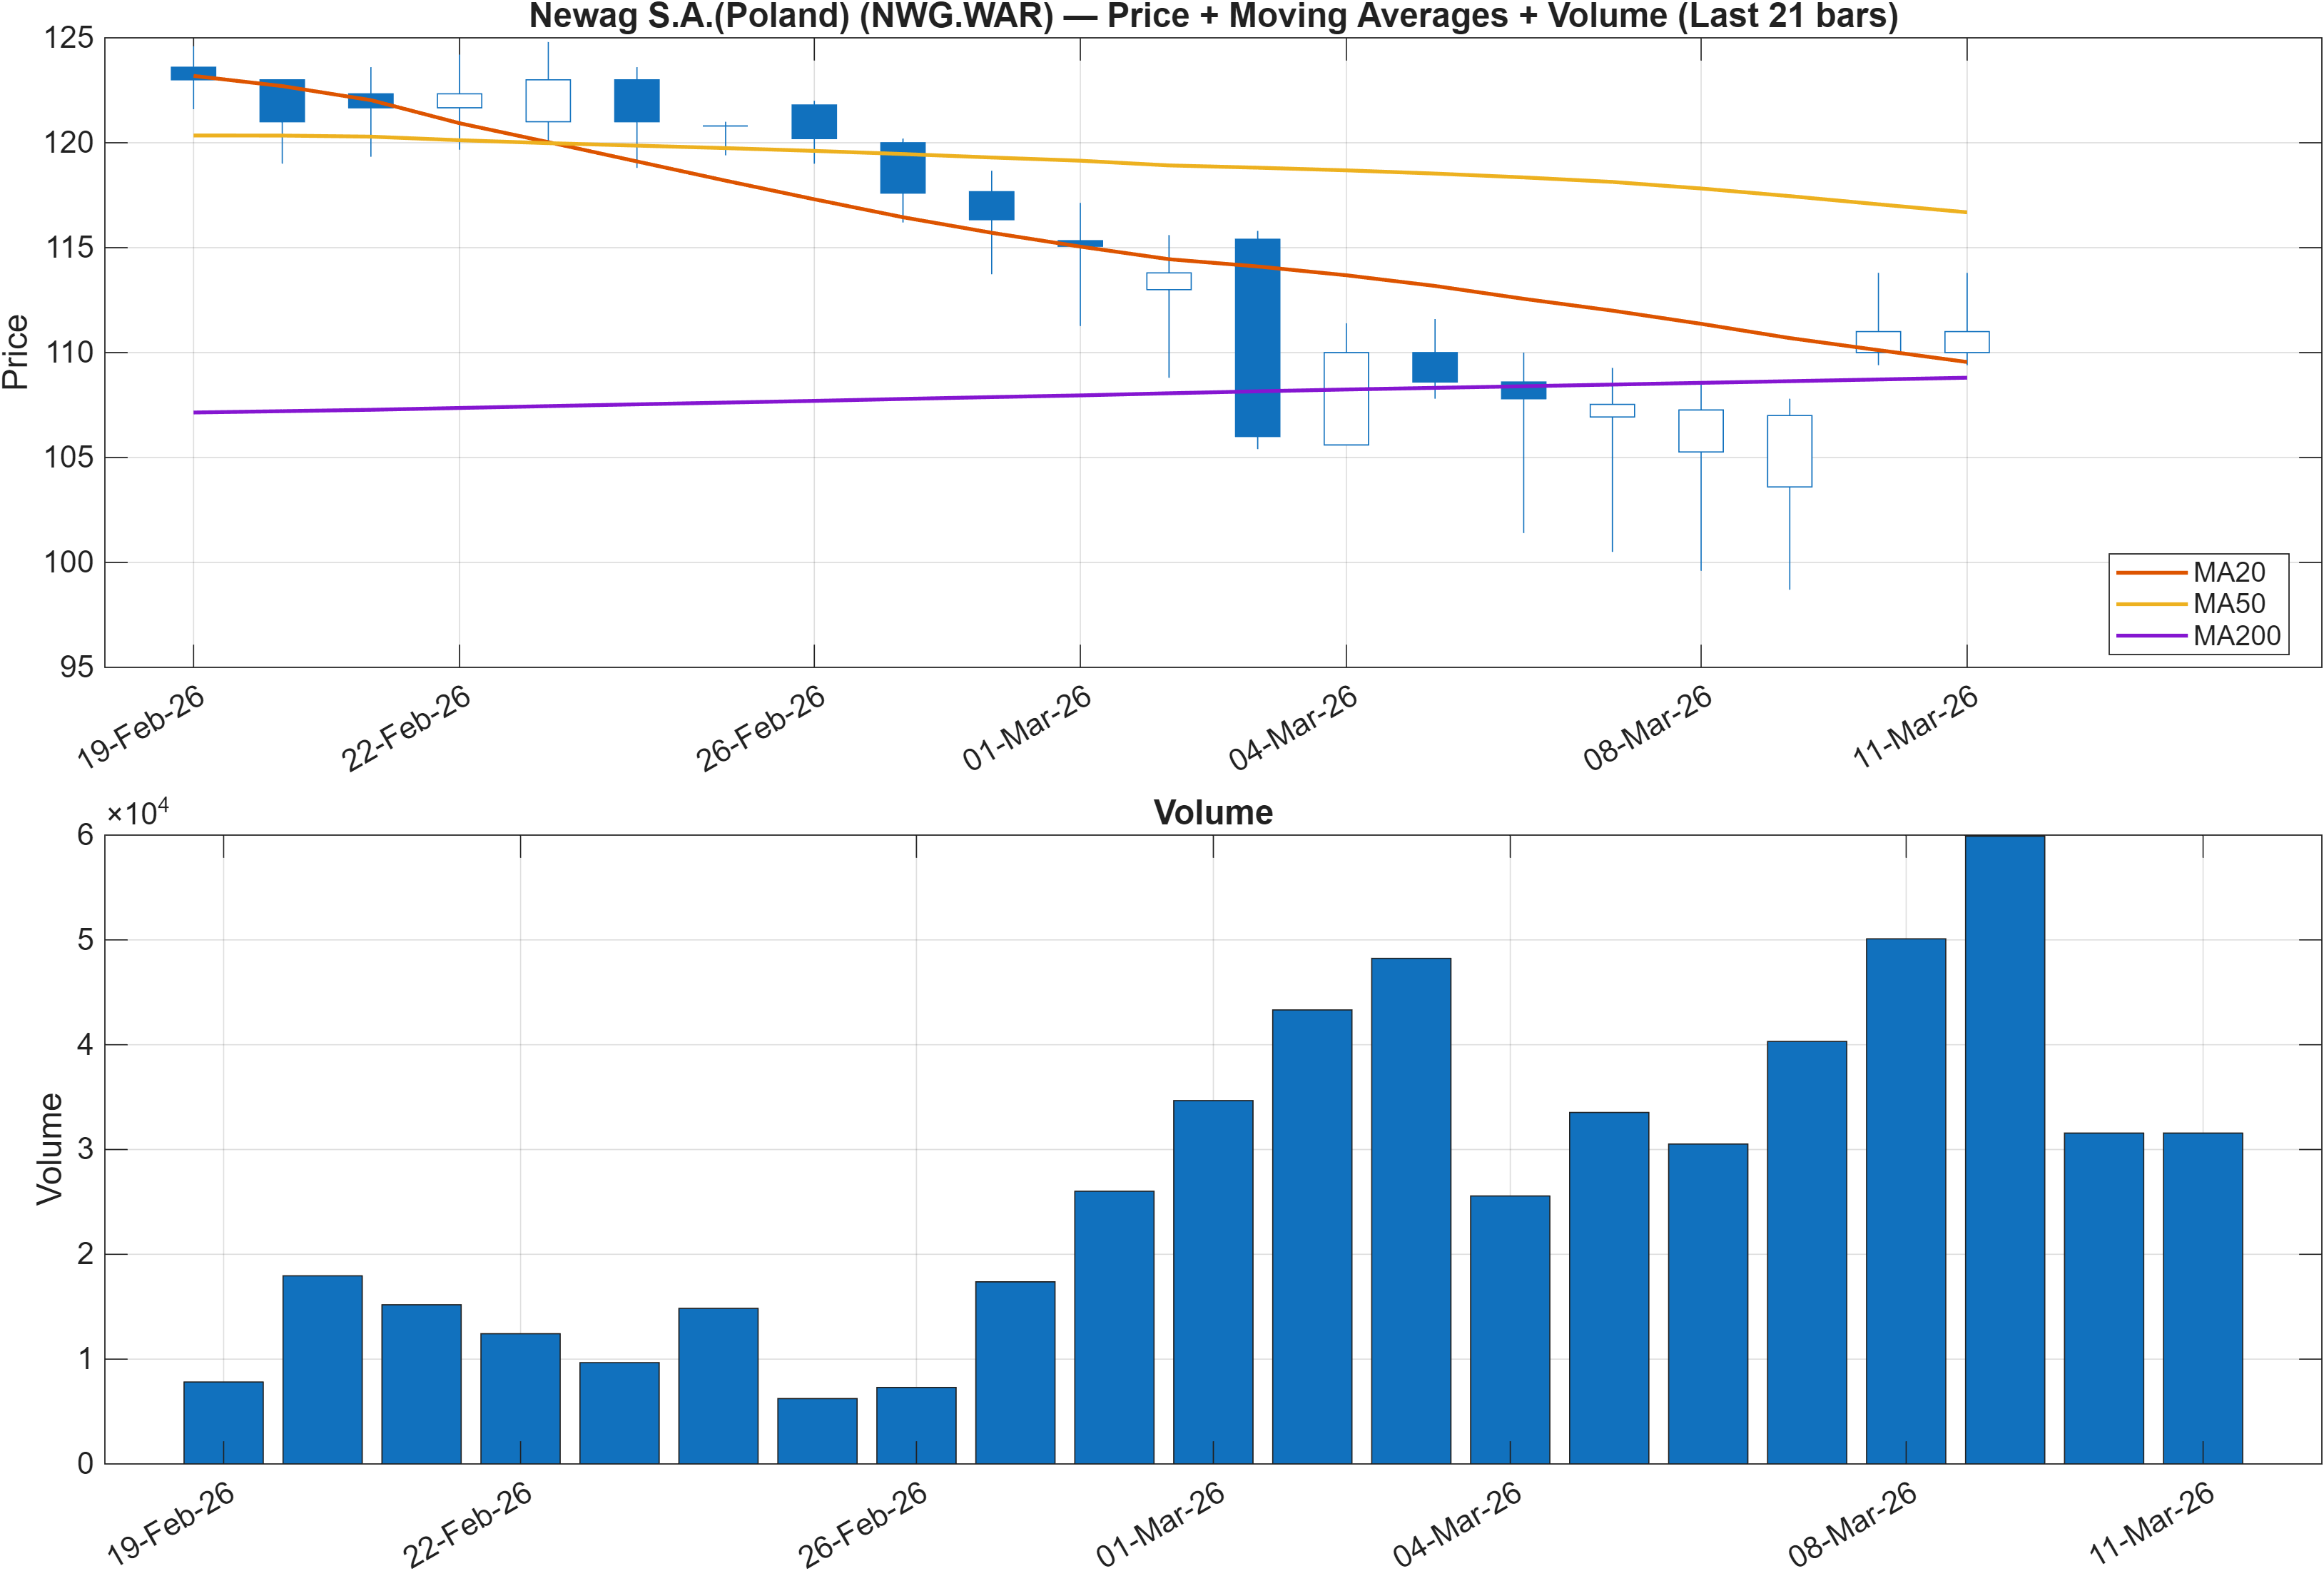
The moving-average structure is explicitly mixed: Close vs MA50 = Bearish while MA50 vs MA200 = Bullish. That combination often appears when the longer baseline trend has not fully rolled over, but price is trading with short-term weakness relative to the intermediate trend filter. In other words, the market may be in a pullback or corrective phase within a still-rising longer moving-average stack, or in an early-stage transition where price is failing to sustain above the medium-term average.
This helps contextualize the rank divergence seen in Section 1: a strong monthly rank (#49) can coexist with weaker long-horizon ranks (#1307 yearly) when the tape is trying to form a base after a prior period of underperformance. The signal quality improves when the bearish “close vs MA50” condition resolves back to constructive price/MA alignment without losing structural support.
Because the chart panel incorporates volume, the scenario is best monitored for whether any move toward the 128.1000 resistance zone is accompanied by participation consistent with continuation rather than a low-liquidity drift. Conversely, persistent closes that keep price below the MA50 while momentum remains heavy (see RSI and MACD in Section 3) tend to reinforce a more defensive interpretation and place more weight on the 100.2500 support area as the key invalidation boundary.
Interpretation: Close vs MA50 = Bearish, MA50 vs MA200 = Bullish.
3) Momentum & volatility dashboard
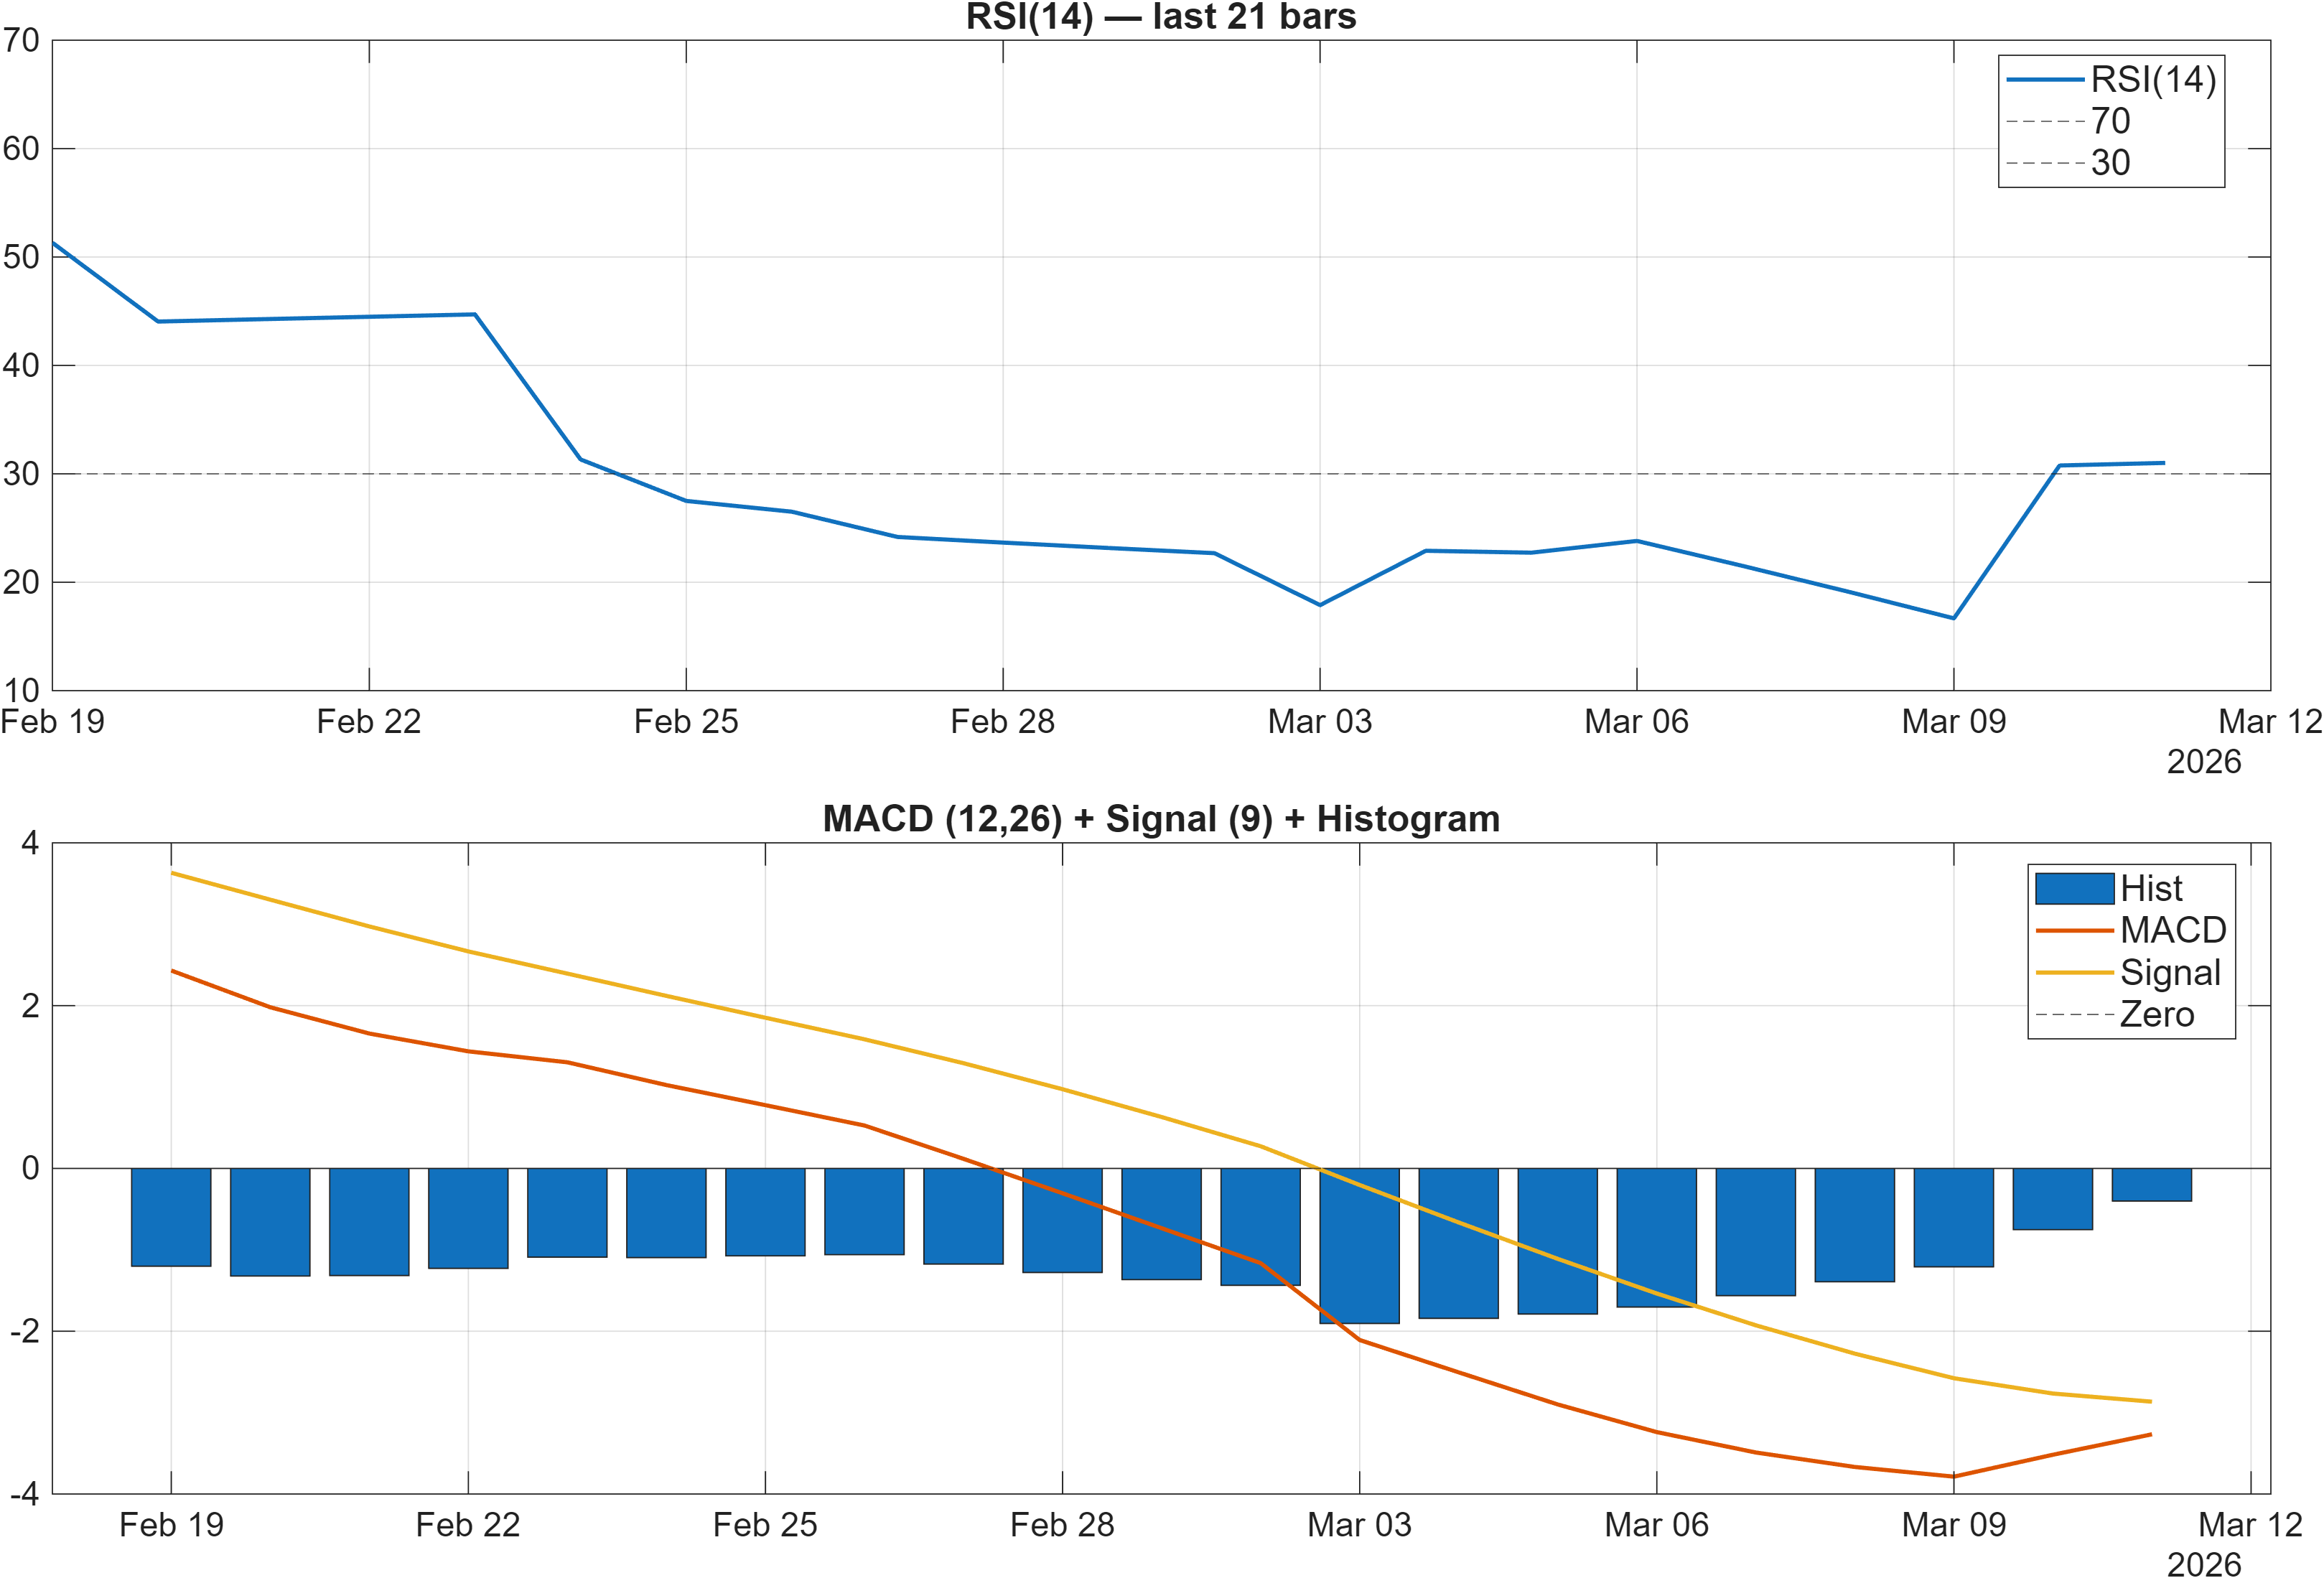
Momentum indicators lean soft even as the overall technical label remains neutral. RSI(14) at 31.01 carries a bearish bias in this snapshot, consistent with diminished buying pressure and a market that has struggled to reclaim its short-term trend filter. Meanwhile, the MACD histogram at -0.4006 indicates negative momentum relative to its recent baseline, a condition that often persists during corrective legs unless a clear inflection occurs.
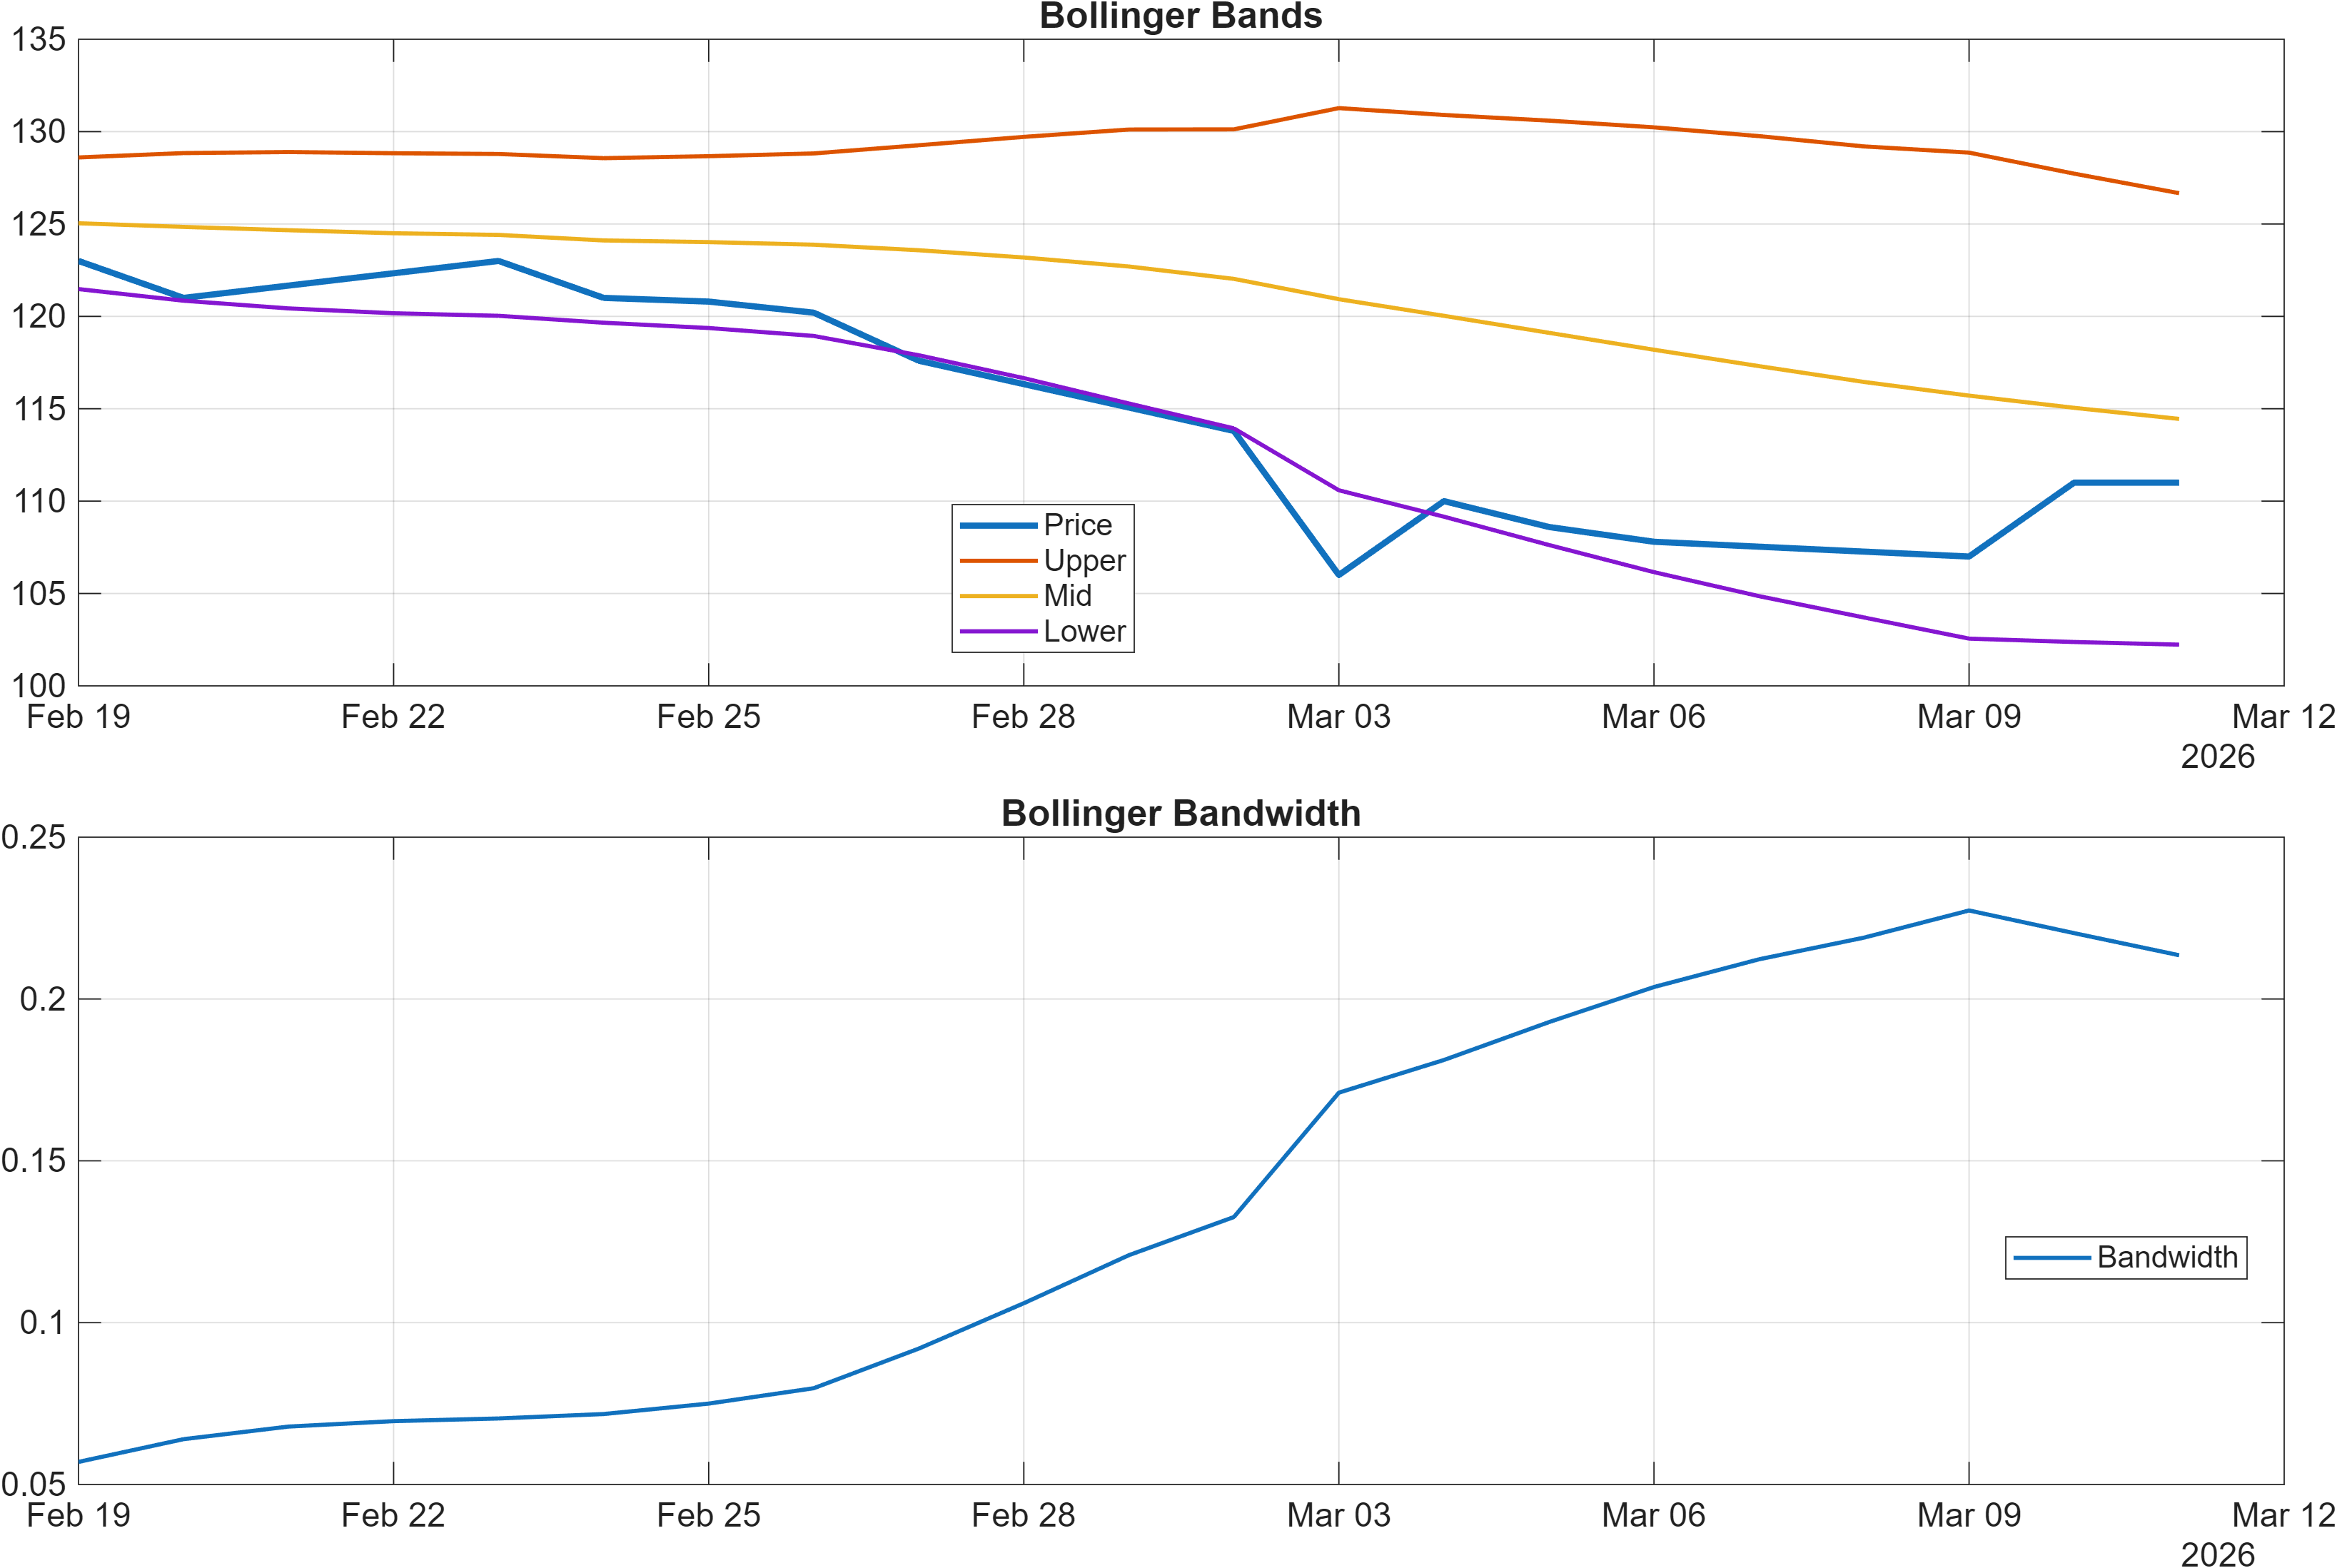
Volatility context matters for interpreting these momentum readings. The Bollinger bandwidth’s latest value (0.2135) suggests a defined but not extreme volatility regime; this is often consistent with a market that is still actively repricing but not in a fully disorderly expansion. In such conditions, momentum can remain negative without immediate capitulation, and price can oscillate within a broader range defined by support/resistance rather than trend cleanly.
The key analytical question is whether momentum weakness is exhaustive (setting up stabilization) or persistent (signaling a continuation of the longer-horizon bearish posture noted in the 6-month (#1271) and yearly (#1307) ranks). If RSI holds near the low-30s and MACD fails to improve, the probability of repeated resistance rejection increases. Conversely, stabilization in RSI alongside a less negative MACD histogram is often the first measurable evidence that a pullback is transitioning into a base.
Interpretation: RSI bias = Bearish, MACD hist = -0.4006.
Interpretation: Bandwidth (volatility regime) latest = 0.2135.
4) Support / Resistance zones
Support ~ 100.2500 | Resistance ~ 128.1000
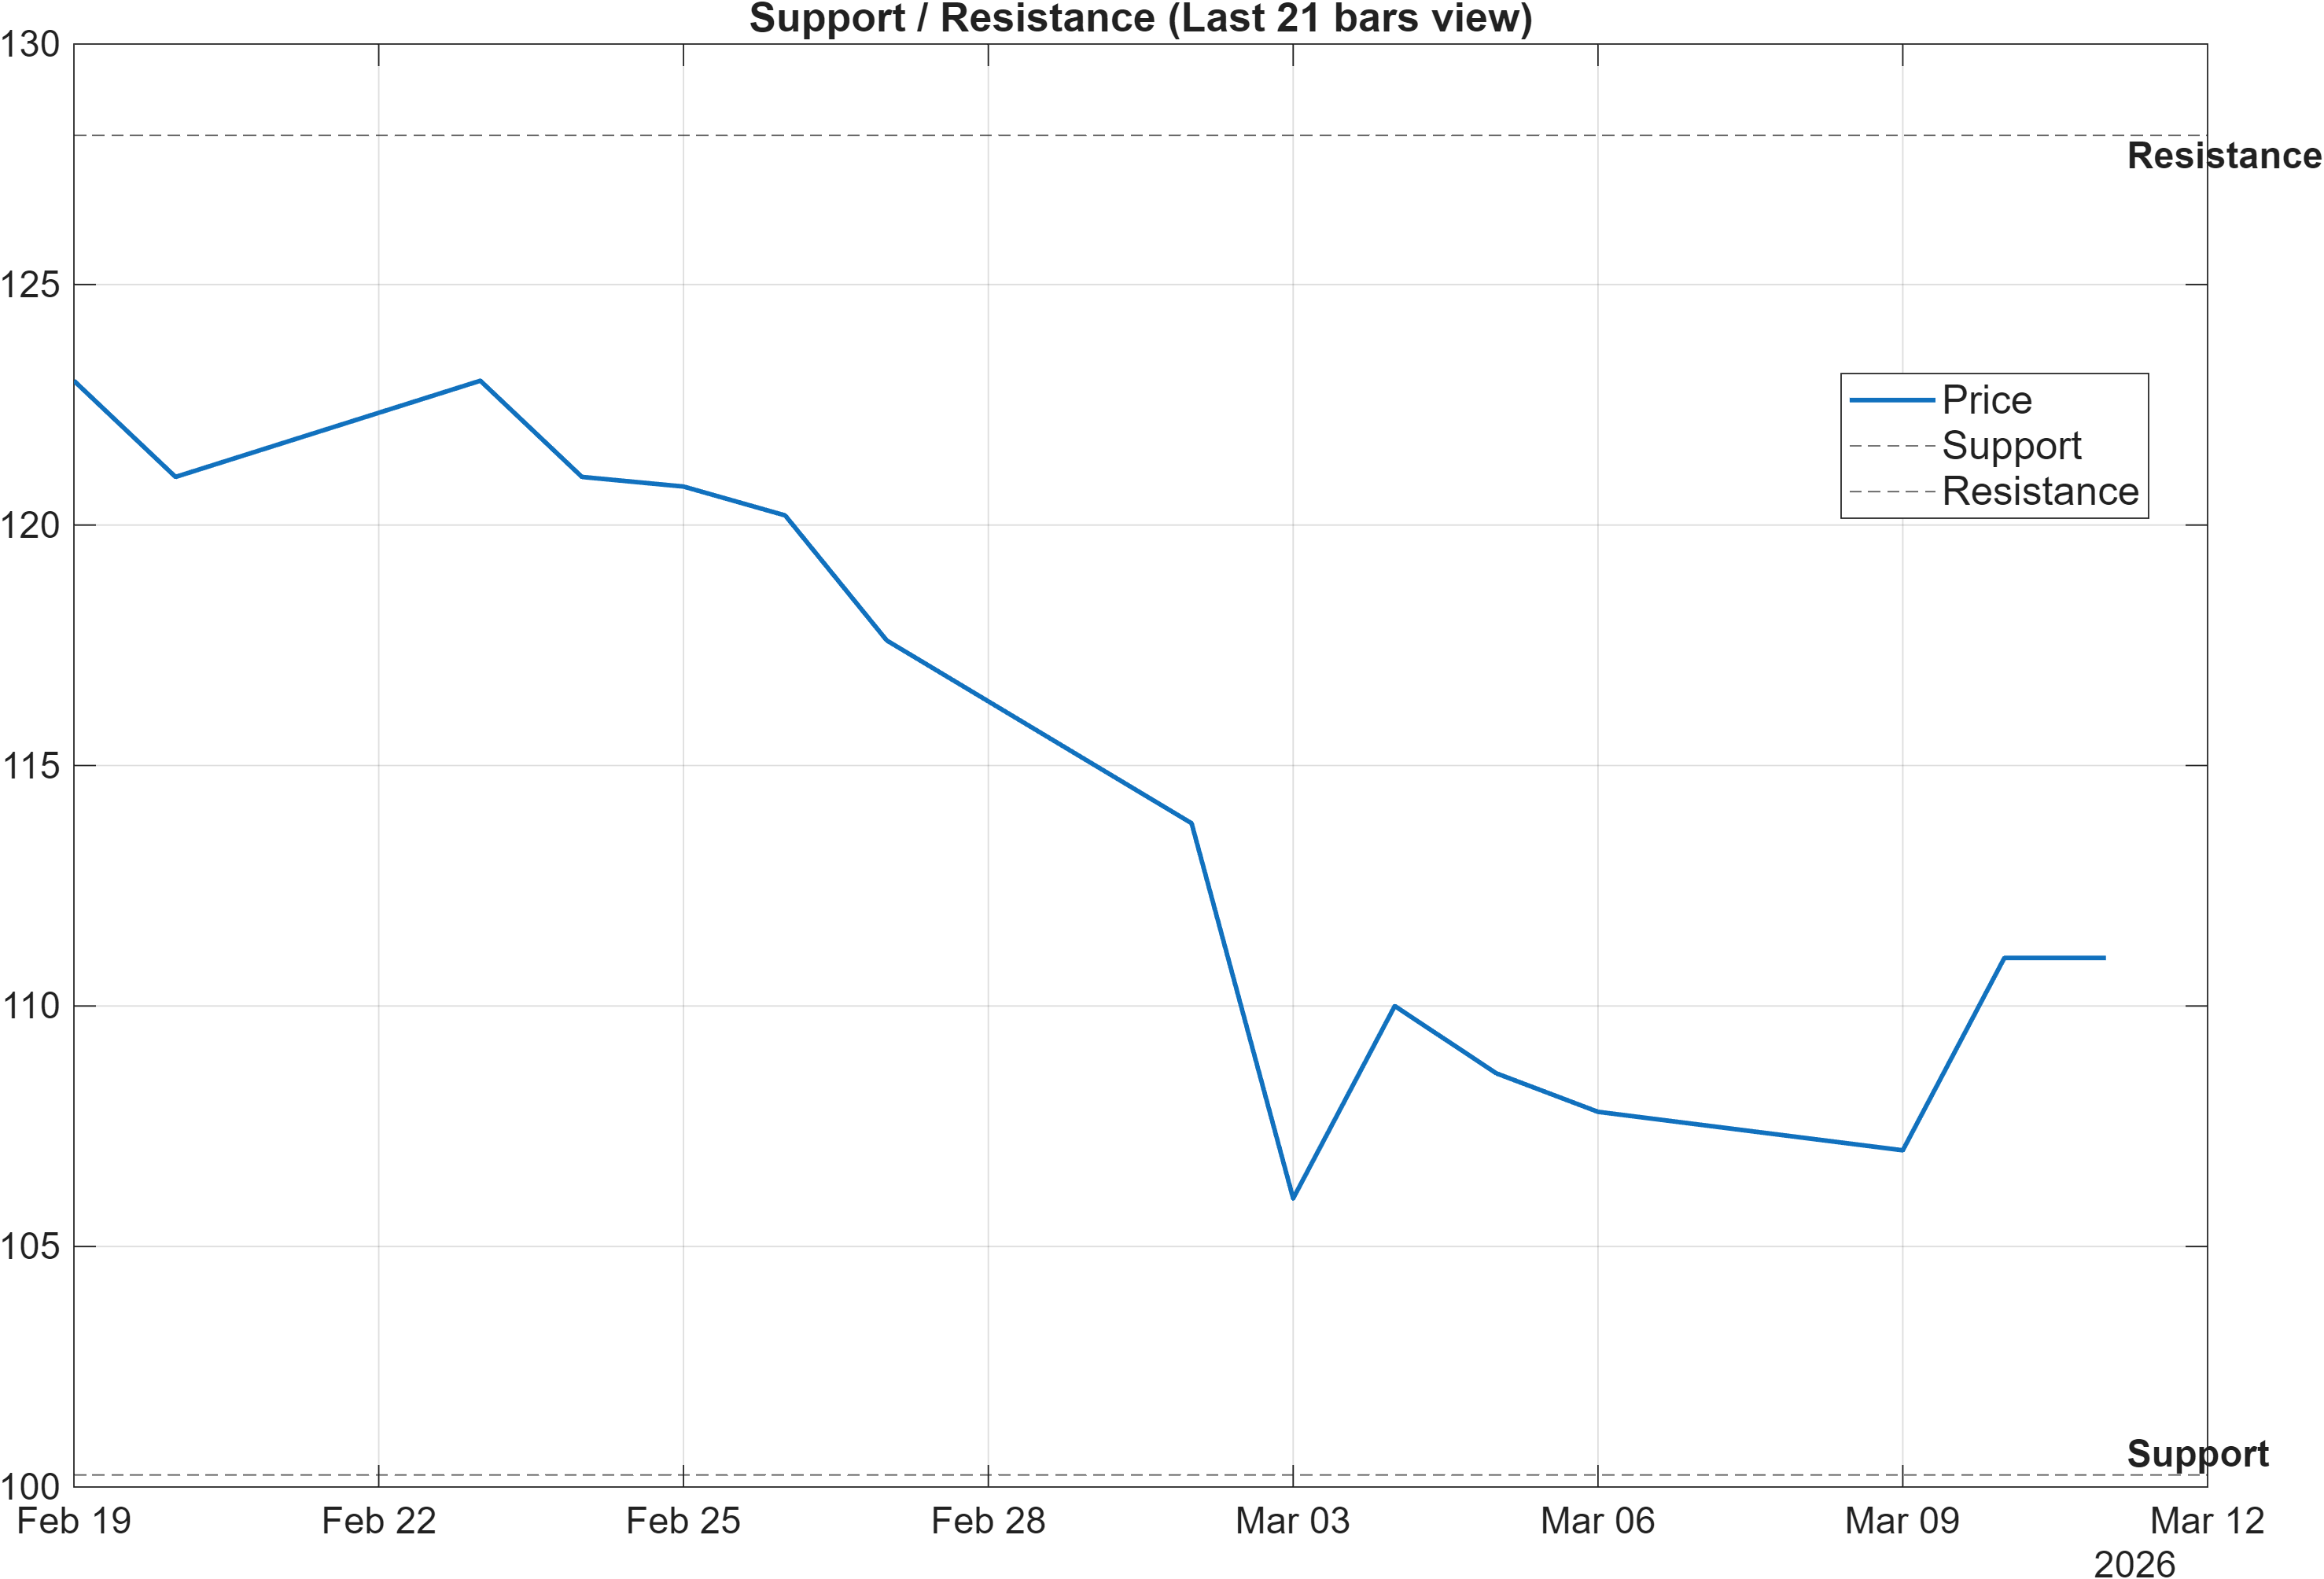
With the blended technical view sitting near flat (-0.038, Neutral), the range framework becomes the primary decision structure. The market’s operative zones are clearly defined: support near 100.2500 as the downside boundary and resistance near 128.1000 as the upside ceiling. When ranks are mixed across horizons—monthly strength alongside weak 6–12 month ranks—these levels often act as the “arbiter” between stabilization and renewed deterioration.
A break above 128.1000 with volume would function as a confirmation event not because it guarantees upside, but because it would align multiple currently mixed inputs: it would improve the bearish “close vs MA50” condition, likely relieve negative momentum pressure (RSI 31.01; MACD hist -0.4006), and support the notion that the favorable monthly rank (#49) is translating into price behavior.
On the other side, a close below 100.2500 would increase deterioration risk by validating that near-term softness is not merely corrective. In that event, the longer-horizon weak ranks (#1271 over 6 months and #1307 yearly) become the dominant contextual anchor, and the neutral technical label would be more likely to resolve bearishly as additional signals flip.
Scenario view: Break above resistance with volume → continuation. Close below support → signal deterioration risk.
5) Quant Technical Dashboard (18 Signals)
KGNAI AI Technical Analysis Score (Deep Reinforcement Learning): Rank #432 out of 1424 (Rank 1 represents the strongest technical positioning and a higher probability of favorable price behavior. As ranks increase toward the maximum, the probability of favorable outcomes weakens and bearish positioning becomes more dominant.) | Label: Neutral | Score: 0.393
18-Signal Technical Confluence Score: -0.222 (Neutral)
Overall Technical Score (18-signal confluence + DRL rank blend): -0.038 (Neutral)
Note: The blended score reflects signal strength weighted against broader AI technical ranking, which may temporarily diverge.
Blended technical score breakdown: -0.038 (Neutral | Bull 5 / Bear 9 / Neutral 4)
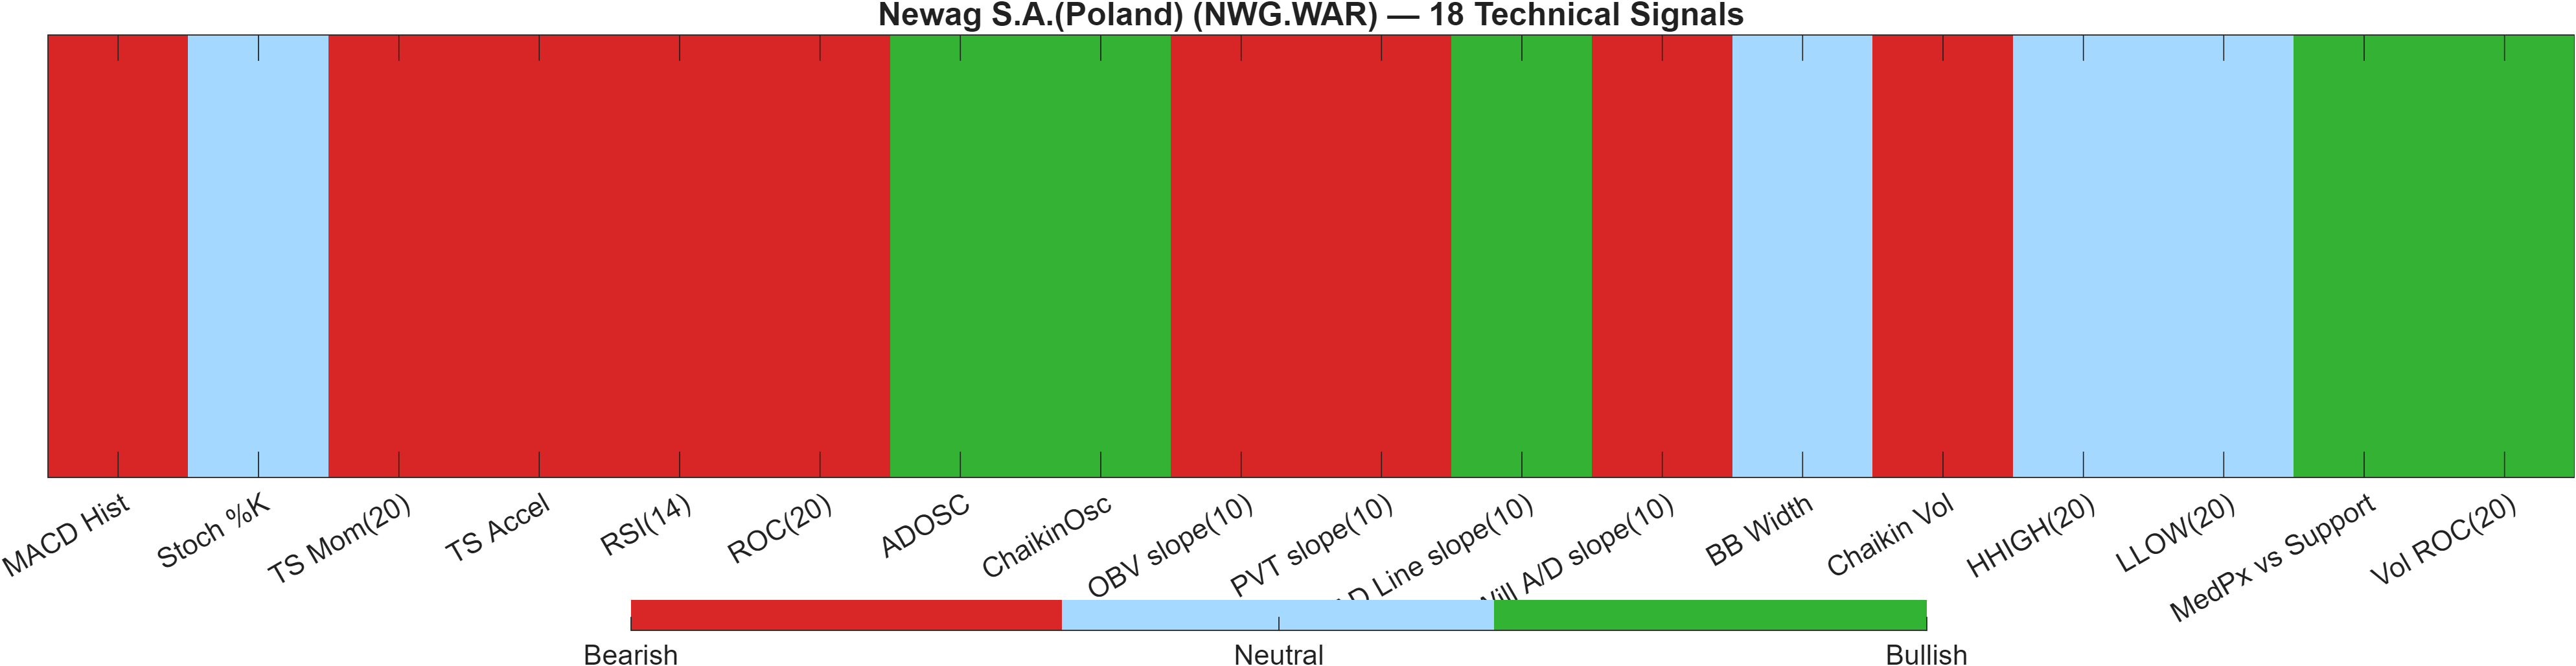
The quant dashboard shows a neutral aggregate built on internally mixed components. The Deep Reinforcement Learning technical rank sits at #432 out of 1424 with a neutral label and score 0.393, while the 18-signal confluence prints -0.222 (Neutral). The blended output (-0.038, Neutral) indicates that negative indicator pressure exists, but it is not uniformly confirmed across all independent signal groups.
The composition (Bull 5 / Bear 9 / Neutral 4) suggests that the current neutrality is not a “balanced” market; it is closer to a bear-tilted mix that is partially offset by select constructive signals. This matches the momentum picture (bearish RSI bias and negative MACD histogram) while leaving room for stabilization if supportive inputs—particularly those linked to participation—remain intact.
One way to reconcile the neutrality is to treat it as signal compression: bearish momentum and trend-friction are present, yet not sufficiently unanimous to turn the blended model decisively negative. In these states, the market often becomes more sensitive to confirmation triggers at key levels. A move that improves the “close vs MA50” relationship while keeping volatility orderly (bandwidth 0.2135) would likely pull the blended score toward constructive territory; failure that coincides with a support break would tend to resolve the neutrality into a more clearly bearish regime.
Signal table (Bull/Bear/Neutral)
| Indicator | Value | Signal |
|---|---|---|
| MACD Hist | -0.4006 | Bearish |
| Stoch %K | 71.93 | Neutral |
| TS Mom(20) | -10 | Bearish |
| TS Accel | -5.733 | Bearish |
| RSI(14) | 31.01 | Bearish |
| ROC(20) | -8.264 | Bearish |
| ADOSC | 61.36 | Bullish |
| ChaikinOsc | 3.577e+04 | Bullish |
| OBV slope(10) | -2.488e+05 | Bearish |
| PVT slope(10) | -2663 | Bearish |
| AD Line slope(10) | 7.884e+04 | Bullish |
| Will A/D slope(10) | -12.2 | Bearish |
| BB Width | 0.2135 | Neutral |
| Chaikin Vol | 34.85 | Bearish |
| HHIGH(20) | 124.8 | Neutral |
| LLOW(20) | 98.7 | Neutral |
| MedPx vs Support | 11.35 | Bullish |
| Vol ROC(20) | 75.86 | Bullish |
Interpretation: Indicator-level signals form the base confluence, which is then adjusted using a separate AI-driven technical ranking model. The final technical score summarizes this combined view.
6) News sentiment + extractive gist
Note: Instrument-specific news matches were not found, so the digest includes broader market/sector headlines.
Sentiment score (avg): -0.013 | Positive: 0% | Neutral: 94% | Negative: 6%
KGNAI AI News Sentiment Score (normalized -1 to +1): Not available (as of —) | Label: Not available | Overall news score: -0.01
Positive Developments
Recent coverage across major financial outlets indicates a generally steady information flow with limited direct, instrument-specific catalysts for NWG.WAR in the provided set. The sentiment distribution—94% neutral with a slightly negative average (-0.013)—suggests that the broader narrative backdrop is not decisively risk-on or risk-off. Constructive interpretation, in this context, comes less from overtly positive headlines and more from the absence of concentrated negative coverage, which can reduce the probability of sentiment-driven volatility spikes. For a security already showing mixed technical alignment (neutral blended score at -0.038), a benign news tone can help keep attention anchored on market-structure signals: whether price can re-engage resistance at 128.1000 without fresh macro stress and whether participation remains supportive. The key benefit of this “quiet” sentiment regime is that confirmation may emerge through price/volume behavior rather than narrative shocks.
Neutral / Mixed Developments
The dominant feature of the news digest is its broad-market orientation, consistent with the note that instrument-specific matches were not found. That aligns with the near-flat aggregate reading (overall news score -0.01) and the heavy neutral share. In practical analytical terms, this tends to make news sentiment a secondary filter rather than a primary driver: it can contextualize risk appetite, but it is unlikely to explain day-to-day moves. For NWG.WAR, the more actionable integration is to treat sentiment as a background condition while monitoring whether technical softness (e.g., MACD hist -0.4006) improves or persists. When sentiment is broadly neutral, technical levels such as 100.2500 and 128.1000 often carry more weight as decision points.
Negative / Risk Signals
Even with a mostly neutral classification, the presence of a 6% negative share and the slightly negative average score implies an asymmetric risk: it may not take much additional adverse flow to shift the sentiment regime, especially if markets are already sensitive to geopolitical or policy uncertainty. For an asset with long-horizon ranks still in the lower tier (e.g., yearly #1307), that matters because negative macro or sector narratives can accelerate existing structural weakness. The key risk interaction is with technical fragility: if price fails to reclaim its intermediate trend posture while momentum remains pressured (RSI(14) 31.01), a sentiment deterioration can become the catalyst that forces a test of support at 100.2500. In this setting, risk management is better expressed as level-based monitoring rather than headline parsing.
- Whether broad risk sentiment shifts enough to change the neutral distribution (94% neutral; avg -0.013).
- Any increase in volatility that coincides with repeated rejection near 128.1000 or pressure toward 100.2500.
- Signs that momentum stabilizes (MACD histogram -0.4006 improving) alongside steadier market tone.
Sources referenced: Reuters, Bloomberg, Yahoo Finance, MarketWatch, Investing.com
Snapshot: AI Rank (Short–Mid–Long): Mixed (Neutral–Neutral–Bearish) · Technical Confluence: Neutral · Key Levels: Support ~100.25 | Resistance ~128.10 · News Sentiment: Neutral
7) Sources
Not available in the provided data.
You may also like: How KGNAI AI ranks instruments across global markets
Disclaimer: KGNAI provides AI-generated analytics and educational market commentary only. This is not financial advice. Markets involve risk. Always do your own research.