
Stratec SE (Germany) (SBS.F) Technical & Rank Outlook — Bearish Short-Term Pressure, Neutral Mid-Term, Bearish Long-Term (18-Feb-2026)
AI-Based Technical, Rank & Sentiment Analysis
KGNAI Signal + Technical Snapshot + News Sentiment Digest
As of: 18-Feb-2026
Ticker: SBS.F
Stratec SE (SBS.F) is currently characterized by weak short-term relative positioning and a bearish technical blend, while mid-term ranks remain more mixed. Within the EUROPE universe of 1426 ranked instruments, the daily rank sits at #1376, placing SBS.F in the lower tail of the distribution and consistent with near-term pressure. The 18-signal framework also leans negative, with an 18-Signal Technical Confluence Score of -0.333 (Bearish) and an Overall Technical Score of -0.378 (Bearish). Momentum inputs reinforce that tilt: RSI(14) is 26.12 with a bearish bias and MACD histogram is -0.0493, suggesting downside momentum still dominates despite occasional oversold-type readings. Volatility is present but not extreme, with BB Width at 0.1854. Key decision zones are defined by support near 20.1500 and resistance near 23.2583, framing what would constitute stabilization versus renewed deterioration.
- Short / Mid / Long stance: Bearish / Neutral / Bearish (ranks include #1376 daily and #1181 yearly out of 1426)
- Technical confluence: Bearish (Overall Technical Score -0.378; confluence -0.333)
- Key levels: Support ~ 20.1500 | Resistance ~ 23.2583
- News sentiment bias: Slightly negative / neutral-leaning (avg -0.063; Neutral 70%, Negative 30%, Positive 0%)
- Confirmation / invalidation: A close below 20.1500 increases deterioration risk; a break above 23.2583 with volume is the primary stabilization/continuation trigger in the provided framework
What KGNAI Measures
KGNAI evaluates instruments by combining relative positioning across large universes with multi-test signal alignment. The objective is to identify where price behavior is statistically stronger or weaker versus peers, rather than relying on single-indicator narratives. Outputs are probabilistic and designed to remain comparable across volatility regimes.
How to Read This Report
- Ranks are comparative within the stated universe, not absolute measures of quality
- Confluence reflects agreement (or disagreement) across multiple technical tests
- Support/resistance levels represent decision zones, not guarantees
- Sentiment provides contextual bias and can diverge from price and signals
1) KGNAI AI Analysis
Region: EUROPE
Total universe size: 1426 ranked instruments
- Daily rank: #1376 out of 1426 — Bearish
- Weekly rank: #764 out of 1426 — Neutral
- Monthly rank: #706 out of 1426 — Neutral
- 3-Monthly rank: #495 out of 1426 — Neutral
- 6-Monthly rank: #1287 out of 1426 — Bearish
- Yearly rank: #1181 out of 1426 — Bearish
Across the 1426-instrument European universe, SBS.F shows a clear short-term weakness that is not fully echoed by the intermediate horizons. The daily rank at #1376 places the stock in the bottom tier of the universe, while the weekly (#764) and monthly (#706) ranks sit closer to the middle of the distribution. This shape—very weak at the shortest horizon, more average in the mid-range—often aligns with either (a) a sharp, recent move that has not yet fully reset medium-term comparisons, or (b) a short-term acceleration within an already-challenged longer-term structure.
The longer windows tilt negative again: the 6-month rank at #1287 and yearly rank at #1181 point to persistent relative underperformance versus peers. That combination matters because it frames the current environment as pressure occurring inside a broader weak regime, not merely a one-off dislocation. In ranking terms, the mid-term neutrality (including #495 on the 3-month window) should be read less as a bullish counter-signal and more as a sign that the medium horizon has not fully confirmed the near-term deterioration.
Term view: Short-term: Bearish. Mid-term: Neutral. Long-term: Bearish.
KGNAI ranks each instrument across large universes using multiple proprietary AI tests and statistical models (millions of data points). Lower ranks generally indicate stronger probability of favorable performance behavior, while higher ranks indicate weaker probability and more bearish positioning.
Want the full universe and complete rank tables? Unlock full access on KGNAI: https://www.kgnai.com/pricing
2) Price & trend overview
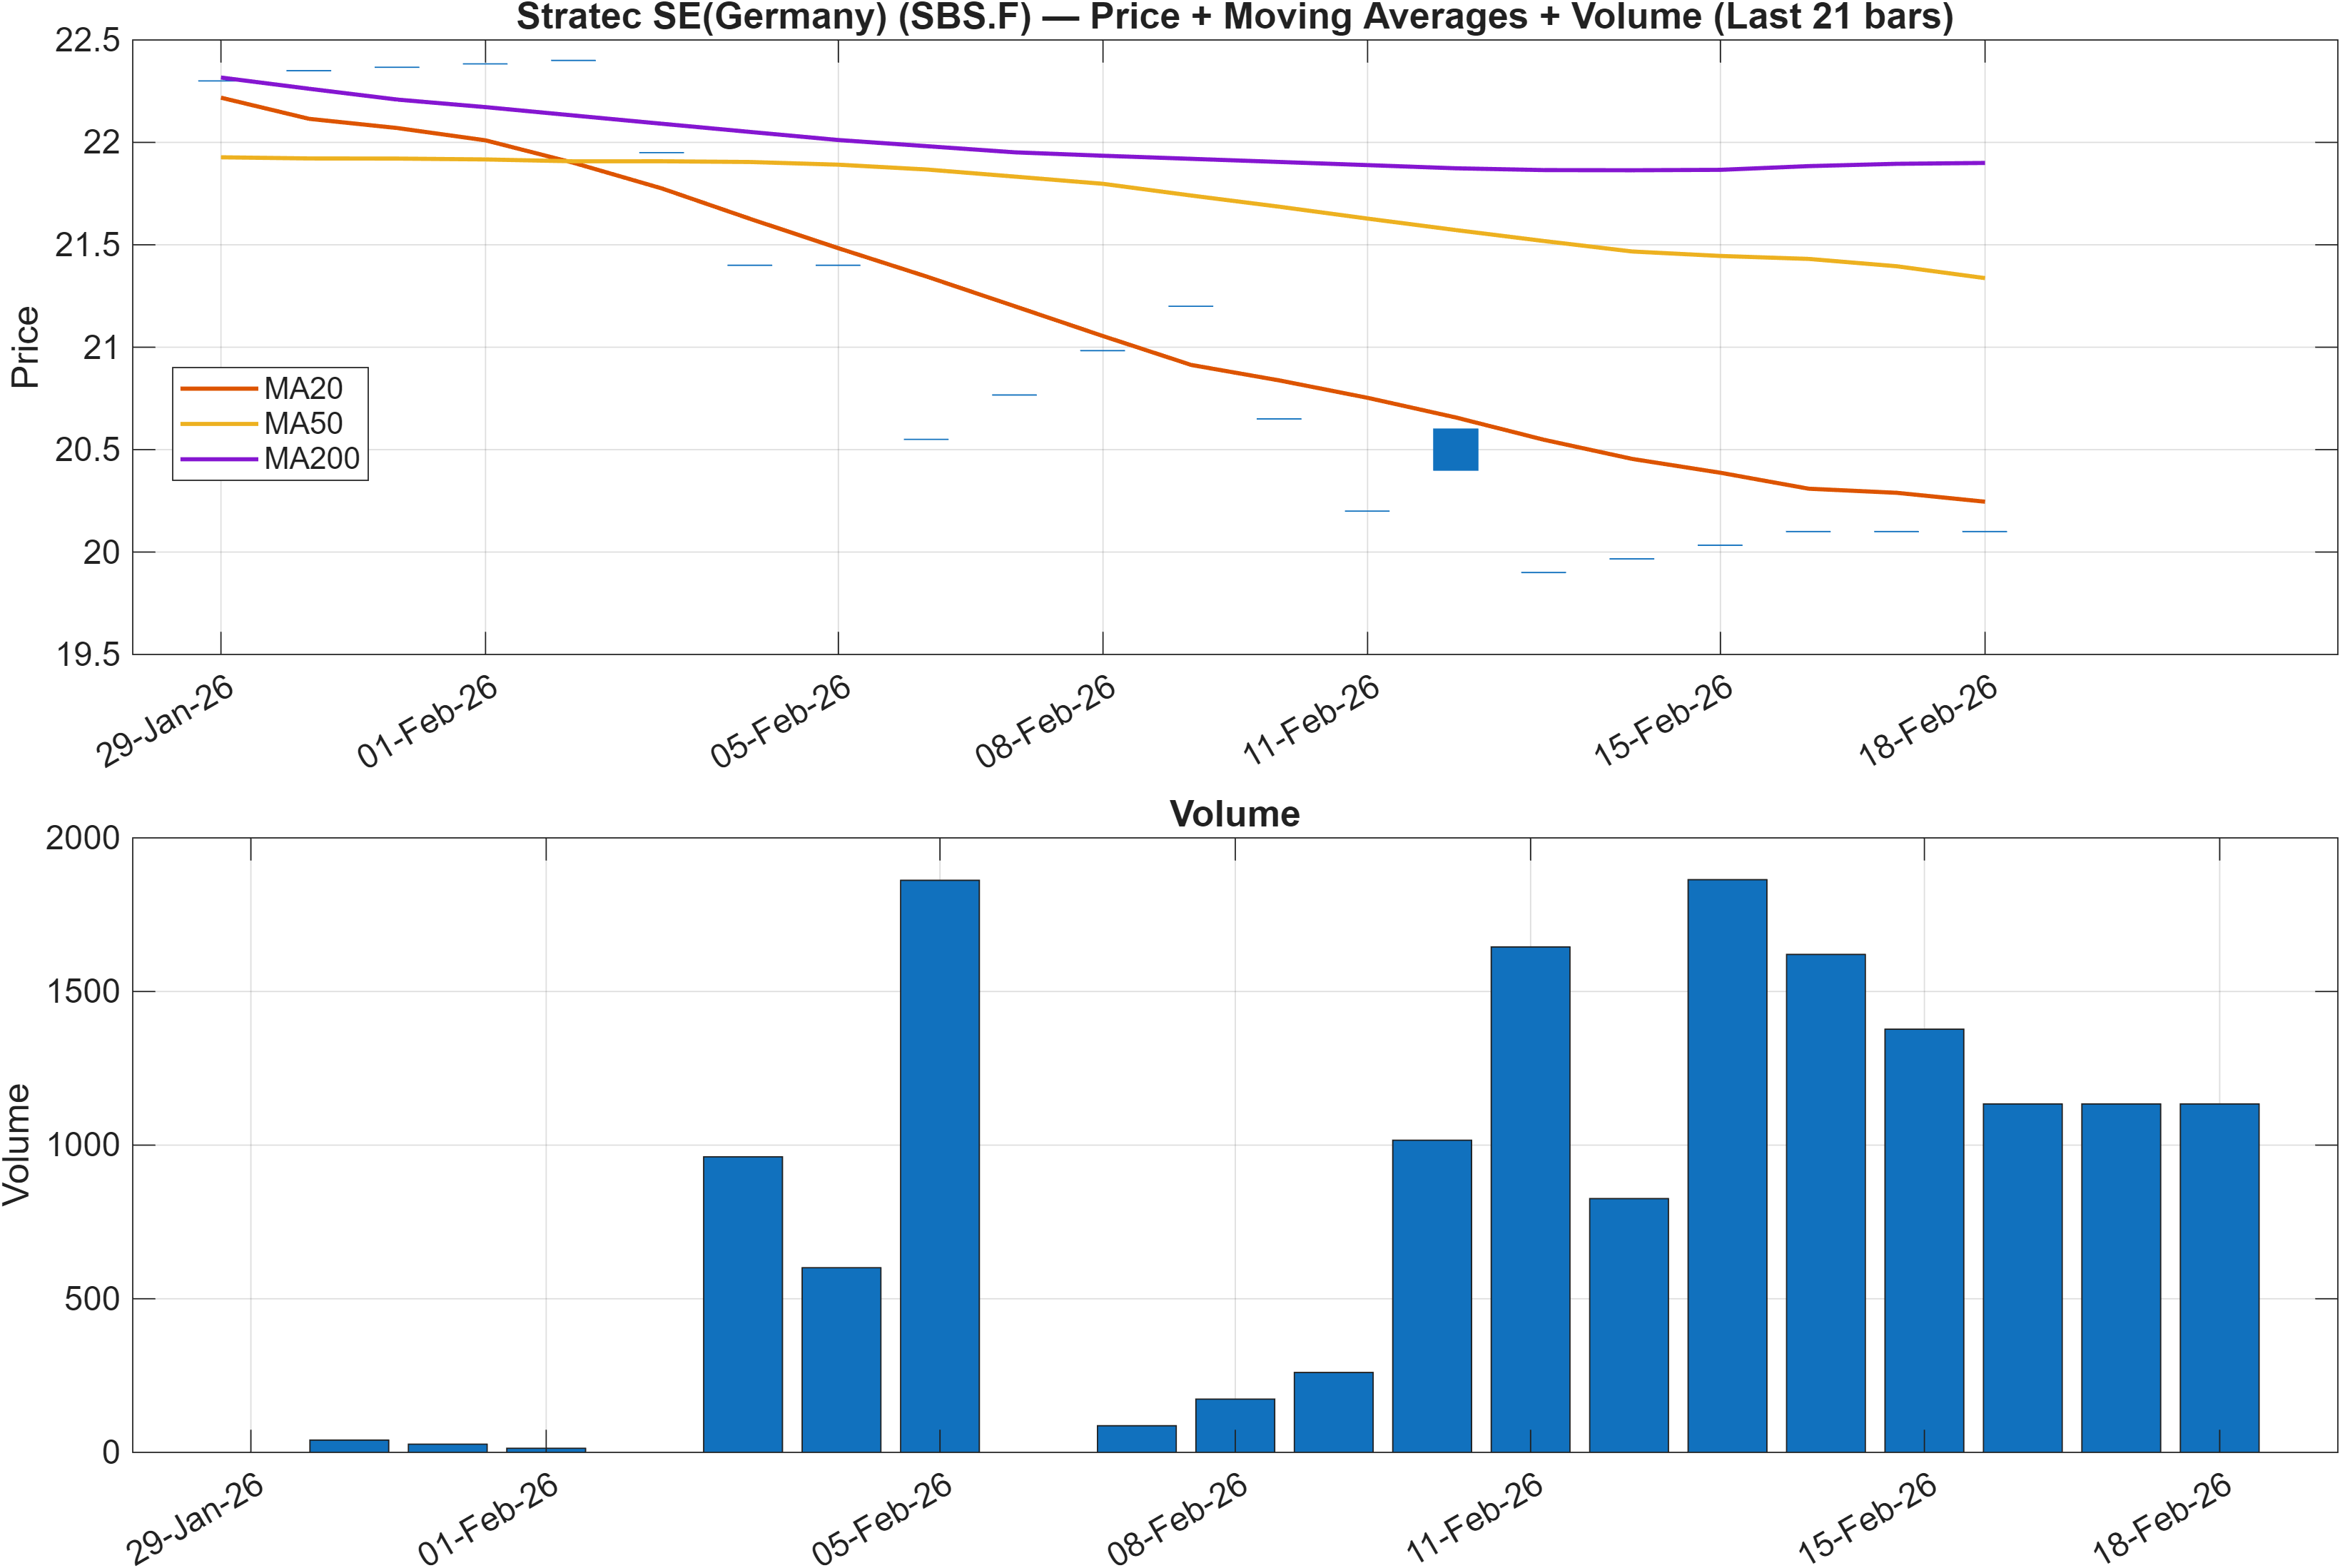
Interpretation: Close vs MA50 = Bearish, MA50 vs MA200 = Bearish.
The trend stack is uniformly weak in the provided read: price relative to the MA50 is bearish, and the MA50 relative to the MA200 is also bearish. That is the classic structure of a downtrend where medium-term direction (MA50) remains below the longer-term baseline (MA200), and spot price is not demonstrating sustained reclaim of the intermediate average. In practice, this often leads to rallies that struggle to persist unless momentum improves and breadth of signals turns.
This trend posture aligns with the rank distribution: the daily rank at #1376 is consistent with a market that has been marking down the instrument relative to peers, while the yearly rank at #1181 suggests the weakness is not limited to a single week. Where the picture becomes more nuanced is the mid-term ranks—weekly #764 and 3-month #495—which are not as extreme. That contrast can occur when a downtrend is mature enough to produce periodic mean-reversion bounces, even if the underlying moving-average structure remains bearish.
For technicians focused on trend confirmation, the MA50/MA200 bearish relationship tends to act as a filter: it does not prevent countertrend rallies, but it raises the bar for interpreting them as durable. In this context, the nearby resistance level at 23.2583 (see Section 4) becomes more than a simple horizontal marker; it also functions as a checkpoint for whether price can reclaim important zones that often coincide with moving-average congestion. Until the evidence shifts, the trend read remains consistent with a bearish regime with intermittent stabilization attempts.
3) Momentum & volatility dashboard
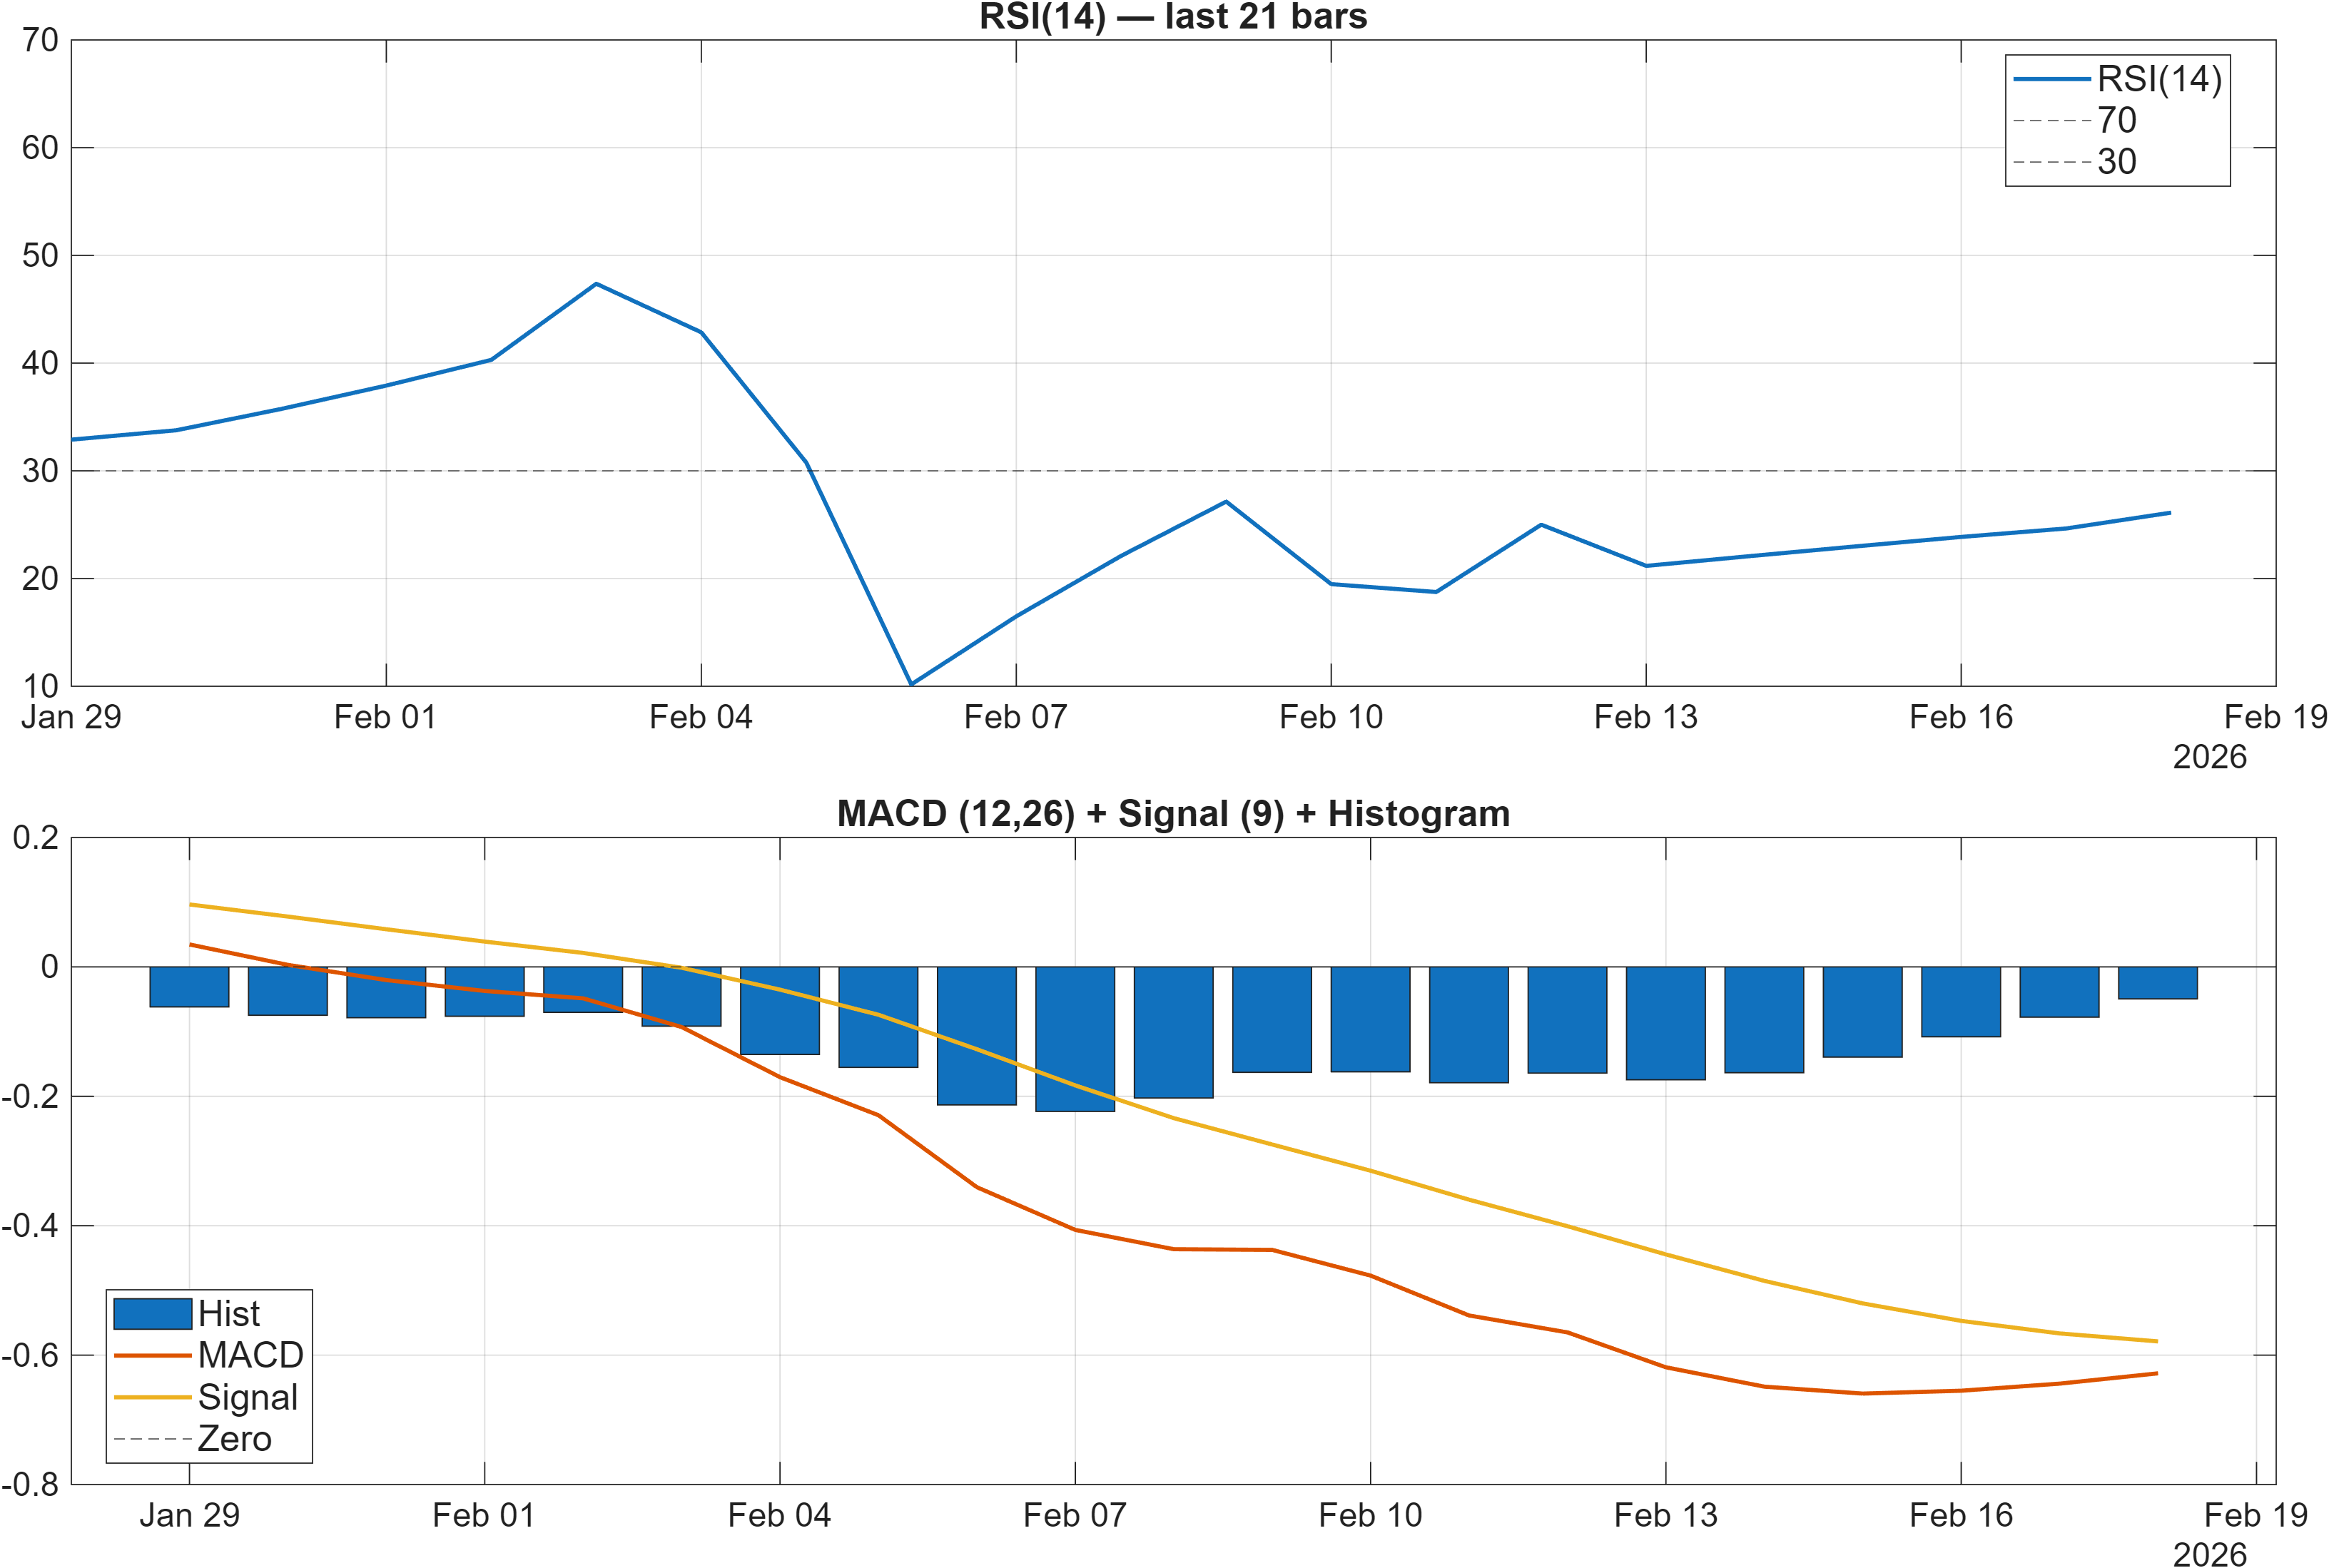
Interpretation: RSI bias = Bearish, MACD hist = -0.0493.
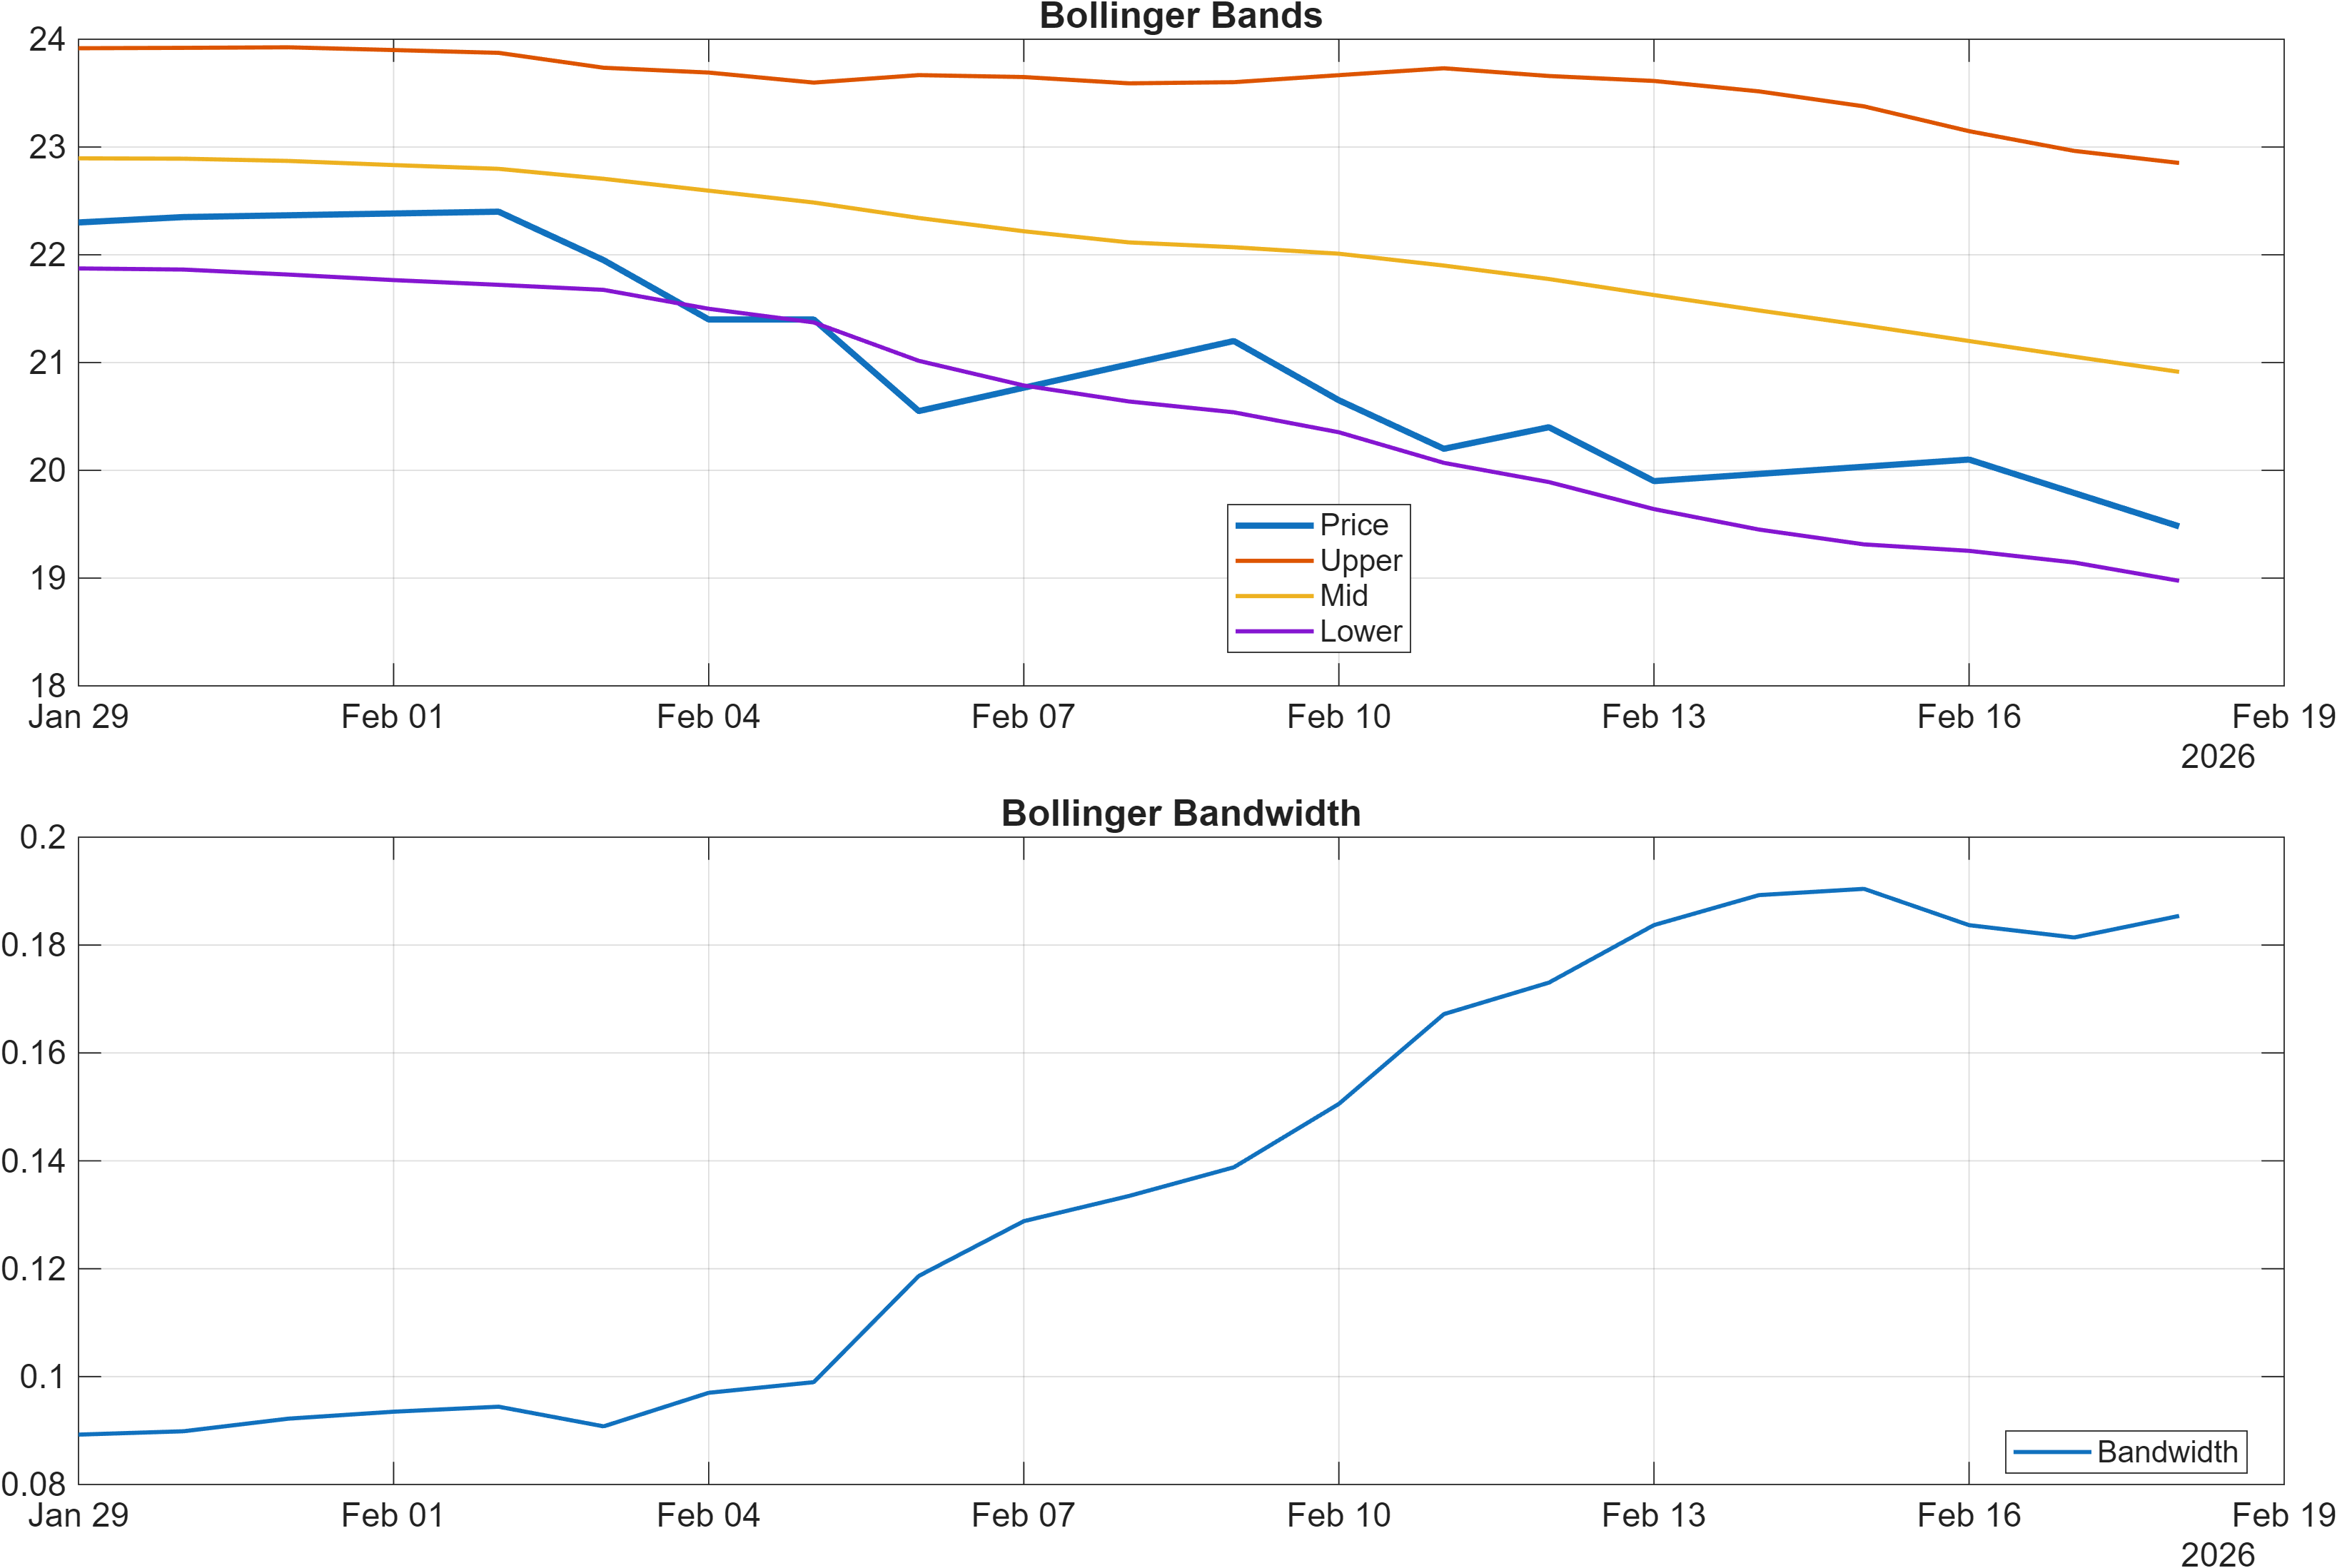
Interpretation: Bandwidth (volatility regime) latest = 0.1854.
Momentum is tilted to the downside in the current snapshot. The MACD histogram at -0.0493 indicates negative momentum pressure remains in place, and the RSI(14) at 26.12 is consistent with a market that has recently experienced heavy selling. While low RSI readings can coincide with oversold conditions, the signal here is explicitly labeled bearish, which keeps the focus on persistence of trend rather than assuming an immediate reversal.
Additional momentum diagnostics from the 18-signal set reinforce that bias: ROC(20) at -12.84 and TS Mom(20) at -2.25 both point to weak rate-of-change and negative trend momentum, while TS Accel at -1.817 suggests the move has not cleanly decelerated. At the same time, there are pockets of counter-signals worth respecting. Stoch %K at 15.38 registers as bullish, which can occur when price is stretched and short-term reflex moves become more likely. Similarly, OBV slope(10) at 693 is bullish, contrasting with PVT slope(10) at -83.23 and a bearish Will A/D slope(10) at -0.8833. This divergence implies volume-based participation is not delivering a single, clean narrative.
Volatility, measured through BB Width at 0.1854, sits in a regime that is active but not necessarily extreme. When bandwidth is not collapsing, trends can continue; when it expands sharply, it often coincides with stronger directional moves. Here, the data reads as a market where directional momentum is bearish but the internal components are mixed enough to keep reversal risk non-trivial—particularly around the defined support/resistance bands.
4) Support / Resistance zones
Support ~ 20.1500 | Resistance ~ 23.2583
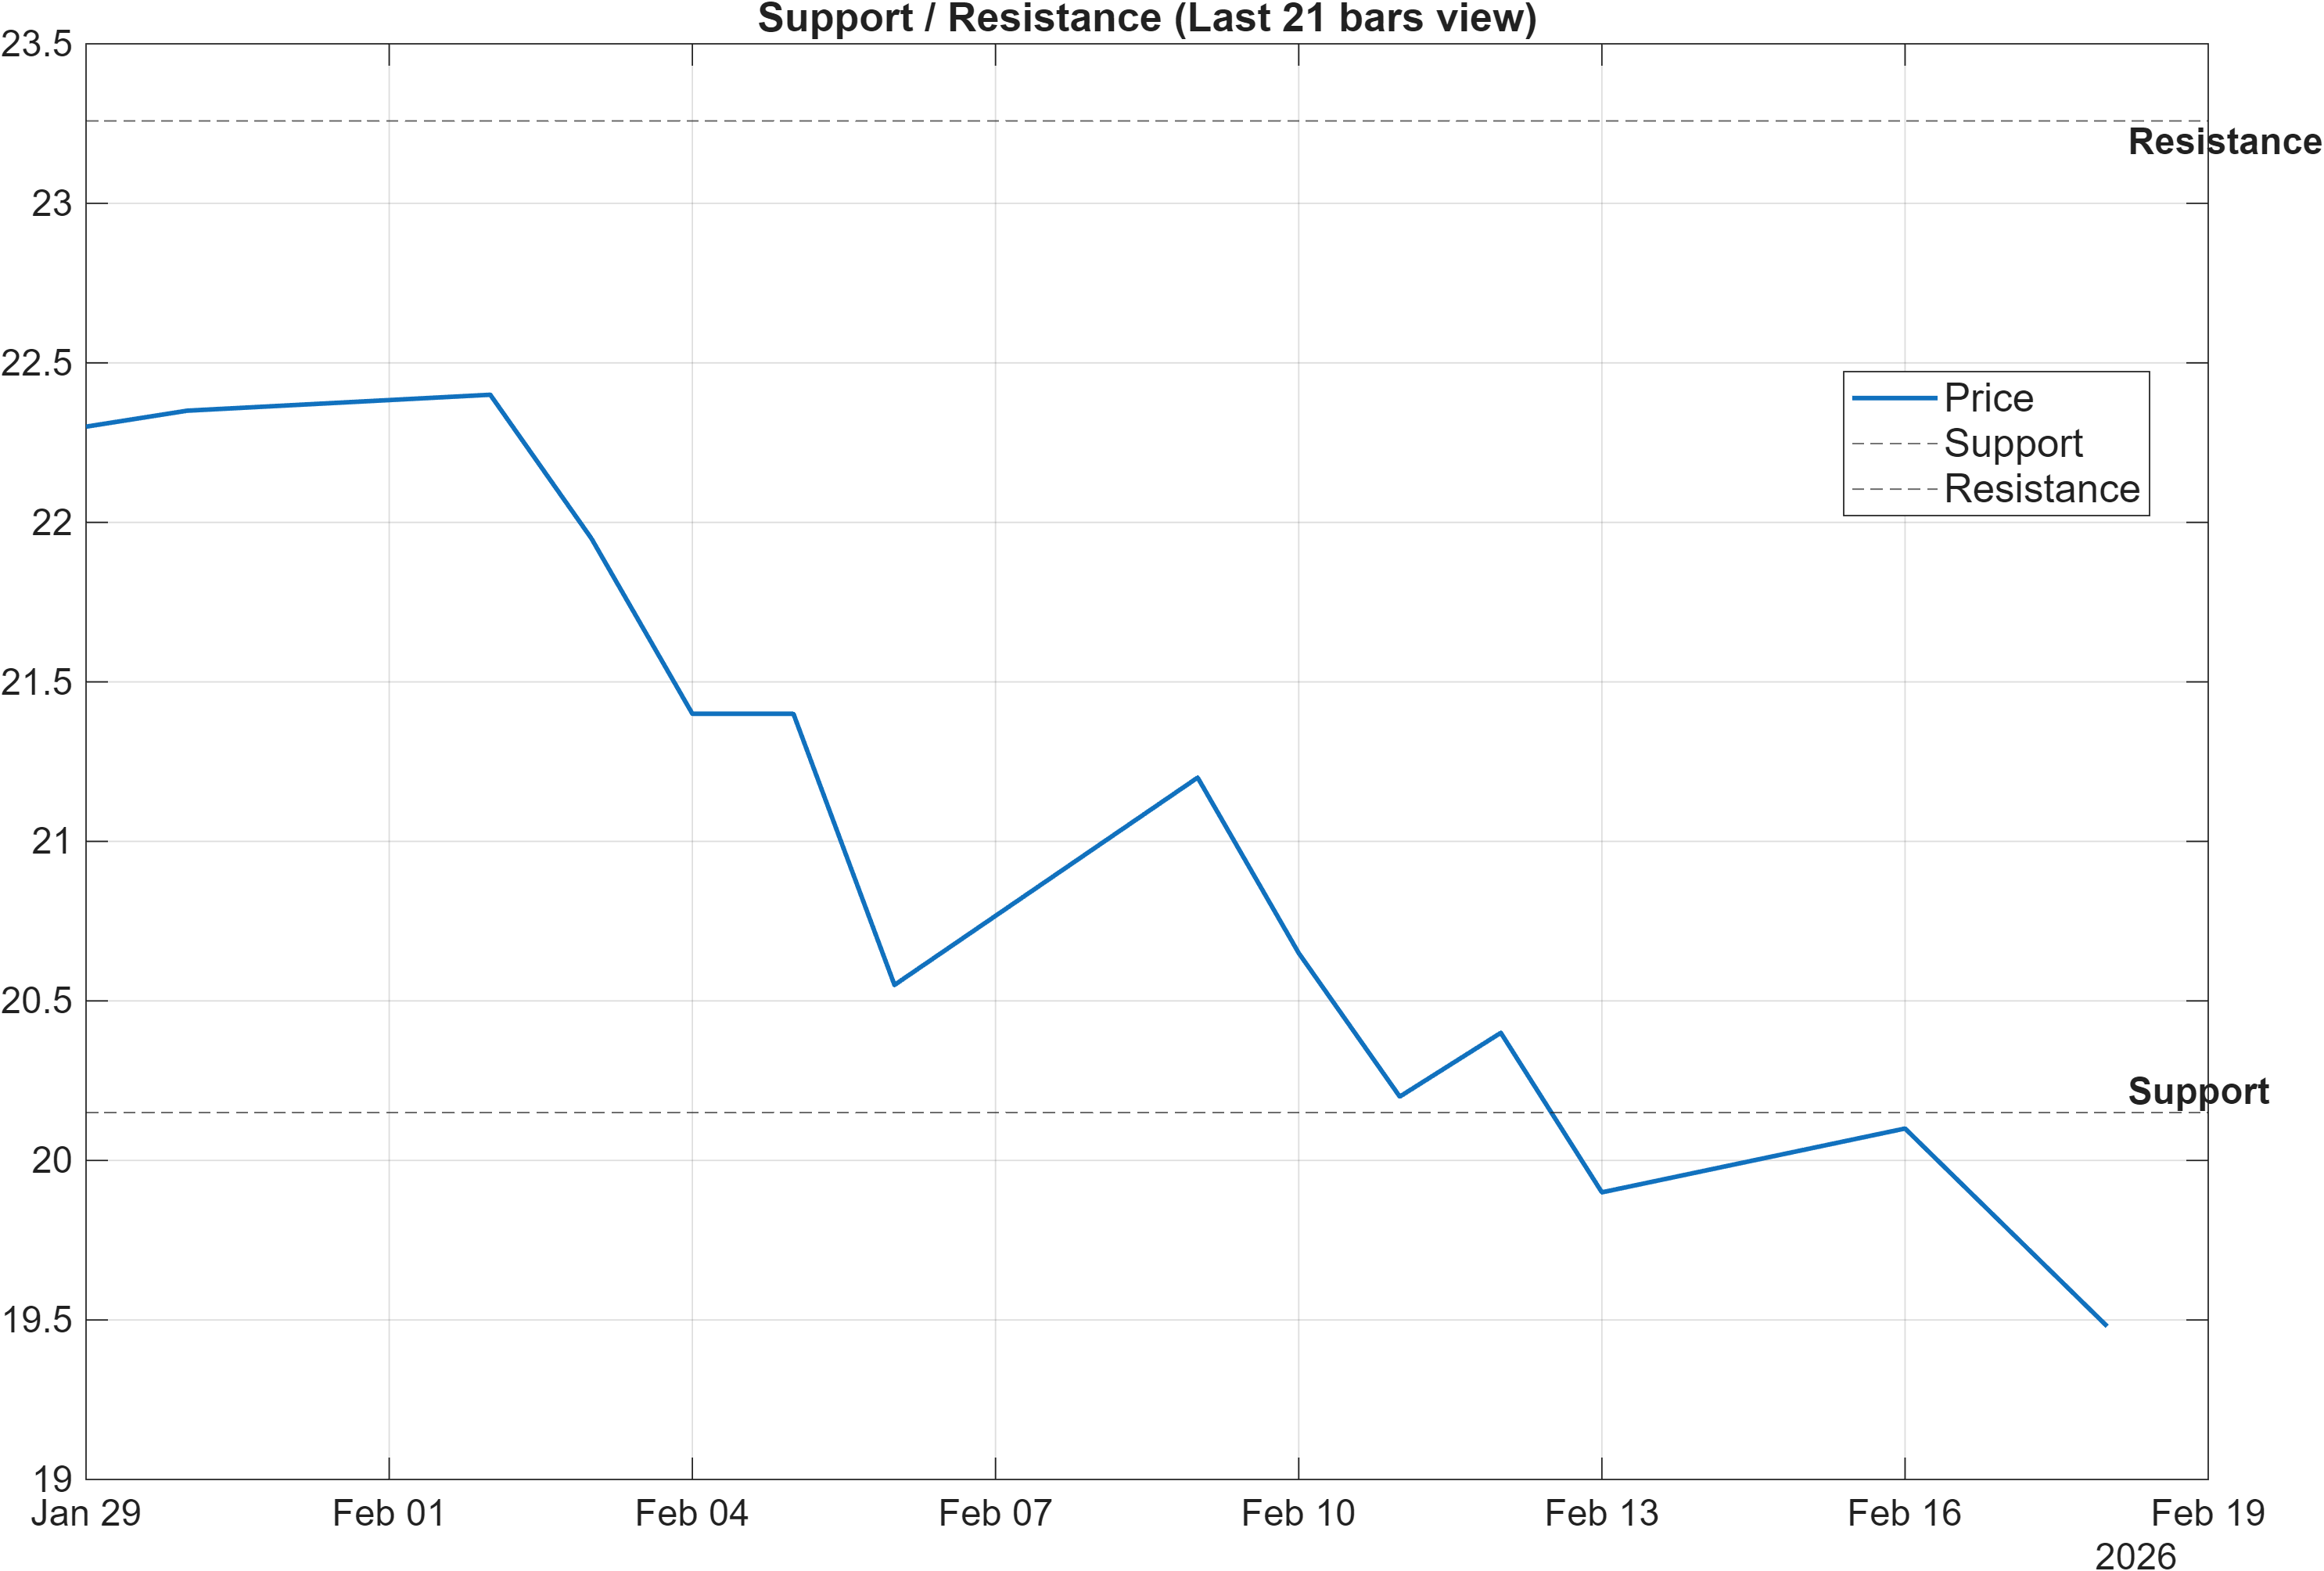
Scenario view: Break above resistance with volume → continuation. Close below support → signal deterioration risk.
The current technical map is anchored by support near 20.1500 and resistance near 23.2583, creating a clearly defined trading corridor where confirmation matters more than interpretation. With trend filters bearish (Close vs MA50 bearish; MA50 vs MA200 bearish), the support level functions as the immediate “line of defense” for preventing the existing weakness—reflected in the daily rank of #1376—from worsening further.
From a signal-design standpoint, the support line also intersects with broader momentum conditions. RSI(14) at 26.12 and ROC(20) at -12.84 point to a stretched downside context; this can create sharper bounces, but those bounces still need to prove themselves by reclaiming decision zones. That is where resistance at 23.2583 becomes critical: a break above resistance with volume is explicitly defined as a continuation trigger, and—within a bearish moving-average structure—such a break is typically watched for evidence that sellers are losing control.
Conversely, a close below 20.1500 is framed as deterioration risk. That condition would be consistent with the bearish blended technical score (-0.378) and a negative MACD histogram (-0.0493), because it would represent momentum translating into a structural breakdown rather than remaining contained within a range. Given BB Width at 0.1854, volatility is sufficient for these levels to be tested; the question is whether price action confirms stabilization (holding support and attempting rotation toward resistance) or confirms regime continuation (violating support and sustaining weakness).
Within this framework, the levels should be treated as decision zones where the probability mix shifts—not as deterministic boundaries.
5) Quant Technical Dashboard (18 Signals)
KGNAI AI Technical Analysis Score (Deep Reinforcement Learning): Rank #1057 out of 1426 (Rank 1 represents the strongest technical positioning and a higher probability of favorable price behavior. As ranks increase toward the maximum, the probability of favorable outcomes weakens and bearish positioning becomes more dominant.) | Label: Neutral | Score: -0.482
18-Signal Technical Confluence Score: -0.333 (Bearish)
Overall Technical Score (18-signal confluence + DRL rank blend): -0.378 (Bearish)
Note: The blended score reflects signal strength weighted against broader AI technical ranking, which may temporarily diverge.
Blended technical score breakdown: -0.378 (Bearish | Bull 3 / Bear 9 / Neutral 6)
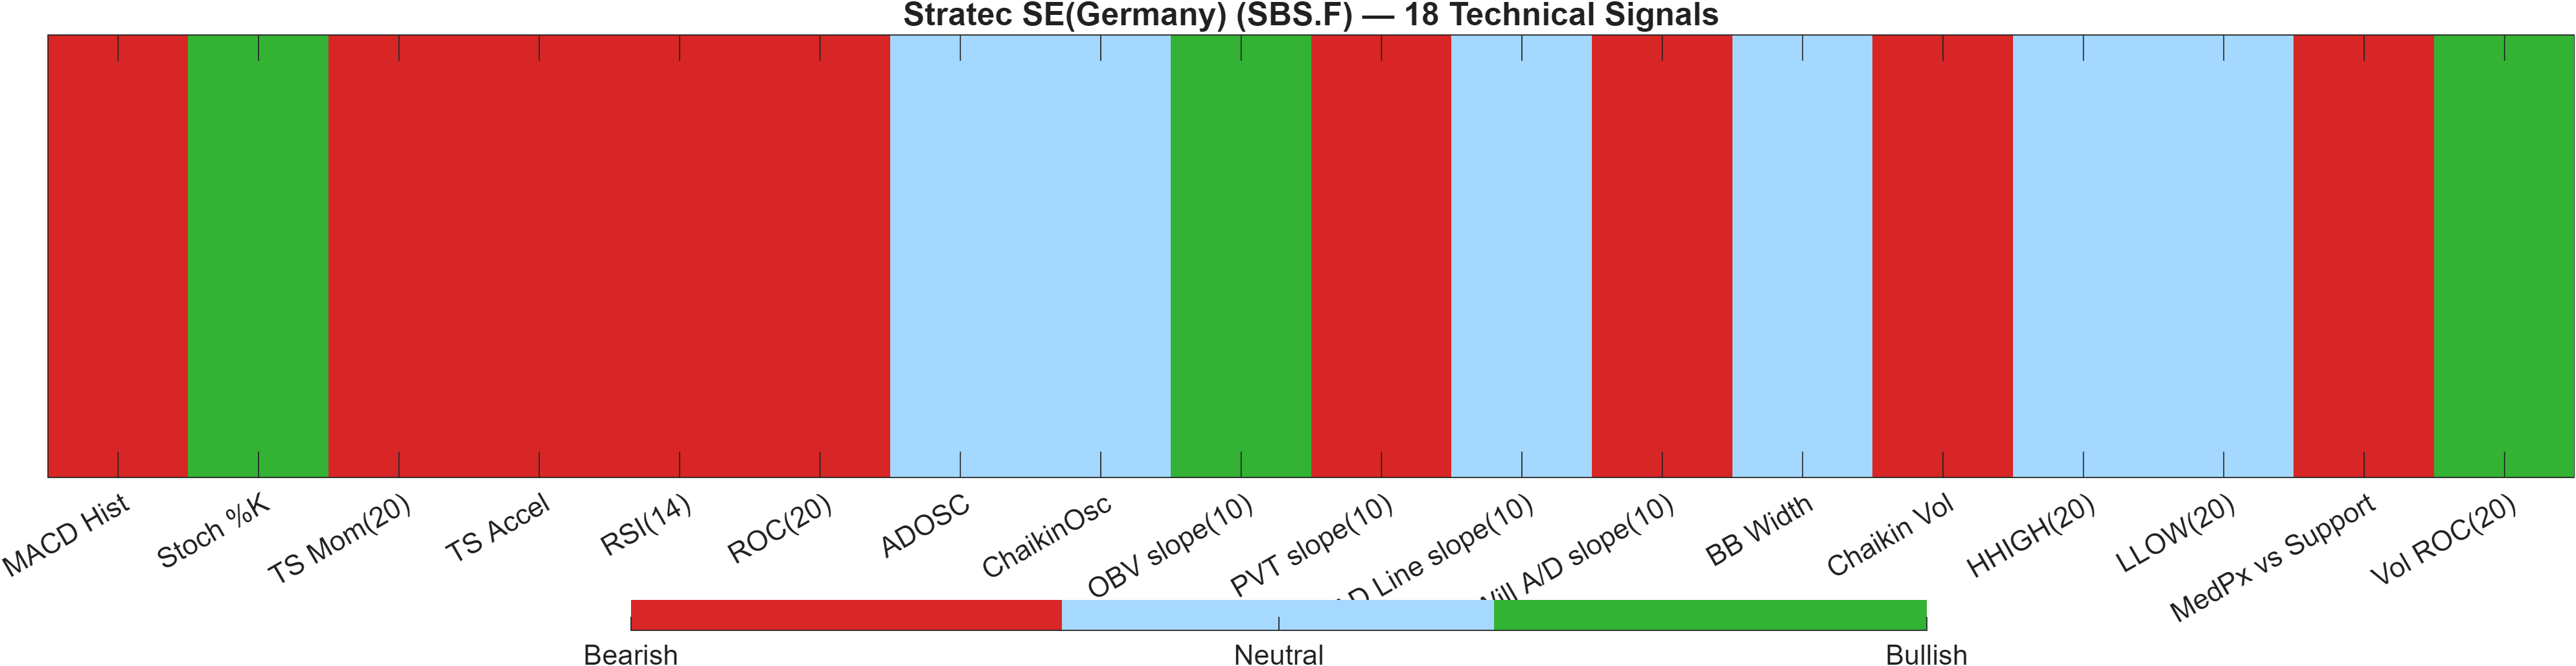
Signal alignment: where the bearish blend is coming from
The dashboard produces a bearish aggregate even though the Deep Reinforcement Learning (DRL) component is labeled neutral. Specifically, the DRL technical rank is #1057 out of 1426 with a score of -0.482 (Neutral label), while the classic multi-indicator layer comes in at -0.333 (Bearish), yielding an Overall Technical Score of -0.378 (Bearish). This split is analytically useful: it suggests that while the broader pattern-learning model is not signaling maximum stress, the indicator confluence is still tilted to downside persistence.
The breakdown (Bull 3 / Bear 9 / Neutral 6) emphasizes that bearish pressure is not coming from a single metric. In the signal table, momentum and trend measures dominate the negative side: RSI(14) at 26.12, MACD Hist at -0.04934, and ROC(20) at -12.84 all register bearish. Short-horizon mean-reversion pressure is present—Stoch %K at 15.38 is bullish—but it is outweighed by the broader momentum stack, including TS Mom(20) at -2.25 and TS Accel at -1.817.
Volume and accumulation signals are mixed rather than uniformly supportive. OBV slope(10) at 693 is bullish, yet PVT slope(10) at -83.23 and a bearish Will A/D slope(10) at -0.8833 point to weaker confirmation. Volatility context remains relatively steady with BB Width at 0.1854 (Neutral), which can allow a bearish trend to persist without requiring extreme volatility expansion.
Signal table (Bull/Bear/Neutral)
| Indicator | Value | Signal |
|---|---|---|
| MACD Hist | -0.04934 | Bearish |
| Stoch %K | 15.38 | Bullish |
| TS Mom(20) | -2.25 | Bearish |
| TS Accel | -1.817 | Bearish |
| RSI(14) | 26.12 | Bearish |
| ROC(20) | -12.84 | Bearish |
| ADOSC | — | Neutral |
| ChaikinOsc | — | Neutral |
| OBV slope(10) | 693 | Bullish |
| PVT slope(10) | -83.23 | Bearish |
| AD Line slope(10) | — | Neutral |
| Will A/D slope(10) | -0.8833 | Bearish |
| BB Width | 0.1854 | Neutral |
| Chaikin Vol | 63.86 | Bearish |
| HHIGH(20) | 22.4 | Neutral |
| LLOW(20) | 19.9 | Neutral |
| MedPx vs Support | -0.05 | Bearish |
| Vol ROC(20) | 2735 | Bullish |
Interpretation: Indicator-level signals form the base confluence, which is then adjusted using a separate AI-driven technical ranking model. The final technical score summarizes this combined view.
6) News sentiment + extractive gist
Sentiment score (avg): -0.063 | Positive: 0% | Neutral: 70% | Negative: 30%
KGNAI AI News Sentiment Score (normalized -1 to +1): Not available (as of —) | Label: Not available | Overall news score: -0.06
Positive Developments
Recent coverage across major financial outlets contains a limited constructive thread that focuses on narrative reframing rather than outright momentum improvement. The most supportive angle in the provided items is the idea that shifts in analyst framing and price-target discussion can change how the market contextualizes the stock, even when absolute target figures are not presented. That constructive tone is best interpreted as “positioning and expectations management” rather than evidence of a confirmed inflection. In the current setup—where the technical blend is bearish (Overall Technical Score -0.378) and the short-term rank is weak (#1376)—positive commentary is likely to matter most if it coincides with observable stabilization around 20.1500 or a credible reclaim of 23.2583. Standing alone, the positive stream in the dataset appears modest, which is consistent with the sentiment mix showing 0% positive coverage.
Neutral / Mixed Developments
The dominant news posture is neutral: 70% of items fall into the neutral bucket, and the average sentiment is slightly negative at -0.063 rather than decisively bearish. The neutral set is primarily informational and interpretive—describing changes in the way the story is discussed, and weighing mixed assessments without a single clear catalyst. This type of flow often coincides with range-bound behavior or “wait-and-see” positioning, particularly when technicals show oversold-adjacent readings like RSI(14) at 26.12 but trend filters remain bearish. In practical terms, the neutral skew suggests sentiment is not currently acting as a strong counterweight to the technical picture; instead, it provides a backdrop where price is likely to remain the primary arbiter.
Negative / Risk Signals
The negative portion of coverage (30%) clusters around risk framing: references to target reductions, unfavorable long-horizon shareholder outcomes, and earnings-related disappointment themes. Without introducing new fundamentals beyond the provided text, the key takeaway is that the negative stream aligns with the longer-term rank tilt (6-month #1287; yearly #1181) and with bearish momentum signals such as MACD hist -0.0493 and ROC(20) -12.84. When negative coverage increases during already weak technical regimes, it can reinforce trend persistence—particularly if price fails to hold 20.1500. The news data does not show outright panic (neutral remains dominant), but it does add friction to any attempted rebound unless price action confirms strength above resistance.
What to monitor next
- Whether price holds 20.1500 on a closing basis versus triggering the stated deterioration risk
- Whether any rebound can clear 23.2583 with volume as the defined continuation/stabilization trigger
- Whether sentiment remains neutral-dominant (70%) or shifts toward a higher negative share (30%) alongside momentum signals
Sources referenced: Reuters, Bloomberg, Yahoo Finance, MarketWatch, Investing.com
7) Sources
- Not available in the provided data.
You may also like: How KGNAI AI ranks instruments across global markets
Disclaimer: KGNAI provides AI-generated analytics and educational market commentary only. This is not financial advice. Markets involve risk. Always do your own research.