
REL.LSE (RELX PLC) — 12-Apr-2026 Neutral-Biased Technical Stance with Key Level Dependence
RELX PLC (REL.LSE) enters 12-Apr-2026 with a deliberately balanced setup: cross-horizon ranks lean constructive in select windows, while trend structure and portions of volume flow argue for caution. The daily rank (#92 out of 1420) and the 3-month rank (#24) sit in the upper tier of the tracked universe, yet the weekly rank (#810) points to weaker near-term persistence. On price structure, the interpretation flags Close vs MA50 = Bearish and MA50 vs MA200 = Bearish, suggesting the market is still working through a post-trend reset rather than a clean trend continuation. Momentum is mixed: RSI(14) reads 55.69 (bullish tilt), but MACD histogram remains negative (-2.3495). Volatility is moderate with Bollinger bandwidth at 0.0751, leaving room for expansion should price approach the defined decision zones: support ~2177.0000 and resistance ~2649.0000. News data is neutral by distribution (100% neutral) while the normalized sentiment model prints a bullish label.
- Rank stance (Short / Mid / Long): Neutral / Neutral / Neutral (daily strength is not confirmed by weekly and monthly positioning).
- Technical confluence label: Neutral (18-signal score 0.056; blended overall -0.255).
- Key levels: Support ~ 2177.0000 | Resistance ~ 2649.0000.
- News sentiment bias: Neutral distribution (avg 0.000; 100% neutral), with a separate normalized model at Bullish (1.00).
- Confirmation / invalidation condition: Strength tends to confirm on a break above 2649.0000 with volume; deterioration risk rises on a close below 2177.0000.
KGNAI evaluates assets using large cross-sectional datasets built from millions of structured data points. Inputs incorporate fundamental metrics, technical structures, and systematically processed news sentiment. Statistical models, machine learning, and AI frameworks are used to assess relative positioning, signal alignment, and probabilistic behavior across broad universes.
- Ranks are comparative across the tracked universe, not absolute price targets.
- Confluence reflects alignment among independent signal groups.
- Support/resistance levels are probabilistic decision zones, not guarantees.
- Sentiment provides contextual bias within the broader analytical framework.
1) KGNAI AI Analysis
Region: EUROPE | Total universe size: 1420 ranked instruments
- Daily rank: #92 out of 1420 — Bullish
- Weekly rank: #810 out of 1420 — Neutral
- Monthly rank: #514 out of 1420 — Neutral
- 3-Monthly rank: #24 out of 1420 — Bullish
- 6-Monthly rank: #298 out of 1420 — Neutral
- Yearly rank: #146 out of 1420 — Bullish
Cross-horizon positioning: strength is present, but unevenly distributed
The rank stack for REL.LSE is notable for timeframe disagreement. On one hand, the instrument screens well in the daily window (#92) and especially in the 3-month window (#24), which places it in the upper tier of the 1420-instrument universe and suggests favorable relative behavior has recently been detectable. On the other hand, the weekly rank (#810) sits in the lower portion of the universe, implying that near-term persistence has not been consistently reinforced.
That push-pull matters because KGNAI’s term view is Neutral across short-, mid-, and long-term classifications, effectively treating the current profile as a candidate for confirmation rather than a fully aligned trend state. The yearly rank (#146) supports the idea that longer-horizon behavior remains relatively resilient, but the monthly rank (#514) sits close to the mid-pack, consistent with a market that may be oscillating rather than trending.
In practical portfolio terms, this configuration often behaves like a “regime negotiation” phase: tactical strength can appear (daily/3-month), yet the weekly layer can fade quickly unless price structure and participation confirm. The cleanest interpretation is that the model is seeing opportunity, but not uniform agreement across horizons—an environment where level-based triggers (support/resistance) and secondary technical confirmation become more decisive than rank alone.
2) Price & trend overview
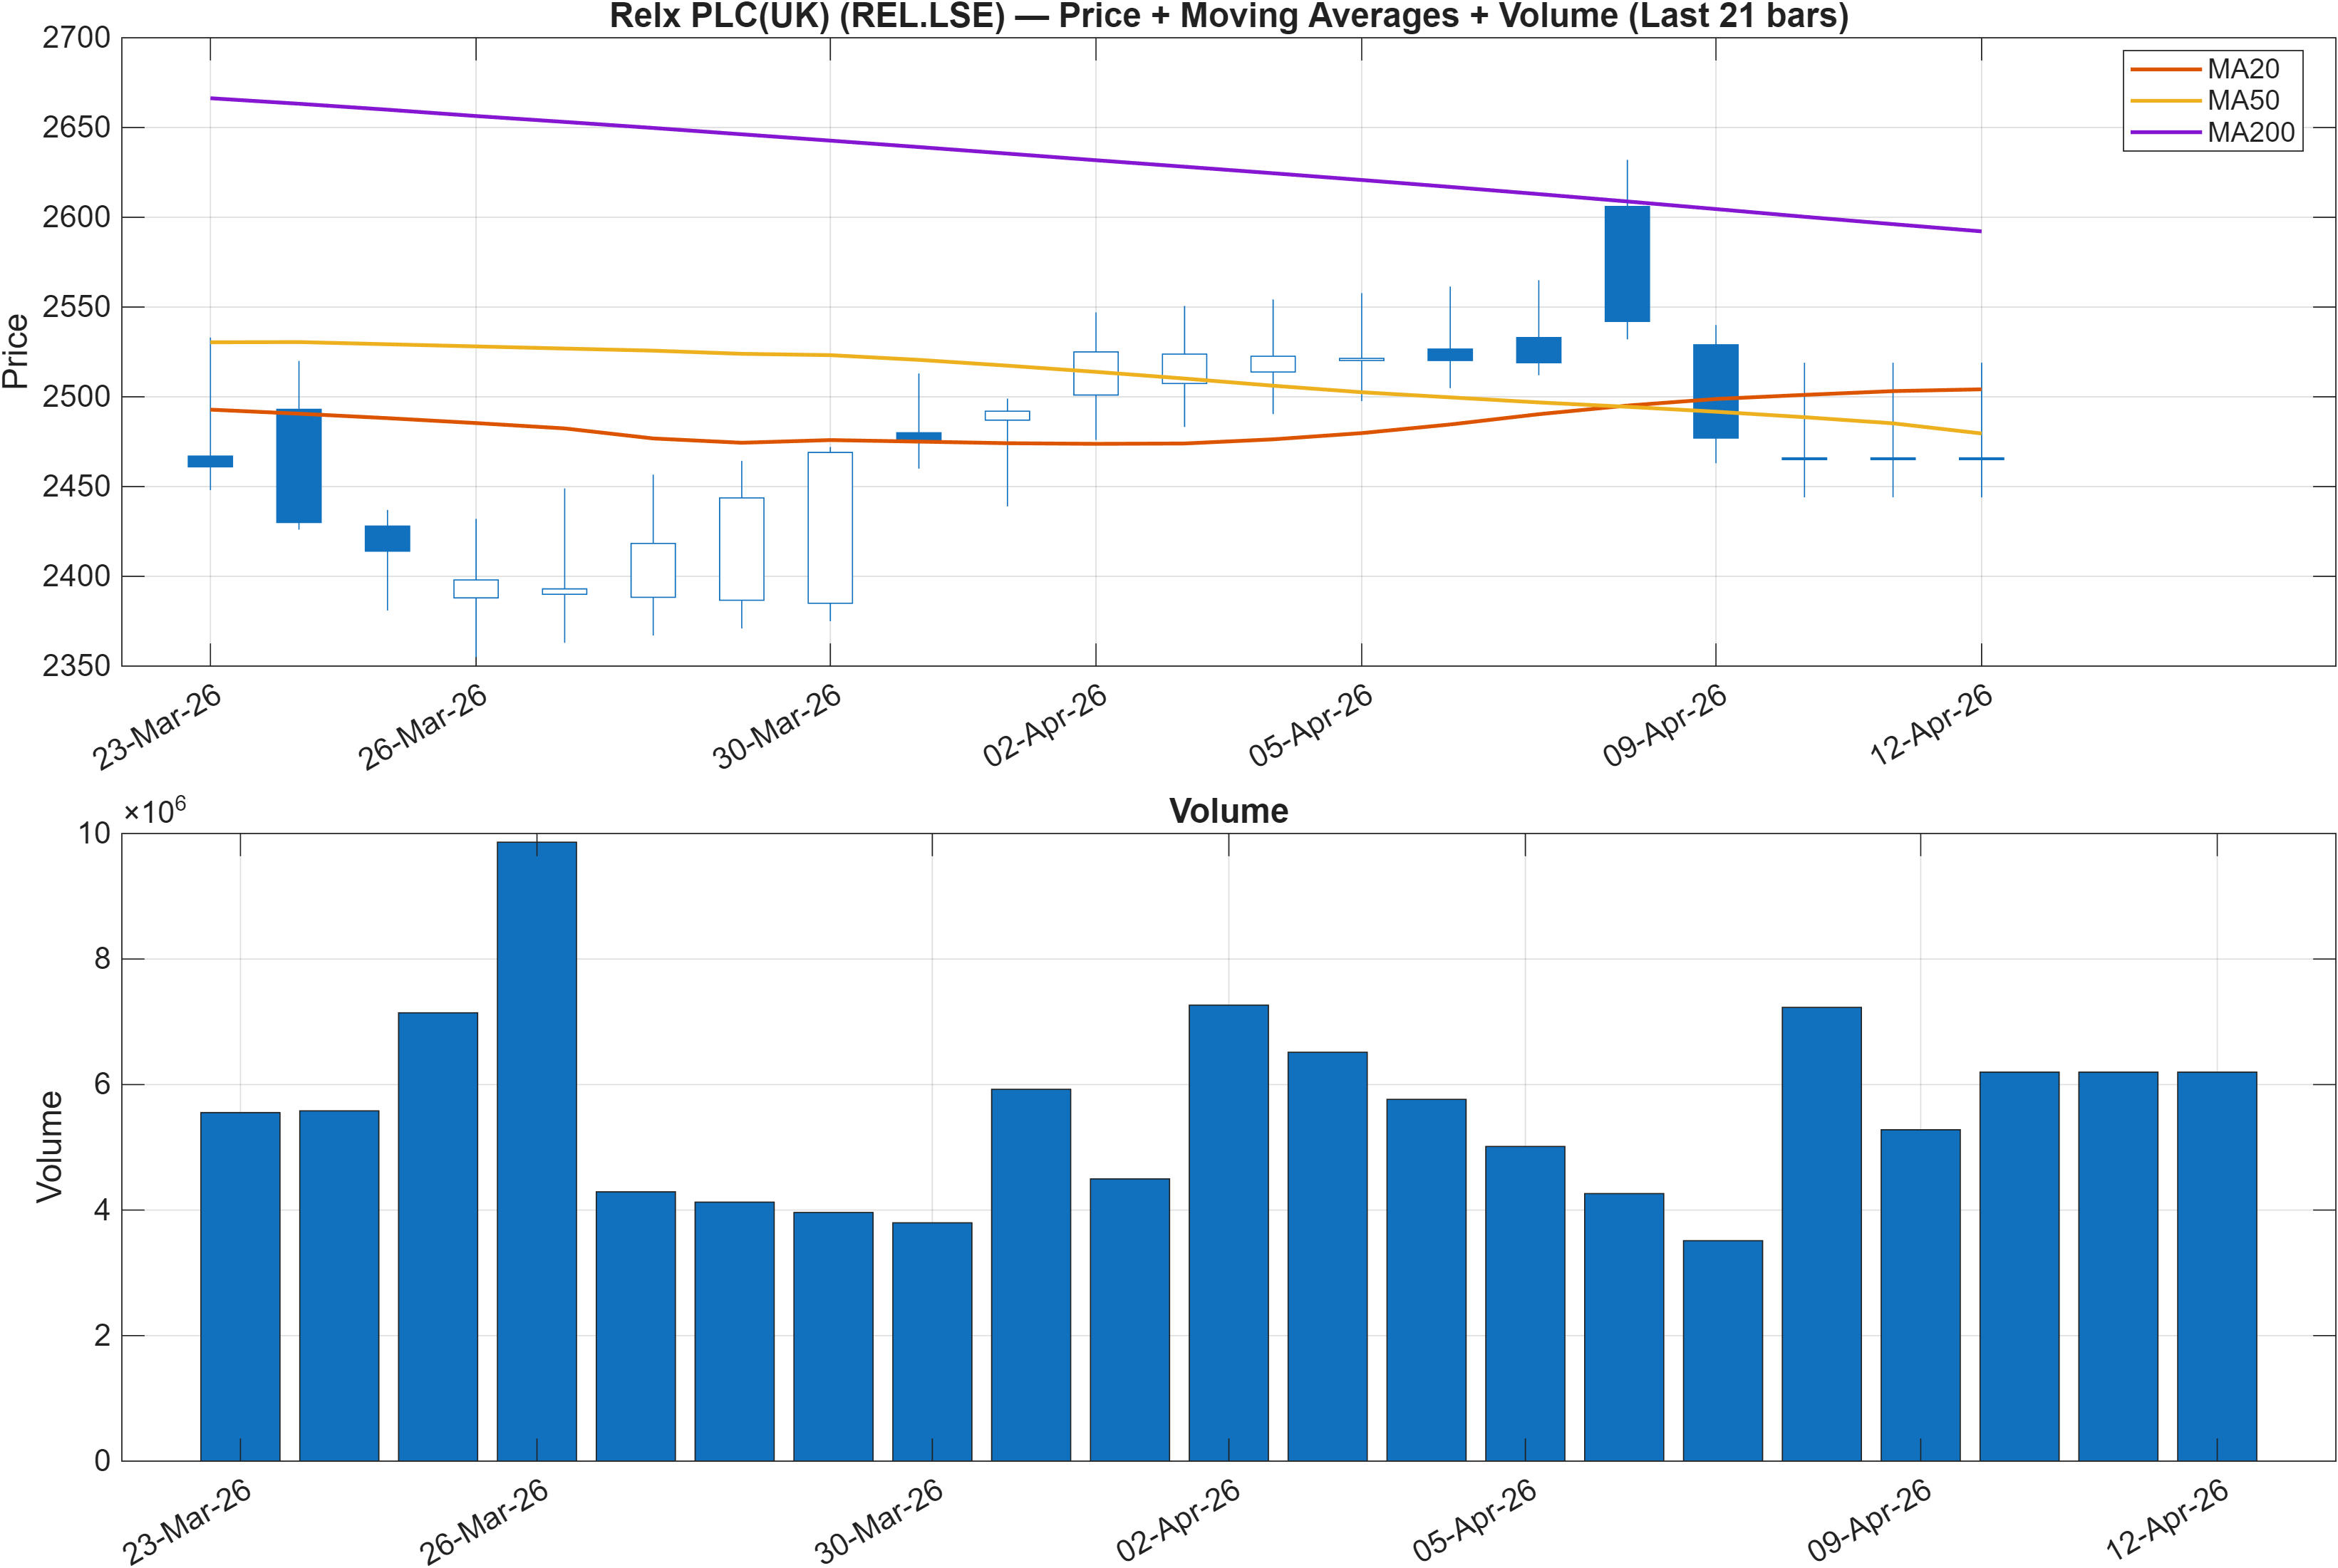
Trend structure remains defensive despite pockets of relative rank strength
The moving-average interpretation is unambiguous: Close vs MA50 = Bearish and MA50 vs MA200 = Bearish. That combination typically characterizes a market still operating below intermediate trend control while the longer trend filter remains downward-sloped or not yet repaired. It does not preclude upside moves, but it tends to reduce the reliability of isolated rallies unless participation confirms and price can reclaim key reference points.
This is where the rank-timeframe split becomes relevant. The daily rank (#92) can coexist with a bearish MA stack when the instrument is experiencing short bursts of strength inside a broader, still-constrained trend regime. The 3-month rank (#24) adds evidence that, over a slightly longer window, behavior has been comparatively constructive—even if the trend filters have not turned. Meanwhile, the weekly rank (#810) cautions that recent gains may not be consistently compounding week-over-week.
The clean read is trend repair vs. trend continuation. If price is repeatedly rejected before it can reclaim the MA50, then the bearish close-vs-MA50 interpretation tends to remain the dominant constraint, and relative-rank strength may express as mean-reversion rather than trending. Conversely, if price can stabilize and transition from below to above the MA50 while preventing renewed weakness that reinforces the MA50–MA200 bearish configuration, then the rank strength has a clearer pathway to expressing as trend persistence rather than transient bounce behavior.
3) Momentum & volatility dashboard
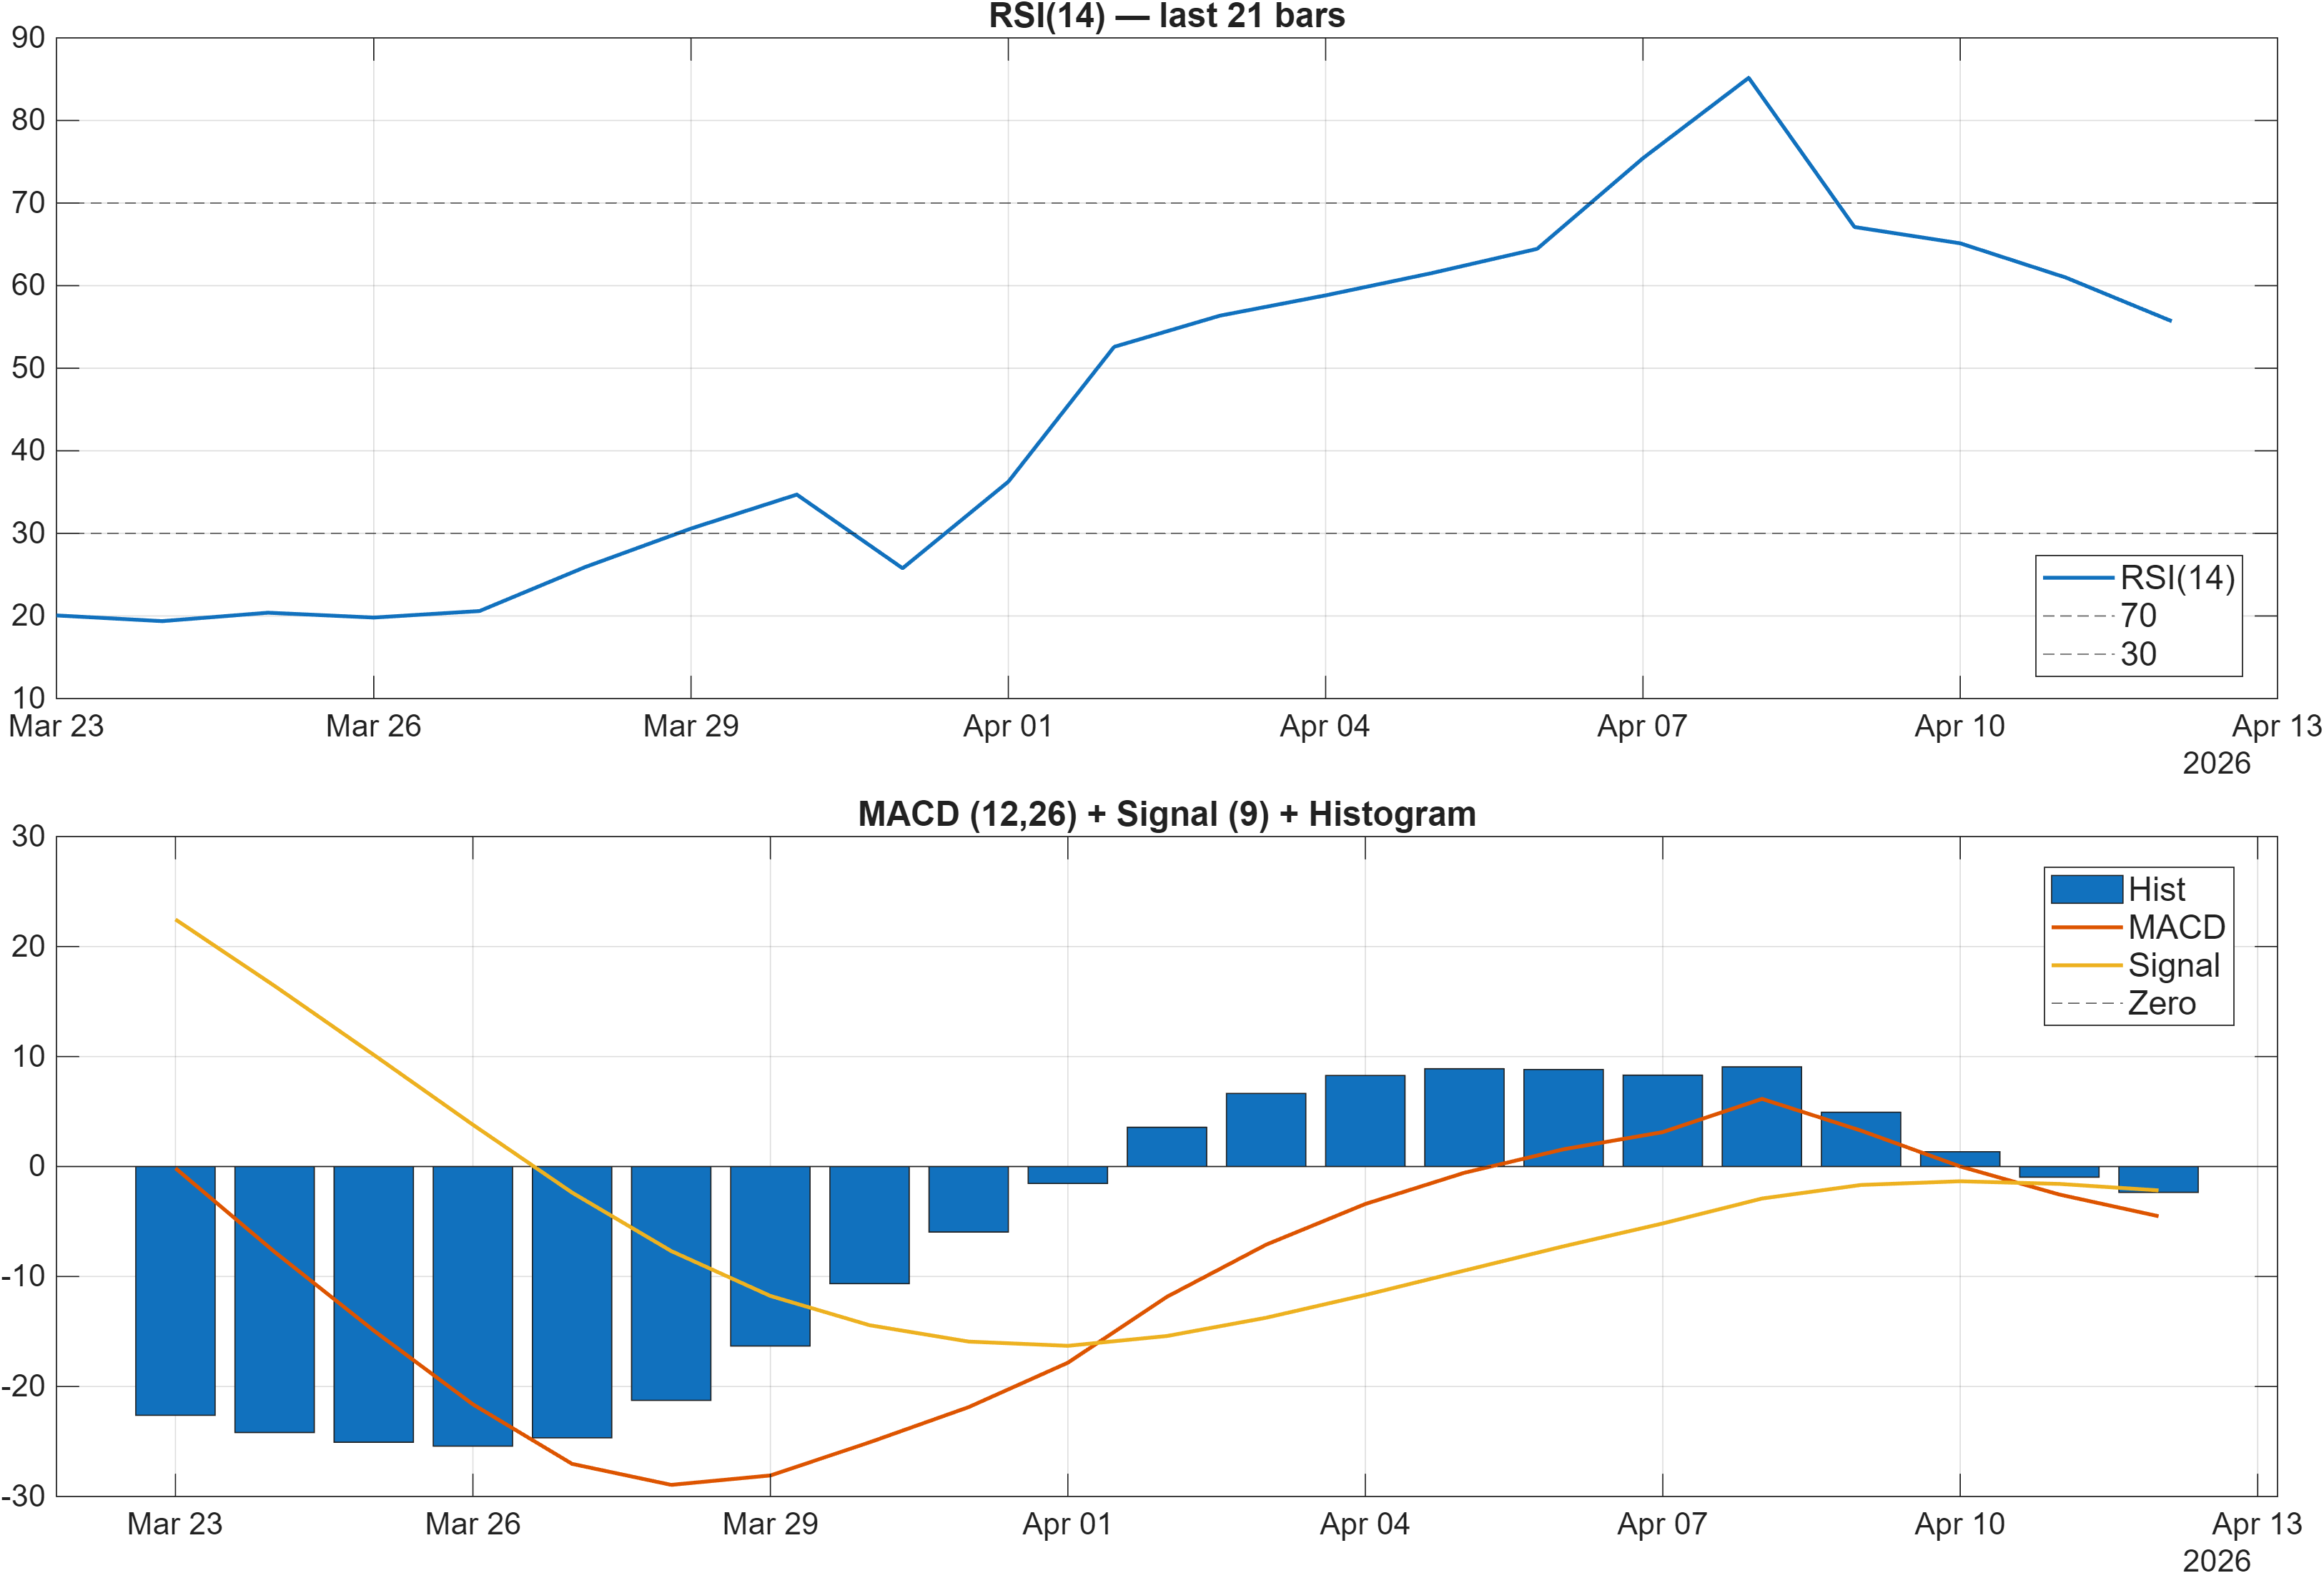
Interpretation: RSI bias = Neutral, MACD hist = -2.3495.
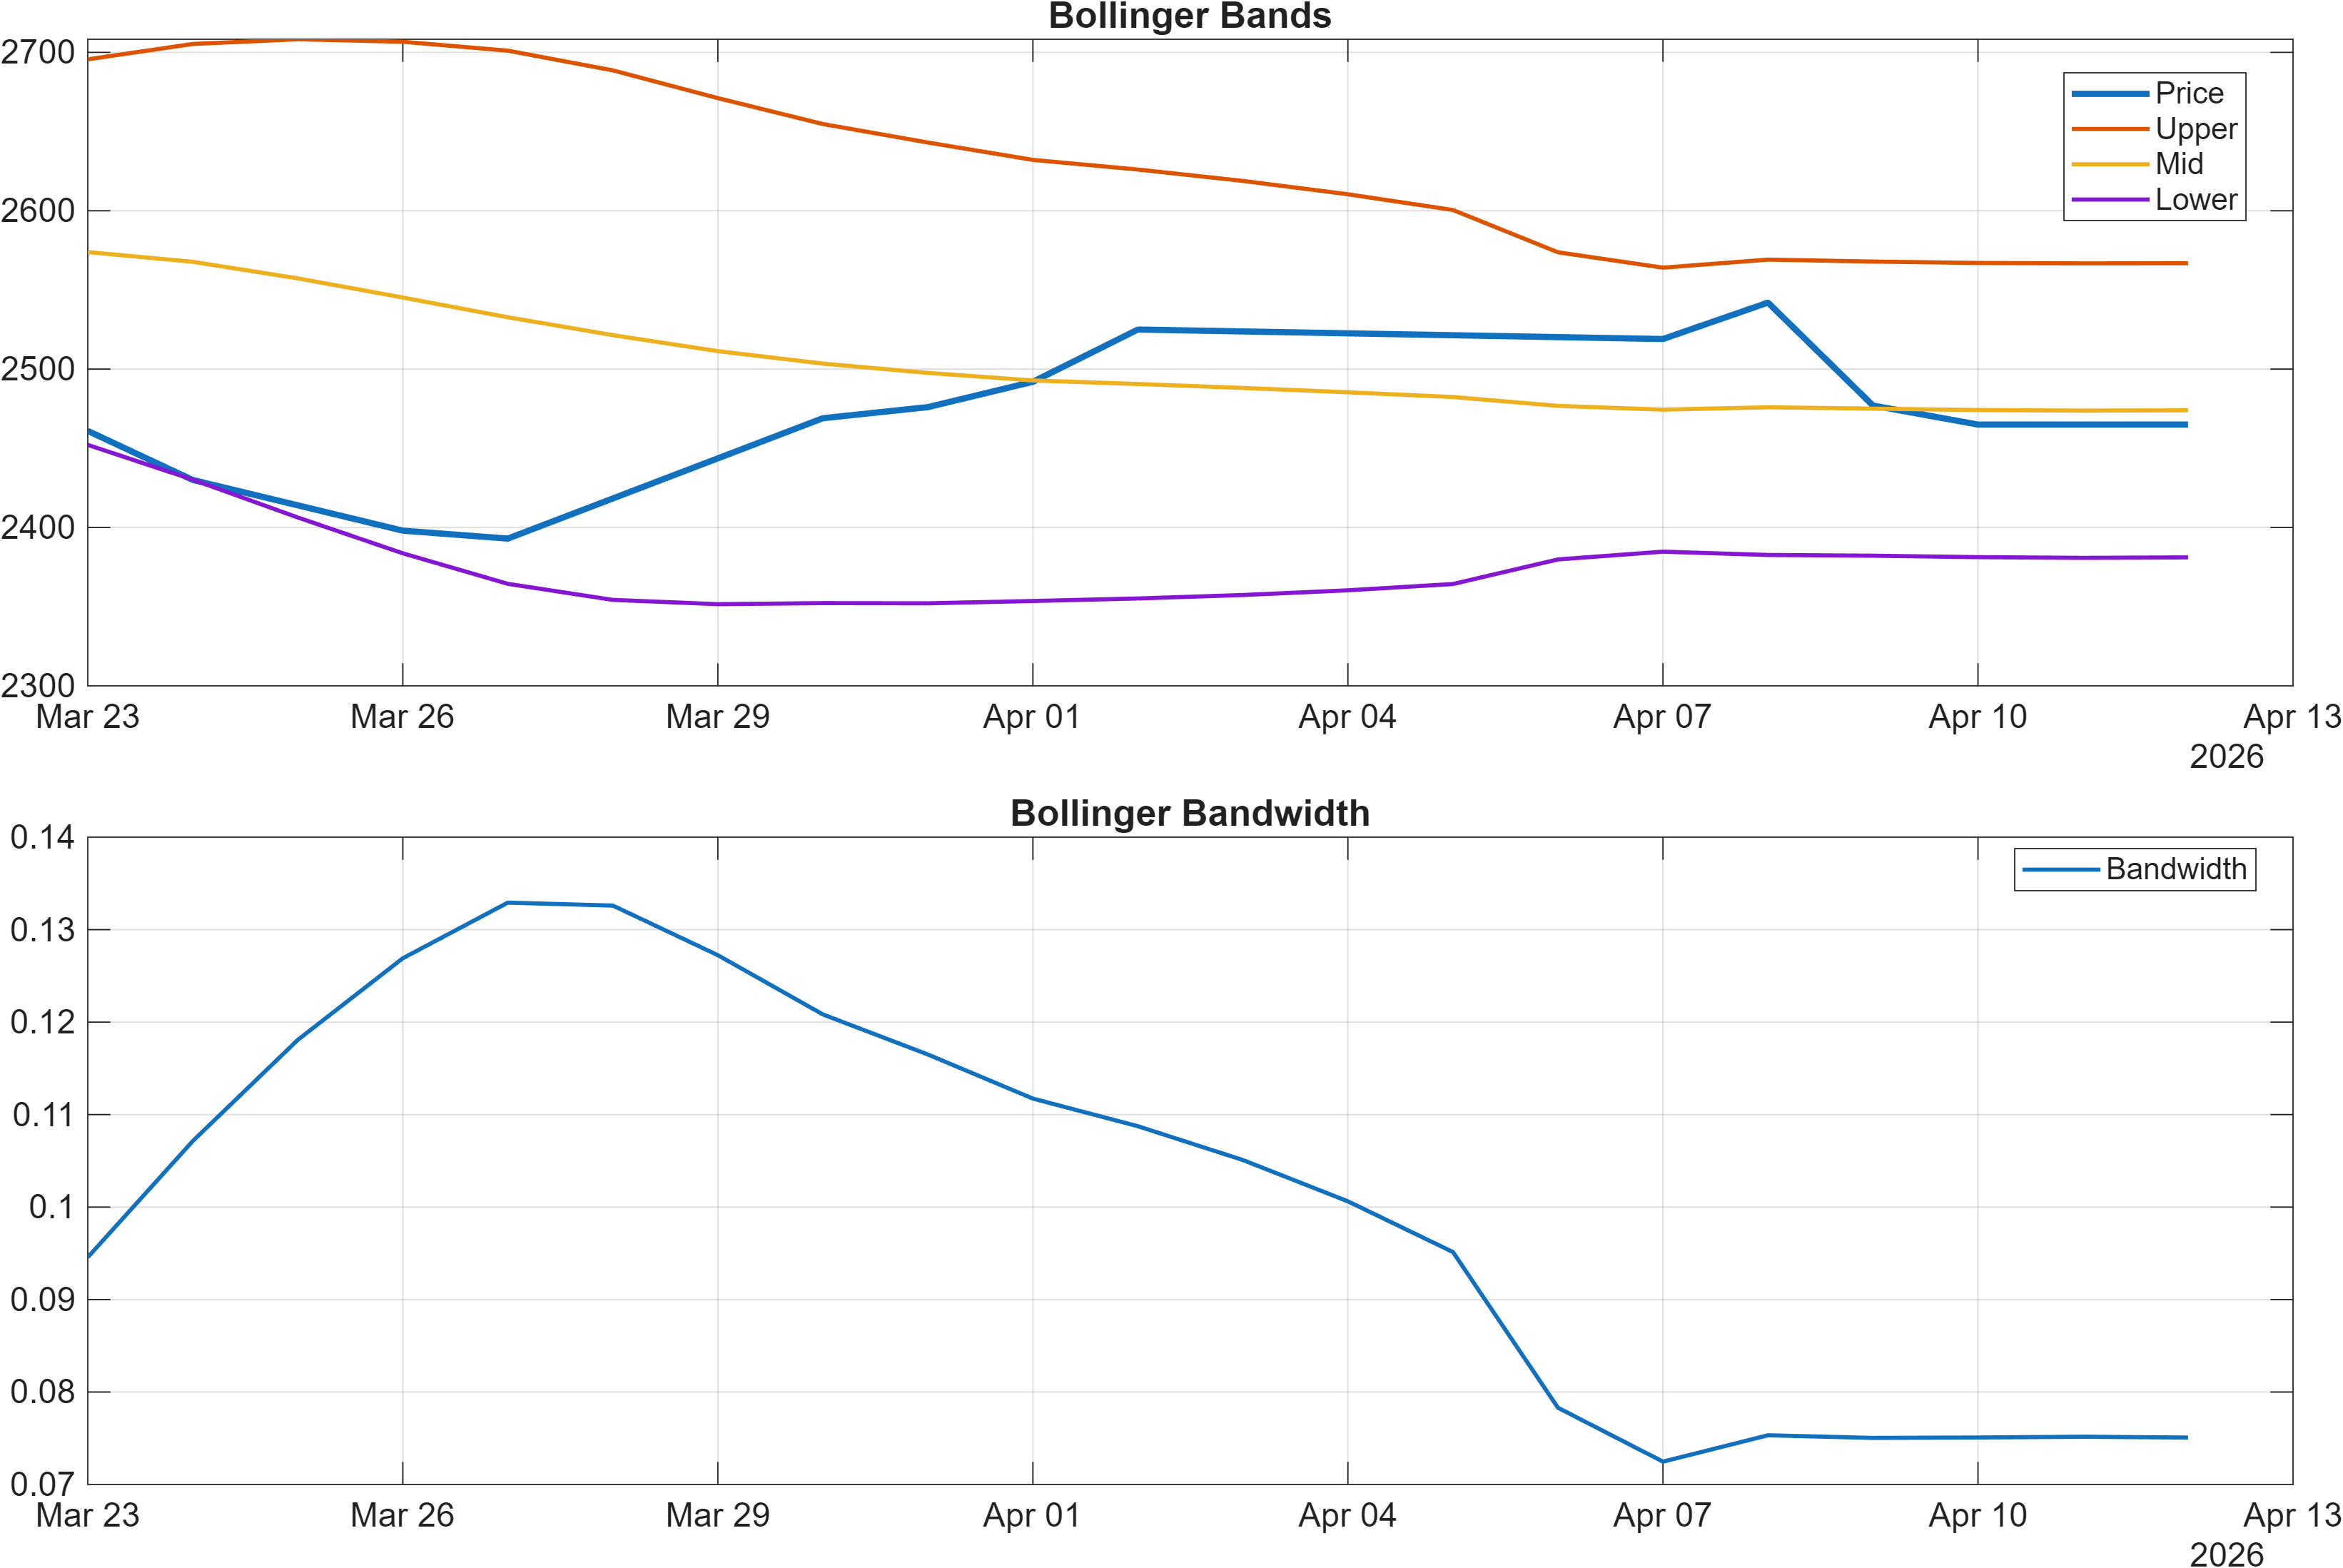
Interpretation: Bandwidth (volatility regime) latest = 0.0751.
Momentum divergence: RSI improves while MACD remains negative
Momentum readings show a split signal that often accompanies transition phases. RSI(14) at 55.69 carries a mild bullish tilt at the indicator level (and the dashboard notes RSI bias as neutral overall), suggesting buyers have recently maintained enough control to keep momentum above the typical midline. In contrast, the MACD histogram remains negative at -2.3495, indicating that, on a trend-following momentum basis, downside pressure has not fully cleared.
When RSI is holding above the mid-zone while MACD stays negative, it often reflects improving internal momentum without full trend confirmation. That aligns with the earlier moving-average view (bearish vs MA50 and MA50 vs MA200) and can explain why short-horizon ranks may look better than weekly posture. The practical implication is that upside attempts can occur, but follow-through may be capped unless MACD begins to repair and price structure improves concurrently.
Volatility provides additional context. Bollinger Bandwidth at 0.0751 points to a relatively contained regime rather than a highly expanded one. Compression-like conditions tend to elevate the importance of nearby decision zones: a range can persist, or volatility can expand quickly once price tests a key boundary. If bandwidth begins to expand while price challenges resistance, that can help validate a continuation attempt; if expansion occurs into weakness, downside moves can accelerate—particularly when MACD is already negative.
4) Support / Resistance zones
Support ~ 2177.0000 | Resistance ~ 2649.0000
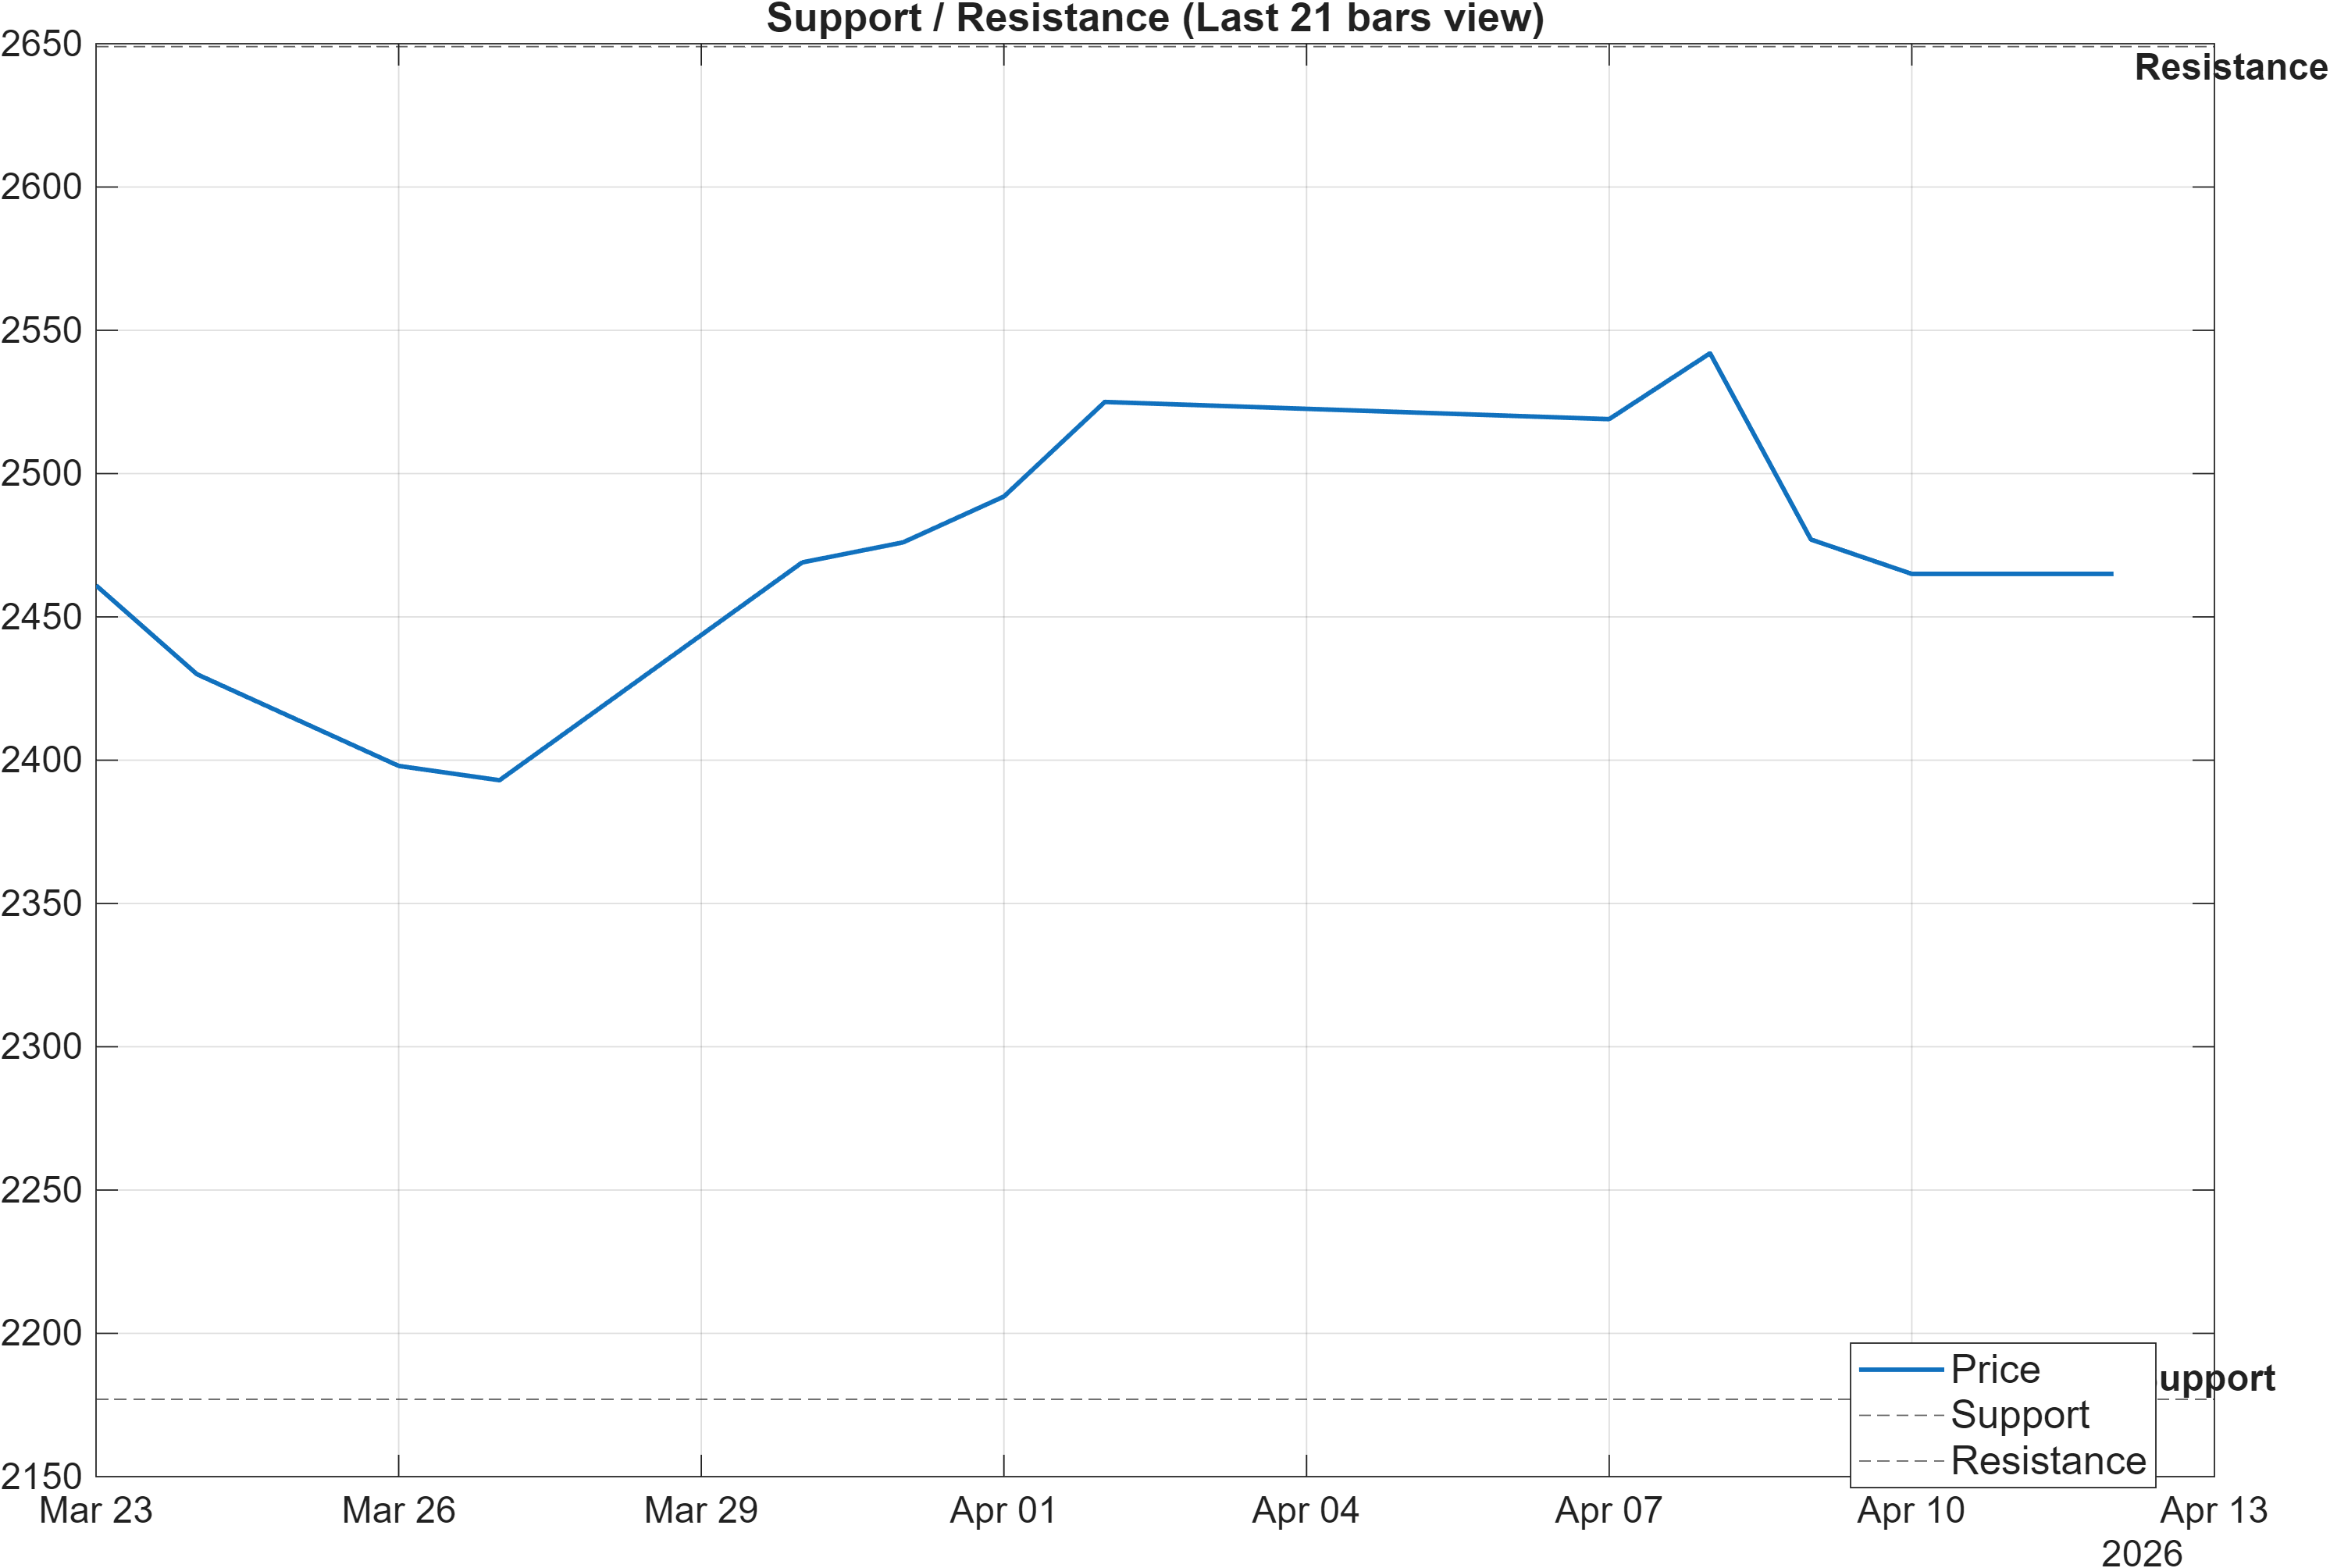
Scenario view: Break above resistance with volume → continuation. Close below support → signal deterioration risk.
Decision-zone market: levels matter more than interpretation drift
With confluence reading neutral and momentum mixed, REL.LSE is best framed as a level-dependent tape. The two probabilistic zones—2177.0000 as support and 2649.0000 as resistance—organize the next phase of signal validation. The scenario guidance is explicit: a break above resistance with volume favors continuation, while a close below support elevates deterioration risk.
These levels also help resolve conflicting evidence elsewhere. A bearish moving-average structure can coexist with a constructive 3-month rank (#24) when price oscillates within a broad range; the break above 2649.0000 would be the type of event that can convert “relative strength inside a range” into a more durable trend attempt. Conversely, a close below 2177.0000 would likely align the bearish elements—negative MACD histogram (-2.3495) and multiple bearish volume-flow slopes (as reflected later in the signal table)—into a more coherent downside narrative.
The distance between 2177 and 2649 is also consistent with why the volatility regime matters: with Bollinger bandwidth at 0.0751, volatility is not currently extreme, but the market has defined room to move before a structural verdict is forced. In neutral regimes, false breaks are possible; hence, the qualifier “with volume” is analytically important because participation tends to be the difference between a brief probe and a sustainable move.
5) Quant Technical Dashboard (18 Signals)
KGNAI AI Technical Analysis Score (Deep Reinforcement Learning): Rank #1405 out of 1420 (Rank 1 represents the strongest technical positioning and a higher probability of favorable price behavior. As ranks increase toward the maximum, the probability of favorable outcomes weakens and bearish positioning becomes more dominant.) | Label: Bearish | Score: -0.979
18-Signal Technical Confluence Score: 0.056 (Neutral)
Overall Technical Score (18-signal confluence + DRL rank blend): -0.255 (Neutral)
Note: The blended score reflects signal strength weighted against broader AI technical ranking, which may temporarily diverge.
Blended technical score breakdown: -0.255 (Neutral | Bull 8 / Bear 7 / Neutral 3)
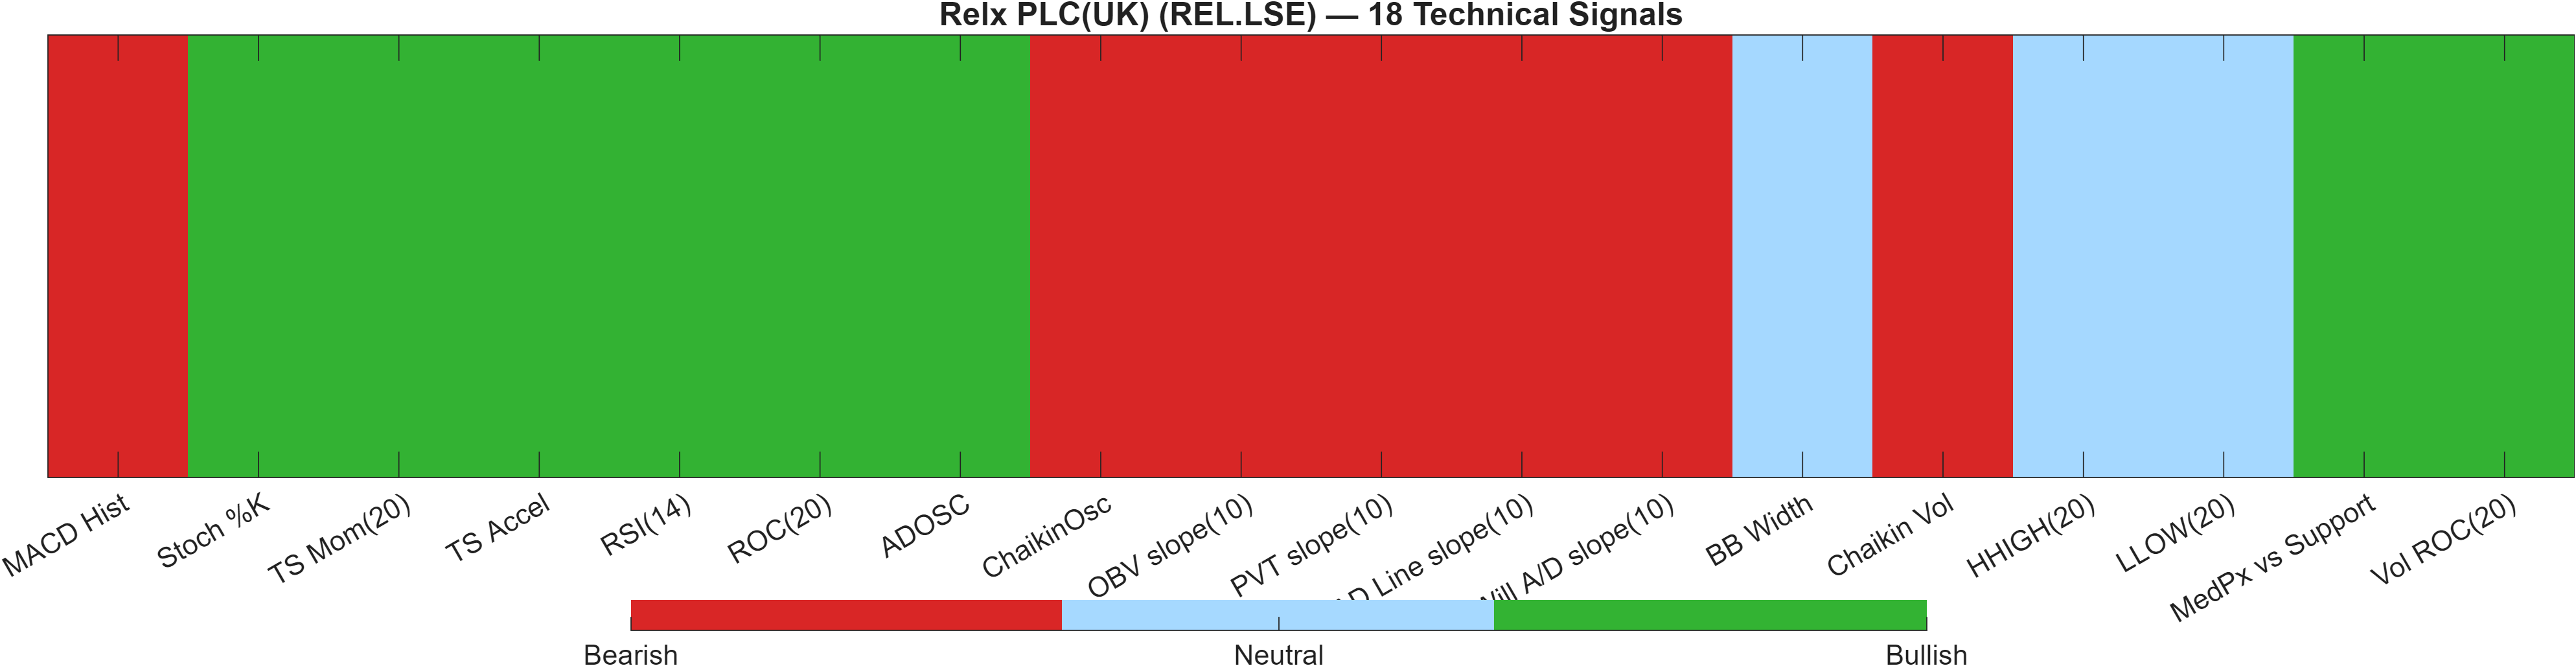
Signal alignment vs model disagreement: why “Neutral” survives a very bearish DRL rank
The technical dashboard presents a useful model-divergence case. The 18-signal confluence score is 0.056 (Neutral), and the blended overall technical score is -0.255 (Neutral), with the heatmap breakdown showing Bull 8 / Bear 7 / Neutral 3. That is close to balanced, consistent with a market where multiple indicator families disagree but none fully dominates.
At the same time, the Deep Reinforcement Learning technical rank is #1405 out of 1420 with a bearish label and a score of -0.979. This is an extreme placement near the bottom of the universe and implies that, based on the DRL model’s learned pattern library, the current configuration resembles historically weaker technical positioning.
The fact that the blended output remains neutral, despite the DRL rank, is itself informative: the indicator stack contains enough countervailing positives to prevent a full bearish consensus. Examples inside the locked signal table include RSI(14) at 55.69 and Stoch %K at 11.17 reading bullish, while MACD Hist at -2.35 is bearish. Meanwhile, several participation/flow measures tilt bearish (e.g., OBV slope(10) negative), which can keep the DRL model skeptical even when oscillators improve.
Signal table (Bull/Bear/Neutral)
| Indicator | Value | Signal |
|---|---|---|
| MACD Hist | -2.35 | Bearish |
| Stoch %K | 11.17 | Bullish |
| TS Mom(20) | 35 | Bullish |
| TS Accel | 228 | Bullish |
| RSI(14) | 55.69 | Bullish |
| ROC(20) | 1.44 | Bullish |
| ADOSC | 49.33 | Bullish |
| ChaikinOsc | -7.069e+06 | Bearish |
| OBV slope(10) | -2.932e+07 | Bearish |
| PVT slope(10) | -1.109e+05 | Bearish |
| AD Line slope(10) | -2.151e+07 | Bearish |
| Will A/D slope(10) | -278 | Bearish |
| BB Width | 0.07508 | Neutral |
| Chaikin Vol | 0.334 | Bearish |
| HHIGH(20) | 2632 | Neutral |
| LLOW(20) | 2355 | Neutral |
| MedPx vs Support | 304.5 | Bullish |
| Vol ROC(20) | 11.04 | Bullish |
Interpretation: Indicator-level signals form the base confluence, which is then adjusted using a separate AI-driven technical ranking model. The final technical score summarizes this combined view.
6) News sentiment + extractive gist
Note: Some headlines were matched using a looser (title-only) rule to avoid missing relevant coverage.
Sentiment score (avg): 0.000 | Positive: 0% | Neutral: 100% | Negative: 0%
KGNAI AI News Sentiment Score (normalized -1 to +1): 1.00 (as of 2026-02-23) | Label: Bullish | Overall news score: 0.96
Positive Developments
Recent coverage across major financial outlets indicates a generally low-friction news backdrop for REL.LSE within the KGNAI feed: the distribution is 100% neutral (avg 0.000), yet the normalized sentiment model prints 1.00 with an overall news score of 0.96. That combination typically appears when the system detects a constructive language tone without a high volume of clearly directional, company-specific catalysts. From a market-structure perspective, this can matter because a calm headline environment can reduce event-driven gap risk and allow technical levels to do more of the “work” in guiding flows. In a neutral technical regime (confluence 0.056; blended -0.255), a supportive sentiment model can slightly bias interpretation toward stability rather than disruption—without overriding price-based confirmation requirements at resistance and support.
Neutral / Mixed Developments
The news scoring also signals classification ambiguity rather than narrative clarity. The average sentiment is exactly 0.000 with 0% positive and 0% negative, implying the matched items were treated as informational rather than decisively constructive or adverse. This matters because, when sentiment is flat, technical outcomes tend to be more sensitive to participation and momentum shifts. That fits the current indicator picture: RSI(14) at 55.69 suggests improving demand, while MACD histogram at -2.3495 keeps trend momentum unresolved. In this context, the neutral news distribution should be read as “no clear catalyst advantage,” placing added emphasis on whether price action can validate above 2649.0000 or fails and rotates back toward 2177.0000.
Negative / Risk Signals
The primary risk signal within the provided data is not a negative headline count (which is 0%), but the potential for model-to-model disagreement to persist if the market experiences volatility expansion without directional confirmation. With Bollinger bandwidth at 0.0751, volatility is not elevated, but it can expand quickly around decision zones. If that expansion occurs while the tape remains below key trend filters (bearish close vs MA50 and bearish MA50 vs MA200) and with bearish participation signatures (e.g., multiple negative volume/flow slopes in the signal stack), the probability of failed breakouts increases. In other words, the risk is structural: a neutral-news environment can still coincide with downside acceleration if price closes below 2177.0000, which the scenario view flags as deterioration risk.
What to monitor next
- Reaction quality near 2649.0000: whether any breakout is accompanied by participation consistent with continuation.
- Behavior around 2177.0000: whether support holds on closes, not just intraday probes.
- Whether MACD histogram (-2.3495) begins to repair while RSI remains supported.
Snapshot: AI Rank (Short–Mid–Long): Neutral (Neutral–Neutral–Neutral) · Technical Confluence: Neutral · Key Levels: Support ~2177.00 | Resistance ~2649.00 · News Sentiment: Neutral
7) Sources
Not available in the provided data.
You may also like: How KGNAI AI ranks instruments across global markets
Disclaimer: KGNAI provides AI-generated analytics and educational market commentary only. This is not financial advice. Markets involve risk. Always do your own research.