
IFX.F — Infineon Technologies AG (Germany) (22-May-2026) | Consolidation with Bullish Technical Confluence
KGNAI Signal + Technical Snapshot + News Sentiment Digest
As of: 22-May-2026
Ticker: IFX.F
Infineon Technologies AG (Germany) (IFX.F) is presenting a structurally constructive setup, but with cross-horizon confirmation still uneven. The KGNAI daily rank sits at #211 (bullish tilt), while the longer horizon remains more muted with the yearly rank at #1040, keeping the overall short/mid/long term view Neutral. Technically, the moving-average regime is supportive (close vs MA50 bullish; MA50 vs MA200 bullish), and the composite dashboard remains net-positive with an overall technical score of 0.614 (Bullish) and a strong DRL technical rank of #85. Momentum readings are firm (RSI bias bullish; MACD histogram 0.0504), but volatility is not extreme (Bollinger bandwidth 0.2427), consistent with consolidation risk rather than a one-way trend. Structurally, the market is framed by support ~37.5555 and resistance ~66.9150, turning breakout validation and volume follow-through into the key arbiters of whether the bullish technical stack can persist.
- Rank stance: Short-term Neutral | Mid-term Neutral | Long-term Neutral (daily rank #211 vs yearly rank #1040).
- Technical confluence: Bullish (overall technical score 0.614; DRL technical rank #85).
- Key levels: Support ~37.5555 | Resistance ~66.9150.
- News sentiment bias: Bullish (normalized score 0.96; avg sentiment 0.147 with 0% negative in provided mix).
- Confirmation / invalidation: Continuation requires a break above resistance with volume; deterioration risk increases on a close below support.
KGNAI evaluates assets using large cross-sectional datasets built from millions of structured data points. Inputs incorporate fundamental metrics, technical structures, and systematically processed news sentiment. Statistical models, machine learning, and AI frameworks are used to assess relative positioning, signal alignment, and probabilistic behavior across broad universes.
- Ranks are comparative across the tracked universe, not absolute price targets.
- Confluence reflects alignment among independent signal groups.
- Support/resistance levels are probabilistic decision zones, not guarantees.
- Sentiment provides contextual bias within the broader analytical framework.
1) KGNAI AI Analysis
Region: EUROPE
Total universe size: 1416 ranked instruments
- Daily rank: #211 out of 1416 — Bullish
- Weekly rank: #492 out of 1416 — Neutral
- Monthly rank: #524 out of 1416 — Neutral
- 3-Monthly rank: #726 out of 1416 — Neutral
- 6-Monthly rank: #482 out of 1416 — Neutral
- Yearly rank: #1040 out of 1416 — Neutral
Rank structure is front-end stronger than the back-end, a pattern that often occurs when price action improves faster than longer-horizon persistence tests can re-rate. IFX.F’s daily position at #211 places it in the upper quartile of the 1416-instrument universe, but the weekly (#492) and monthly (#524) sit closer to the mid-pack, and the yearly rank at #1040 remains in the lower third. The net message is not “risk-off,” but rather that the market has not yet demonstrated enough durability to pull the longer horizon models into the same regime as the short-term snapshot.
This is consistent with a consolidation stance: improving short-term behavior alongside a longer-term rank that still reflects earlier weakness or a less stable trend. Practically, when daily strength precedes weekly/monthly upgrades, the market often becomes more sensitive to confirmation events (breakouts, trend continuation, or volume-supported follow-through) versus incremental drift.
Importantly, the term view remains explicitly Neutral across short-, mid-, and long-term, which limits how aggressively one should interpret the daily bullish label in isolation. The more robust takeaway is that IFX.F is in a transition zone within the cross-sectional ranking framework: near-term relative behavior is improving, but the broader, slower-moving tests have not fully aligned.
KGNAI ranks each instrument across large universes using multiple proprietary AI tests and statistical models (millions of data points). Lower ranks generally indicate stronger probability of favorable performance behavior, while higher ranks indicate weaker probability and more bearish positioning.
Term view: Short-term: Neutral. Mid-term: Neutral. Long-term: Neutral.
Want the full universe and complete rank tables? Unlock full access on KGNAI: https://www.kgnai.com/pricing
2) Price & trend overview
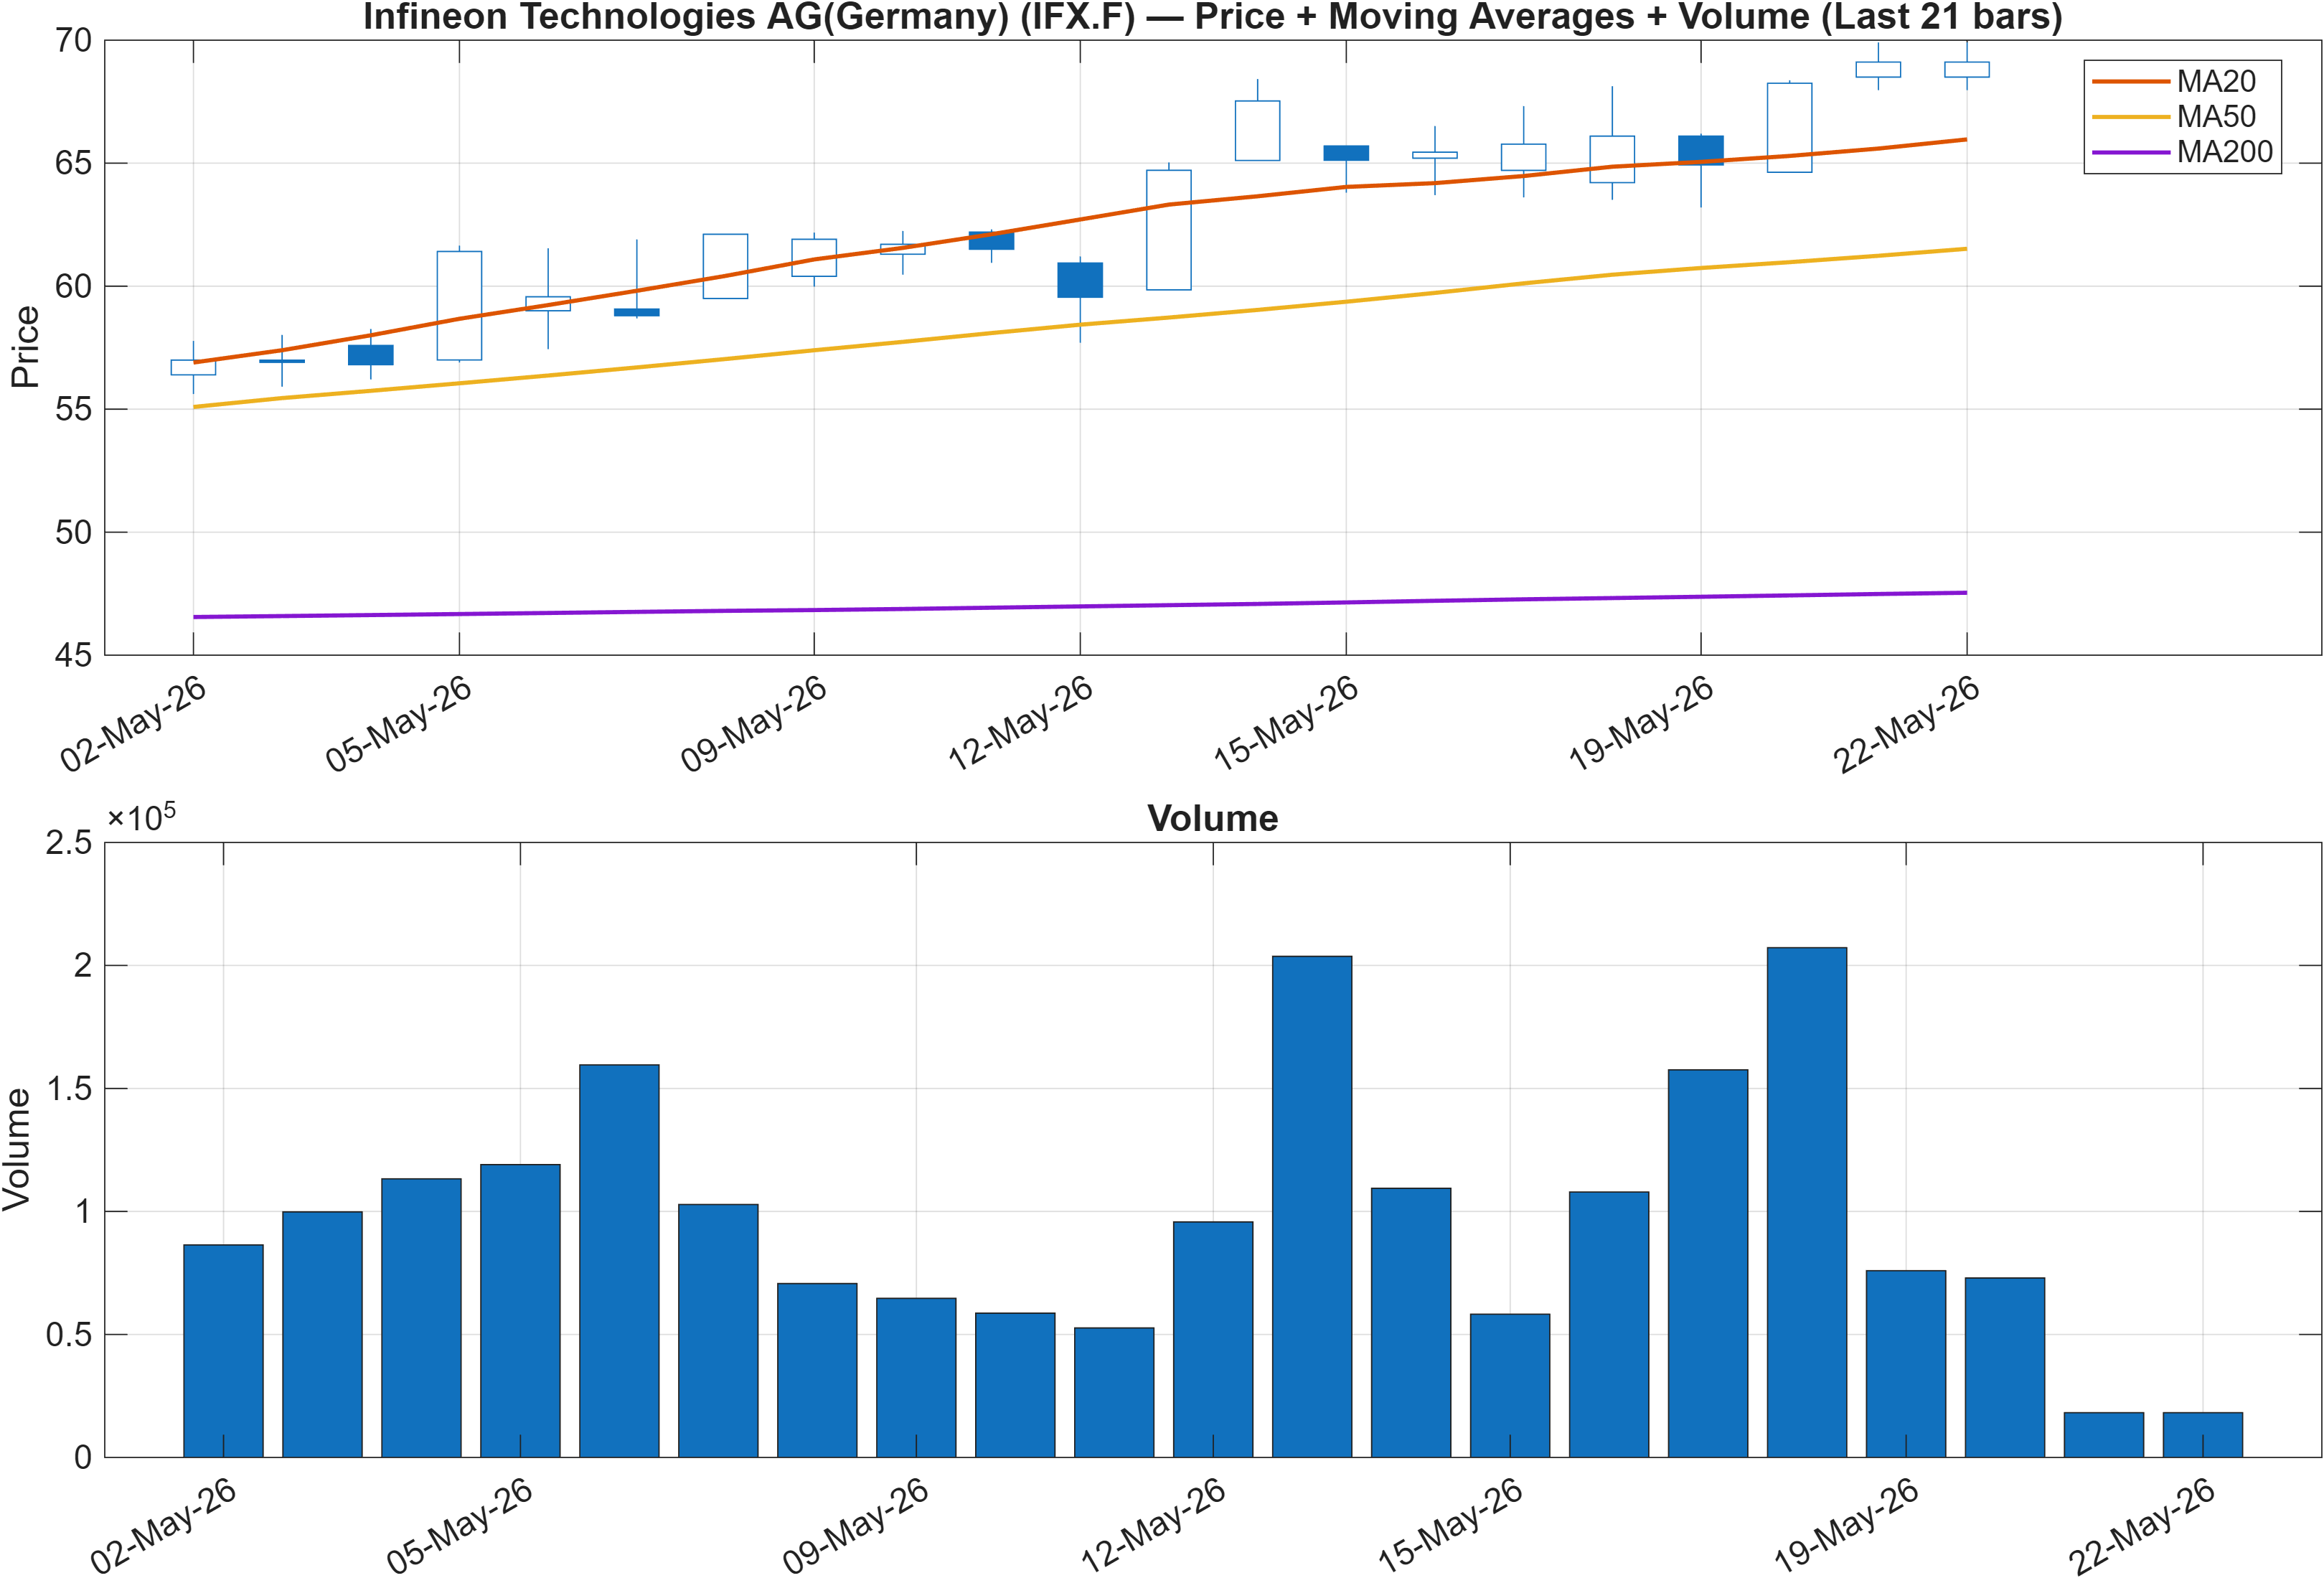
Interpretation: Close vs MA50 = Bullish, MA50 vs MA200 = Bullish.
The trend read is constructive because both layers of moving-average logic are aligned bullish: price is holding above the MA50, and the MA50 is positioned above the MA200. This is a classic definition of an uptrend regime, but the rest of the dashboard suggests the market is working through a consolidation phase rather than extending cleanly. That makes the trend signal meaningful, but not sufficient on its own—especially given the rank profile where the yearly rank (#1040) has not caught up with the daily improvement (#211).
From a structure standpoint, the moving-average configuration tends to behave like a “baseline bid” during pullbacks: dips toward faster averages often become the first area where continuation either stabilizes or fails. Because the analysis frame also includes wide structural levels (support 37.5555, resistance 66.9150), the current regime can be interpreted as trend intact, but still being proven across timeframes.
Volume behavior is explicitly part of the cross-validation process, and the scenario language later in the report ties continuation to a break above resistance with volume. That emphasis is consistent with consolidation: when trend is “on” but price is coiling, participation becomes the differentiator between a durable move and a short-lived push.
Overall, Section 2 supports a Bullish trend framework, while the surrounding sections (momentum/volatility, ranks) argue for patience around confirmation rather than treating the moving-average alignment as a standalone catalyst.
3) Momentum & volatility dashboard
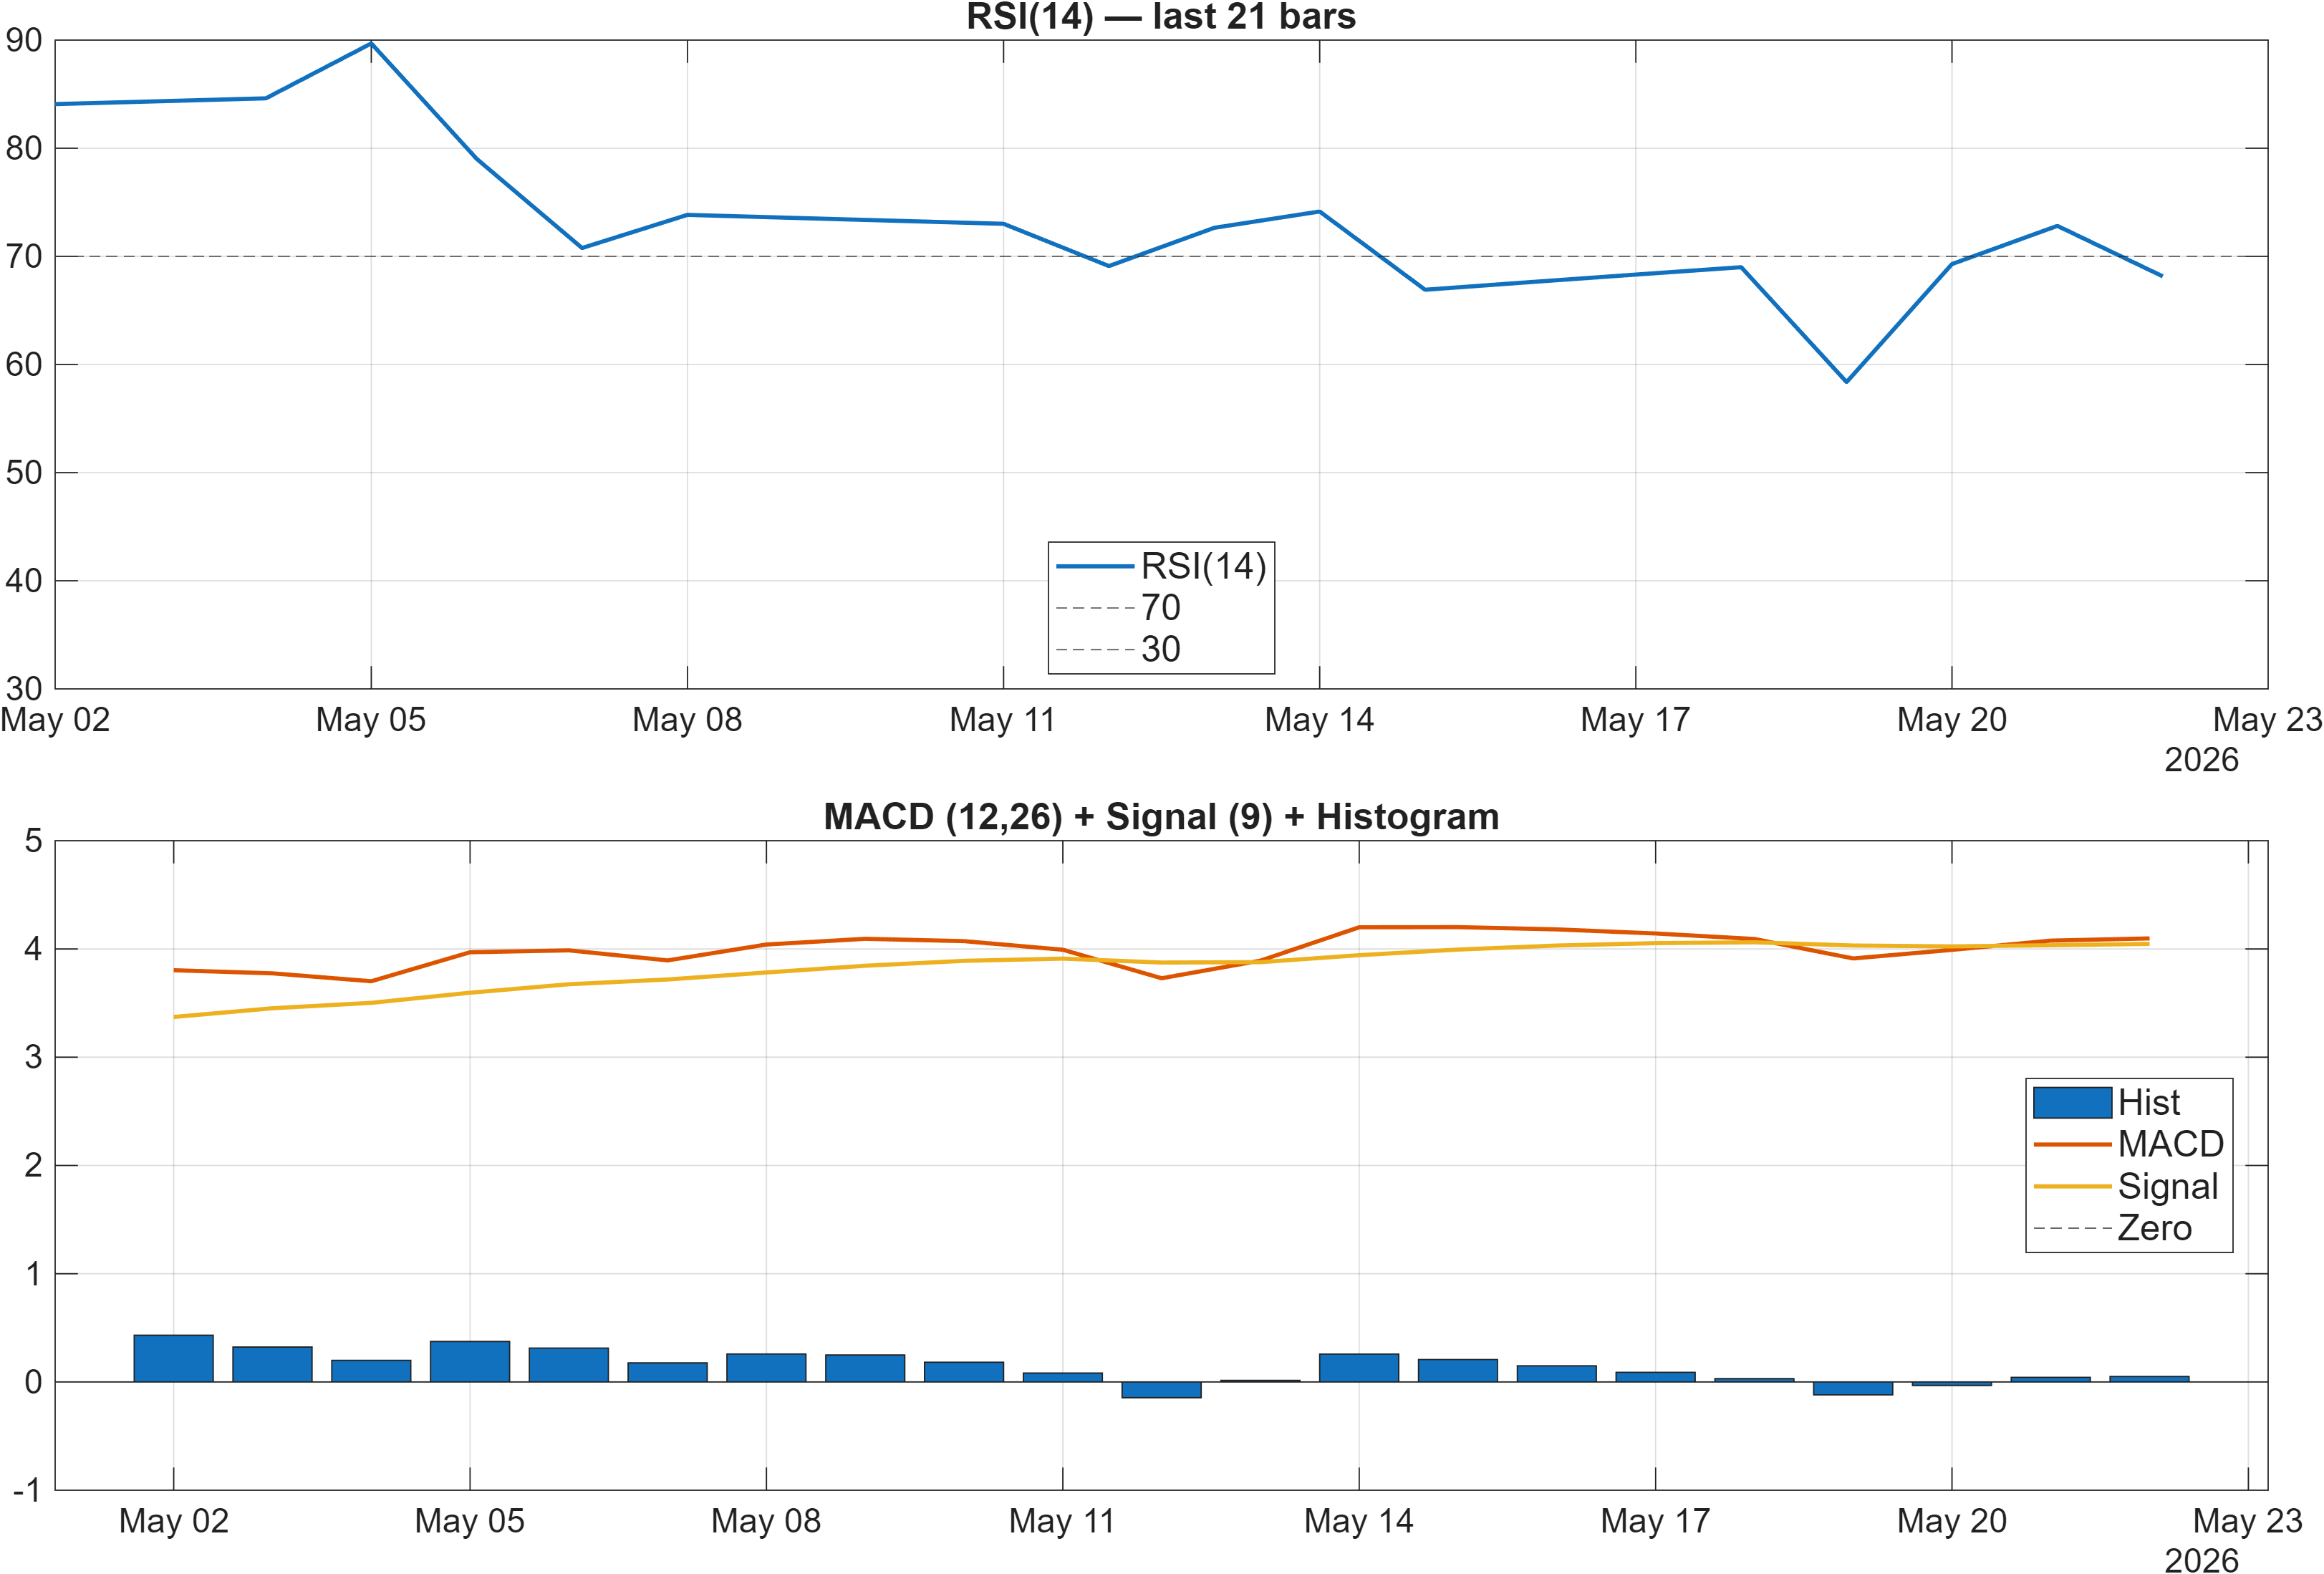
Interpretation: RSI bias = Bullish, MACD hist = 0.0504.
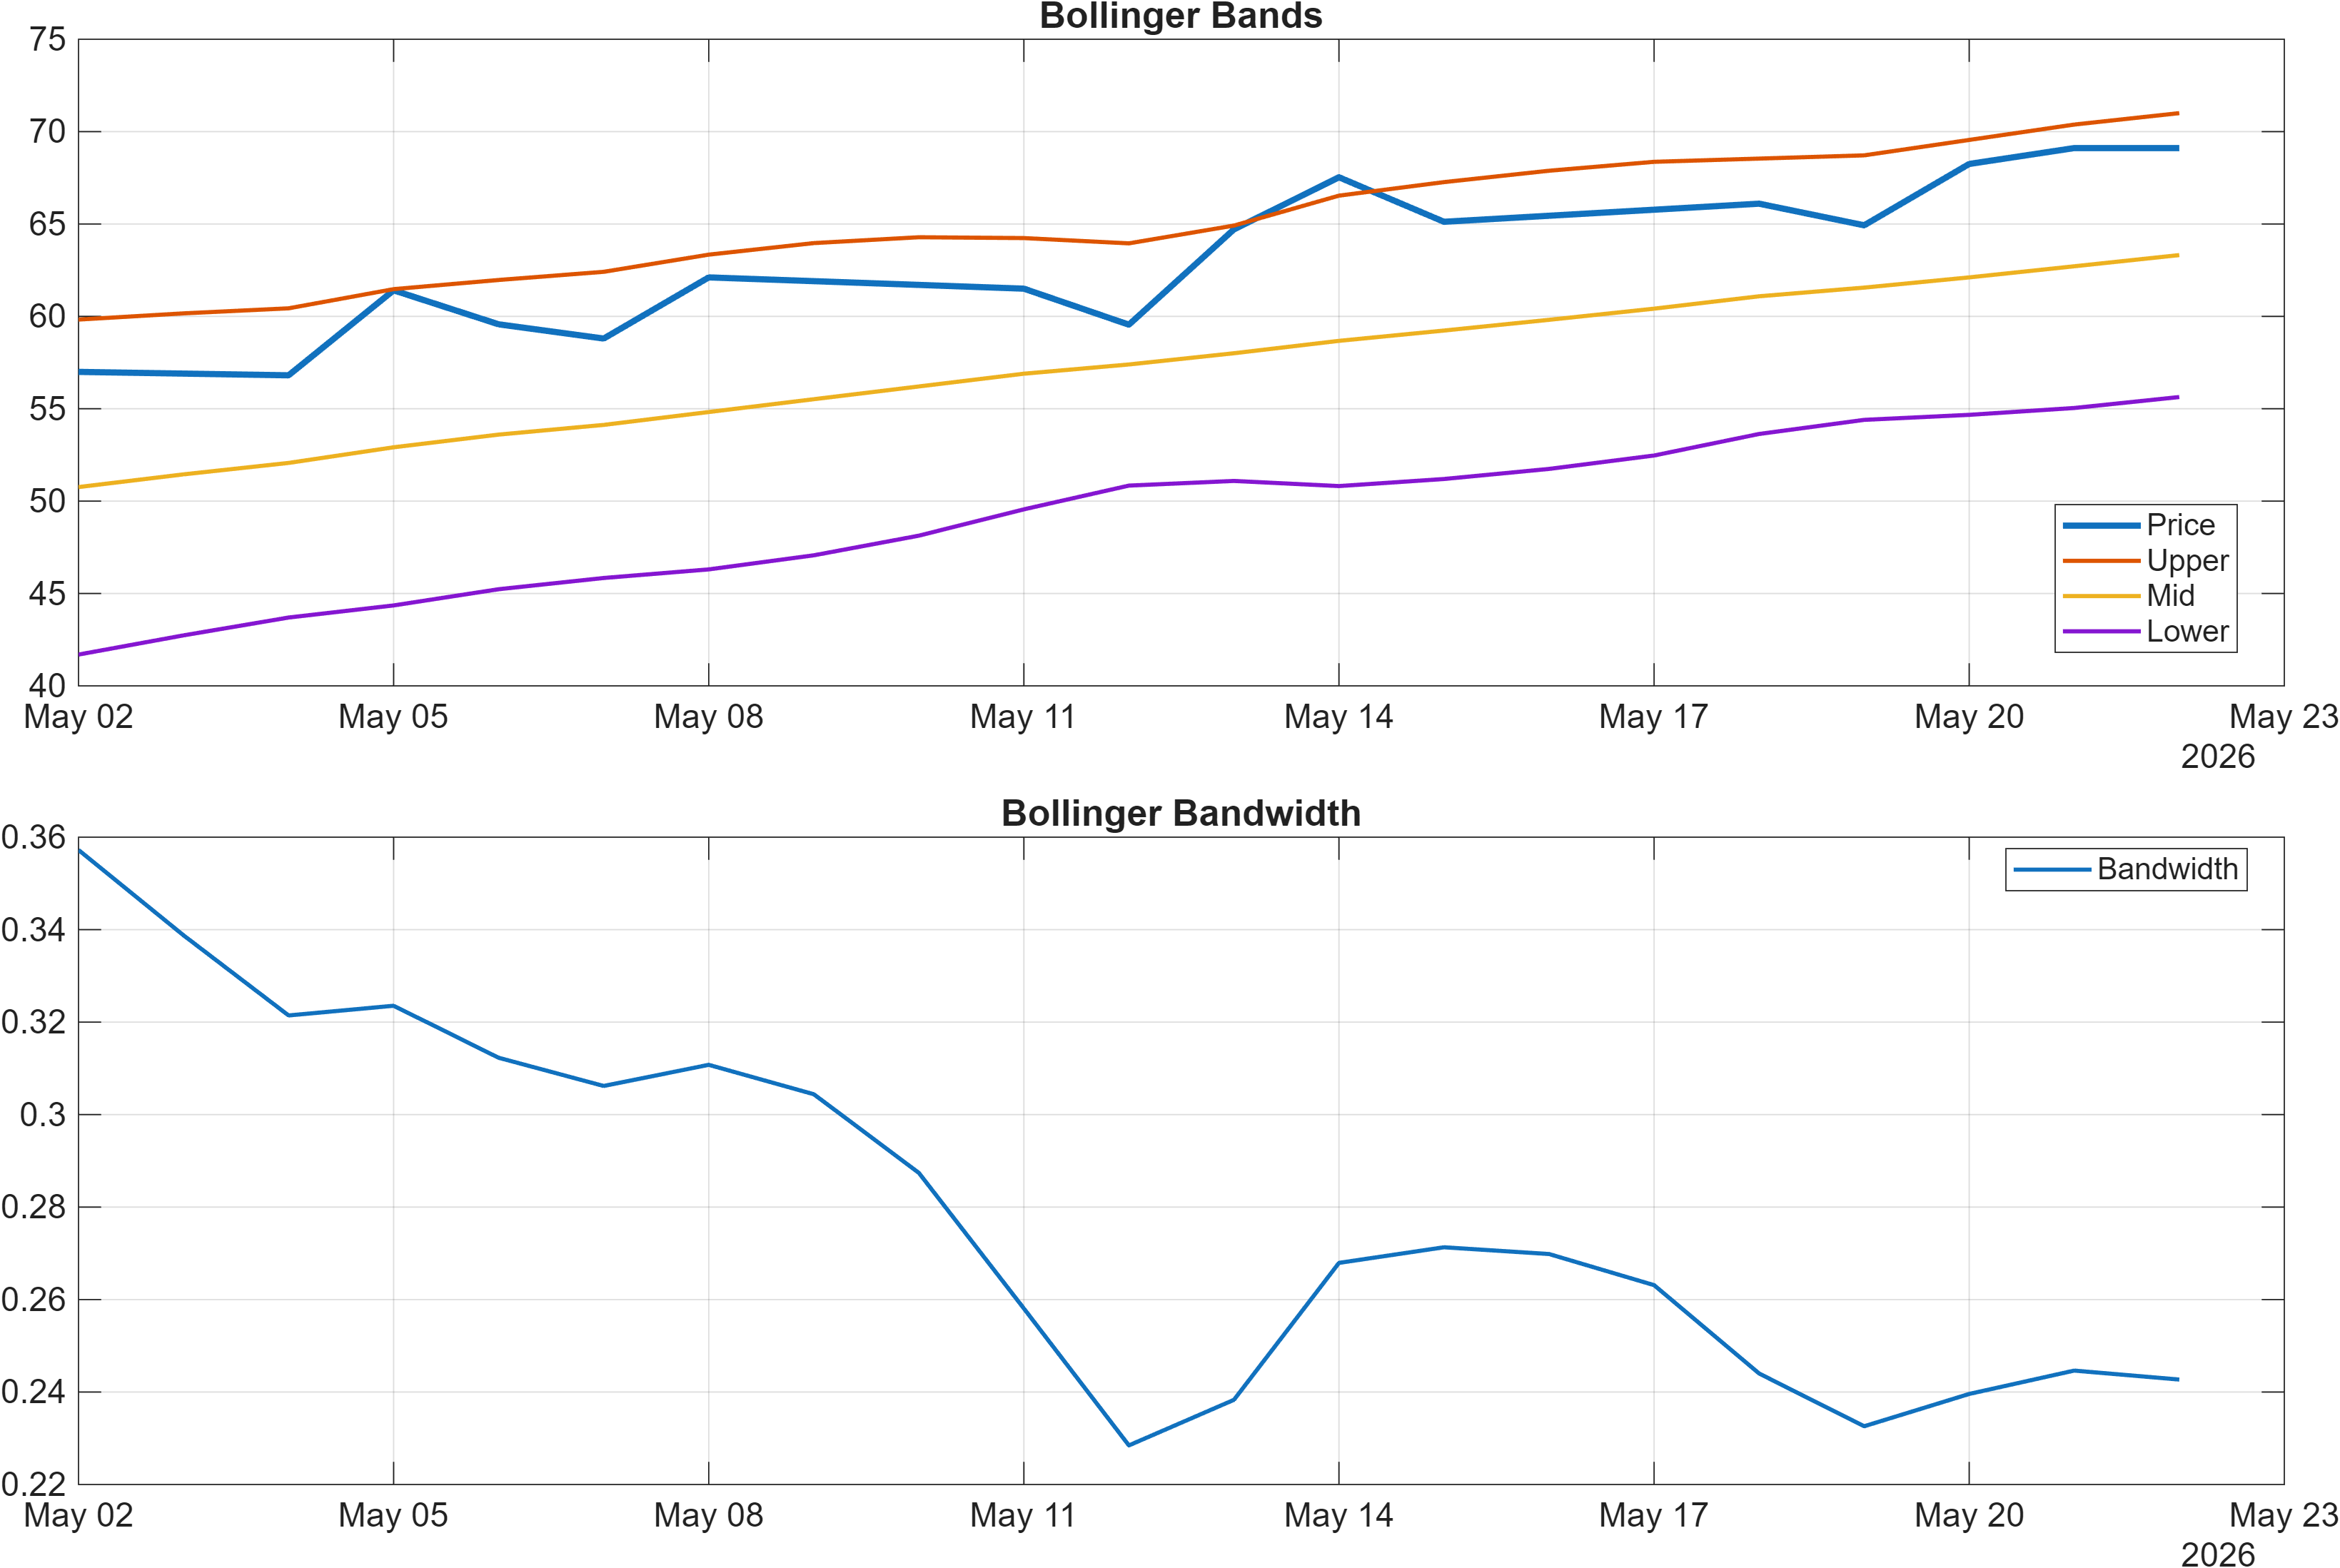
Interpretation: Bandwidth (volatility regime) latest = 0.2427.
Momentum is supportive, but it is showing signs of being late-cycle within the current swing. The RSI bias is bullish, and the MACD histogram is positive at 0.0504, indicating that upward momentum is still present. At the same time, the broader signal set (see Section 5) includes an elevated Stoch %K reading (92.05) marked bearish, which often appears when price has advanced quickly and is more sensitive to pauses or mean reversion—even if the intermediate trend remains constructive.
Volatility, however, is not displaying an extreme expansion state. Bollinger bandwidth at 0.2427 reads as a contained regime in the context of this report’s “consolidation” stance. When positive momentum persists inside a relatively contained bandwidth environment, markets frequently oscillate between short bursts and digestion phases rather than trending smoothly.
This creates a useful alignment/divergence lens: the Bullish momentum stack (RSI + positive MACD histogram) is aligned with the bullish moving-average regime, but it is partially counterbalanced by overheated oscillator behavior and a volatility profile that does not yet imply an impulsive breakout environment.
For monitoring purposes, the dashboard’s key question is not whether momentum is “up” today—it is—but whether momentum can remain constructive while volatility transitions from contained (0.2427) into expansion without losing structure. That transition is where consolidations resolve, and it is why the report emphasizes breakout confirmation and volume as the arbiter of direction.
4) Support / Resistance zones
Support ~ 37.5555 | Resistance ~ 66.9150
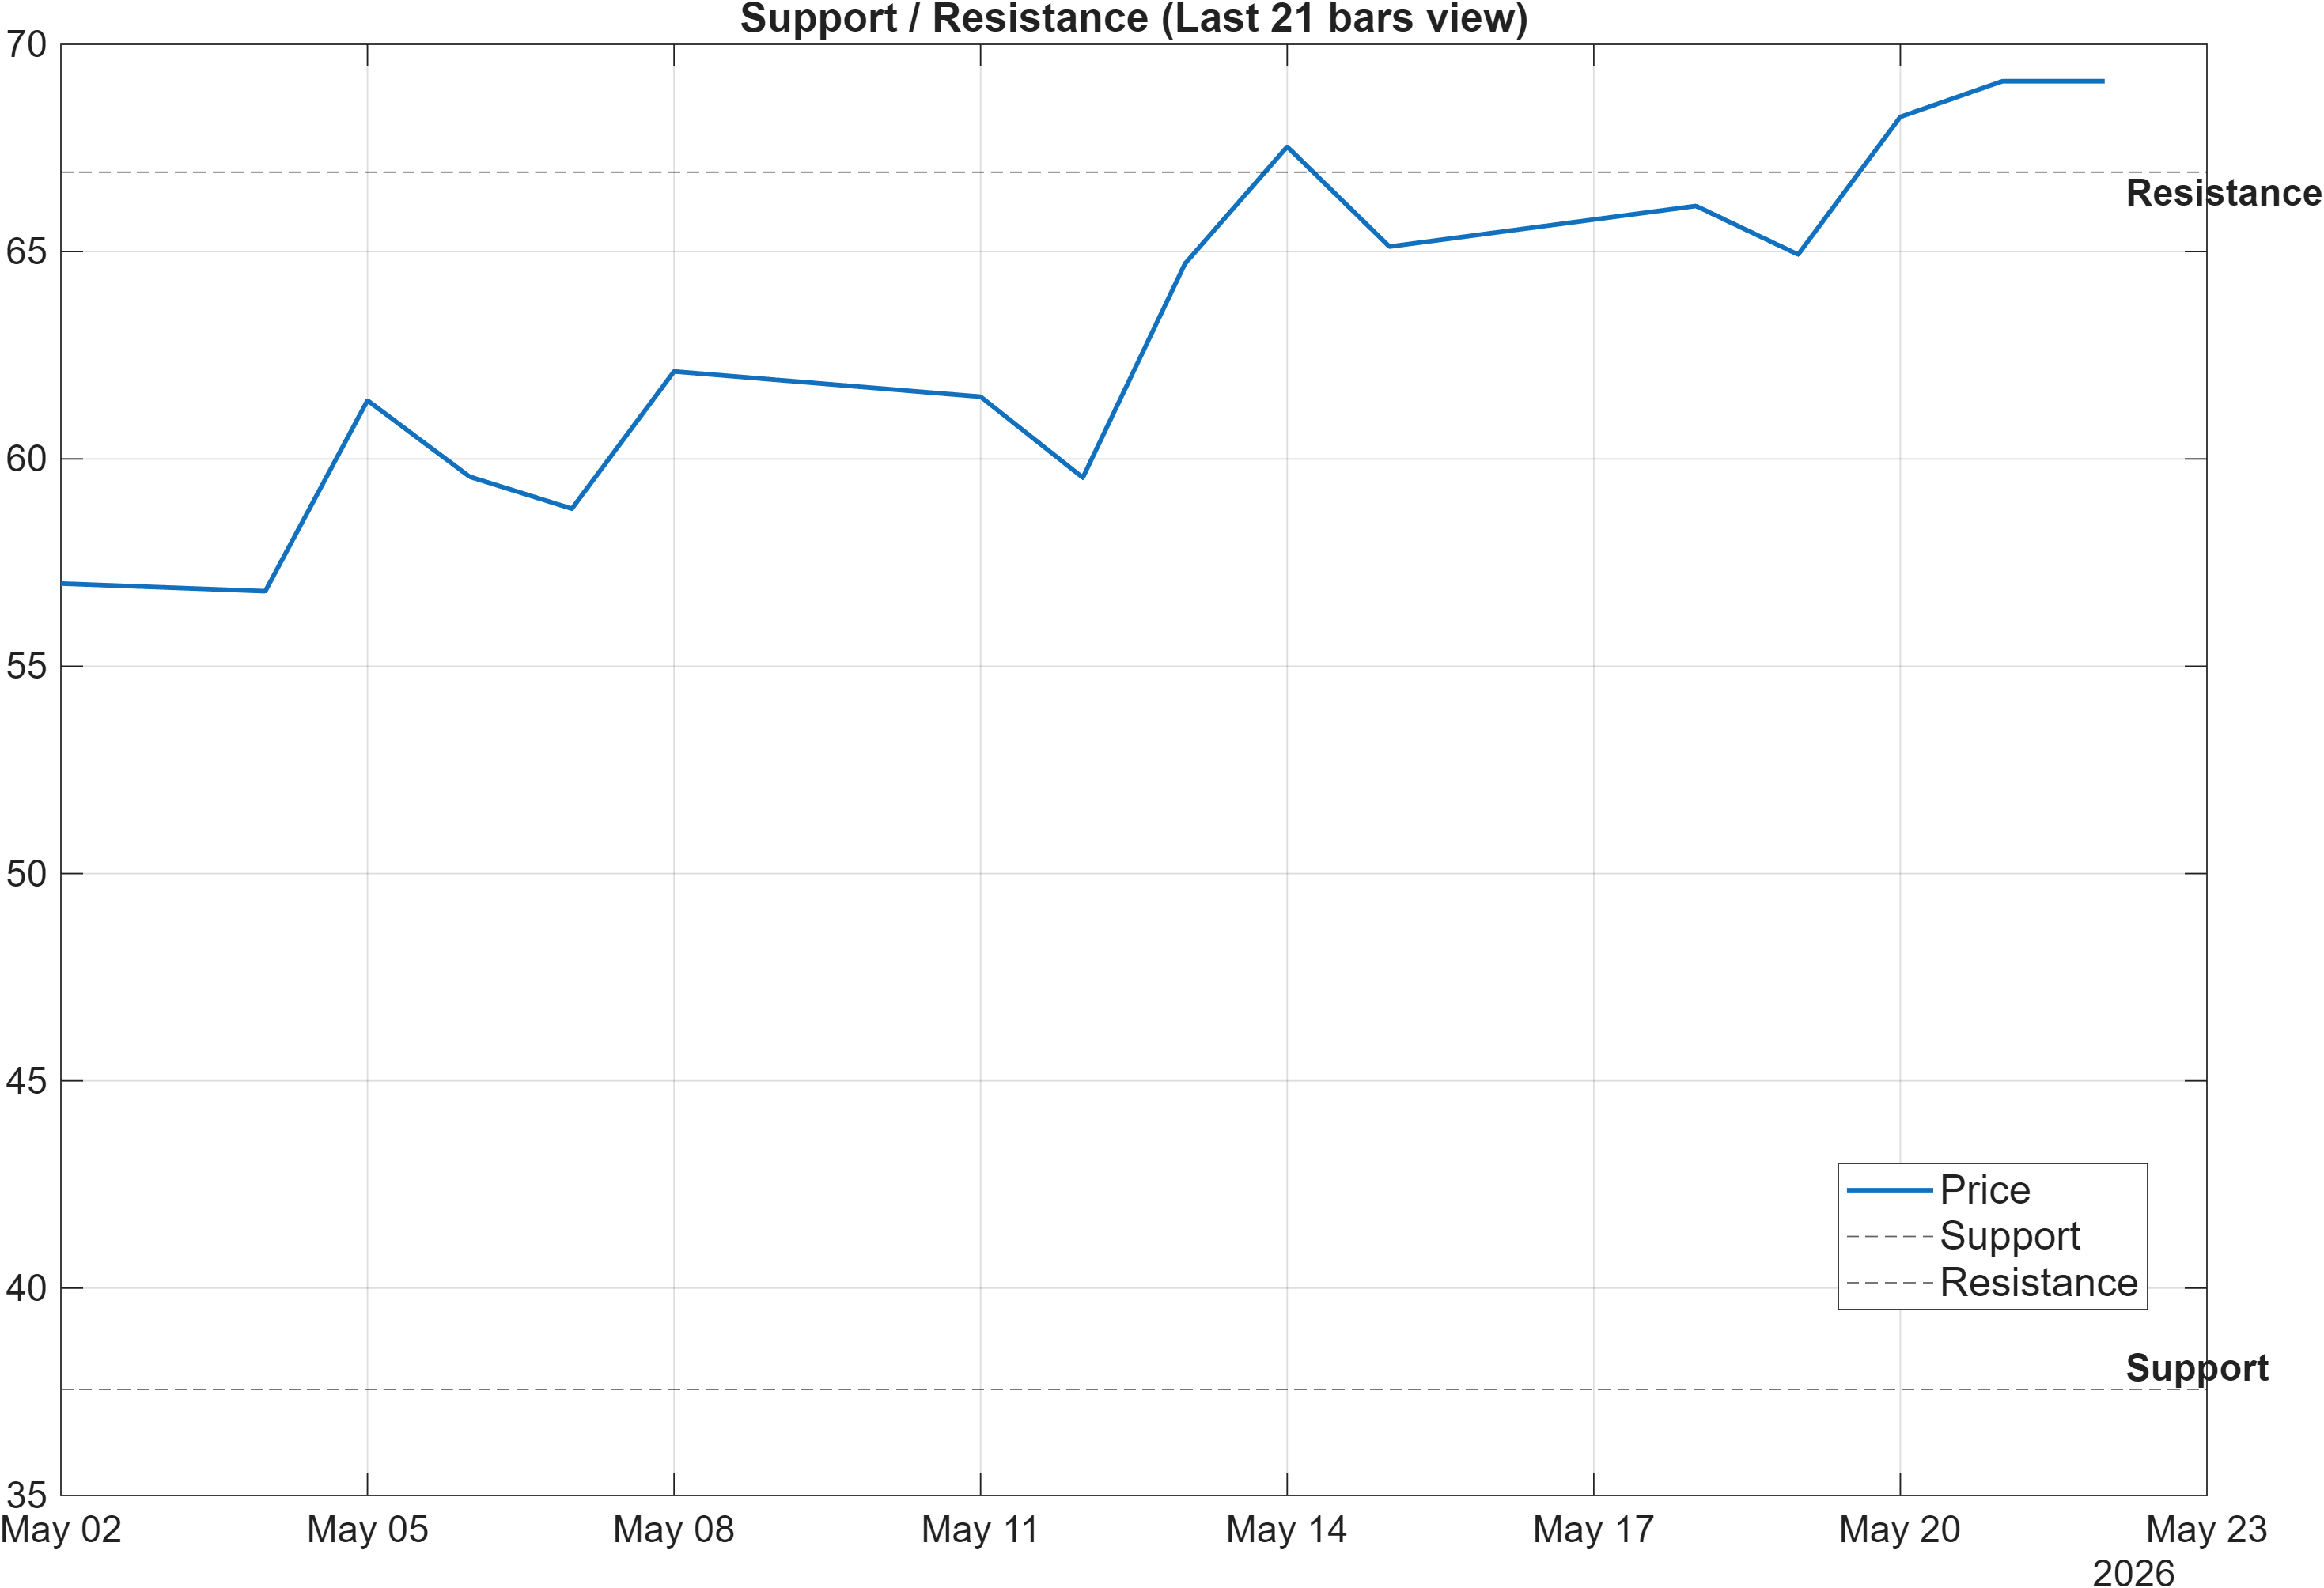
Scenario view: Break above resistance with volume → continuation. Close below support → signal deterioration risk.
The level framework is wide and intentionally structural: support ~37.5555 defines the downside boundary where the bullish technical stack would be pressured, while resistance ~66.9150 defines the upside boundary where consolidation would be considered resolved via confirmation. In a consolidation context, these zones function less as “targets” and more as decision thresholds for whether trend persistence is improving or deteriorating.
Two aspects make these levels more meaningful in this report. First, the broader technical stance is bullish (overall technical score 0.614; DRL rank #85), which means the baseline case is that pullbacks are more likely to be absorbed unless structure breaks. Second, ranks across horizons are not uniformly bullish—daily rank #211 contrasts with a yearly rank #1040—so the market is still in a “prove it” phase where level interaction can materially influence whether longer-horizon ranks start to improve.
The scenario language is deliberately conditional: a break above resistance with volume is treated as confirmation of continuation, while a close below support is framed as deterioration risk. That framing matches the volatility picture (bandwidth 0.2427): when volatility is comparatively contained, breaks beyond key zones often coincide with volatility expansion. If such an expansion occurs without supportive participation (volume confirmation), breakouts can fail and revert into range behavior.
Net: the levels provide a clean way to reconcile bullish technical confluence with the “consolidation” stance—price can remain constructive inside the range, but the next regime shift is most credibly signaled at the boundaries.
5) Quant Technical Dashboard (18 Signals)
KGNAI AI Technical Analysis Score (Deep Reinforcement Learning): Rank #85 out of 1416 (Rank 1 represents the strongest technical positioning and a higher probability of favorable price behavior. As ranks increase toward the maximum, the probability of favorable outcomes weakens and bearish positioning becomes more dominant.) | Label: Bullish | Score: 0.880
18-Signal Technical Confluence Score: 0.500 (Bullish)
Overall Technical Score (18-signal confluence + DRL rank blend): 0.614 (Bullish)
Note: The blended score reflects signal strength weighted against broader AI technical ranking, which may temporarily diverge.
Blended technical score breakdown: 0.614 (Bullish | Bull 12 / Bear 3 / Neutral 3)
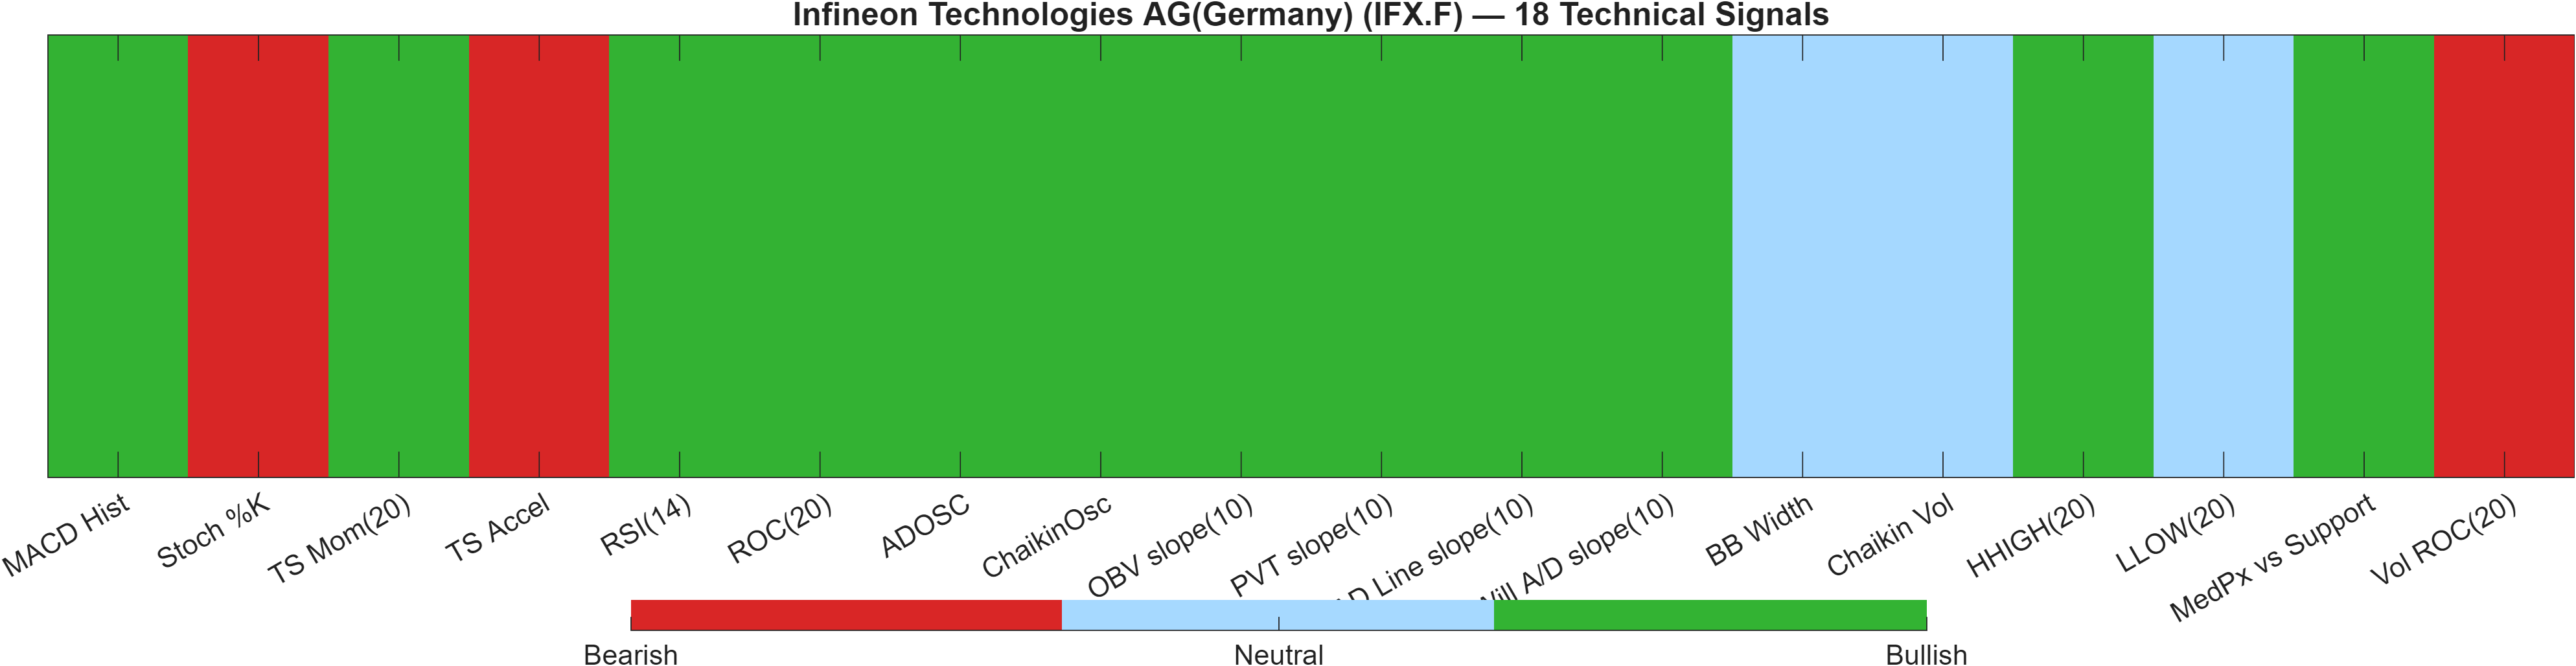
Signal-level alignment vs exhaustion risk
| Indicator | Value | Signal |
|---|---|---|
| MACD Hist | 0.05044 | Bullish |
| Stoch %K | 92.05 | Bearish |
| TS Mom(20) | 12.21 | Bullish |
| TS Accel | -0.26 | Bearish |
| RSI(14) | 68.15 | Bullish |
| ROC(20) | 21.45 | Bullish |
| ADOSC | 65.72 | Bullish |
| ChaikinOsc | 1.022e+05 | Bullish |
| OBV slope(10) | 7.428e+05 | Bullish |
| PVT slope(10) | 2.531e+04 | Bullish |
| AD Line slope(10) | 4.157e+05 | Bullish |
| Will A/D slope(10) | 15.56 | Bullish |
| BB Width | 0.2427 | Neutral |
| Chaikin Vol | -5.26 | Neutral |
| HHIGH(20) | 69.91 | Bullish |
| LLOW(20) | 55.91 | Neutral |
| MedPx vs Support | 31.38 | Bullish |
| Vol ROC(20) | -81.76 | Bearish |
Interpretation: Indicator-level signals form the base confluence, which is then adjusted using a separate AI-driven technical ranking model. The final technical score summarizes this combined view.
The technical dashboard is best read as a net-bullish majority with specific stress points. The blended outcome is 0.614 (Bullish), supported by 12 bullish signals against 3 bearish and 3 neutral. Separately, the DRL model reinforces that posture with a #85 technical rank and score 0.880, placing IFX.F in the top decile for technical positioning within the 1416-instrument universe.
Where does the “consolidation” stance enter? The bearish flags are not random—they cluster in areas that can appear near the mature part of a swing. For example, Stoch %K at 92.05 is tagged bearish, consistent with an overbought oscillator condition that can precede sideways digestion. TS Accel is also bearish at -0.26, implying the rate of improvement may be decelerating even while price remains supported by trend measures. Finally, volume dynamics show a bearish Vol ROC(20) of -81.76, a potential sign that recent price progress is not being matched by expanding participation.
Against those, the breadth of positive “internal” indicators is notable. RSI(14) is bullish at 68.15, MACD histogram is bullish, and multiple accumulation/volume-derived slopes (e.g., ADOSC at 65.72) are bullish—suggesting the tape has not broadly rolled over, even if volume acceleration is uneven.
The clean synthesis: the dashboard supports a Bullish technical regime, but the mix of overheated oscillators and weak volume rate-of-change is consistent with a market that may require consolidation or a confirmed breakout before the trend can re-accelerate.
6) News sentiment + extractive gist
Sentiment score (avg): 0.147 | Positive: 50% | Neutral: 50% | Negative: 0%
KGNAI AI News Sentiment Score (normalized -1 to +1): 0.96 (as of 2026-05-08) | Label: Bullish | Overall news score: 0.88
Positive Developments
Recent coverage across major financial outlets indicates a generally constructive narrative backdrop for Infineon, aligning with the model’s bullish news label. The sentiment profile shows an average score of 0.147 with 50% of items classified positive and 0% negative in the provided mix, while the normalized AI news score is 0.96 (as of 2026-05-08). The dominant themes are business momentum and strategic positioning in applied connectivity and edge AI use-cases, which may help explain why technical confluence is strong even as the longer-horizon rank set remains neutral. In this context, favorable sentiment is best treated as a tailwind that can support risk appetite at key levels, rather than as a standalone driver; confirmation still comes through price structure and volume behavior around resistance.
Neutral / Mixed Developments
The neutral component (also 50%) suggests a meaningful portion of coverage is interpretive rather than directional—highlighting valuation framing, “soft” elements within results narratives, and execution questions alongside market momentum. This mix is consistent with the report’s overall posture: trend and indicator alignment are constructive, but the cross-horizon ranking picture is not fully synchronized (daily #211 versus yearly #1040). In practice, that sort of media balance often accompanies consolidations, where investors debate whether recent strength is durable enough to shift the longer-term regime. With the overall news score at 0.88, neutrality here appears to reflect qualification rather than deterioration.
Negative / Risk Signals
While the provided distribution shows 0% negative items, the risk content embedded in the mixed coverage is still relevant for market structure. A frequent risk pattern in such setups is that strong price action can run ahead of participation or durable repricing—especially when the technical state includes potential “late swing” features (e.g., Stoch %K at 92.05 flagged bearish and volume rate-of-change at -81.76 flagged bearish). For IFX.F, the practical risk is less about a single headline shock (not evidenced in the provided data) and more about confirmation failure: a push toward resistance that lacks volume follow-through, or a loss of structural support. In that case, sentiment tailwinds can fade quickly as the market shifts from narrative to tape-driven validation.
- What to monitor next: Interaction with 66.9150 and whether a breakout shows volume confirmation.
- What to monitor next: Any improvement in longer-horizon ranks (weekly/monthly) that would reduce the daily-vs-yearly gap.
- What to monitor next: Whether volatility expands from bandwidth 0.2427 while momentum remains constructive (MACD hist 0.0504).
Snapshot: AI Rank (Short–Mid–Long): Neutral (Neutral–Neutral–Neutral) · Technical Confluence: Bullish · Key Levels: Support ~37.56 | Resistance ~66.91 · News Sentiment: Neutral
Sources referenced: Reuters, Bloomberg, Yahoo Finance, MarketWatch, Investing.com
7) Sources
Not available in the provided data.
You may also like: How KGNAI AI ranks instruments across global markets
Disclaimer: KGNAI provides AI-generated analytics and educational market commentary only. This is not financial advice. Markets involve risk. Always do your own research.